Tester av Intel Core i7-1165G7 processor
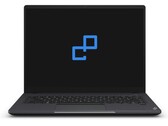
Recension av Lenovo V17 G2: 17-tums bärbar dator med otacksam MX350
Med sin 17-tumsskärm, Nvidia-grafik och Intels Core i7-processor är Lenovos V17 G2 väl lämpad för kontors- och multimedieuppgifter, inklusive enkla spel. Vår recension visar om den extra premien för topputrustningen är värd att betala för den annars prisvärda bärbara datorn.
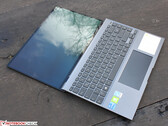
Intel Core i7-1165G7, NVIDIA GeForce MX350, 17.3", 2.2 kgRecension av PrimeBook Circular: Modulär NUC-baserad 14-tumslaptop
Prime Computer erbjuder en intressant bärbar dator i form av PrimeBook Circular, som har en modulär design med målet att vara riktigt hållbar. I den här detaljerade recensionen får du reda på hur väl den egenutvecklade modellen, baserad på Intels NUC Compute Element, presterar under testning.
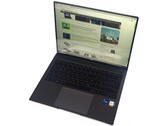
Intel Core i7-1165G7, Iris Xe G7 96EUs, 13.9", 1.6 kgRecension av Asus ZenBook 14X OLED: Spel och starka 3K-färger
Asus har gjort det lilla extra: Den här 14-tummaren kombinerar den enkelt justerbara grafikprestandan hos en MX450 med en skalbar Tiger Lake Core i7. Dessutom har den en färgstark 3K OLED-bildskärm i bredformat. Lämnar detta något att önska?
Intel Core i7-1165G7, NVIDIA GeForce MX450, 14", 1.4 kgRecension av Huawei MateBook 14 (2021) - MacBook Air med touch?
Med MateBook 14 2021 erbjuder Huawei en ultrabook från mittenskiktet av mycket hög kvalitet med en pekskärm i 3:2-format. Vårt test visar hur den står sig mot sina konkurrenter, inklusive MacBook Air M1, och om en AMD- eller Intel-processor inuti höljet gör jobbet bättre.
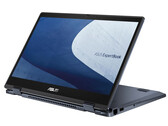
Intel Core i7-1165G7, Iris Xe G7 96EUs, 14", 1.5 kgRecension av Asus ExpertBook B3 Flip - 2-i-1-laptop med digital stylus och LTE-modem
ExpertBook B3 har ett LTE-modem och två Thunderbolt 4-portar i en 14-tums formfaktor som också inkluderar en FHD IPS-skärm. Pekskärmen kan användas med den medföljande inmatningspennan. Den senare kan stuvas undan i basenheten.
Intel Core i7-1165G7, Iris Xe G7 96EUs, 14", 1.6 kgLG Gram 15Z90P-G.AA89G: Intel Iris Xe Graphics G7 96EUs, 15.60", 1.1 kg
Test » Recension av LG Gram 15Z90P: 15-tums laptop på 1,1 kg
Samsung Galaxy Book Pro 15 NP950XDB-KC5US: Intel Iris Xe Graphics G7 96EUs, 15.60", 1.1 kg
Test » Recension av Samsung Galaxy Book Pro 15 NP950XDB - Galet låg vikt
Acer Swift 3X SF314-510G-70DW: Intel Iris Xe MAX Graphics, 14.00", 1.4 kg
Test » Recension av Acer Swift 3X: Intel Iris Xe MAX kombinerar lång batteritid och hög spelprestanda
Dell Inspiron 14 5410-D3D7T: Intel Iris Xe Graphics G7 96EUs, 14.00", 1.5 kg
Test » Test: Dell Inspiron 14 5410 2-i-1: Modulär omvandlingsbar med billig prestanda
Acer Enduro Urban N3 EUN314: Intel Iris Xe Graphics G7 96EUs, 14.00", 1.8 kg
Test » Recension av den bärbara datorn Acer Enduro Urban N3 EUN314: Delvis robust, delvis Ultrabook
Dell Inspiron 13 7306-6TYH5: Intel Iris Xe Graphics G7 96EUs, 13.30", 1.4 kg
Test » Recension av Dell Inspiron 13 7306: Kompakt omvandlingsbar för målning och kreativa uppgifter
Asus Vivobook 15 K513EQ: NVIDIA GeForce MX350, 15.60", 1.6 kg
Test » Test: Recension av Asus Vivobook 15 K513EQ OLED: Alternativ till Lenovo IdeaPad
Dynabook Portégé X30W-J-10K: Intel Iris Xe Graphics G7 96EUs, 13.30", 1 kg
Test » Dynabook Portégé X30W-J-10K laptop i recension - En lättviktare med många olika portar
Asus Zenbook 14X UX5400E: NVIDIA GeForce MX450, 14.00", 1.4 kg
Test » Förhandsgranskning: Asus Zenbook 14X OLED - Det där är starka färger!
Framework Laptop 13.5: Intel Iris Xe Graphics G7 96EUs, 13.50", 1.3 kg
Test » Test: Framework Laptop 13.5 - Om Microsoft skulle tillverka en reparerbar Surface Laptop skulle den se ut så här (Sammanfattning)
ADATA XPG Xenia 14: Intel Iris Xe Graphics G7 96EUs, 14.00", 1 kg
Test » Test: ADATA XPG Xenia 14 - En ny 14-tumsfavorit (Sammanfattning)
Lenovo ThinkPad X13 G2 20WK0024GE: Intel Iris Xe Graphics G7 96EUs, 13.30", 1.3 kg
Test » Test: Lenovo ThinkPad X13 G2 - Den perfekta mobila kollegan? (Sammanfattning)
Lenovo ThinkPad T14s G2 20WM003TGE: Intel Iris Xe Graphics G7 96EUs, 14.00", 1.3 kg
Test » Test: Lenovo ThinkPad T14s G2 Intel - En riktigt bra kontorslaptop trots 16:9-format (Sammanfattning)
Lenovo ThinkPad X1 Carbon G9-20XWCTO1WW: Intel Iris Xe Graphics G7 96EUs, 14.00", 1.2 kg
Test » Test: Lenovo ThinkPad X1 Carbon Gen 9 - Stor 16:10-uppgradering med Intel Tiger Lake (Sammanfattning)
Huawei MateBook X Pro 2021: Intel Iris Xe Graphics G7 96EUs, 13.90", 1.3 kg
Test » Test: Huawei MateBook X Pro 2021 - Levereras nu över hela världen (Sammanfattning)
Aorus Gaming Box GeForce RTX 2080 Ti: , 3.8 kg
Test » Aorus Gaming Box GeForce RTX 2080 Ti förvandlade vår lilla Intel NUC till ett 4K-kraftpaket (Sammanfattning)
Asus Zenbook 14 UX435EG: NVIDIA GeForce MX450, 14.00", 1.3 kg
Test » Test: Asus ZenBook 14 UX435EG - Kompakt och mobil multimedia allt-i-allo, men den tryckkänsliga skärmen är onödig (Sammanfattning)
Dell Inspiron 15 7000 7506 2-in-1 Black Edition: Intel Iris Xe MAX Graphics, 15.60", 1.9 kg
Test » Test: Dell Inspiron 15 7000 7506 2-in-1 Black Edition vs. Silver Edition - Vad är skillnaden? (Sammanfattning)
Asus VivoBook S15 S533EQ-BQ002T: NVIDIA GeForce MX350, 15.60", 1.8 kg
Test » Test: Asus VivoBook S15 S533EQ - Elegant allt-i-allo med svag hårdvara (Sammanfattning)
HP Spectre x360 14t-ea000: Intel Iris Xe Graphics G7 96EUs, 13.50", 1.3 kg
Test » Test: HP Spectre x360 14 - En omedelbar favorit (Sammanfattning)
Razer Book 13 FHD: Intel Iris Xe Graphics G7 96EUs, 13.40", 1.4 kg
Test » Test: Razer Book 13 Core i7 - Som en XPS 13, fast snabbare (Sammanfattning)
HP Pavilion 13-bb0015cl: Intel Iris Xe Graphics G7 96EUs, 13.30", 1.2 kg
Test » Test: 2020 HP Pavilion 13 - Den är faktiskt riktigt bra (Sammanfattning)
Schenker Vision 15: Intel Iris Xe Graphics G7 96EUs, 15.60", 1.7 kg
Test » Test: Schenker Vision 15 (Intel NUC M15) : Intels svar på XPS 15 och MacBook Pro? (Sammanfattning)
Acer SF514-55T: Intel Iris Xe Graphics G7 96EUs, 14.00", 1 kg
Test » Förhandsvisning: Acer Swift 5 - Tiger Lake iGPU anfaller instegs-GeForce (Sammanfattning)
Asus ZenBook 14 UX425EA: Intel Iris Xe Graphics G7 96EUs, 14.00", 1.2 kg
Test » Test: Asus ZenBook 14 UX425E - Debut för 11:e generationens i7 "Tiger Lake" (Sammanfattning)
Dell Inspiron 15 3501: Intel Iris Xe Graphics G7 96EUs, 15.60", 2 kg
Externt test » Dell Inspiron 15 3501
Dell Latitude 13 7330 Rugged Extreme, i7-1165G7: Intel Iris Xe Graphics G7 96EUs, 13.30", 2.7 kg
Externt test » Dell Latitude 13 7330 Rugged Extreme, i7-1165G7
Asus VivoBook 15 F1500EA, i7-1165G7: Intel Iris Xe Graphics G7 96EUs, 15.60", 1.8 kg
Externt test » Asus VivoBook 15 F1500EA, i7-1165G7
Acer Aspire 3 A315-58, i7-1165G7: Intel Iris Xe Graphics G7 96EUs, 15.60", 1.7 kg
Externt test » Acer Aspire 3 A315-58, i7-1165G7
Acer TravelMate Spin P6 TMP614RN-52: Intel Iris Xe Graphics G7 96EUs, 14.00", 1 kg
Externt test » Acer TravelMate Spin P6 TMP614RN-52
Asus ExpertBook P1412: Intel Iris Xe Graphics G7 96EUs, 14.00", 1.5 kg
Externt test » Asus ExpertBook P1412
ADATA XPG Xenia 14: Intel Iris Xe Graphics G7 96EUs, 14.00", 1 kg
Externt test » ADATA XPG Xenia 14
Dell Inspiron 14 5410-D3D7T: Intel Iris Xe Graphics G7 96EUs, 14.00", 1.5 kg
Externt test » Dell Inspiron 14 5410-D3D7T
Asus Vivobook 14 F1400EA-EB1594W: Intel Iris Xe Graphics G7 96EUs, 14.00", 1.6 kg
Externt test » Asus Vivobook 14 F1400EA-EB1594W
Asus ZenBook Flip S UX371EA-HL753W: Intel Iris Xe Graphics G7 96EUs, 13.30", 1.2 kg
Externt test » Asus ZenBook Flip S UX371EA-HL753W
HP Pavilion 15-eg2025nr: Intel Iris Xe Graphics G7 96EUs, 15.60", 1.8 kg
Externt test » HP Pavilion 15-eg2025nr
Samsung Galaxy Book Pro 15 NP950XDB-KC5US: Intel Iris Xe Graphics G7 96EUs, 15.60", 1.1 kg
Externt test » Samsung Galaxy Book Pro 15 NP950XDB-KC5US
HP Envy 13-ba1006ns: Intel Iris Xe Graphics G7 96EUs, 13.30", 1.3 kg
Externt test » HP Envy 13-ba1006ns
Lenovo IdeaPad 3 15ITL6-82H8015MMH: Intel Iris Xe Graphics G7 96EUs, 15.60", 1.7 kg
Externt test » Lenovo IdeaPad 3 15ITL6-82H8015MMH
Acer Aspire 5 A515-56-758V: Intel Iris Xe Graphics G7 96EUs, 15.60", 1.7 kg
Externt test » Acer Aspire 5 A515-56-758V
Asus VivoBook 15 K513EA-L12236: Intel Iris Xe Graphics G7 96EUs, 15.60", 1.8 kg
Externt test » Asus VivoBook 15 K513EA-L12236
Asus Vivobook 15 F515EA-EJ1479W: Intel Iris Xe Graphics G7 96EUs, 15.60", 1.8 kg
Externt test » Asus Vivobook 15 F515EA-EJ1479W
HP Elitebook 840 G8 Aero 5Z619EA: Intel Iris Xe Graphics G7 96EUs, 14.00", 1.3 kg
Externt test » HP Elitebook 840 G8 Aero 5Z619EA
Dell Inspiron 15 3511, i7-1165G7: Intel Iris Xe Graphics G7 96EUs, 15.60", 1.7 kg
Externt test » Dell Inspiron 15 3511, i7-1165G7
Acer Aspire 5 A515-56G-78TR: NVIDIA GeForce MX350, 15.60", 1.7 kg
Externt test » Acer Aspire 5 A515-56G-78TR
Dynabook Portégé X30L-J-190: Intel Iris Xe Graphics G7 96EUs, 13.30", 0.9 kg
Externt test » Dynabook Portégé X30L-J-190
Asus ZenBook Flip 14 UP5401EA-KU030T: Intel Iris Xe Graphics G7 96EUs, 14.00", 1.4 kg
Externt test » Asus ZenBook Flip 14 UP5401EA-KU030T
Lenovo V17 G2 ITL-82NX00EUGE: NVIDIA GeForce MX350, 17.30", 2.2 kg
Externt test » Lenovo V17 G2 ITL-82NX00EUGE
Asus ZenBook Flip 13 UX363EA-AH74T: Intel Iris Xe Graphics G7 96EUs, 13.30", 1.3 kg
Externt test » Asus ZenBook Flip 13 UX363EA-AH74T
Lenovo Yoga Duet 7 13ITL6-82MA000RGE: Intel Iris Xe Graphics G7 96EUs, 13.00", 0.8 kg
Externt test » Lenovo Yoga Duet 7 13ITL6-82MA000RGE
Prime Computer PrimeBook Circular-i7-1165G7: Intel Iris Xe Graphics G7 96EUs, 13.90", 1.6 kg
Externt test » Prime Computer PrimeBook Circular-i7-1165G7
Acer Aspire 5 A514-54G-743J: NVIDIA GeForce MX350, 14.00", 1.7 kg
Externt test » Acer Aspire 5 A514-54G-743J
Asus VivoBook 14 F415EA-EB377T: Intel Iris Xe Graphics G7 96EUs, 14.00", 1.6 kg
Externt test » Asus VivoBook 14 F415EA-EB377T
Asus VivoBook 15 K513EA-L11141T: Intel Iris Xe Graphics G7 96EUs, 15.60", 1.8 kg
Externt test » Asus VivoBook 15 K513EA-L11141T
Acer Enduro Urban N3 EUN314-51W-70RF: Intel Iris Xe Graphics G7 96EUs, 14.00", 1.9 kg
Externt test » Acer Enduro Urban N3 EUN314-51W-70RF
MSI Modern 14 B11MOU-485XES: Intel Iris Xe Graphics G7 96EUs, 14.00", 1.3 kg
Externt test » MSI Modern 14 B11MOU-485XES
Durabook Z14I: Intel Iris Xe Graphics G7 96EUs, 14.00", 3.6 kg
Externt test » Durabook Z14I
MSI Modern 14 B11MO-074XES: Intel Iris Xe Graphics G7 96EUs, 14.00", 1.3 kg
Externt test » MSI Modern 14 B11MO-074XES
Asus ZenBook Flip 13 UX363EA-HP525T: Intel Iris Xe Graphics G7 96EUs, 15.60", 1.3 kg
Externt test » Asus ZenBook Flip 13 UX363EA-HP525T
Asus ExpertBook B1 B1500CEAE-BQ0067R: Intel Iris Xe Graphics G7 96EUs, 15.60", 1.7 kg
Externt test » Asus ExpertBook B1 B1500CEAE-BQ0067R
Dell Vostro 15 3510, i7-1165G7 MX350: NVIDIA GeForce MX350, 15.60", 1.7 kg
Externt test » Dell Vostro 15 3510, i7-1165G7 MX350
Dell XPS 13 9305-P42X4: Intel Iris Xe Graphics G7 96EUs, 13.30", 1.2 kg
Externt test » Dell XPS 13 9305-P42X4
Asus ExpertBook B9450CEA-XH75: Intel Iris Xe Graphics G7 96EUs, 14.00", 1 kg
Externt test » Asus ExpertBook B9450CEA-XH75
Asus ExpertBook B1 B1400CEAE-EB0116R: Intel Iris Xe Graphics G7 96EUs, 14.00", 1.5 kg
Externt test » Asus ExpertBook B1 B1400CEAE-EB0116R
VAIO SX14, i7-1165G7: Intel Iris Xe Graphics G7 96EUs, 14.00", 1.1 kg
Externt test » VAIO SX14, i7-1165G7
Asus VivoBook S14 S435EA-KC035T: Intel Iris Xe Graphics G7 96EUs, 14.00", 1.3 kg
Externt test » Asus VivoBook S14 S435EA-KC035T
Asus VivoBook 14 F415EA-EB378T: Intel Iris Xe Graphics G7 96EUs, 14.00", 1.6 kg
Externt test » Asus VivoBook 14 F415EA-EB378T
Asus VivoBook S14 S433EA-EB1150T: Intel Iris Xe Graphics G7 96EUs, 14.00", 1.4 kg
Externt test » Asus VivoBook S14 S433EA-EB1150T
Lenovo IdeaPad 5 Pro 14ITL6-82L3003NSP: Intel Iris Xe Graphics G7 96EUs, 14.00", 1.4 kg
Externt test » Lenovo IdeaPad 5 Pro 14ITL6-82L3003NSP
HP Spectre x360 14-ea0435no: Intel Iris Xe Graphics G7 96EUs, 13.50", 1.3 kg
Externt test » HP Spectre x360 14-ea0435no
Dell Precision 15 3560-HYFRK: NVIDIA T500 Laptop GPU, 15.60", 1.6 kg
Externt test » Dell Precision 15 3560-HYFRK
HP Envy 14-eb0021tx: NVIDIA GeForce GTX 1650 Ti Max-Q, 14.00", 1.5 kg
Externt test » HP Envy 14-eb0021tx
HP Envy x360 15-es0021ur: Intel Iris Xe Graphics G7 96EUs, 15.60", 1.8 kg
Externt test » HP Envy x360 15-es0021ur
Asus ZenBook 14 UX425EA-KI359T: Intel Iris Xe Graphics G7 96EUs, 14.00", 1.2 kg
Externt test » Asus ZenBook 14 UX425EA-KI359T
Asus ExpertBook B3 Flip B3402FEA: Intel Iris Xe Graphics G7 96EUs, 14.00", 1.6 kg
Externt test » Asus ExpertBook B3 Flip B3402FEA-EC0053R
HP Pavilion 15-eg0025nr: Intel Iris Xe Graphics G7 96EUs, 15.60", 1.8 kg
Externt test » HP Pavilion 15-eg0025nr
Dynabook Tecra A40-J-11J: Intel Iris Xe Graphics G7 96EUs, 14.00", 1.5 kg
Externt test » Dynabook Tecra A40-J-11J
HP Envy 13-ba1002ns: NVIDIA GeForce MX450, 13.30", 1.3 kg
Externt test » HP Envy 13-ba1002ns
Asus ZenBook Flip 13 UX363EA-HP043T: Intel Iris Xe Graphics G7 96EUs, 13.30", 1.3 kg
Externt test » Asus ZenBook Flip 13 UX363EA-HP043T
MSI Modern 15 A11M-045XES: Intel Iris Xe Graphics G7 96EUs, 15.60", 1.6 kg
Externt test » MSI Modern 15 A11M-045XES
Dynabook Tecra A50-J-13W: Intel Iris Xe Graphics G7 96EUs, 15.60", 1.6 kg
Externt test » Dynabook Tecra A50-J-13W
Lenovo IdeaPad 5 14ITL05-82FE005PGE: Intel Iris Xe Graphics G7 96EUs, 14.00", 1.4 kg
Externt test » Lenovo IdeaPad 5 14ITL05-82FE005PGE
LG UltraPC 15U70P-P.AAS8U1: NVIDIA GeForce GTX 1650 Ti Mobile, 15.60", 1.9 kg
Externt test » LG UltraPC 15U70P-P.AAS8U1
Acer Enduro Urban N3 EUN314-51WG-74PB: NVIDIA GeForce MX330, 14.00", 1.9 kg
Externt test » Acer Enduro Urban N3 EUN314-51WG-74PB
Intel NUC M15 Kit LAPBC710: Intel Iris Xe Graphics G7 96EUs, 15.60", 1.7 kg
Externt test » Intel NUC M15 Kit LAPBC710
Asus Vivobook 15 K513EQ: NVIDIA GeForce MX350, 15.60", 1.6 kg
Externt test » Asus Vivobook 15 K513EQ
Razer Blade Stealth 13 2021 OLED: NVIDIA GeForce GTX 1650 Ti Max-Q, 13.30", 1.5 kg
Externt test » Razer Blade Stealth 13 2021 OLED
Dell Vostro 14 3401, i7-1165G7: NVIDIA GeForce MX330, 14.00", 1.6 kg
Externt test » Dell Vostro 14 3401, i7-1165G7
Acer Aspire 5 A515-56-73AP: Intel Iris Xe Graphics G7 96EUs, 15.60", 1.7 kg
Externt test » Acer Aspire 5 A515-56-73AP
Asus ExpertBook B5 Flip B5302FEA-LG0400R: Intel Iris Xe Graphics G7 96EUs, 13.30", 1.3 kg
Externt test » Asus ExpertBook B5 Flip B5302FEA-LG0400R
HP Pavilion x360 14-dy0028ns: Intel Iris Xe Graphics G7 96EUs, 14.00", 1.6 kg
Externt test » HP Pavilion x360 14-dy0028ns
HP Pavilion x360 14-dy0034ns: Intel Iris Xe Graphics G7 96EUs, 14.00", 1.6 kg
Externt test » HP Pavilion x360 14-dy0034ns
Lenovo Yoga Slim 7 14ITL05-82A30024GE: Intel Iris Xe Graphics G7 96EUs, 14.00", 1.4 kg
Externt test » Lenovo Yoga Slim 7 14ITL05-82A30024GE
Asus Zenbook 14X UX5401EA-KN144T: Intel Iris Xe Graphics G7 96EUs, 14.00", 1.4 kg
Externt test » Asus Zenbook 14X UX5401EA-KN144T
HP 15s-fq2089ns: Intel Iris Xe Graphics G7 96EUs, 15.60", 1.7 kg
Externt test » HP 15s-fq2089ns
HP Envy x360 13-bd0350nd: Intel Iris Xe Graphics G7 96EUs, 13.30", 1.3 kg
Externt test » HP Envy x360 13-bd0350nd
Dynabook Portégé X30W-J-10K: Intel Iris Xe Graphics G7 96EUs, 13.30", 1 kg
Externt test » Dynabook Portégé X30W-J-10K
LG Gram 16 2-in-1 16T90P: Intel Iris Xe Graphics G7 96EUs, 16.00", 1.5 kg
Externt test » LG Gram 16 2-in-1 16T90P
Lenovo ThinkPad P15s G2-20W6005EGE: NVIDIA T500 Laptop GPU, 15.60", 1.8 kg
Externt test » Lenovo ThinkPad P15s G2-20W6005EGE
Dynabook Portégé X30L-J-13R: Intel Iris Xe Graphics G7 96EUs, 13.30", 0.9 kg
Externt test » Dynabook Portégé X30L-J-13R
Asus Expertbook B5 B5302C, i7-1165G7: Intel Iris Xe Graphics G7 96EUs, 13.30", 1.1 kg
Externt test » Asus Expertbook B5 B5302C, i7-1165G7
Dynabook Portégé X30L-J-13P: Intel Iris Xe Graphics G7 96EUs, 13.30", 0.9 kg
Externt test » Dynabook Portégé X30L-J-13P
HP Pavilion 15-eg0018ns: Intel Iris Xe Graphics G7 96EUs, 15.60", 1.8 kg
Externt test » HP Pavilion 15-eg0018ns
HP Pavilion x360 14-dw1023ns: Intel Iris Xe Graphics G7 96EUs, 14.00", 1.6 kg
Externt test » HP Pavilion x360 14-dw1023ns
Asus Zenbook 14X UX5400E: NVIDIA GeForce MX450, 14.00", 1.4 kg
Externt test » Asus Zenbook 14X UX5400E
Samsung Galaxy Book 15, i7-1165G7: Intel Iris Xe Graphics G7 96EUs, 15.60", 1.6 kg
Externt test » Samsung Galaxy Book 15, i7-1165G7
Lenovo ThinkPad X1 Yoga G6-20XY002PUS: Intel Iris Xe Graphics G7 96EUs, 14.00", 1.4 kg
Externt test » Lenovo ThinkPad X1 Yoga G6-20XY002PUS
Fujitsu UH-X, i7: Intel Iris Xe Graphics G7 96EUs, 13.30", 0.7 kg
Externt test » Fujitsu UH-X, i7
Asus ExpertBook B1 B1400C, 1165G7 MX330: NVIDIA GeForce MX330, 14.00", 1.5 kg
Externt test » Asus ExpertBook B1 B1400C, 1165G7 MX330
HP 15s-fq2088ns: Intel Iris Xe Graphics G7 96EUs, 15.60", 1.7 kg
Externt test » HP 15s-fq2088ns
HP 15s-fq2010ns: Intel Iris Xe Graphics G7 96EUs, 15.60", 1.7 kg
Externt test » HP 15s-fq2010ns
Asus Chromebook CX9400, i7-1165G7: Intel Iris Xe Graphics G7 96EUs, 14.00", 1.1 kg
Externt test » Asus Chromebook CX9400, i7-1165G7
HP Pavilion 15-eg0019ns: Intel Iris Xe Graphics G7 96EUs, 15.60", 1.8 kg
Externt test » HP Pavilion 15-eg0019ns
HP Envy 13-ba1012ns: NVIDIA GeForce MX450, 13.30", 1.3 kg
Externt test » HP Envy 13-ba1012ns
Lenovo IdeaPad Flex 5 14ITL05-82HS003QGE: Intel Iris Xe Graphics G7 96EUs, 14.00", 1.5 kg
Externt test » Lenovo IdeaPad Flex 5 14ITL05-82HS003QGE
Asus ExpertBook B9 B9400CE-KC0166R: Intel Iris Xe Graphics G7 96EUs, 14.00", 1 kg
Externt test » Asus ExpertBook B9 B9400CE-KC0166R
HP Pavilion 15-eg0504TU: Intel Iris Xe Graphics G7 96EUs, 15.60", 1.8 kg
Externt test » HP Pavilion 15-eg0504TU
Lenovo ThinkPad X1 Carbon G9-20XW005JGE: Intel Iris Xe Graphics G7 96EUs, 14.00", 1.1 kg
Externt test » Lenovo ThinkPad X1 Carbon G9-20XW005JGE
Dell XPS 13 9310 2-in-1: Intel Iris Xe Graphics G7 96EUs, 13.40", 1.3 kg
Externt test » Dell XPS 13 9310 2-in-1
Dell Latitude 15 7520, i7-1165G7: Intel Iris Xe Graphics G7 96EUs, 15.60", 1.8 kg
Externt test » Dell Latitude 15 7520, i7-1165G7
Lenovo ThinkPad T15 G2, i7-1165G7 iGPU: Intel Iris Xe Graphics G7 96EUs, 15.60", 1.8 kg
Externt test » Lenovo ThinkPad T15 G2, i7-1165G7 iGPU
HP ZBook Firefly 14 G8 2C9Q2EA: NVIDIA T500 Laptop GPU, 14.00", 1.4 kg
Externt test » HP ZBook Firefly 14 G8 2C9Q2EA
HP Pavilion 15-eg0006ns: NVIDIA GeForce MX450, 15.60", 1.8 kg
Externt test » HP Pavilion 15-eg0006ns
Asus VivoBook S14 S433EA-AM613T: Intel Iris Xe Graphics G7 96EUs, 14.00", 1.4 kg
Externt test » Asus VivoBook S14 S433EA-AM613T
HP Spectre x360 14-ea0059nw: Intel Iris Xe Graphics G7 96EUs, 13.50", 1.3 kg
Externt test » HP Spectre x360 14-ea0059nw
HP Envy x360 15-es0570nd: Intel Iris Xe Graphics G7 96EUs, 15.60", 1.8 kg
Externt test » HP Envy x360 15-es0570nd
LG Gram 16 (2021): Intel Iris Xe Graphics G7 96EUs, 16.00", 1.2 kg
Externt test » LG Gram 16 (2021)
Lenovo IdeaPad 3 15ITL6-82H800BHSP: Intel Iris Xe Graphics G7 96EUs, 15.60", 1.7 kg
Externt test » Lenovo IdeaPad 3 15ITL6-82H800BHSP
HP Pavilion 15-eg0007ns: NVIDIA GeForce MX450, 15.60", 1.8 kg
Externt test » HP Pavilion 15-eg0007ns
HP Envy 17-ch0000ns: NVIDIA GeForce MX450, 17.30", 2.5 kg
Externt test » HP Envy 17-ch0000ns
HP Pavilion x360 14-dw1003ns: Intel Iris Xe Graphics G7 96EUs, 14.00", 1.6 kg
Externt test » HP Pavilion x360 14-dw1003ns
HP Envy 14-eb0037no: Intel Iris Xe Graphics G7 96EUs, 14.00", 1.5 kg
Externt test » HP Envy 14-eb0037no
Getac S410, i7-1165G7: Intel Iris Xe Graphics G7 96EUs, 14.00", 2.4 kg
Externt test » Getac S410, i7-1165G7
Acer TravelMate P4 TMP414-51-75L8: Intel Iris Xe Graphics G7 96EUs, 14.00", 1.4 kg
Externt test » Acer TravelMate P4 TMP414-51-75L8
Asus Vivobook 14 K413EA-EB608T: Intel Iris Xe Graphics G7 96EUs, 14.00", 1.4 kg
Externt test » Asus Vivobook 14 K413EA-EB608T
HP 15s-fq2039ns: Intel Iris Xe Graphics G7 96EUs, 15.60", 1.7 kg
Externt test » HP 15s-fq2039ns
Asus ExpertBook B1 B1500C, i7-1165G7 MX330: NVIDIA GeForce MX330, 15.60", 1.7 kg
Externt test » Asus ExpertBook B1500C, i7-1165G7 MX330
Lenovo ThinkPad X1 Yoga G6-20Y0S00200: Intel Iris Xe Graphics G7 96EUs, 14.00", 1.4 kg
Externt test » Lenovo ThinkPad X1 Yoga G6-20Y0S00200
Durabook S14I: Intel Iris Xe Graphics G7 96EUs, 14.00", 3 kg
Externt test » Durabook S14I
Hyperbook NV4, i7-1165G7 GTX 1650 Ti: NVIDIA GeForce GTX 1650 Ti Mobile, 14.00", 1.4 kg
Externt test » Hyperbook NV4, i7-1165G7 GTX 1650 Ti
Acer Swift 3X SF314-510G-73NT: Intel Iris Xe Graphics G7 96EUs, 14.00", 1.4 kg
Externt test » Acer Swift 3X SF314-510G-73NT
Huawei MateBook D 15 2021, i7-1165G7: Intel Iris Xe Graphics G7 96EUs, 15.60", 1.6 kg
Externt test » Huawei MateBook D 15 2021, i7-1165G7
HP Envy x360 13-bd0032nr: Intel Iris Xe Graphics G7 96EUs, 13.30", 1.3 kg
Externt test » HP Envy x360 13-bd0032nr
HP EliteBook 850 G8 3C7Z8EA: Intel Iris Xe Graphics G7 96EUs, 15.60", 1.8 kg
Externt test » HP EliteBook 850 G8 3C7Z8EA
HP EliteBook 830 G8-i7-1165G7: Intel Iris Xe Graphics G7 96EUs, 13.30", 1.3 kg
Externt test » HP EliteBook 830 G8-i7-1165G7
HP Envy 14-eb0003ns: NVIDIA GeForce GTX 1650 Ti Max-Q, 14.00", 1.5 kg
Externt test » HP Envy 14-eb0003ns
Lenovo ThinkPad X1 Carbon G9-20XWCTO1WW: Intel Iris Xe Graphics G7 96EUs, 14.00", 1.2 kg
Externt test » Lenovo ThinkPad X1 Carbon G9-20XWCTO1WW
Dynabook Portégé X40-J-11C: Intel Iris Xe Graphics G7 96EUs, 14.00", 1.4 kg
Externt test » Dynabook Portégé X40-J-11C
Acer TravelMate P614P-52: Intel Iris Xe Graphics G7 96EUs, 14.00", 1 kg
Externt test » Acer TravelMate P614P-52
Dell Latitude 14 5420, i7-1165G7: Intel Iris Xe Graphics G7 96EUs, 14.00", 1.4 kg
Externt test » Dell Latitude 14 5420, i7-1165G7
HP EliteBook x360 1030 G8, i7-1165G7: Intel Iris Xe Graphics G7 96EUs, 13.30", 1.2 kg
Externt test » HP EliteBook x360 1030 G8, i7-1165G7
HP EliteBook x360 1040 G8, i7-1165G7: Intel Iris Xe Graphics G7 96EUs, 14.00", 1.3 kg
Externt test » HP EliteBook x360 1040 G8, i7-1165G7
Samsung Galaxy Book Pro 13 NP930XDB-KD1US: Intel Iris Xe Graphics G7 96EUs, 13.30", 0.9 kg
Externt test » Samsung Galaxy Book Pro 13 NP930XDB-KD1US
Huawei MateBook 14 2021, i7-1165G7: Intel Iris Xe Graphics G7 96EUs, 14.00", 1.5 kg
Externt test » Huawei MateBook 14 2021, i7-1165G7
Acer Swift 3 SF314-59-71YQ: Intel Iris Xe Graphics G7 96EUs, 14.00", 1.2 kg
Externt test » Acer Swift 3 SF314-59-71YQ
HP Pavilion 15-eg: NVIDIA GeForce MX450, 15.60", 1.7 kg
Externt test » HP Pavilion 15-eg0025cl
HP Pavilion 15-eg0021nr: Intel Iris Xe Graphics G7 96EUs, 15.60", 1.8 kg
Externt test » HP Pavilion 15-eg0021nr
HP Pavilion x360 14-dw1004ns: Intel Iris Xe Graphics G7 96EUs, 14.00", 1.6 kg
Externt test » HP Pavilion x360 14-dw1004ns
HP Elite Dragonfly G2, i7-1165G7: Intel Iris Xe Graphics G7 96EUs, 13.30", 1 kg
Externt test » HP Elite Dragonfly G2, i7-1165G7
Asus Chromebook Flip CX5 CX5500FEA: Intel Iris Xe Graphics G7 96EUs, 15.60", 2 kg
Externt test » Asus Chromebook Flip CX5 CX5500FEA-E60050
Dynabook Portégé X30W-J-10C: Intel Iris Xe Graphics G7 96EUs, 13.30", 1 kg
Externt test » Dynabook Portégé X30W-J-10C
Asus ZenBook 13 UX325EA-KG245T: Intel Iris Xe Graphics G7 96EUs, 13.30", 1.2 kg
Externt test » Asus ZenBook 13 UX325EA-KG245T
MSI Modern 14 B11SB-008ES: NVIDIA GeForce MX450, 14.00", 1.3 kg
Externt test » MSI Modern 14 B11SB-008ES
HP 15s-fq2042ns: Intel Iris Xe Graphics G7 96EUs, 15.60", 1.7 kg
Externt test » HP 15s-fq2042ns
Asus Vivobook 15 K513EP-EJ104T: NVIDIA GeForce MX330, 15.60", 1.8 kg
Externt test » Asus Vivobook 15 K513EP-EJ104T
HP Envy 14-eb0490nd: Intel Iris Xe Graphics G7 96EUs, 14.00", 1.5 kg
Externt test » HP Envy 14-eb0490nd
HP ProBook 440 G8-2W1G4EA: Intel Iris Xe Graphics G7 96EUs, 14.00", 1.4 kg
Externt test » HP ProBook 440 G8-2W1G4EA
Samsung Galaxy Book Pro 360 15 NP950QDB-KA1US: Intel Iris Xe Graphics G7 96EUs, 15.60", 1.4 kg
Externt test » Samsung Galaxy Book Pro 360 15 NP950QDB-KA1US
Samsung Galaxy Book Pro 15 NP950XDB-KA1US: Intel Iris Xe Graphics G7 96EUs, 15.60", 1.1 kg
Externt test » Samsung Galaxy Book Pro 15 NP950XDB-KA1US
Dell Latitude 13 7320 2-in-1, i7-1165G7: Intel Iris Xe Graphics G7 96EUs, 13.30", 1.4 kg
Externt test » Dell Latitude 13 7320 2-in-1, i7-1165G7
HP Pavilion 14-dv0058TU: Intel Iris Xe Graphics G7 96EUs, 14.00", 1.4 kg
Externt test » HP Pavilion 14-dv0058TU
Asus ZenBook 13 UX325EA: Intel Iris Xe Graphics G7 96EUs, 13.30", 1.2 kg
Externt test » Asus ZenBook 13 UX325EA
LG Gram 14Z90P-G.AA79G: Intel Iris Xe Graphics G7 96EUs, 14.00", 1 kg
Externt test » LG Gram 14Z90P-G.AA79G
MSI Modern 15 A11SB-011ES: NVIDIA GeForce MX450, 15.60", 1.6 kg
Externt test » MSI Modern 15 A11SB-011ES
HP 14s-dq2013ns: Intel Iris Xe Graphics G7 96EUs, 14.00", 1.5 kg
Externt test » HP 14s-dq2013ns
HP 14s-dq2005ns: Intel Iris Xe Graphics G7 96EUs, 14.00", 1.5 kg
Externt test » HP 14s-dq2005ns
HP Pavilion 13-bb0667ng: Intel Iris Xe Graphics G7 96EUs, 13.30", 1.2 kg
Externt test » HP Pavilion 13-bb0667ng
MSI Summit B15 A11M-057: Intel Iris Xe Graphics G7 96EUs, 15.60", 1.6 kg
Externt test » MSI Summit B15 A11M-057
Acer TravelMate P4 TMP414-51-74K7: Intel Iris Xe Graphics G7 96EUs, 14.00", 1.4 kg
Externt test » Acer TravelMate P4 TMP414-51-74K7
Asus VivoBook S14 S435EA-HM004T: Intel Iris Xe Graphics G7 96EUs, 14.00", 1.3 kg
Externt test » Asus VivoBook S14 S435EA-HM004T
Honor Magicbook 14 i7-1165G7: Intel Iris Xe Graphics G7 96EUs, 14.00", 1.4 kg
Externt test » Honor Magicbook 14 i7-1165G7
Lenovo ThinkPad X1 Carbon G9-20XXS00100: Intel Iris Xe Graphics G7 96EUs, 14.00", 1.2 kg
Externt test » Lenovo ThinkPad X1 Carbon G9-20XXS00100
Lenovo Yoga Slim 7i Carbon 13 ITL: Intel Iris Xe Graphics G7 96EUs, 13.30", 1 kg
Externt test » Lenovo Yoga Slim 7i Carbon 13 ITL
HP 15s-fq2011ns: Intel Iris Xe Graphics G7 96EUs, 15.60", 1.7 kg
Externt test » HP 15s-fq2011ns
HP Envy 17-cg1000ns: NVIDIA GeForce MX450, 17.30", 2.7 kg
Externt test » HP Envy 17-cg1000ns
Asus ZenBook Flip 13 UX363EA-HP165T: Intel Iris Xe Graphics G7 96EUs, 13.30", 1.3 kg
Externt test » Asus ZenBook Flip 13 UX363EA-HP165T
Asus VivoBook 15 K513EA-BQ684: Intel Iris Xe Graphics G7 96EUs, 15.60", 1.8 kg
Externt test » Asus VivoBook 15 K513EA-BQ684
Asus VivoBook Ultra 14 K413EQ-EK115T: NVIDIA GeForce MX350, 14.00"
Externt test » Asus VivoBook Ultra 14 K413EQ-EK115T
LG Gram 15Z95N-G.AA78B: Intel Iris Xe Graphics G7 96EUs, 15.60"
Externt test » LG Gram 15Z95N-G.AA78B
LG Gram 17Z95N-G.AA78B: Intel Iris Xe Graphics G7 96EUs, 17.00", 1.4 kg
Externt test » LG Gram 17Z95N-G.AA78B
Lenovo Yoga Slim 9 14ITL5-82D1002HGE: Intel Iris Xe Graphics G7 96EUs, 14.00", 1.2 kg
Externt test » Lenovo Yoga Slim 9 14ITL5-82D1002HGE
Xiaomi RedmiBook Pro 14 2021, i7-1165G7 MX450: NVIDIA GeForce MX450, 14.00", 1.5 kg
Externt test » Xiaomi RedmiBook Pro 14 2021, i7-1165G7 MX450
LG Gram 16Z90P-K.AAB6U1: Intel Iris Xe Graphics G7 96EUs, 16.00", 1.2 kg
Externt test » LG Gram 16Z90P-K.AAB6U1
HP Pavilion 13-bb0015cl: Intel Iris Xe Graphics G7 96EUs, 13.30", 1.2 kg
Externt test » HP Pavilion 13-bb0015cl
Lenovo ThinkBook 14s Yoga ITL 20WE0023GE: Intel Iris Xe Graphics G7 96EUs, 14.00", 1.5 kg
Externt test » Lenovo ThinkBook 14s Yoga ITL 20WE0023GE
HP Envy 14-eb0775ng: NVIDIA GeForce GTX 1650 Ti Max-Q, 14.00", 1.5 kg
Externt test » HP Envy 14-eb0775ng
Acer Swift 3X SF314-510G-70DW: Intel Iris Xe MAX Graphics, 14.00", 1.4 kg
Externt test » Acer Swift 3X SF314-510G-70DW
Acer Swift 5 SF514-55GT-72L0: NVIDIA GeForce MX350, 14.00", 1.1 kg
Externt test » Acer Swift 5 SF514-55GT-72L0
Samsung Galaxy Book Flex2 NP930QCA-KA2DE: Intel Iris Xe Graphics G7 96EUs, 13.30", 1.3 kg
Externt test » Samsung Galaxy Book Flex2 NP930QCA-KA2DE
Acer Swift 5 SF514-55T-70LG: Intel Iris Xe Graphics G7 96EUs, 14.00", 1.1 kg
Externt test » Acer Swift 5 SF514-55T-70LG
Razer Blade Stealth i7-1165G7 GTX 1650 Ti Max-Q: NVIDIA GeForce GTX 1650 Ti Max-Q, 13.30", 1.4 kg
Externt test » Razer Blade Stealth i7-1165G7 GTX 1650 Ti Max-Q
Lenovo Yoga 7 14ITL5, i7-1165G7: Intel Iris Xe Graphics G7 96EUs, 14.00", 1.4 kg
Externt test » Lenovo Yoga 7 14ITL5, i7-1165G7
LG Gram 17Z90P-K.AAB8U1: Intel Iris Xe Graphics G7 96EUs, 17.00", 1.4 kg
Externt test » LG Gram 17Z90P-K.AAB8U1
Lenovo ThinkBook 15 G2 ITL, i7-1165G7: Intel Iris Xe Graphics G7 96EUs, 15.60", 1.7 kg
Externt test » Lenovo ThinkBook 15 G2 ITL, i7-1165G7
HP Spectre x360 13-aw2002ng: Intel Iris Xe Graphics G7 96EUs, 13.30", 1.3 kg
Externt test » HP Spectre x360 13-aw2002ng
HP Spectre x360 14-ea0004ns: Intel Iris Xe Graphics G7 96EUs, 13.50", 1.4 kg
Externt test » HP Spectre x360 14-ea0004ns
HP Pavilion 14-dv0005ns: NVIDIA GeForce MX450, 14.00", 1.4 kg
Externt test » HP Pavilion 14-dv0005ns
Asus ZenBook 14 UX425EA-HM165T: Intel Iris Xe Graphics G7 96EUs, 14.00", 1.2 kg
Externt test » Asus ZenBook 14 UX425EA-HM165T
Acer Swift 3 Air 3 SF313-53-79G3: Intel Iris Xe Graphics G7 96EUs, 13.50", 1.2 kg
Externt test » Acer Swift 3 Air 3 SF313-53-79G3
Lenovo IdeaPad Slim 9i 14ITL5: Intel Iris Xe Graphics G7 96EUs, 14.00", 1.3 kg
Externt test » Lenovo IdeaPad Slim 9i 14ITL5
Huawei MateBook X Pro 2021: Intel Iris Xe Graphics G7 96EUs, 13.90", 1.3 kg
Externt test » Huawei MateBook X Pro 2021
Asus ZenBook 13 UX325EA-EG247: Intel Iris Xe Graphics G7 96EUs, 13.30", 1.1 kg
Externt test » Asus ZenBook 13 UX325EA-EG247
HP Spectre x360 13-aw2006ng: Intel Iris Xe Graphics G7 96EUs, 13.30", 1.3 kg
Externt test » HP Spectre x360 13-aw2006ng
HP Elite x2 G8: Intel Iris Xe Graphics G7 96EUs, 13.00"
Externt test » HP Elite x2 G8
Lenovo IdeaPad 5 14ITL05-82FE005QGE: NVIDIA GeForce MX450, 14.00"
Externt test » Lenovo IdeaPad 5 14ITL05-82FE005QGE
MSI Modern 14 B11SB-009XES: NVIDIA GeForce MX450, 14.00", 1.3 kg
Externt test » MSI Modern 14 B11SB-009XES
HP Spectre x360 13t-aw200: Intel Iris Xe Graphics G7 96EUs, 13.30", 1.3 kg
Externt test » HP Spectre x360 13t-aw200
Acer Swift 5 SF514-55T-71NL: Intel Iris Xe Graphics G7 96EUs, 14.00", 1.1 kg
Externt test » Acer Swift 5 SF514-55T-71NL
HP Envy 13-ba1033tx: NVIDIA GeForce MX450, 13.30", 1.3 kg
Externt test » HP Envy 13-ba1033tx
Acer Swift 5 SF514-55TA-7494: Intel Iris Xe Graphics G7 96EUs, 14.00", 1.1 kg
Externt test » Acer Swift 5 SF514-55TA-7494
HP Envy x360 15-ed1550nd: Intel Iris Xe Graphics G7 96EUs, 15.60", 1.9 kg
Externt test » HP Envy x360 15-ed1550nd
Dell Inspiron 13 7306 2-in-1, i7-1165G7: Intel Iris Xe Graphics G7 96EUs, 13.30", 1.4 kg
Externt test » Dell Inspiron 13 7306 2-in-1, i7-1165G7
HP Pavilion 14-dv0067tx: NVIDIA GeForce MX450, 14.00", 1.5 kg
Externt test » HP Pavilion 14-dv0067tx
Lenovo Yoga Slim 7i Pro: NVIDIA GeForce MX450, 14.00", 1.5 kg
Externt test » Lenovo Yoga Slim 7i Pro
HP Envy 17-cg1490nd : NVIDIA GeForce MX450, 17.30", 2.8 kg
Externt test » HP Envy 17-cg1490nd
Dell Inspiron 15 7000 7506 2-in-1 Black Edition: Intel Iris Xe MAX Graphics, 15.60", 1.9 kg
Externt test » Dell Inspiron 15 7000 7506 2-in-1 Black Edition
Asus ZenBook Duo 14 UX482EA: Intel Iris Xe Graphics G7 96EUs, 14.00", 1.6 kg
Externt test » Asus ZenBook Duo 14 UX482EA
MSI Modern 14 B11M-028: Intel Iris Xe Graphics G7 96EUs, 14.00", 1.3 kg
Externt test » MSI Modern 14 B11M-028
Asus VivoBook S14 S433EQ-EB044T: Intel Iris Xe Graphics G7 96EUs, 14.00", 1.4 kg
Externt test » Asus VivoBook S14 S433EQ-EB044T
HP Spectre x360 14t-ea000: Intel Iris Xe Graphics G7 96EUs, 13.50", 1.3 kg
Externt test » HP Spectre x360 14t-ea000
Asus Zenbook 14 UX435EG: NVIDIA GeForce MX450, 14.00", 1.3 kg
Externt test » Asus Zenbook 14 UX435EG
Acer Swift 5 SF514-55TA-74EC: Intel Iris Xe Graphics G7 96EUs, 14.00", 1.1 kg
Externt test » Acer Swift 5 SF514-55TA-74EC
Lenovo Yoga 7 15ITL5-82BJ0031GE: Intel Iris Xe Graphics G7 96EUs, 15.60", 1.9 kg
Externt test » Lenovo Yoga 7 15ITL5-82BJ0031GE
Razer Blade Stealth 13 2021, i7-1165G7: Intel Iris Xe Graphics G7 96EUs, 13.30", 1.4 kg
Externt test » Razer Blade Stealth 13 2021, i7-1165G7
HP Spectre x360 14-ea0030tu: Intel Iris Xe Graphics G7 96EUs, 13.50", 1.4 kg
Externt test » HP Spectre x360 14-ea0030tu
Asus ZenBook Flip S UX371EA-HL135T: Intel Iris Xe Graphics G7 96EUs, 13.30", 1.2 kg
Externt test » Asus ZenBook Flip S UX371EA-HL135T
Asus ZenBook S UX393EA-HK003T: Intel Iris Xe Graphics G7 96EUs, 13.90", 1.4 kg
Externt test » Asus ZenBook S UX393EA-HK003T
Dell XPS 13 9310 cn93214sc: Intel Iris Xe Graphics G7 96EUs, 13.40", 1.3 kg
Externt test » Dell XPS 13 9310 cn93214sc
MSI Modern 15 A11SB-039RU: NVIDIA GeForce MX450, 15.60", 1.6 kg
Externt test » MSI Modern 15 A11SB-039RU
Asus ZenBook 14 Ultralight UX435EGL: Intel Iris Xe Graphics G7 96EUs, 14.00", 1 kg
Externt test » Asus ZenBook 14 Ultralight UX435EGL
HP Envy 17-cg1279ng: NVIDIA GeForce MX450, 17.30", 2.7 kg
Externt test » HP Envy 17-cg1279ng
Schenker Vision 15: Intel Iris Xe Graphics G7 96EUs, 15.60", 1.7 kg
Externt test » Schenker Vision 15
Asus ZenBook Flip S UX371EA-HL003T: Intel Iris Xe Graphics G7 96EUs, 13.30", 1.3 kg
Externt test » Asus ZenBook Flip S UX371EA-HL003T
Lenovo Yoga Slim 7i Carbon: NVIDIA GeForce MX330, 13.30", 1 kg
Externt test » Lenovo Yoga Slim 7i Carbon
Dell XPS 13 cn93214sc: Intel Iris Xe Graphics G7 96EUs, 13.40", 1.2 kg
Externt test » Dell XPS 13 cn93214sc
Dell XPS 13 9310 2-in-1, i7-1165G7: Intel Iris Xe Graphics G7 96EUs, 13.40", 1.3 kg
Externt test » Dell XPS 13 9310 2-in-1, i7-1165G7
Acer Swift 5 SF514-55GT-79BM: NVIDIA GeForce MX350, 14.00", 1 kg
Externt test » Acer Swift 5 SF514-55GT-79BM
Asus ZenBook 13 UX325EA-AH77: Intel Iris Xe Graphics G7 96EUs, 13.30", 1.1 kg
Externt test » Asus ZenBook 13 UX325EA-AH77
Asus VivoBook S15 S533EA-BQ003T: Intel Iris Xe Graphics G7 96EUs, 15.60", 1.8 kg
Externt test » Asus VivoBook S15 S533EA-BQ003T
Asus ZenBook 14 Ultralight UX435, i7: Intel Iris Xe Graphics G7 96EUs, 14.00", 1 kg
Externt test » Asus ZenBook 14 Ultralight UX435, i7
Razer Book 13 FHD: Intel Iris Xe Graphics G7 96EUs, 13.40", 1.4 kg
Externt test » Razer Book 13 FHD
Asus VivoBook S15 S533EQ-BQ002T: NVIDIA GeForce MX350, 15.60", 1.8 kg
Externt test » Asus VivoBook S15 S533EQ-BQ002T
Acer TravelMate Spin P4 TMP414RN-51-71V7: Intel Iris Xe Graphics G7 96EUs, 14.00", 1.5 kg
Externt test » Acer TravelMate Spin P4 TMP414RN-51-71V7
Acer Book RS Porsche Design AP714-51GT-71A4: NVIDIA GeForce MX350, 14.00", 1.3 kg
Externt test » Acer Book RS Porsche Design AP714-51GT-71A4
Acer Swift 3X: Intel Iris Xe MAX Graphics, 14.00"
Externt test » Acer Swift 3X
Asus ZenBook Flip 13 UX363EA-EM045R: Intel Iris Xe Graphics G7 96EUs, 13.30", 1.3 kg
Externt test » Asus ZenBook Flip 13 UX363EA-EM045R
Acer Swift 3X SF314-510G-761J: Intel Iris Xe Graphics G7 96EUs, 14.00", 1.4 kg
Externt test » Acer Swift 3X SF314-510G-761J
HP Envy 13-ba1097nr: Intel Iris Xe Graphics G7 96EUs, 13.30", 1.3 kg
Externt test » HP Envy 13-ba1097nr
Fujitsu LifeBook U9311: Intel Iris Xe Graphics G7 96EUs, 13.30", 0.9 kg
Externt test » Fujitsu LifeBook U9311
Acer Swift 3 SF313-53-78UG: Intel Iris Xe Graphics G7 96EUs, 13.50", 1.2 kg
Externt test » Acer Swift 3 SF313-53-78UG
Asus ZenBook 13 UX325EA, i7-1165G7: Intel Iris Xe Graphics G7 96EUs, 13.30", 1.1 kg
Externt test » Asus ZenBook 13 UX325EA, i7-1165G7
Asus ExpertBook B9 B9400CEA-KC0167R: Intel Iris Xe Graphics G7 96EUs, 14.00", 1 kg
Externt test » Asus ExpertBook B9400CEA-KC0167R
Dell XPS 13 9310, i7-1165G7 4K: Intel Iris Xe Graphics G7 96EUs, 13.40", 1.3 kg
Externt test » Dell XPS 13 9310, i7-1165G7 4K
Dell XPS 13 9310 Core i7 FHD: Intel Iris Xe Graphics G7 96EUs, 13.40", 1.3 kg
Externt test » Dell XPS 13 9310 Core i7 FHD
Asus ZenBook S UX393EA-HK001T: Intel Iris Xe Graphics G7 96EUs, 13.90", 1.4 kg
Externt test » Asus ZenBook S UX393EA-HK001T
Asus Vivobook S14 S433EA-EB160T: Intel Iris Xe Graphics G7 96EUs, 14.00", 1.4 kg
Externt test » Asus Vivobook S14 S433EA-EB160T
Asus ZenBook 14 UX425EA: Intel Iris Xe Graphics G7 96EUs, 14.00", 1.2 kg
Externt test » Asus ZenBook 14 UX425EA
Asus ZenBook Flip S UX371: Intel Iris Xe Graphics G7 96EUs, 13.30", 1.2 kg
Externt test » Asus ZenBook Flip S UX371
Acer Swift 5 (2021): Intel Iris Xe Graphics G7 96EUs, 14.00", 1 kg
Externt test » Acer Swift 5 (2021)