Test: Framework Laptop 13.5 - Om Microsoft skulle tillverka en reparerbar Surface Laptop skulle den se ut så här (Sammanfattning)
Testgrupp
Gradering | Datum | Modell | Vikt | Höjd | Storlek | Upplösning | Pris |
|---|---|---|---|---|---|---|---|
| 85.4 % v7 (old) | 08/2021 | Framework Laptop 13.5 i7-1165G7, Iris Xe G7 96EUs | 1.3 kg | 15.85 mm | 13.50" | 2256x1504 | |
| 89.5 % v7 (old) | HP Spectre x360 14-ea0378ng i7-1165G7, Iris Xe G7 96EUs | 1.3 kg | 16.9 mm | 13.50" | 3000x2000 | ||
| 84.7 % v7 (old) | 05/2021 | Microsoft Surface Laptop 4 13 i7 i7-1185G7, Iris Xe G7 96EUs | 1.3 kg | 14.5 mm | 13.50" | 2256x1504 | |
| 87.3 % v7 (old) | 05/2021 | Lenovo ThinkPad X1 Titanium Yoga G1 20QA001RGE i7-1160G7, Iris Xe G7 96EUs | 1.2 kg | 11.5 mm | 13.50" | 2256x1504 | |
| 85.7 % v7 (old) | HP ProBook x360 435 G8 R7-5800U R7 5800U, Vega 8 | 1.5 kg | 18 mm | 13.30" | 1920x1080 | ||
| 84.7 % v7 (old) | 09/2022 | Lenovo Yoga 6 13 82ND0009US R5 5500U, Vega 7 | 1.3 kg | 18.2 mm | 13.30" | 1920x1080 |
| SD Card Reader | |
| average JPG Copy Test (av. of 3 runs) | |
| HP Spectre x360 14-ea0378ng (Toshiba Exceria Pro M501 microSDXC 64GB) | |
| Framework Laptop 13.5 (AV Pro UHS-II V60) | |
| HP ProBook x360 435 G8 R7-5800U (AV Pro UHS-II V60) | |
| maximum AS SSD Seq Read Test (1GB) | |
| HP Spectre x360 14-ea0378ng (Toshiba Exceria Pro M501 microSDXC 64GB) | |
| Framework Laptop 13.5 (AV Pro UHS-II V60) | |
| HP ProBook x360 435 G8 R7-5800U (AV Pro UHS-II V60) | |
| Networking | |
| iperf3 transmit AX12 | |
| Lenovo ThinkPad X1 Titanium Yoga G1 20QA001RGE | |
| HP ProBook x360 435 G8 R7-5800U | |
| Microsoft Surface Laptop 4 13 i7 | |
| Framework Laptop 13.5 | |
| HP Spectre x360 14-ea0378ng | |
| Lenovo Yoga 6 13 82ND0009US | |
| iperf3 receive AX12 | |
| Microsoft Surface Laptop 4 13 i7 | |
| Lenovo ThinkPad X1 Titanium Yoga G1 20QA001RGE | |
| HP ProBook x360 435 G8 R7-5800U | |
| Framework Laptop 13.5 | |
| Lenovo Yoga 6 13 82ND0009US | |
| HP Spectre x360 14-ea0378ng | |


| |||||||||||||||||||||||||
Distribution av ljusstyrkan: 93 %
Mitt på batteriet: 449 cd/m²
Kontrast: 1151:1 (Svärta: 0.39 cd/m²)
ΔE ColorChecker Calman: 2.34 | ∀{0.5-29.43 Ø4.71}
calibrated: 0.96
ΔE Greyscale Calman: 4.7 | ∀{0.09-98 Ø4.96}
70.3% AdobeRGB 1998 (Argyll 3D)
99.3% sRGB (Argyll 3D)
69% Display P3 (Argyll 3D)
Gamma: 2.29
CCT: 6760 K
| Framework Laptop 13.5 BOE CQ NE135FBM-N41, IPS, 13.5", 2256x1504 | HP Spectre x360 14-ea0378ng Samsung SDC4148, OLED, 13.5", 3000x2000 | Microsoft Surface Laptop 4 13 i7 LQ135P1JX51, IPS, 13.5", 2256x1504 | Lenovo ThinkPad X1 Titanium Yoga G1 20QA001RGE LPM135M467, IPS, 13.5", 2256x1504 | HP ProBook x360 435 G8 R7-5800U AUO4B2D, IPS, 13.3", 1920x1080 | Lenovo Yoga 6 13 82ND0009US AU Optronics B133HAN05.F, IPS, 13.3", 1920x1080 | |
|---|---|---|---|---|---|---|
| Display | 28% | -4% | -41% | 1% | ||
| Display P3 Coverage (%) | 69 | 99.9 45% | 64.7 -6% | 40.1 -42% | 69.7 1% | |
| sRGB Coverage (%) | 99.3 | 100 1% | 97.2 -2% | 59.9 -40% | 99.2 0% | |
| AdobeRGB 1998 Coverage (%) | 70.3 | 96.1 37% | 66.9 -5% | 41.4 -41% | 71.4 2% | |
| Response Times | 95% | -12% | 19% | 17% | 18% | |
| Response Time Grey 50% / Grey 80% * (ms) | 55.6 ? | 2 ? 96% | 62.8 ? -13% | 53.6 ? 4% | 42.8 ? 23% | 46.8 ? 16% |
| Response Time Black / White * (ms) | 36 ? | 2 ? 94% | 39.8 ? -11% | 24 ? 33% | 32 ? 11% | 28.8 ? 20% |
| PWM Frequency (Hz) | 250 ? | 21930 ? | ||||
| Screen | 346% | 10% | 27% | -62% | -12% | |
| Brightness middle (cd/m²) | 449 | 370 -18% | 413 -8% | 466 4% | 304 -32% | 291.5 -35% |
| Brightness (cd/m²) | 435 | 374 -14% | 400 -8% | 454 4% | 292 -33% | 294 -32% |
| Brightness Distribution (%) | 93 | 90 -3% | 94 1% | 94 1% | 89 -4% | 93 0% |
| Black Level * (cd/m²) | 0.39 | 0.01 97% | 0.29 26% | 0.23 41% | 0.23 41% | 0.19 51% |
| Contrast (:1) | 1151 | 37000 3115% | 1424 24% | 2026 76% | 1322 15% | 1534 33% |
| Colorchecker dE 2000 * | 2.34 | 2.57 -10% | 2.8 -20% | 2.1 10% | 5 -114% | 3.83 -64% |
| Colorchecker dE 2000 max. * | 7.07 | 4.52 36% | 7.2 -2% | 4.5 36% | 17.7 -150% | 8.43 -19% |
| Colorchecker dE 2000 calibrated * | 0.96 | 2.31 -141% | 0.8 17% | 4.2 -338% | 1.07 -11% | |
| Greyscale dE 2000 * | 4.7 | 2.2 53% | 1.9 60% | 2.7 43% | 2.1 55% | 6.2 -32% |
| Gamma | 2.29 96% | 2.36 93% | 2.12 104% | 2.08 106% | 2.03 108% | 2.2 100% |
| CCT | 6760 96% | 6154 106% | 6510 100% | 6210 105% | 6443 101% | 6469 100% |
| Color Space (Percent of AdobeRGB 1998) (%) | 85.8 | 61.6 | 61.1 | |||
| Color Space (Percent of sRGB) (%) | 100 | 97.2 | 94.9 | |||
| Totalt genomsnitt (program/inställningar) | 156% /
242% | -2% /
4% | 23% /
25% | -29% /
-46% | 2% /
-5% |
* ... mindre är bättre
Visa svarstider
| ↔ Svarstid svart till vitt | ||
|---|---|---|
| 36 ms ... stiga ↗ och falla ↘ kombinerat | ↗ 21.2 ms stiga | 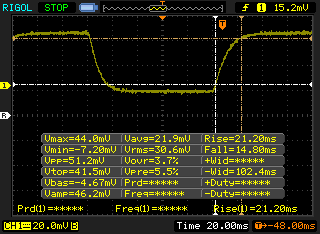 |
| ↘ 14.8 ms hösten | ||
| Skärmen visar långsamma svarsfrekvenser i våra tester och kommer att vara otillfredsställande för spelare. I jämförelse sträcker sig alla testade enheter från 0.1 (minst) till 240 (maximalt) ms. » 94 % av alla enheter är bättre. Detta innebär att den uppmätta svarstiden är sämre än genomsnittet av alla testade enheter (19.8 ms). | ||
| ↔ Svarstid 50 % grått till 80 % grått | ||
| 55.6 ms ... stiga ↗ och falla ↘ kombinerat | ↗ 27.2 ms stiga | 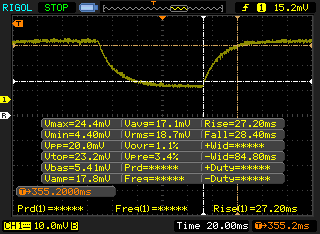 |
| ↘ 28.4 ms hösten | ||
| Skärmen visar långsamma svarsfrekvenser i våra tester och kommer att vara otillfredsställande för spelare. I jämförelse sträcker sig alla testade enheter från 0.165 (minst) till 636 (maximalt) ms. » 92 % av alla enheter är bättre. Detta innebär att den uppmätta svarstiden är sämre än genomsnittet av alla testade enheter (31 ms). | ||
Skärmflimmer / PWM (Puls-Width Modulation)
| Skärmflimmer / PWM upptäcktes inte |  | ||
Som jämförelse: 52 % av alla testade enheter använder inte PWM för att dämpa skärmen. Om PWM upptäcktes mättes ett medelvärde av 7757 (minst: 5 - maximum: 343500) Hz. | |||
Cinebench R15 Multi Loop
Cinebench R23: Multi Core | Single Core
Cinebench R15: CPU Multi 64Bit | CPU Single 64Bit
Blender: v2.79 BMW27 CPU
7-Zip 18.03: 7z b 4 -mmt1 | 7z b 4
Geekbench 5.5: Single-Core | Multi-Core
HWBOT x265 Benchmark v2.2: 4k Preset
LibreOffice : 20 Documents To PDF
R Benchmark 2.5: Overall mean
| Cinebench R20 / CPU (Single Core) | |
| VAIO Z VJZ141C11L | |
| Microsoft Surface Laptop 4 13 i7 | |
| Framework Laptop 13.5 | |
| Genomsnitt Intel Core i7-1165G7 (442 - 589, n=81) | |
| HP Spectre x360 13-aw2003dx | |
| Asus ZenBook 13 OLED UM325UA | |
| Lenovo Yoga 6 13 82ND0009US | |
| Acer Spin 5 SP513-54N-79EY | |
| HP Envy x360 13-ay0010nr | |
| HP EliteBook x360 830 G6 | |
| Asus VivoBook S13 S333JA-DS51 | |
| Cinebench R23 / Multi Core | |
| Asus ZenBook 13 OLED UM325UA | |
| VAIO Z VJZ141C11L | |
| Lenovo Yoga 6 13 82ND0009US | |
| Framework Laptop 13.5 | |
| Microsoft Surface Laptop 4 13 i7 | |
| Genomsnitt Intel Core i7-1165G7 (2525 - 6862, n=64) | |
| HP Spectre x360 13-aw2003dx | |
| Asus VivoBook S13 S333JA-DS51 | |
| Cinebench R23 / Single Core | |
| VAIO Z VJZ141C11L | |
| Microsoft Surface Laptop 4 13 i7 | |
| Framework Laptop 13.5 | |
| Genomsnitt Intel Core i7-1165G7 (1110 - 1539, n=59) | |
| HP Spectre x360 13-aw2003dx | |
| Asus ZenBook 13 OLED UM325UA | |
| Lenovo Yoga 6 13 82ND0009US | |
| Asus VivoBook S13 S333JA-DS51 | |
| Geekbench 5.5 / Single-Core | |
| VAIO Z VJZ141C11L | |
| Microsoft Surface Laptop 4 13 i7 | |
| Genomsnitt Intel Core i7-1165G7 (1302 - 1595, n=77) | |
| HP Spectre x360 13-aw2003dx | |
| Acer Spin 5 SP513-54N-79EY | |
| Asus ZenBook 13 OLED UM325UA | |
| Asus VivoBook S13 S333JA-DS51 | |
| HP Envy x360 13-ay0010nr | |
| Geekbench 5.5 / Multi-Core | |
| Asus ZenBook 13 OLED UM325UA | |
| VAIO Z VJZ141C11L | |
| Microsoft Surface Laptop 4 13 i7 | |
| HP Spectre x360 13-aw2003dx | |
| Genomsnitt Intel Core i7-1165G7 (3078 - 5926, n=77) | |
| HP Envy x360 13-ay0010nr | |
| Asus VivoBook S13 S333JA-DS51 | |
| Acer Spin 5 SP513-54N-79EY | |
| HWBOT x265 Benchmark v2.2 / 4k Preset | |
| Asus ZenBook 13 OLED UM325UA | |
| VAIO Z VJZ141C11L | |
| Lenovo Yoga 6 13 82ND0009US | |
| Framework Laptop 13.5 | |
| HP Envy x360 13-ay0010nr | |
| Genomsnitt Intel Core i7-1165G7 (1.39 - 8.47, n=80) | |
| HP Spectre x360 13-aw2003dx | |
| Microsoft Surface Laptop 4 13 i7 | |
| Asus VivoBook S13 S333JA-DS51 | |
| LibreOffice / 20 Documents To PDF | |
| Lenovo Yoga 6 13 82ND0009US | |
| HP Envy x360 13-ay0010nr | |
| Asus VivoBook S13 S333JA-DS51 | |
| Asus ZenBook 13 OLED UM325UA | |
| HP Spectre x360 13-aw2003dx | |
| Acer Spin 5 SP513-54N-79EY | |
| Microsoft Surface Laptop 4 13 i7 | |
| Genomsnitt Intel Core i7-1165G7 (21.5 - 88.1, n=78) | |
| VAIO Z VJZ141C11L | |
| Framework Laptop 13.5 | |
| R Benchmark 2.5 / Overall mean | |
| Asus VivoBook S13 S333JA-DS51 | |
| HP Spectre x360 13-aw2003dx | |
| Lenovo Yoga 6 13 82ND0009US | |
| HP Envy x360 13-ay0010nr | |
| Asus ZenBook 13 OLED UM325UA | |
| Genomsnitt Intel Core i7-1165G7 (0.552 - 1.002, n=80) | |
| Microsoft Surface Laptop 4 13 i7 | |
| Framework Laptop 13.5 | |
| VAIO Z VJZ141C11L | |
* ... mindre är bättre
| PCMark 10 / Score | |
| HP ProBook x360 435 G8 R7-5800U | |
| Lenovo Yoga 6 13 82ND0009US | |
| Genomsnitt Intel Core i7-1165G7, Intel Iris Xe Graphics G7 96EUs (4531 - 5454, n=50) | |
| Microsoft Surface Laptop 4 13 i7 | |
| Framework Laptop 13.5 | |
| Lenovo ThinkPad X1 Titanium Yoga G1 20QA001RGE | |
| HP Spectre x360 14-ea0378ng | |
| PCMark 10 / Essentials | |
| Lenovo ThinkPad X1 Titanium Yoga G1 20QA001RGE | |
| Framework Laptop 13.5 | |
| Genomsnitt Intel Core i7-1165G7, Intel Iris Xe Graphics G7 96EUs (8997 - 11505, n=50) | |
| Lenovo Yoga 6 13 82ND0009US | |
| HP ProBook x360 435 G8 R7-5800U | |
| HP Spectre x360 14-ea0378ng | |
| Microsoft Surface Laptop 4 13 i7 | |
| PCMark 10 / Productivity | |
| HP ProBook x360 435 G8 R7-5800U | |
| Lenovo Yoga 6 13 82ND0009US | |
| Genomsnitt Intel Core i7-1165G7, Intel Iris Xe Graphics G7 96EUs (5570 - 7136, n=50) | |
| Microsoft Surface Laptop 4 13 i7 | |
| Lenovo ThinkPad X1 Titanium Yoga G1 20QA001RGE | |
| HP Spectre x360 14-ea0378ng | |
| Framework Laptop 13.5 | |
| PCMark 10 / Digital Content Creation | |
| Lenovo Yoga 6 13 82ND0009US | |
| HP ProBook x360 435 G8 R7-5800U | |
| Framework Laptop 13.5 | |
| Genomsnitt Intel Core i7-1165G7, Intel Iris Xe Graphics G7 96EUs (4083 - 5550, n=50) | |
| Microsoft Surface Laptop 4 13 i7 | |
| HP Spectre x360 14-ea0378ng | |
| Lenovo ThinkPad X1 Titanium Yoga G1 20QA001RGE | |
| PCMark 10 Score | 4768 poäng | |
Hjälp | ||
| DPC Latencies / LatencyMon - interrupt to process latency (max), Web, Youtube, Prime95 | |
| Framework Laptop 13.5 | |
| HP Spectre x360 14-ea0378ng | |
| Lenovo ThinkPad X1 Titanium Yoga G1 20QA001RGE | |
| Lenovo Yoga 6 13 82ND0009US | |
| Microsoft Surface Laptop 4 13 i7 | |
| HP ProBook x360 435 G8 R7-5800U | |
* ... mindre är bättre
| Framework Laptop 13.5 Western Digital WD_BLACK SN850 WDS100T1X0E | HP Spectre x360 14-ea0378ng Intel Optane Memory H10 with Solid State Storage 32GB + 1TB HBRPEKNX0203AH(L/H) | Microsoft Surface Laptop 4 13 i7 Samsung PM991 MZ9LQ512HALU | Lenovo ThinkPad X1 Titanium Yoga G1 20QA001RGE Toshiba BG4 KBG40ZNT512G | HP ProBook x360 435 G8 R7-5800U Samsung PM991 MZVLQ512HALU | Lenovo Yoga 6 13 82ND0009US WDC PC SN530 SDBPMPZ-265G | |
|---|---|---|---|---|---|---|
| AS SSD | -76% | -81% | -69% | -76% | -101% | |
| Seq Read (MB/s) | 5613 | 1343 -76% | 1821 -68% | 1898 -66% | 1936 -66% | 1860 -67% |
| Seq Write (MB/s) | 4909 | 1222 -75% | 794 -84% | 1065 -78% | 1237 -75% | 500 -90% |
| 4K Read (MB/s) | 80.6 | 63.6 -21% | 47.54 -41% | 58 -28% | 40.35 -50% | 36.26 -55% |
| 4K Write (MB/s) | 256.6 | 107.8 -58% | 141.6 -45% | 200.7 -22% | 99.5 -61% | 118.6 -54% |
| 4K-64 Read (MB/s) | 2222 | 417.5 -81% | 782 -65% | 580 -74% | 645 -71% | 419 -81% |
| 4K-64 Write (MB/s) | 2050 | 496 -76% | 766 -63% | 779 -62% | 365.8 -82% | 219 -89% |
| Access Time Read * (ms) | 0.032 | 0.103 -222% | 0.191 -497% | 0.052 -63% | 0.104 -225% | 0.102 -219% |
| Access Time Write * (ms) | 0.044 | 0.043 2% | 0.027 39% | 0.16 -264% | 0.038 14% | 0.17 -286% |
| Score Read (Points) | 2864 | 615 -79% | 1012 -65% | 828 -71% | 879 -69% | 641 -78% |
| Score Write (Points) | 2797 | 726 -74% | 987 -65% | 1087 -61% | 589 -79% | 388 -86% |
| Score Total (Points) | 7098 | 1675 -76% | 2477 -65% | 2316 -67% | 1892 -73% | 1300 -82% |
| Copy ISO MB/s (MB/s) | 1926 | 334.9 -83% | 1243 -35% | 1659 -14% | 708 -63% | 880 -54% |
| Copy Program MB/s (MB/s) | 947 | 276.3 -71% | 628 -34% | 519 -45% | 132.1 -86% | 185.3 -80% |
| Copy Game MB/s (MB/s) | 1880 | 433.2 -77% | 976 -48% | 872 -54% | 326.7 -83% | 212.7 -89% |
| CrystalDiskMark 5.2 / 6 | -42% | -67% | -49% | -67% | -68% | |
| Write 4K (MB/s) | 299.4 | 128.9 -57% | 118.2 -61% | 226.6 -24% | 86.7 -71% | 89.2 -70% |
| Read 4K (MB/s) | 87.6 | 140 60% | 37.54 -57% | 62.8 -28% | 32.45 -63% | 33.09 -62% |
| Write Seq (MB/s) | 5205 | 1422 -73% | 1017 -80% | 1296 -75% | 1235 -76% | 988 -81% |
| Read Seq (MB/s) | 4276 | 1660 -61% | 926 -78% | 1445 -66% | 1417 -67% | 1322 -69% |
| Write 4K Q32T1 (MB/s) | 846 | 475.1 -44% | 354.2 -58% | 545 -36% | 390.8 -54% | 332.6 -61% |
| Read 4K Q32T1 (MB/s) | 905 | 581 -36% | 352.6 -61% | 687 -24% | 291 -68% | 389.3 -57% |
| Write Seq Q32T1 (MB/s) | 5189 | 1793 -65% | 1174 -77% | 1483 -71% | 1384 -73% | 984 -81% |
| Read Seq Q32T1 (MB/s) | 6921 | 2536 -63% | 2261 -67% | 2334 -66% | 2350 -66% | 2461 -64% |
| Totalt genomsnitt (program/inställningar) | -59% /
-64% | -74% /
-76% | -59% /
-62% | -72% /
-73% | -85% /
-89% |
* ... mindre är bättre

DiskSpd Read Loop, Queue Depth 8
| 3DMark 11 Performance | 5893 poäng | |
| 3DMark Cloud Gate Standard Score | 15999 poäng | |
| 3DMark Fire Strike Score | 2361 poäng | |
| 3DMark Time Spy Score | 1361 poäng | |
Hjälp | ||
| Final Fantasy XV Benchmark | |
| 1280x720 Lite Quality | |
| Genomsnitt Intel Iris Xe Graphics G7 96EUs (14.9 - 56.5, n=189) | |
| Lenovo ThinkPad X13 G2 20WK0024GE | |
| HP Spectre x360 13-aw2003dx | |
| Asus ZenBook 13 OLED UM325UA | |
| Huawei MateBook X Pro 2021 | |
| Lenovo Yoga 6 13 82ND0009US | |
| Framework Laptop 13.5 | |
| HP ProBook x360 435 G8 R7-5800U | |
| Asus VivoBook S13 S333JA-DS51 | |
| 1920x1080 Standard Quality | |
| Genomsnitt Intel Iris Xe Graphics G7 96EUs (10.5 - 31.2, n=185) | |
| Lenovo ThinkPad X13 G2 20WK0024GE | |
| HP Spectre x360 13-aw2003dx | |
| Huawei MateBook X Pro 2021 | |
| Asus ZenBook 13 OLED UM325UA | |
| Framework Laptop 13.5 | |
| Lenovo Yoga 6 13 82ND0009US | |
| HP ProBook x360 435 G8 R7-5800U | |
| Asus VivoBook S13 S333JA-DS51 | |
| 1920x1080 High Quality | |
| HP Spectre x360 13-aw2003dx | |
| Genomsnitt Intel Iris Xe Graphics G7 96EUs (8.15 - 27.8, n=178) | |
| Lenovo ThinkPad X13 G2 20WK0024GE | |
| Huawei MateBook X Pro 2021 | |
| Framework Laptop 13.5 | |
| Asus ZenBook 13 OLED UM325UA | |
| Lenovo Yoga 6 13 82ND0009US | |
| HP ProBook x360 435 G8 R7-5800U | |
| Asus VivoBook S13 S333JA-DS51 | |
Witcher 3 FPS-tabell
| låg | med. | hög | ultra | |
|---|---|---|---|---|
| The Witcher 3 (2015) | 75.9 | 45.1 | 22.1 | 12 |
| Dota 2 Reborn (2015) | 109 | 66.1 | 41.2 | 38.2 |
| Final Fantasy XV Benchmark (2018) | 29.4 | 15.7 | 12.1 | |
| X-Plane 11.11 (2018) | 41.3 | 36.5 | 29.5 |
| Framework Laptop 13.5 Iris Xe G7 96EUs, i7-1165G7, Western Digital WD_BLACK SN850 WDS100T1X0E | HP Spectre x360 14-ea0378ng Iris Xe G7 96EUs, i7-1165G7, Intel Optane Memory H10 with Solid State Storage 32GB + 1TB HBRPEKNX0203AH(L/H) | Microsoft Surface Laptop 4 13 i7 Iris Xe G7 96EUs, i7-1185G7, Samsung PM991 MZ9LQ512HALU | Lenovo ThinkPad X1 Titanium Yoga G1 20QA001RGE Iris Xe G7 96EUs, i7-1160G7, Toshiba BG4 KBG40ZNT512G | Lenovo Yoga 6 13 82ND0009US Vega 7, R5 5500U, WDC PC SN530 SDBPMPZ-265G | Asus Zenbook 14 UX433FN-A6023T GeForce MX150, i7-8565U, Intel SSD 660p SSDPEKNW512G8 | |
|---|---|---|---|---|---|---|
| Noise | 1% | 5% | 8% | 4% | -13% | |
| av / miljö * (dB) | 23.9 | 26 -9% | 24.2 -1% | 25.1 -5% | 25.1 -5% | 30.7 -28% |
| Idle Minimum * (dB) | 23.9 | 26 -9% | 24.2 -1% | 25.1 -5% | 25.1 -5% | 30.7 -28% |
| Idle Average * (dB) | 23.9 | 26 -9% | 24.2 -1% | 25.1 -5% | 25.1 -5% | 30.7 -28% |
| Idle Maximum * (dB) | 23.9 | 26 -9% | 24.2 -1% | 27.1 -13% | 25.1 -5% | 30.7 -28% |
| Load Average * (dB) | 45.6 | 37.5 18% | 39.5 13% | 32.7 28% | 41 10% | 38.8 15% |
| Witcher 3 ultra * (dB) | 47.1 | 32.7 31% | 38.6 18% | |||
| Load Maximum * (dB) | 47.9 | 36.3 24% | 39.5 18% | 35.8 25% | 38.7 19% | 39.3 18% |
* ... mindre är bättre
Ljudnivå
| Låg belastning |
| 23.9 / 23.9 / 23.9 dB(A) |
| Hög belastning |
| 45.6 / 47.9 dB(A) |
 | ||
30 dB tyst 40 dB(A) hörbar 50 dB(A) högt ljud |
||
min: | ||
(-) Den maximala temperaturen på ovansidan är 47.2 °C / 117 F, jämfört med genomsnittet av 34.3 °C / 94 F , allt från 21.2 till 62.5 °C för klassen Office.
(+) Botten värms upp till maximalt 39.4 °C / 103 F, jämfört med genomsnittet av 36.8 °C / 98 F
(+) Vid tomgångsbruk är medeltemperaturen för ovansidan 23.5 °C / 74 F, jämfört med enhetsgenomsnittet på 29.5 °C / ### class_avg_f### F.
(+) Handledsstöden och pekplattan är kallare än hudtemperaturen med maximalt 28.2 °C / 82.8 F och är därför svala att ta på.
(±) Medeltemperaturen för handledsstödsområdet på liknande enheter var 27.5 °C / 81.5 F (-0.7 °C / -1.3 F).
Framework Laptop 13.5 ljudanalys
(±) | högtalarljudstyrkan är genomsnittlig men bra (78.2 dB)
Bas 100 - 315 Hz
(±) | reducerad bas - i genomsnitt 13.9% lägre än medianen
(±) | linjäriteten för basen är genomsnittlig (10.1% delta till föregående frekvens)
Mellan 400 - 2000 Hz
(+) | balanserad mellan - endast 4% från medianen
(+) | mids är linjära (6% delta till föregående frekvens)
Högsta 2 - 16 kHz
(±) | högre toppar - i genomsnitt 5.2% högre än medianen
(+) | toppar är linjära (6.1% delta till föregående frekvens)
Totalt 100 - 16 000 Hz
(±) | linjäriteten för det totala ljudet är genomsnittlig (17.3% skillnad mot median)
Jämfört med samma klass
» 26% av alla testade enheter i den här klassen var bättre, 7% liknande, 67% sämre
» Den bästa hade ett delta på 7%, genomsnittet var 21%, sämst var 53%
Jämfört med alla testade enheter
» 32% av alla testade enheter var bättre, 8% liknande, 59% sämre
» Den bästa hade ett delta på 4%, genomsnittet var 23%, sämst var 134%
Apple MacBook 12 (Early 2016) 1.1 GHz ljudanalys
(+) | högtalare kan spela relativt högt (83.6 dB)
Bas 100 - 315 Hz
(±) | reducerad bas - i genomsnitt 11.3% lägre än medianen
(±) | linjäriteten för basen är genomsnittlig (14.2% delta till föregående frekvens)
Mellan 400 - 2000 Hz
(+) | balanserad mellan - endast 2.4% från medianen
(+) | mids är linjära (5.5% delta till föregående frekvens)
Högsta 2 - 16 kHz
(+) | balanserade toppar - endast 2% från medianen
(+) | toppar är linjära (4.5% delta till föregående frekvens)
Totalt 100 - 16 000 Hz
(+) | det totala ljudet är linjärt (10.2% skillnad mot median)
Jämfört med samma klass
» 7% av alla testade enheter i den här klassen var bättre, 2% liknande, 90% sämre
» Den bästa hade ett delta på 5%, genomsnittet var 18%, sämst var 53%
Jämfört med alla testade enheter
» 5% av alla testade enheter var bättre, 1% liknande, 94% sämre
» Den bästa hade ett delta på 4%, genomsnittet var 23%, sämst var 134%
| Av/Standby | |
| Låg belastning | |
| Hög belastning |
|
Förklaring:
min: | |
| Framework Laptop 13.5 i7-1165G7, Iris Xe G7 96EUs, Western Digital WD_BLACK SN850 WDS100T1X0E, IPS, 2256x1504, 13.5" | HP Spectre x360 14-ea0378ng i7-1165G7, Iris Xe G7 96EUs, Intel Optane Memory H10 with Solid State Storage 32GB + 1TB HBRPEKNX0203AH(L/H), OLED, 3000x2000, 13.5" | Microsoft Surface Laptop 4 13 i7 i7-1185G7, Iris Xe G7 96EUs, Samsung PM991 MZ9LQ512HALU, IPS, 2256x1504, 13.5" | Lenovo ThinkPad X1 Titanium Yoga G1 20QA001RGE i7-1160G7, Iris Xe G7 96EUs, Toshiba BG4 KBG40ZNT512G, IPS, 2256x1504, 13.5" | HP ProBook x360 435 G8 R7-5800U R7 5800U, Vega 8, Samsung PM991 MZVLQ512HALU, IPS, 1920x1080, 13.3" | Lenovo Yoga 6 13 82ND0009US R5 5500U, Vega 7, WDC PC SN530 SDBPMPZ-265G, IPS, 1920x1080, 13.3" | |
|---|---|---|---|---|---|---|
| Power Consumption | -14% | 15% | 14% | 24% | 14% | |
| Idle Minimum * (Watt) | 4.3 | 6.3 -47% | 2.6 40% | 3.9 9% | 3.2 26% | 5 -16% |
| Idle Average * (Watt) | 8.2 | 11.2 -37% | 6 27% | 7.3 11% | 5.5 33% | 6.3 23% |
| Idle Maximum * (Watt) | 8.7 | 13.3 -53% | 8.2 6% | 10.3 -18% | 6.4 26% | 6.9 21% |
| Load Average * (Watt) | 43.5 | 32 26% | 41.4 5% | 30.6 30% | 35.5 18% | 41.5 5% |
| Witcher 3 ultra * (Watt) | 43.5 | 25.5 41% | 36.4 16% | 33.2 24% | ||
| Load Maximum * (Watt) | 61.8 | 35.6 42% | 64.1 -4% | 57.1 8% | 47.5 23% | 46.5 25% |
* ... mindre är bättre
Energiförbrukning: Witcher 3 / Stress-test
| Framework Laptop 13.5 i7-1165G7, Iris Xe G7 96EUs, 55 Wh | HP Spectre x360 14-ea0378ng i7-1165G7, Iris Xe G7 96EUs, 66 Wh | Microsoft Surface Laptop 4 13 i7 i7-1185G7, Iris Xe G7 96EUs, 47.4 Wh | Lenovo ThinkPad X1 Titanium Yoga G1 20QA001RGE i7-1160G7, Iris Xe G7 96EUs, 44.5 Wh | HP ProBook x360 435 G8 R7-5800U R7 5800U, Vega 8, 45 Wh | Lenovo Yoga 6 13 82ND0009US R5 5500U, Vega 7, 60 Wh | |
|---|---|---|---|---|---|---|
| Batteridrifttid | -2% | -5% | 5% | 19% | 65% | |
| WiFi v1.3 (h) | 8 | 7.8 -2% | 7.6 -5% | 8.4 5% | 9.5 19% | 13.2 65% |
| Reader / Idle (h) | 13.4 | 17.5 | ||||
| Load (h) | 2.6 | 1.4 | 1.9 | 1.1 | 2 |
För
Emot
Läs den fullständiga versionen av den här recensionen på engelska här.
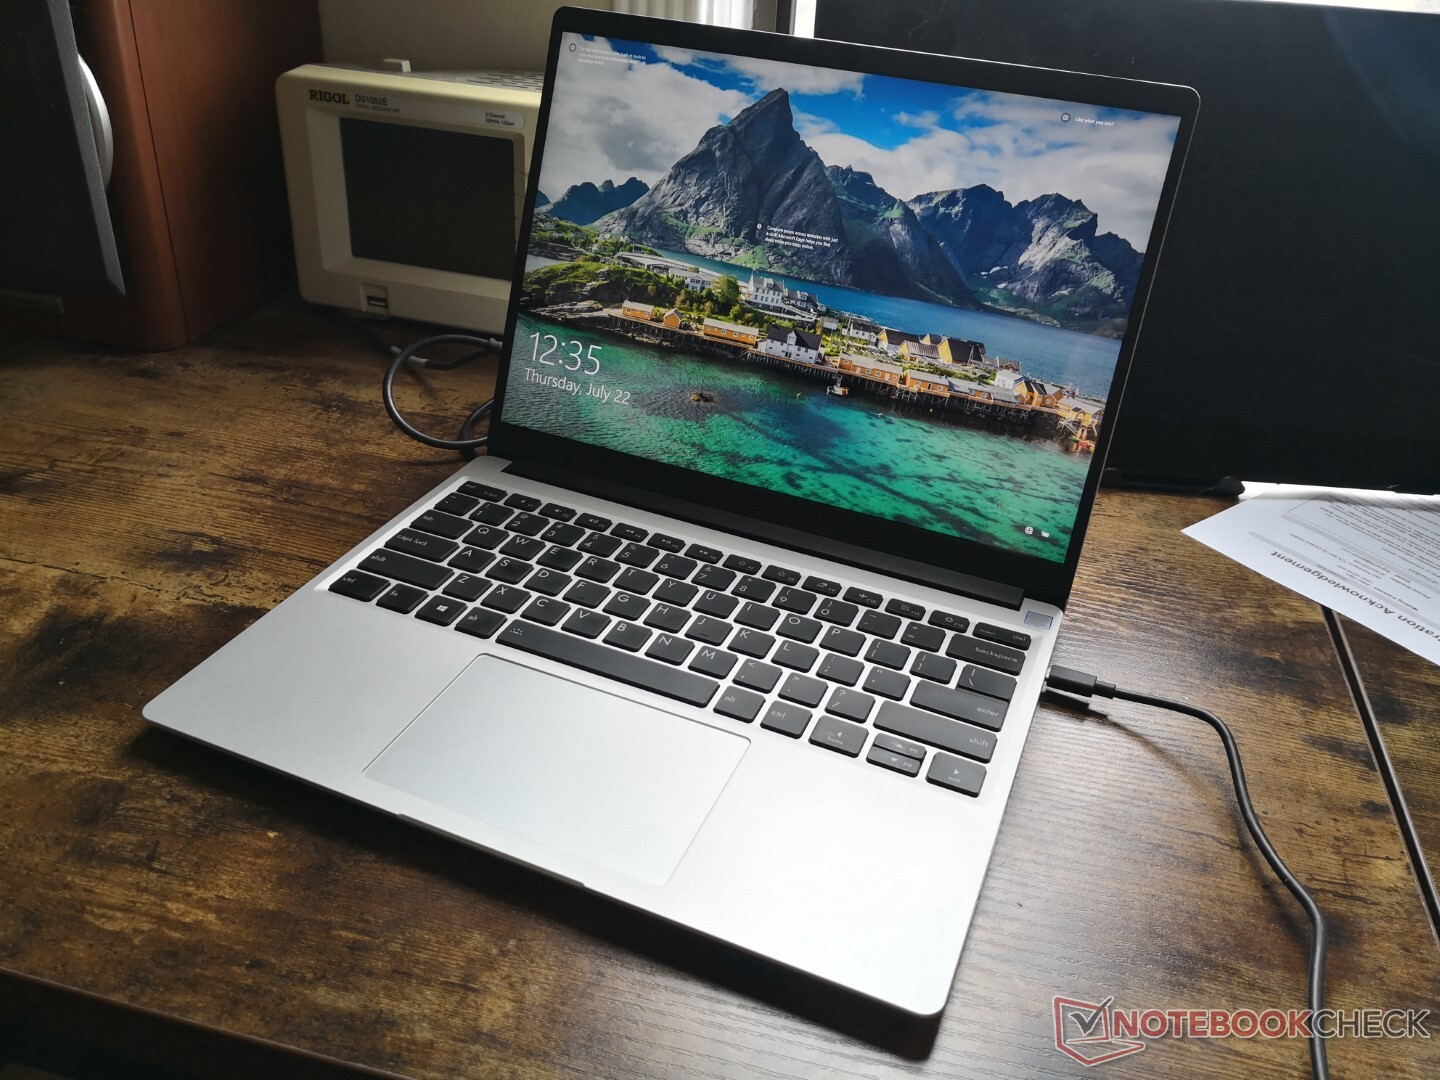
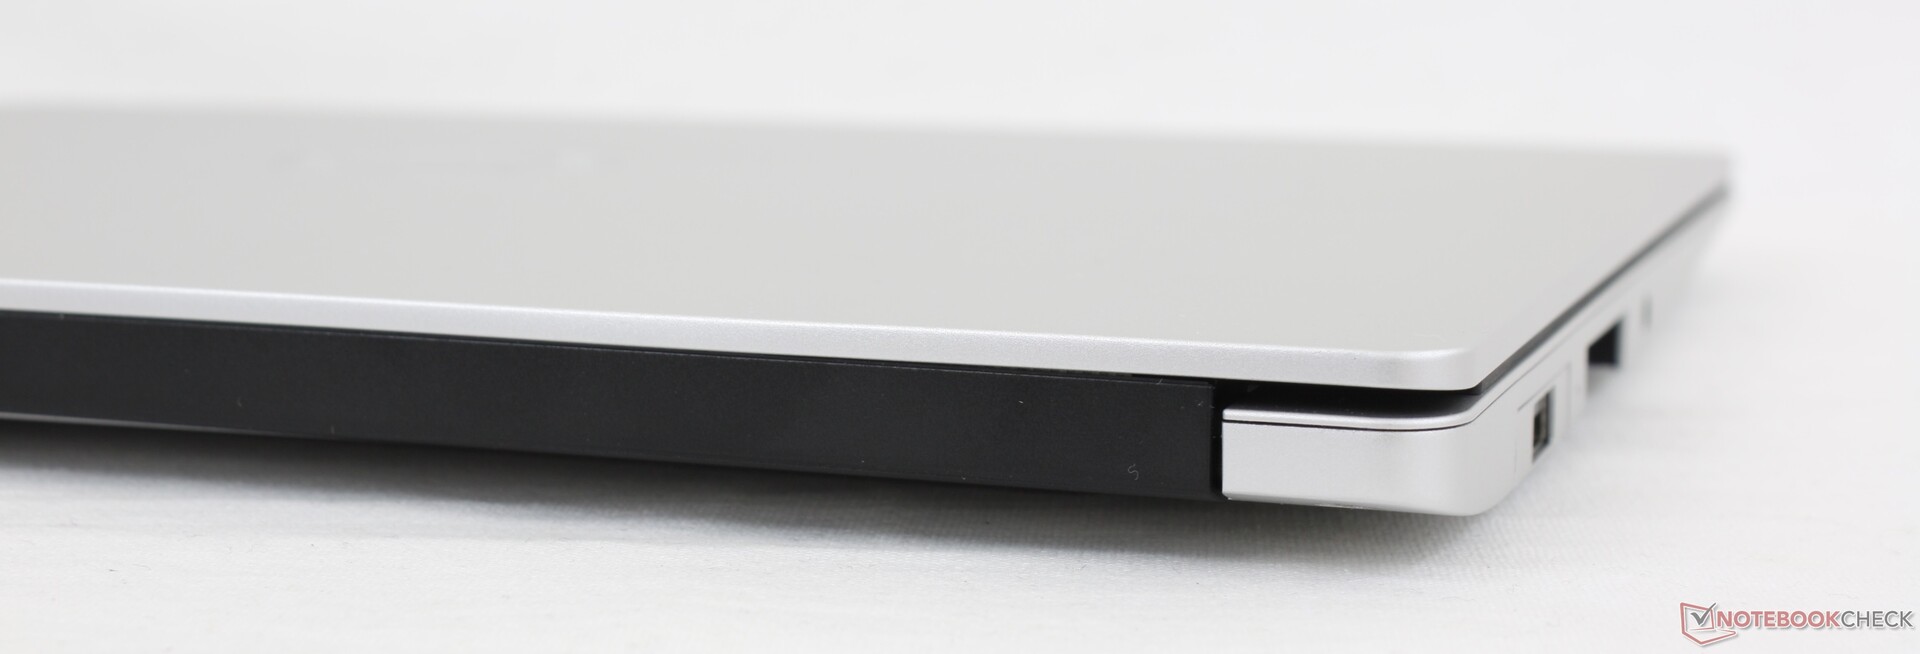
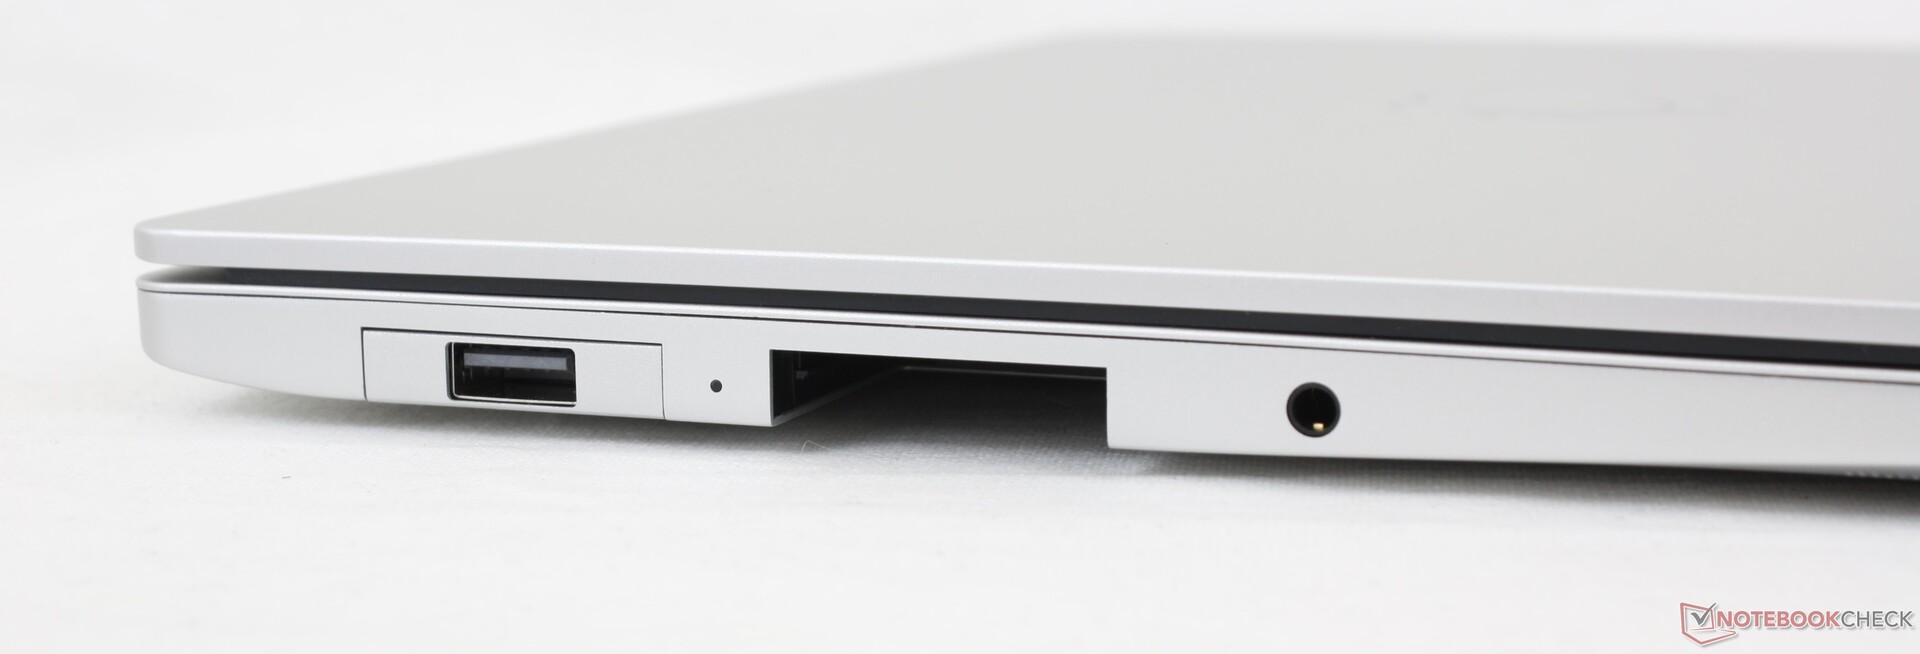
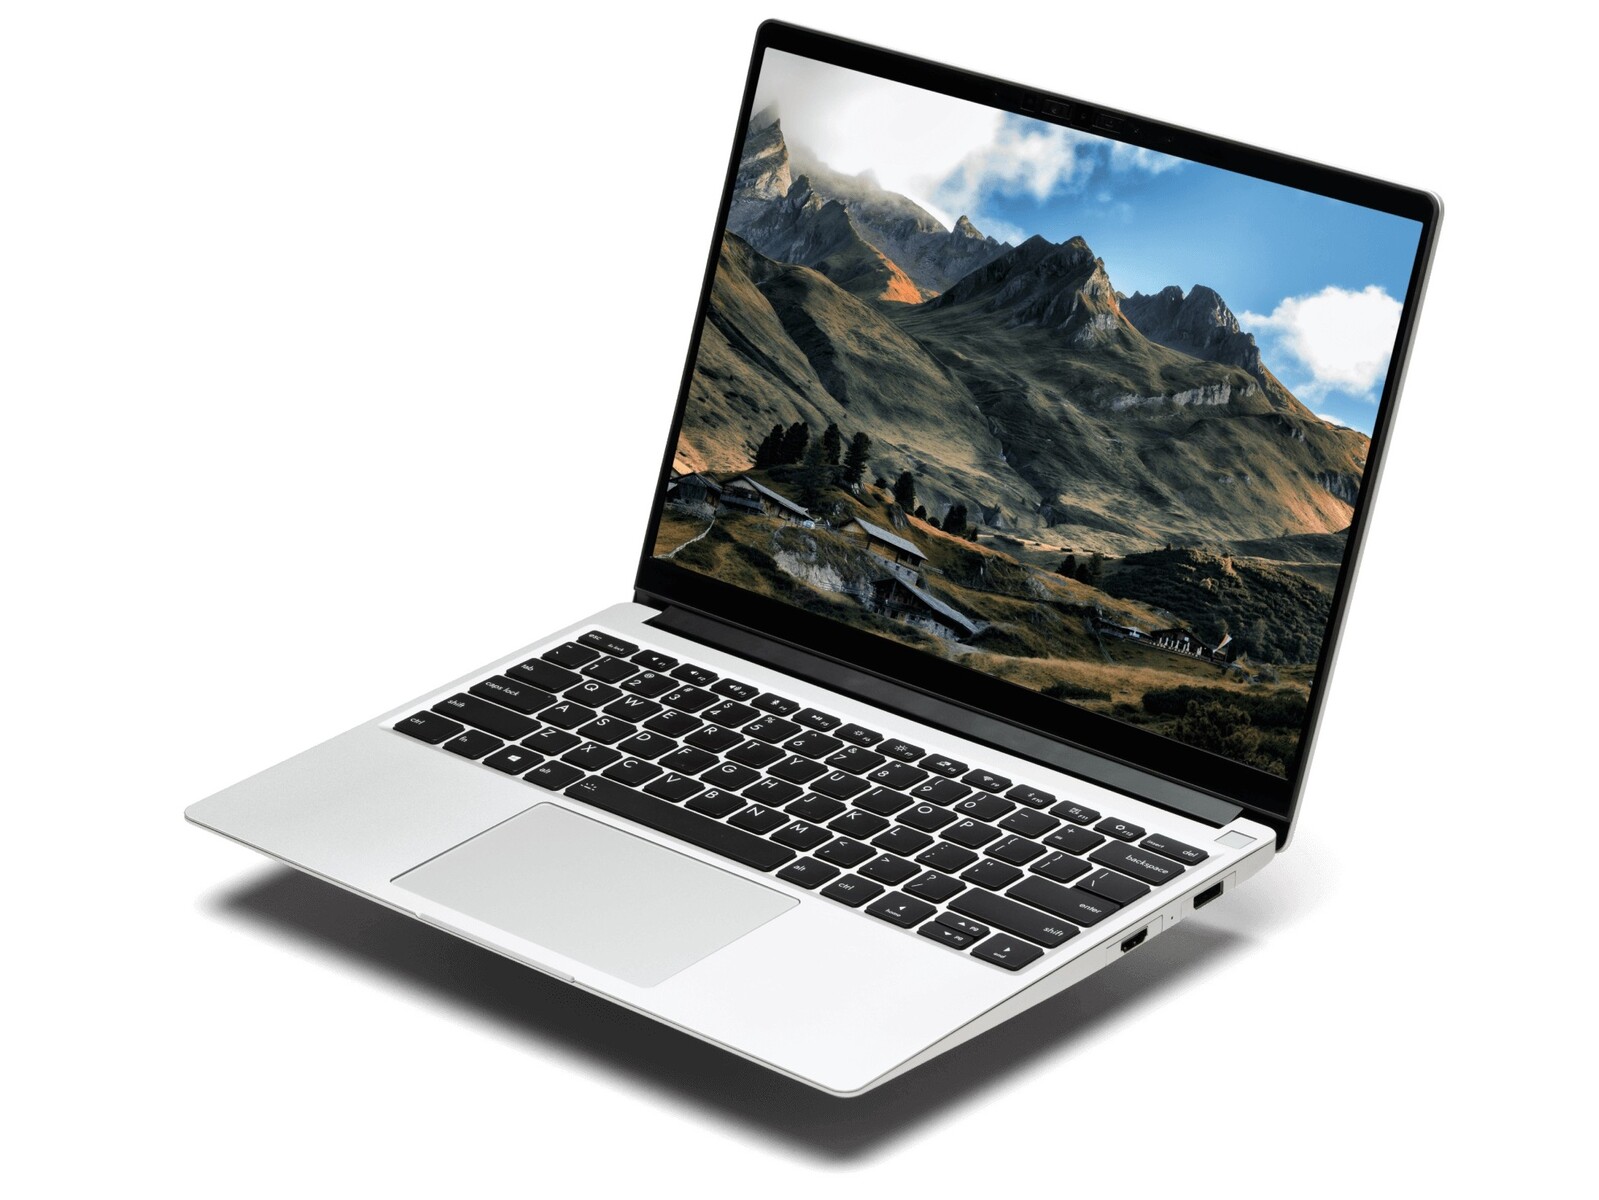
Det händer ofta att datortillverkarna tar fram tunna och tjusiga laptops som är irriterande svåra, för att inte säga omöjliga, att reparera. Till och med enkla uppgraderingar av RAM eller lagring är något man oftast avråder från. Framework Laptop är ett bevis på att tunna och lätta modeller inte nödvändigtvis behöver offra möjligheten att utföra service eller vara utan unika funktioner som utbytbara portar med anledning av storlek och mobilitet.
Framework Laptop slår Surface Laptop på den sistnämndas hemmaplan. Den lyckas vara mindre, betydligt lättare att serva och har fler inbyggda portar utan att för den sakens skull offra prestanda och mobilitet.
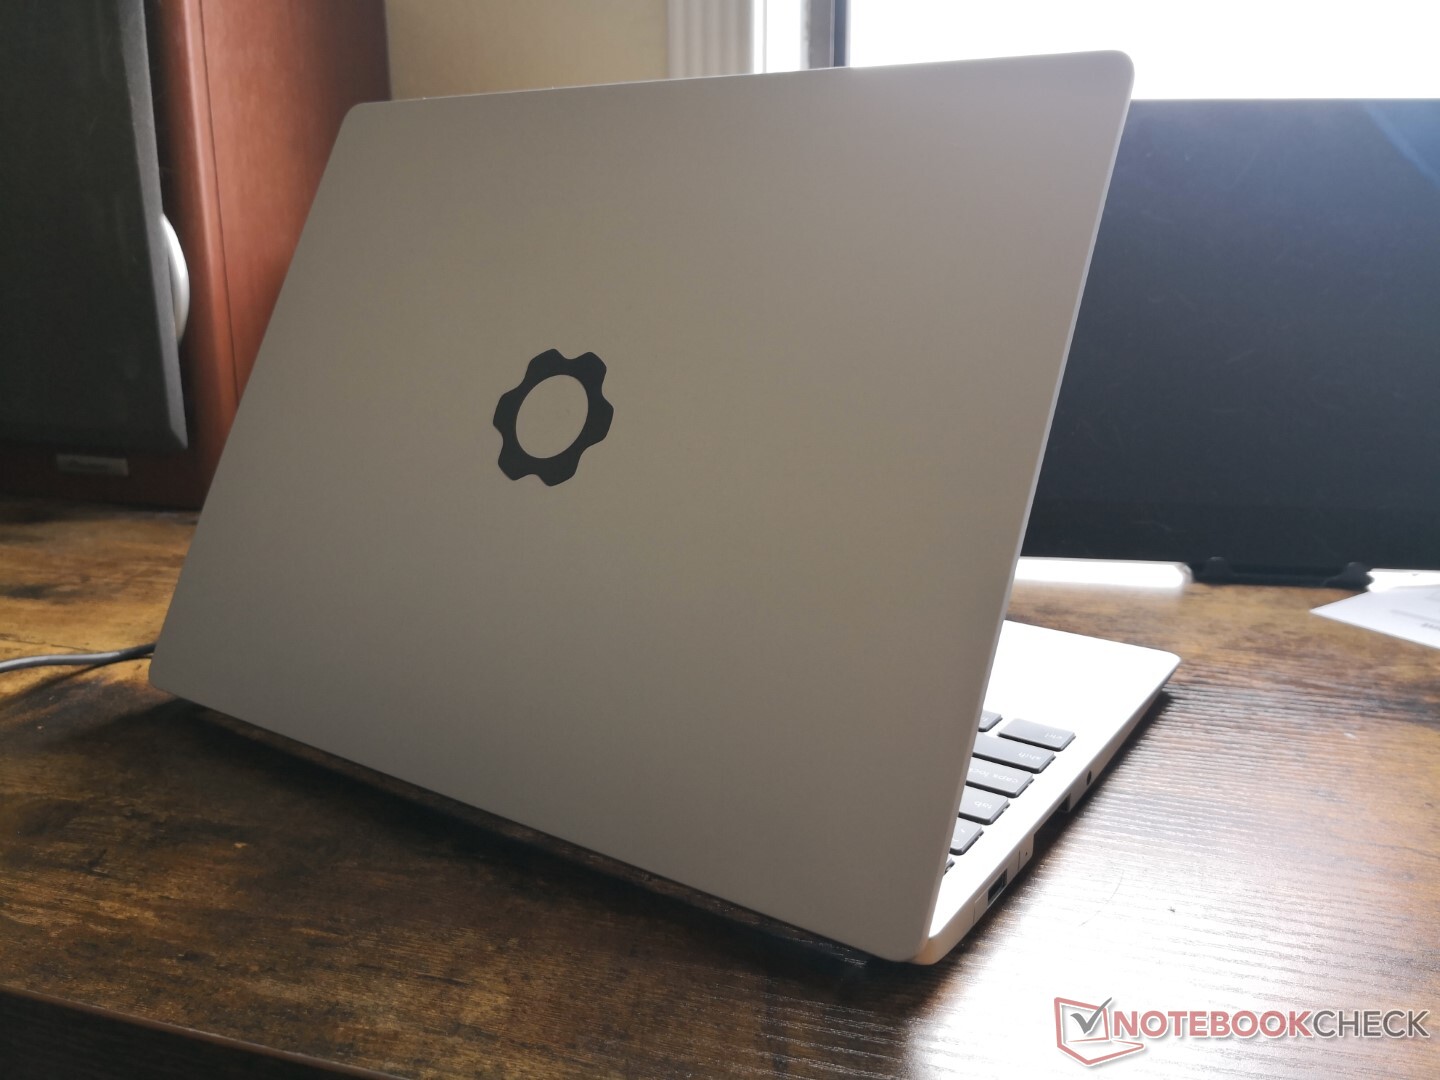
Det finns saker med Framework Laptop som kunde varit bättre. I synnerhet är locket och gångjärnen svagare än på konkurrenter som Dell XPS 13, HP Spectre x360 14, Microsoft Surface Laptop eller Lenovo ThinkBook. Vidare låter fläkten mer vid högre belastning. Inget av detta är avgörande, men fastare gångjärn, en större och tystare kyllösning samt förstärkt glas från kant till kant till skärmen hade gjort Framework ännu bättre.
Framework Laptop 13.5
- 07/26/2021 v7 (old)
Allen Ngo
Price comparison
