Test: Asus VivoBook S15 S533EQ - Elegant allt-i-allo med svag hårdvara (Sammanfattning)
Testgrupp
Gradering | Datum | Modell | Vikt | Höjd | Storlek | Upplösning | Pris |
|---|---|---|---|---|---|---|---|
| 83.4 % v7 (old) | 01/2021 | Asus VivoBook S15 S533EQ-BQ002T i7-1165G7, GeForce MX350 | 1.8 kg | 16.1 mm | 15.60" | 1920x1080 | |
| 83 % v7 (old) | 07/2020 | Lenovo IdeaPad 5 15IIL05 i5-1035G1, GeForce MX350 | 1.7 kg | 17.9 mm | 15.60" | 1920x1080 | |
| 87.7 % v7 (old) | 12/2020 | Schenker Vision 15 i7-1165G7, Iris Xe G7 96EUs | 1.7 kg | 15 mm | 15.60" | 1920x1080 | |
| 81.7 % v7 (old) | Samsung Galaxy Book Ion Aura Silver i7-10510U, GeForce MX250 | 1.3 kg | 15 mm | 15.60" | 1920x1080 |

Portar
| SD Card Reader | |
| average JPG Copy Test (av. of 3 runs) | |
| Genomsnitt av klass Multimedia (23 - 531, n=43, senaste 2 åren) | |
| Samsung Galaxy Book Ion Aura Silver (Toshiba Exceria Pro M501 microSDXC 64GB) | |
| Asus VivoBook S15 S533EQ-BQ002T (Toshiba Exceria Pro M501 microSDXC 64GB) | |
| Lenovo IdeaPad 5 15IIL05 (Toshiba Exceria Pro SDXC 64 GB UHS-II) | |
| maximum AS SSD Seq Read Test (1GB) | |
| Genomsnitt av klass Multimedia (27.9 - 1455, n=42, senaste 2 åren) | |
| Samsung Galaxy Book Ion Aura Silver (Toshiba Exceria Pro M501 microSDXC 64GB) | |
| Lenovo IdeaPad 5 15IIL05 (Toshiba Exceria Pro SDXC 64 GB UHS-II) | |
| Asus VivoBook S15 S533EQ-BQ002T (Toshiba Exceria Pro M501 microSDXC 64GB) | |
| Networking | |
| iperf3 transmit AX12 | |
| Samsung Galaxy Book Ion Aura Silver | |
| Schenker Vision 15 | |
| Genomsnitt Intel Wi-Fi 6 AX201 (49.8 - 1775, n=324) | |
| Asus VivoBook S15 S533EQ-BQ002T | |
| Lenovo IdeaPad 5 15IIL05 | |
| iperf3 receive AX12 | |
| Samsung Galaxy Book Ion Aura Silver | |
| Schenker Vision 15 | |
| Genomsnitt Intel Wi-Fi 6 AX201 (136 - 1743, n=324) | |
| Asus VivoBook S15 S533EQ-BQ002T | |
| Lenovo IdeaPad 5 15IIL05 | |


| |||||||||||||||||||||||||
Distribution av ljusstyrkan: 84 %
Mitt på batteriet: 291 cd/m²
Kontrast: 563:1 (Svärta: 0.51 cd/m²)
ΔE ColorChecker Calman: 4.72 | ∀{0.5-29.43 Ø4.73}
calibrated: 3.74
ΔE Greyscale Calman: 2.2 | ∀{0.09-98 Ø4.97}
58% sRGB (Argyll 1.6.3 3D)
37% AdobeRGB 1998 (Argyll 1.6.3 3D)
40.33% AdobeRGB 1998 (Argyll 3D)
58.5% sRGB (Argyll 3D)
39.01% Display P3 (Argyll 3D)
Gamma: 2.51
CCT: 6758 K
| Asus VivoBook S15 S533EQ-BQ002T Panda LM156LF-5L04, IPS, 1920x1080, 15.6" | Lenovo IdeaPad 5 15IIL05 AU Optronics B156HAN02.1, IPS, 1920x1080, 15.6" | Schenker Vision 15 BOE08F5, IPS, 1920x1080, 15.6" | Samsung Galaxy Book Ion Aura Silver BOE0889, QLED, 1920x1080, 15.6" | |
|---|---|---|---|---|
| Display | -4% | 72% | 114% | |
| Display P3 Coverage (%) | 39.01 | 37.63 -4% | 69.3 78% | 99.1 154% |
| sRGB Coverage (%) | 58.5 | 56.5 -3% | 94 61% | 99.9 71% |
| AdobeRGB 1998 Coverage (%) | 40.33 | 38.88 -4% | 70.8 76% | 87.3 116% |
| Response Times | -6% | -51% | -18% | |
| Response Time Grey 50% / Grey 80% * (ms) | 38 ? | 42 ? -11% | 60 ? -58% | 49 ? -29% |
| Response Time Black / White * (ms) | 27 ? | 27 ? -0% | 39 ? -44% | 29 ? -7% |
| PWM Frequency (Hz) | ||||
| Screen | 2% | 52% | 67% | |
| Brightness middle (cd/m²) | 287 | 340 18% | 478 67% | 467 63% |
| Brightness (cd/m²) | 261 | 325 25% | 462 77% | 437 67% |
| Brightness Distribution (%) | 84 | 88 5% | 94 12% | 91 8% |
| Black Level * (cd/m²) | 0.51 | 0.27 47% | 0.27 47% | 0.27 47% |
| Contrast (:1) | 563 | 1259 124% | 1770 214% | 1730 207% |
| Colorchecker dE 2000 * | 4.72 | 6.62 -40% | 3.2 32% | 3.39 28% |
| Colorchecker dE 2000 max. * | 17.94 | 21.05 -17% | 8.4 53% | 6.27 65% |
| Colorchecker dE 2000 calibrated * | 3.74 | 4.71 -26% | 2 47% | |
| Greyscale dE 2000 * | 2.2 | 4.61 -110% | 4.5 -105% | 2.17 1% |
| Gamma | 2.51 88% | 2.74 80% | 2.16 102% | 2.45 90% |
| CCT | 6758 96% | 6262 104% | 6788 96% | 6488 100% |
| Color Space (Percent of AdobeRGB 1998) (%) | 37 | 36 -3% | 63.1 71% | 78 111% |
| Color Space (Percent of sRGB) (%) | 58 | 56 -3% | 93.6 61% | 100 72% |
| Totalt genomsnitt (program/inställningar) | -3% /
-0% | 24% /
43% | 54% /
65% |
* ... mindre är bättre
Visa svarstider
| ↔ Svarstid svart till vitt | ||
|---|---|---|
| 27 ms ... stiga ↗ och falla ↘ kombinerat | ↗ 15 ms stiga | 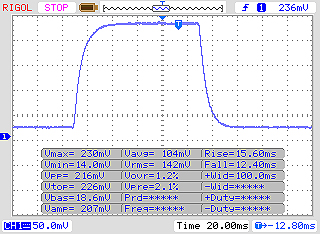 |
| ↘ 12 ms hösten | ||
| Skärmen visar relativt långsamma svarsfrekvenser i våra tester och kan vara för långsam för spelare. I jämförelse sträcker sig alla testade enheter från 0.1 (minst) till 240 (maximalt) ms. » 67 % av alla enheter är bättre. Detta innebär att den uppmätta svarstiden är sämre än genomsnittet av alla testade enheter (19.9 ms). | ||
| ↔ Svarstid 50 % grått till 80 % grått | ||
| 38 ms ... stiga ↗ och falla ↘ kombinerat | ↗ 19 ms stiga | 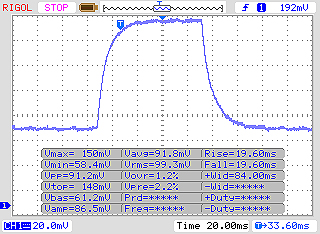 |
| ↘ 19 ms hösten | ||
| Skärmen visar långsamma svarsfrekvenser i våra tester och kommer att vara otillfredsställande för spelare. I jämförelse sträcker sig alla testade enheter från 0.165 (minst) till 636 (maximalt) ms. » 55 % av alla enheter är bättre. Detta innebär att den uppmätta svarstiden är sämre än genomsnittet av alla testade enheter (31.1 ms). | ||
Skärmflimmer / PWM (Puls-Width Modulation)
| Skärmflimmer / PWM upptäcktes inte | 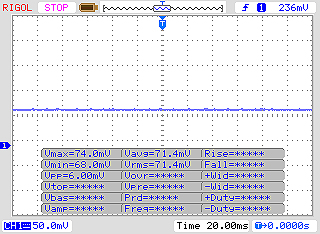 | ||
Som jämförelse: 52 % av alla testade enheter använder inte PWM för att dämpa skärmen. Om PWM upptäcktes mättes ett medelvärde av 7798 (minst: 5 - maximum: 343500) Hz. | |||
| Cinebench R15 | |
| CPU Single 64Bit | |
| Genomsnitt av klass Multimedia (184.8 - 326, n=66, senaste 2 åren) | |
| Schenker Vision 15 | |
| Asus VivoBook S15 S533EQ-BQ002T | |
| Genomsnitt Intel Core i7-1165G7 (115 - 230, n=78) | |
| Samsung Galaxy Book Ion Aura Silver | |
| Lenovo IdeaPad 5 15IIL05 | |
| CPU Multi 64Bit | |
| Genomsnitt av klass Multimedia (856 - 5224, n=68, senaste 2 åren) | |
| Schenker Vision 15 | |
| Asus VivoBook S15 S533EQ-BQ002T (Leistungsmodus) | |
| Asus VivoBook S15 S533EQ-BQ002T | |
| Genomsnitt Intel Core i7-1165G7 (553 - 1027, n=86) | |
| Lenovo IdeaPad 5 15IIL05 | |
| Samsung Galaxy Book Ion Aura Silver | |
| Blender - v2.79 BMW27 CPU | |
| Samsung Galaxy Book Ion Aura Silver | |
| Genomsnitt Intel Core i7-1165G7 (468 - 1138, n=80) | |
| Lenovo IdeaPad 5 15IIL05 | |
| Asus VivoBook S15 S533EQ-BQ002T | |
| Schenker Vision 15 | |
| Asus VivoBook S15 S533EQ-BQ002T (Leistungsmodus) | |
| Genomsnitt av klass Multimedia (100 - 557, n=65, senaste 2 åren) | |
| 7-Zip 18.03 | |
| 7z b 4 -mmt1 | |
| Genomsnitt av klass Multimedia (3666 - 7545, n=63, senaste 2 åren) | |
| Asus VivoBook S15 S533EQ-BQ002T (Leistungsmodus) | |
| Asus VivoBook S15 S533EQ-BQ002T | |
| Genomsnitt Intel Core i7-1165G7 (4478 - 5507, n=80) | |
| Schenker Vision 15 | |
| Samsung Galaxy Book Ion Aura Silver | |
| Lenovo IdeaPad 5 15IIL05 | |
| 7z b 4 | |
| Genomsnitt av klass Multimedia (29095 - 130368, n=62, senaste 2 åren) | |
| Schenker Vision 15 | |
| Asus VivoBook S15 S533EQ-BQ002T (Leistungsmodus) | |
| Asus VivoBook S15 S533EQ-BQ002T | |
| Genomsnitt Intel Core i7-1165G7 (15347 - 27405, n=80) | |
| Lenovo IdeaPad 5 15IIL05 | |
| Samsung Galaxy Book Ion Aura Silver | |
| Cinebench R20 | |
| CPU (Single Core) | |
| Genomsnitt av klass Multimedia (425 - 853, n=64, senaste 2 åren) | |
| Asus VivoBook S15 S533EQ-BQ002T | |
| Asus VivoBook S15 S533EQ-BQ002T (Leistungsmodus) | |
| Genomsnitt Intel Core i7-1165G7 (442 - 589, n=81) | |
| Schenker Vision 15 | |
| Samsung Galaxy Book Ion Aura Silver | |
| Lenovo IdeaPad 5 15IIL05 | |
| CPU (Multi Core) | |
| Genomsnitt av klass Multimedia (1887 - 12912, n=64, senaste 2 åren) | |
| Asus VivoBook S15 S533EQ-BQ002T (Leistungsmodus) | |
| Asus VivoBook S15 S533EQ-BQ002T | |
| Schenker Vision 15 | |
| Genomsnitt Intel Core i7-1165G7 (1060 - 2657, n=81) | |
| Lenovo IdeaPad 5 15IIL05 | |
| Samsung Galaxy Book Ion Aura Silver | |
| Geekbench 5.5 | |
| Single-Core | |
| Genomsnitt av klass Multimedia (805 - 2974, n=62, senaste 2 åren) | |
| Schenker Vision 15 | |
| Asus VivoBook S15 S533EQ-BQ002T | |
| Asus VivoBook S15 S533EQ-BQ002T | |
| Genomsnitt Intel Core i7-1165G7 (1302 - 1595, n=77) | |
| Samsung Galaxy Book Ion Aura Silver | |
| Lenovo IdeaPad 5 15IIL05 | |
| Multi-Core | |
| Genomsnitt av klass Multimedia (4652 - 20422, n=62, senaste 2 åren) | |
| Schenker Vision 15 | |
| Genomsnitt Intel Core i7-1165G7 (3078 - 5926, n=77) | |
| Asus VivoBook S15 S533EQ-BQ002T | |
| Asus VivoBook S15 S533EQ-BQ002T | |
| Lenovo IdeaPad 5 15IIL05 | |
| Samsung Galaxy Book Ion Aura Silver | |
| HWBOT x265 Benchmark v2.2 - 4k Preset | |
| Genomsnitt av klass Multimedia (5.26 - 36.1, n=63, senaste 2 åren) | |
| Schenker Vision 15 | |
| Asus VivoBook S15 S533EQ-BQ002T (Leistungsmodus) | |
| Lenovo IdeaPad 5 15IIL05 | |
| Genomsnitt Intel Core i7-1165G7 (1.39 - 8.47, n=80) | |
| Asus VivoBook S15 S533EQ-BQ002T | |
| Samsung Galaxy Book Ion Aura Silver | |
| LibreOffice - 20 Documents To PDF | |
| Samsung Galaxy Book Ion Aura Silver | |
| Lenovo IdeaPad 5 15IIL05 | |
| Genomsnitt av klass Multimedia (23.9 - 146.7, n=64, senaste 2 åren) | |
| Genomsnitt Intel Core i7-1165G7 (21.5 - 88.1, n=78) | |
| Schenker Vision 15 | |
| Asus VivoBook S15 S533EQ-BQ002T | |
| Asus VivoBook S15 S533EQ-BQ002T (Leistungsmodus) | |
| R Benchmark 2.5 - Overall mean | |
| Lenovo IdeaPad 5 15IIL05 | |
| Samsung Galaxy Book Ion Aura Silver | |
| Genomsnitt Intel Core i7-1165G7 (0.552 - 1.002, n=80) | |
| Asus VivoBook S15 S533EQ-BQ002T (Leistungsmodus) | |
| Schenker Vision 15 | |
| Asus VivoBook S15 S533EQ-BQ002T | |
| Genomsnitt av klass Multimedia (0.3604 - 0.947, n=63, senaste 2 åren) | |
* ... mindre är bättre
| PCMark 8 Home Score Accelerated v2 | 4141 poäng | |
| PCMark 8 Creative Score Accelerated v2 | 4792 poäng | |
| PCMark 8 Work Score Accelerated v2 | 5681 poäng | |
| PCMark 10 Score | 5306 poäng | |
Hjälp | ||
| PCMark 8 - Home Score Accelerated v2 | |
| Genomsnitt av klass Multimedia (n=1senaste 2 åren) | |
| Schenker Vision 15 | |
| Genomsnitt Intel Core i7-1165G7, NVIDIA GeForce MX350 (4141 - 4878, n=2) | |
| Asus VivoBook S15 S533EQ-BQ002T | |
| Lenovo IdeaPad 5 15IIL05 | |
| Samsung Galaxy Book Ion Aura Silver | |
| DPC Latencies / LatencyMon - interrupt to process latency (max), Web, Youtube, Prime95 | |
| Schenker Vision 15 | |
| Samsung Galaxy Book Ion Aura Silver | |
| Lenovo IdeaPad 5 15IIL05 | |
| Asus VivoBook S15 S533EQ-BQ002T | |
* ... mindre är bättre

| Asus VivoBook S15 S533EQ-BQ002T Intel SSD 660p 1TB SSDPEKNW010T8 | Lenovo IdeaPad 5 15IIL05 SK hynix BC511 HFM512GDHTNI-87A0B | Schenker Vision 15 Samsung SSD 980 Pro 1TB MZ-V8P1T0BW | Samsung Galaxy Book Ion Aura Silver WDC PC SN730 SDBQNTY-512GB | Genomsnitt Intel SSD 660p 1TB SSDPEKNW010T8 | Genomsnitt av klass Multimedia | |
|---|---|---|---|---|---|---|
| CrystalDiskMark 5.2 / 6 | -21% | 107% | 20% | -17% | 60% | |
| Write 4K (MB/s) | 214.4 | 159.7 -26% | 238.1 11% | 196.3 -8% | 144.5 ? -33% | 163.8 ? -24% |
| Read 4K (MB/s) | 58.5 | 48.31 -17% | 79.2 35% | 54.2 -7% | 54.1 ? -8% | 67.5 ? 15% |
| Write Seq (MB/s) | 1678 | 1038 -38% | 4139 147% | 2194 31% | 1445 ? -14% | 2715 ? 62% |
| Read Seq (MB/s) | 1648 | 1158 -30% | 4133 151% | 2508 52% | 1446 ? -12% | 3120 ? 89% |
| Write 4K Q32T1 (MB/s) | 644 | 493.9 -23% | 697 8% | 423.8 -34% | 427 ? -34% | 454 ? -30% |
| Read 4K Q32T1 (MB/s) | 600 | 522 -13% | 758 26% | 547 -9% | 456 ? -24% | 581 ? -3% |
| Write Seq Q32T1 (MB/s) | 1760 | 1028 -42% | 5187 195% | 2705 54% | 1650 ? -6% | 4593 ? 161% |
| Read Seq Q32T1 (MB/s) | 1853 | 2280 23% | 7117 284% | 3405 84% | 1728 ? -7% | 5776 ? 212% |
| AS SSD | -8% | 130% | 20% | -9% | 78% | |
| Seq Read (MB/s) | 1754 | 1625 -7% | 5427 209% | 2901 65% | 1456 ? -17% | 4442 ? 153% |
| Seq Write (MB/s) | 1567 | 860 -45% | 3886 148% | 2289 46% | 1404 ? -10% | 3060 ? 95% |
| 4K Read (MB/s) | 53 | 52.1 -2% | 72.9 38% | 46.57 -12% | 48.7 ? -8% | 61.2 ? 15% |
| 4K Write (MB/s) | 167.9 | 131.3 -22% | 219.3 31% | 137.1 -18% | 131.6 ? -22% | 185.6 ? 11% |
| 4K-64 Read (MB/s) | 586 | 797 36% | 2209 277% | 772 32% | 586 ? 0% | 1085 ? 85% |
| 4K-64 Write (MB/s) | 858 | 769 -10% | 2265 164% | 1245 45% | 788 ? -8% | 2213 ? 158% |
| Access Time Read * (ms) | 0.097 | 0.063 35% | 0.033 66% | 0.142 -46% | 0.07236 ? 25% | 0.05759 ? 41% |
| Access Time Write * (ms) | 0.038 | 0.032 16% | 0.02 47% | 0.028 26% | 0.07731 ? -103% | 0.07513 ? -98% |
| Score Read (Points) | 815 | 1012 24% | 2825 247% | 1108 36% | 780 ? -4% | 1590 ? 95% |
| Score Write (Points) | 1182 | 986 -17% | 2873 143% | 1611 36% | 1060 ? -10% | 2705 ? 129% |
| Score Total (Points) | 2421 | 2492 3% | 7069 192% | 3266 35% | 2252 ? -7% | 5052 ? 109% |
| Copy ISO MB/s (MB/s) | 1477 | 638 -57% | 2775 88% | 1597 8% | 1469 ? -1% | 2777 ? 88% |
| Copy Program MB/s (MB/s) | 495.3 | 290.2 -41% | 662 34% | 494.8 0% | 484 ? -2% | 852 ? 72% |
| Copy Game MB/s (MB/s) | 719 | 525 -27% | 1655 130% | 879 22% | 997 ? 39% | 1723 ? 140% |
| Totalt genomsnitt (program/inställningar) | -15% /
-13% | 119% /
121% | 20% /
20% | -13% /
-12% | 69% /
72% |
* ... mindre är bättre
DiskSpd Read Loop, Queue Depth 8
| 3DMark 11 Performance | 6645 poäng | |
| 3DMark Ice Storm Standard Score | 74675 poäng | |
| 3DMark Cloud Gate Standard Score | 17289 poäng | |
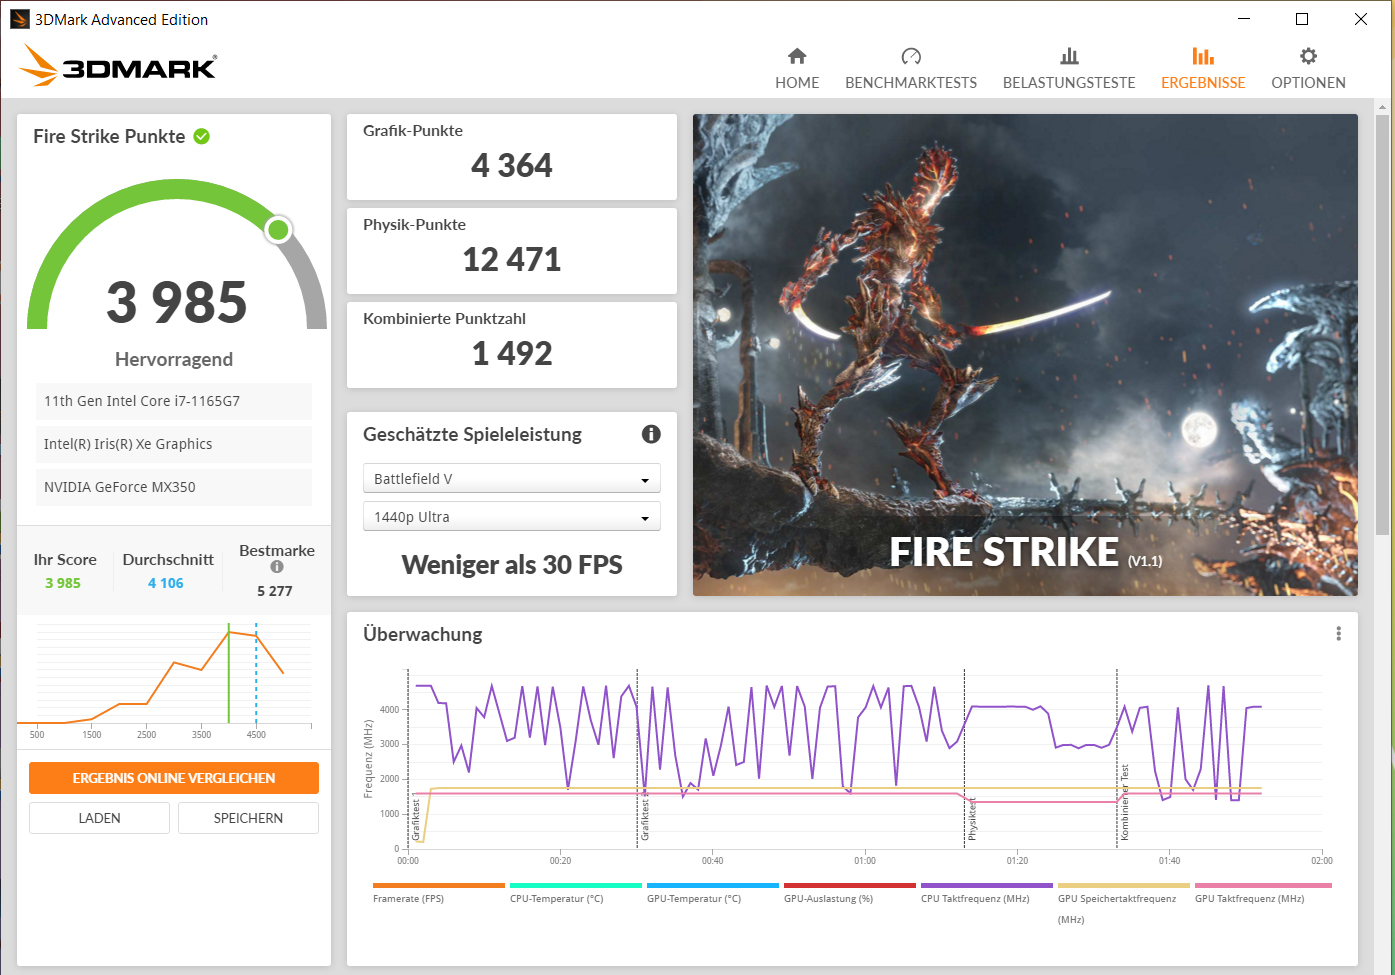
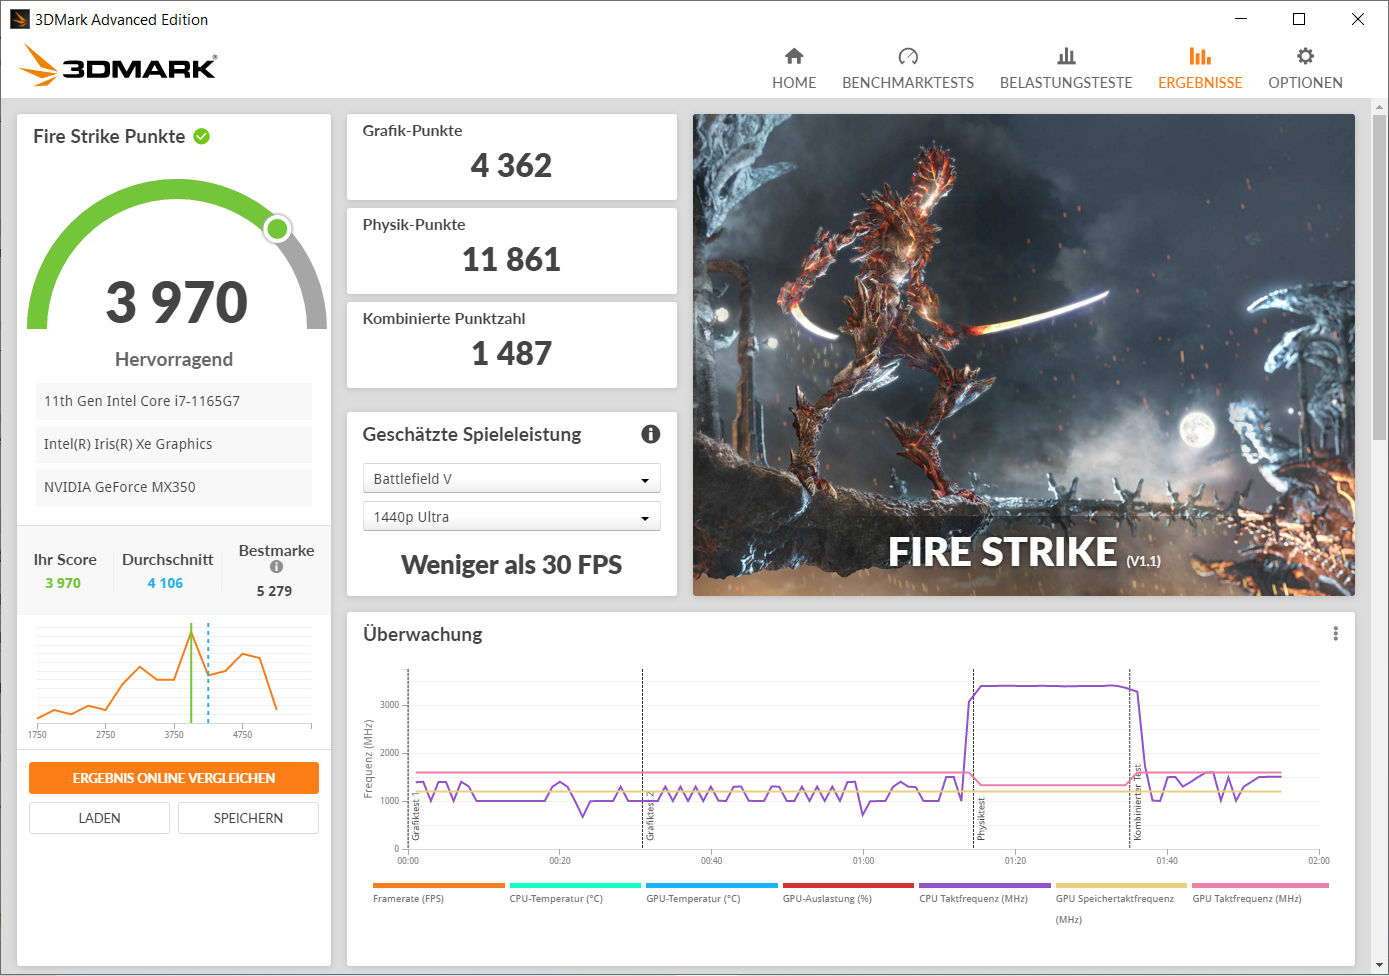
| 3DMark Fire Strike Score | 3985 poäng | |
| 3DMark Time Spy Score | 1485 poäng | |
Hjälp | ||
| 3DMark 11 - 1280x720 Performance GPU | |
| Genomsnitt av klass Multimedia (3765 - 60002, n=62, senaste 2 åren) | |
| Schenker Vision 15 | |
| Lenovo IdeaPad 5 15IIL05 | |
| Asus VivoBook S15 S533EQ-BQ002T | |
| Genomsnitt NVIDIA GeForce MX350 (5191 - 6540, n=13) | |
| Samsung Galaxy Book Ion Aura Silver | |
| 3DMark | |
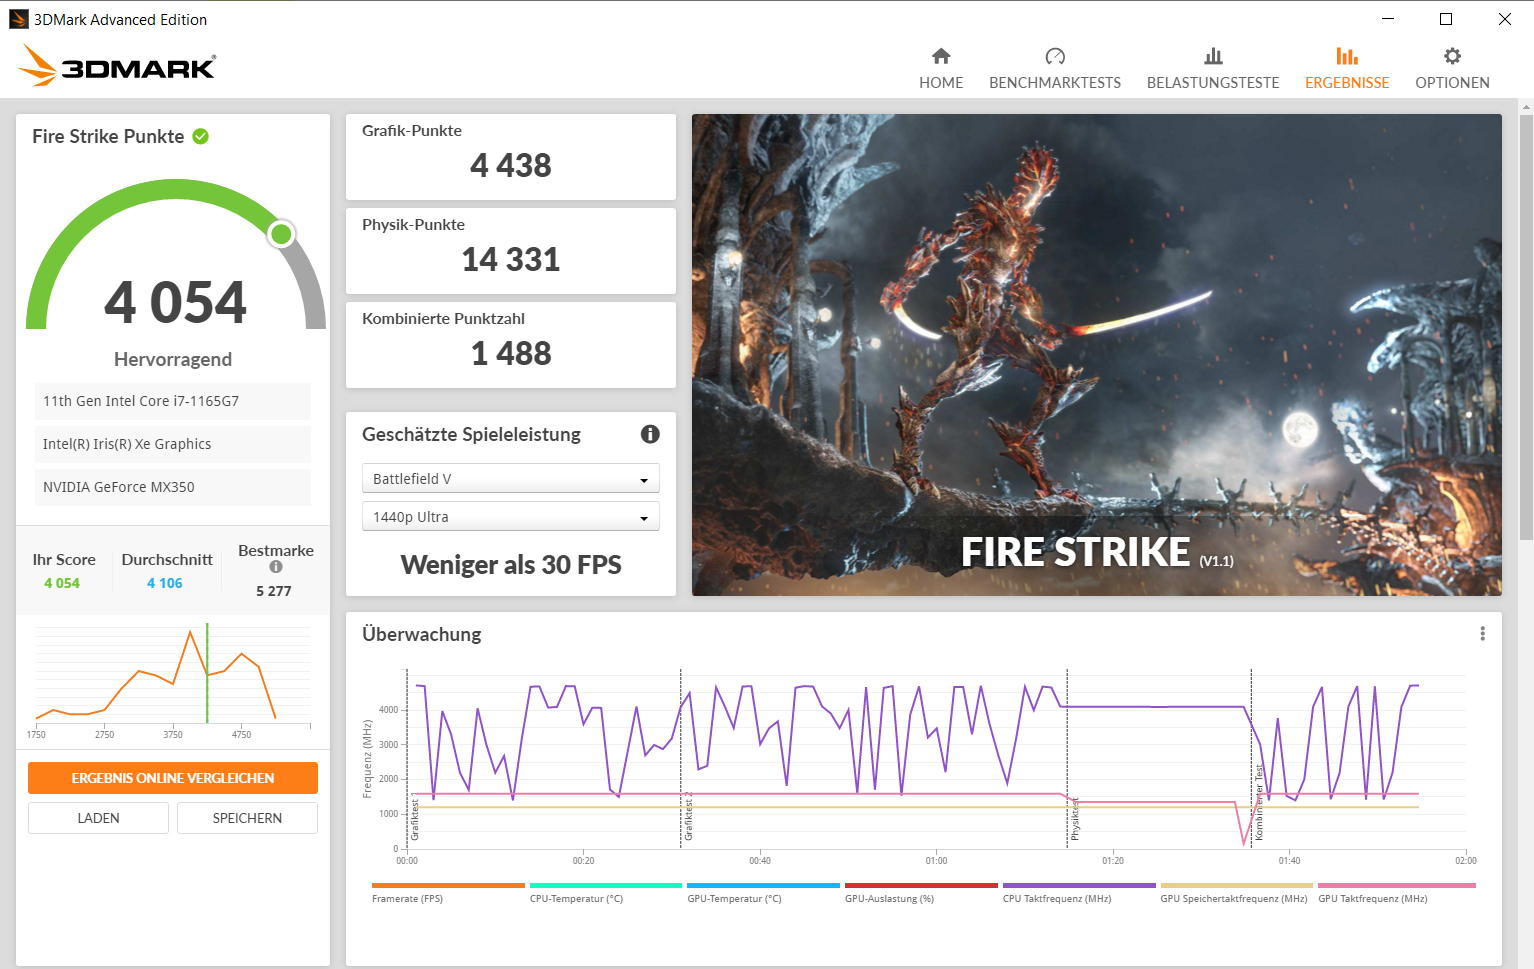
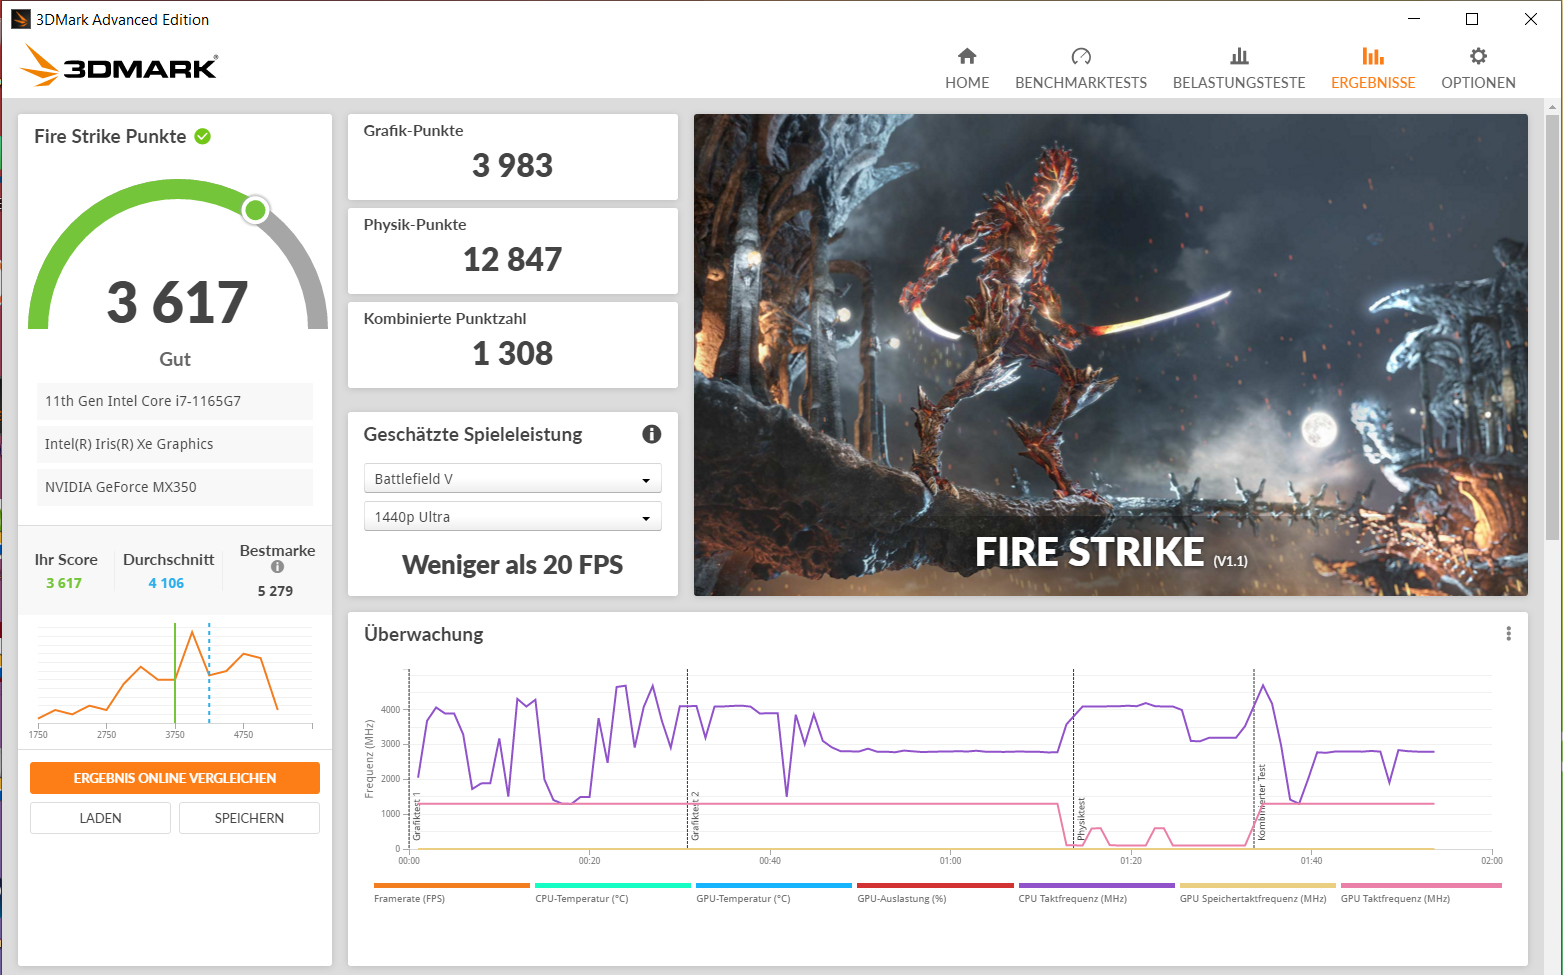
| 1920x1080 Fire Strike Graphics | |
| Genomsnitt av klass Multimedia (2328 - 48907, n=66, senaste 2 åren) | |
| Schenker Vision 15 | |
| Lenovo IdeaPad 5 15IIL05 | |
| Asus VivoBook S15 S533EQ-BQ002T (Leistungsmodus) | |
| Genomsnitt NVIDIA GeForce MX350 (3999 - 4656, n=14) | |
| Asus VivoBook S15 S533EQ-BQ002T | |
| Samsung Galaxy Book Ion Aura Silver | |
| 1280x720 Cloud Gate Standard Graphics | |
| Genomsnitt av klass Multimedia (16765 - 143501, n=34, senaste 2 åren) | |
| Asus VivoBook S15 S533EQ-BQ002T | |
| Genomsnitt NVIDIA GeForce MX350 (23194 - 26239, n=9) | |
| Lenovo IdeaPad 5 15IIL05 | |
| Samsung Galaxy Book Ion Aura Silver | |
| 2560x1440 Time Spy Graphics | |
| Genomsnitt av klass Multimedia (696 - 19403, n=67, senaste 2 åren) | |
| Schenker Vision 15 | |
| Lenovo IdeaPad 5 15IIL05 | |
| Asus VivoBook S15 S533EQ-BQ002T (Leistungsmodus) | |
| Asus VivoBook S15 S533EQ-BQ002T | |
| Genomsnitt NVIDIA GeForce MX350 (1123 - 1595, n=12) | |
| Samsung Galaxy Book Ion Aura Silver | |
| The Witcher 3 - 1366x768 Medium Graphics & Postprocessing | |
| Genomsnitt av klass Multimedia (41 - 93, n=4, senaste 2 åren) | |
| Schenker Vision 15 | |
| Asus VivoBook S15 S533EQ-BQ002T | |
| Asus VivoBook S15 S533EQ-BQ002T (Leistungsmodus) | |
| Lenovo IdeaPad 5 15IIL05 | |
| Genomsnitt NVIDIA GeForce MX350 (35.2 - 51.9, n=13) | |
| Samsung Galaxy Book Ion Aura Silver | |
| Dota 2 Reborn - 1920x1080 ultra (3/3) best looking | |
| Genomsnitt av klass Multimedia (29 - 179.9, n=68, senaste 2 åren) | |
| Lenovo IdeaPad 5 15IIL05 | |
| Asus VivoBook S15 S533EQ-BQ002T | |
| Asus VivoBook S15 S533EQ-BQ002T (Leistungsmodus) | |
| Genomsnitt NVIDIA GeForce MX350 (52.3 - 80.6, n=14) | |
| Samsung Galaxy Book Ion Aura Silver | |
| Schenker Vision 15 | |
| X-Plane 11.11 - 1920x1080 med (fps_test=2) | |
| Genomsnitt av klass Multimedia (18.7 - 177.4, n=63, senaste 2 åren) | |
| Asus VivoBook S15 S533EQ-BQ002T (Leistungsmodus) | |
| Genomsnitt NVIDIA GeForce MX350 (35.5 - 72.3, n=14) | |
| Asus VivoBook S15 S533EQ-BQ002T | |
| Lenovo IdeaPad 5 15IIL05 | |
| Samsung Galaxy Book Ion Aura Silver | |
| Schenker Vision 15 | |
| F1 2020 - 1920x1080 Medium Preset AF:16x | |
| Schenker Vision 15 | |
| Genomsnitt NVIDIA GeForce MX350 (48.3 - 49, n=2) | |
| Asus VivoBook S15 S533EQ-BQ002T (712959) | |
| Serious Sam 4 - 1280x720 Lowest (DX12) | |
| Genomsnitt NVIDIA GeForce MX350 (67.4 - 107, n=4) | |
| Asus VivoBook S15 S533EQ-BQ002T (Leistungsmodus) | |
| Asus VivoBook S15 S533EQ-BQ002T | |
| Immortals Fenyx Rising - 1280x720 Very Low Preset | |
| Genomsnitt NVIDIA GeForce MX350 (38 - 47, n=4) | |
| Asus VivoBook S15 S533EQ-BQ002T | |
| Asus VivoBook S15 S533EQ-BQ002T (Leistungsmodus) | |
| Crysis Remastered - 1280x720 Low Preset | |
| Asus VivoBook S15 S533EQ-BQ002T | |
| Genomsnitt NVIDIA GeForce MX350 (76.2 - 81.5, n=2) | |
| Star Wars Squadrons - 1920x1080 High Preset | |
| Asus VivoBook S15 S533EQ-BQ002T | |
| Genomsnitt NVIDIA GeForce MX350 (49.5 - 52.9, n=2) | |
| Mafia Definitive Edition - 1280x720 Low Preset | |
| Genomsnitt NVIDIA GeForce MX350 (45.3 - 49.6, n=2) | |
| Asus VivoBook S15 S533EQ-BQ002T | |
| låg | med. | hög | ultra | |
|---|---|---|---|---|
| The Witcher 3 (2015) | 79.6 | 46.9 | 27 | 15.6 |
| Dota 2 Reborn (2015) | 138 | 120 | 84.1 | 76.3 |
| X-Plane 11.11 (2018) | 74.5 | 52 | 36.5 | |
| F1 2020 (2020) | 98.7 | 48.3 | 33 | 20.3 |
| Death Stranding (2020) | 40.3 | 20.5 | 18.7 | 18.1 |
| Horizon Zero Dawn (2020) | 33 | 18 | 14 | 11 |
| Flight Simulator 2020 (2020) | 36.3 | 14.6 | 8.89 | |
| Crysis Remastered (2020) | 81.5 | 30.4 | 9.22 | |
| Serious Sam 4 (2020) | 67.4 | 12.8 | 8.05 | |
| Mafia Definitive Edition (2020) | 45.3 | 21.1 | 18.9 | |
| Star Wars Squadrons (2020) | 103 | 60 | 52.9 | 25.2 |
| Watch Dogs Legion (2020) | 36 | 20 | 15 | |
| Assassin´s Creed Valhalla (2020) | 17 | 13 | 6 | |
| Call of Duty Black Ops Cold War (2020) | 43 | 14.4 | 13.4 | |
| Yakuza Like a Dragon (2020) | 62.7 | 20.7 | 20.5 | 18 |
| Immortals Fenyx Rising (2020) | 38 | 14 | 10 | |
| Cyberpunk 2077 1.0 (2020) | 19 | 10.5 | 6.93 |
Ljudnivå
| Låg belastning |
| 25 / 25 / 25 dB(A) |
| Hög belastning |
| 39.5 / 41.6 dB(A) |
 | ||
30 dB tyst 40 dB(A) hörbar 50 dB(A) högt ljud |
||
min: | ||
(+) Den maximala temperaturen på ovansidan är 38.1 °C / 101 F, jämfört med genomsnittet av 36.8 °C / 98 F , allt från 21 till 71 °C för klassen Multimedia.
(±) Botten värms upp till maximalt 41.3 °C / 106 F, jämfört med genomsnittet av 39.1 °C / 102 F
(+) Vid tomgångsbruk är medeltemperaturen för ovansidan 23.9 °C / 75 F, jämfört med enhetsgenomsnittet på 31.3 °C / ### class_avg_f### F.
(±) När du spelar The Witcher 3 är medeltemperaturen för ovansidan 34.6 °C / 94 F, jämfört med enhetsgenomsnittet på 31.3 °C / ## #class_avg_f### F.
(+) Handledsstöden och pekplattan når maximal hudtemperatur (32 °C / 89.6 F) och är därför inte varma.
(-) Medeltemperaturen för handledsstödsområdet på liknande enheter var 28.7 °C / 83.7 F (-3.3 °C / -5.9 F).
Asus VivoBook S15 S533EQ-BQ002T ljudanalys
(±) | högtalarljudstyrkan är genomsnittlig men bra (79.8 dB)
Bas 100 - 315 Hz
(-) | nästan ingen bas - i genomsnitt 21.6% lägre än medianen
(±) | linjäriteten för basen är genomsnittlig (11.9% delta till föregående frekvens)
Mellan 400 - 2000 Hz
(±) | högre mellan - i genomsnitt 8.3% högre än median
(±) | linjäriteten för mids är genomsnittlig (7.5% delta till föregående frekvens)
Högsta 2 - 16 kHz
(+) | balanserade toppar - endast 3.5% från medianen
(±) | linjäriteten för toppar är genomsnittlig (7.4% delta till föregående frekvens)
Totalt 100 - 16 000 Hz
(±) | linjäriteten för det totala ljudet är genomsnittlig (20% skillnad mot median)
Jämfört med samma klass
» 66% av alla testade enheter i den här klassen var bättre, 8% liknande, 26% sämre
» Den bästa hade ett delta på 5%, genomsnittet var 17%, sämst var 45%
Jämfört med alla testade enheter
» 51% av alla testade enheter var bättre, 8% liknande, 41% sämre
» Den bästa hade ett delta på 4%, genomsnittet var 24%, sämst var 134%
| Av/Standby | |
| Låg belastning | |
| Hög belastning |
|
Förklaring:
min: | |
| Battery Runtime - WiFi Websurfing | |
| Schenker Vision 15 | |
| Genomsnitt av klass Multimedia (4.37 - 26.6, n=70, senaste 2 åren) | |
| Lenovo IdeaPad 5 15IIL05 | |
| Asus VivoBook S15 S533EQ-BQ002T | |
| Samsung Galaxy Book Ion Aura Silver | |
För
Emot
Läs den fullständiga versionen av den här recensionen på engelska här.
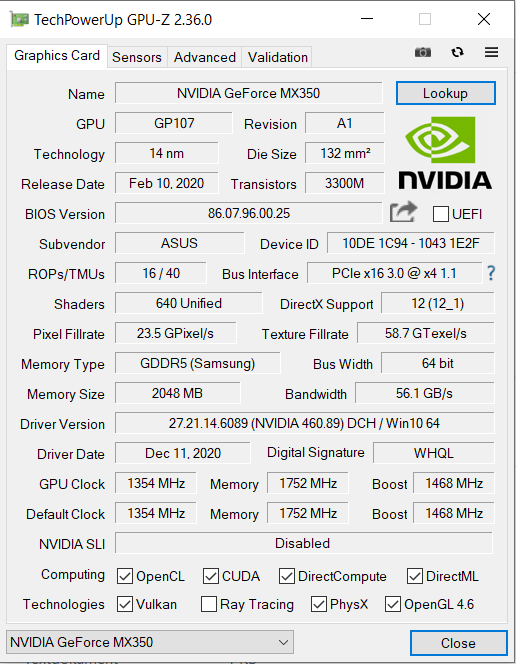
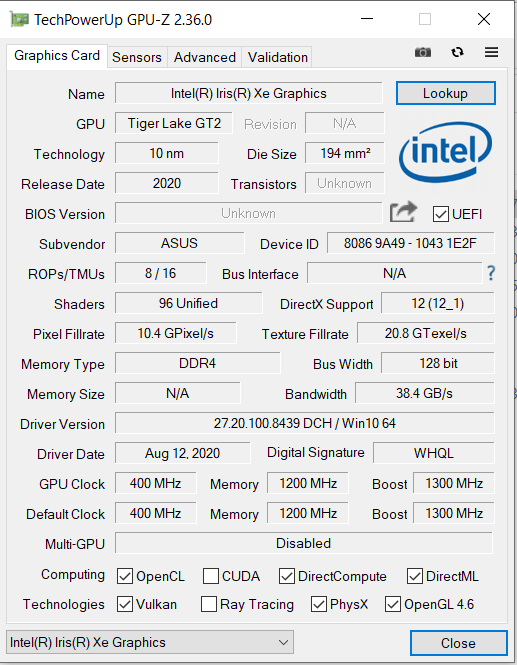
Tack vare en Core i7-1165G7 CPU och en GeForce MX350 GPU har VivoBook tillräckligt med prestanda för alla vanliga användningsområden. Grafikintensiva program kan dra nytta av MX350. Behövs inte maximal grafikprestanda går det istället att välja en billigare VivoBook utan dGPU. Skillnaden i prestanda mellan MX350 och Intels iGPU är inte särskilt stor.
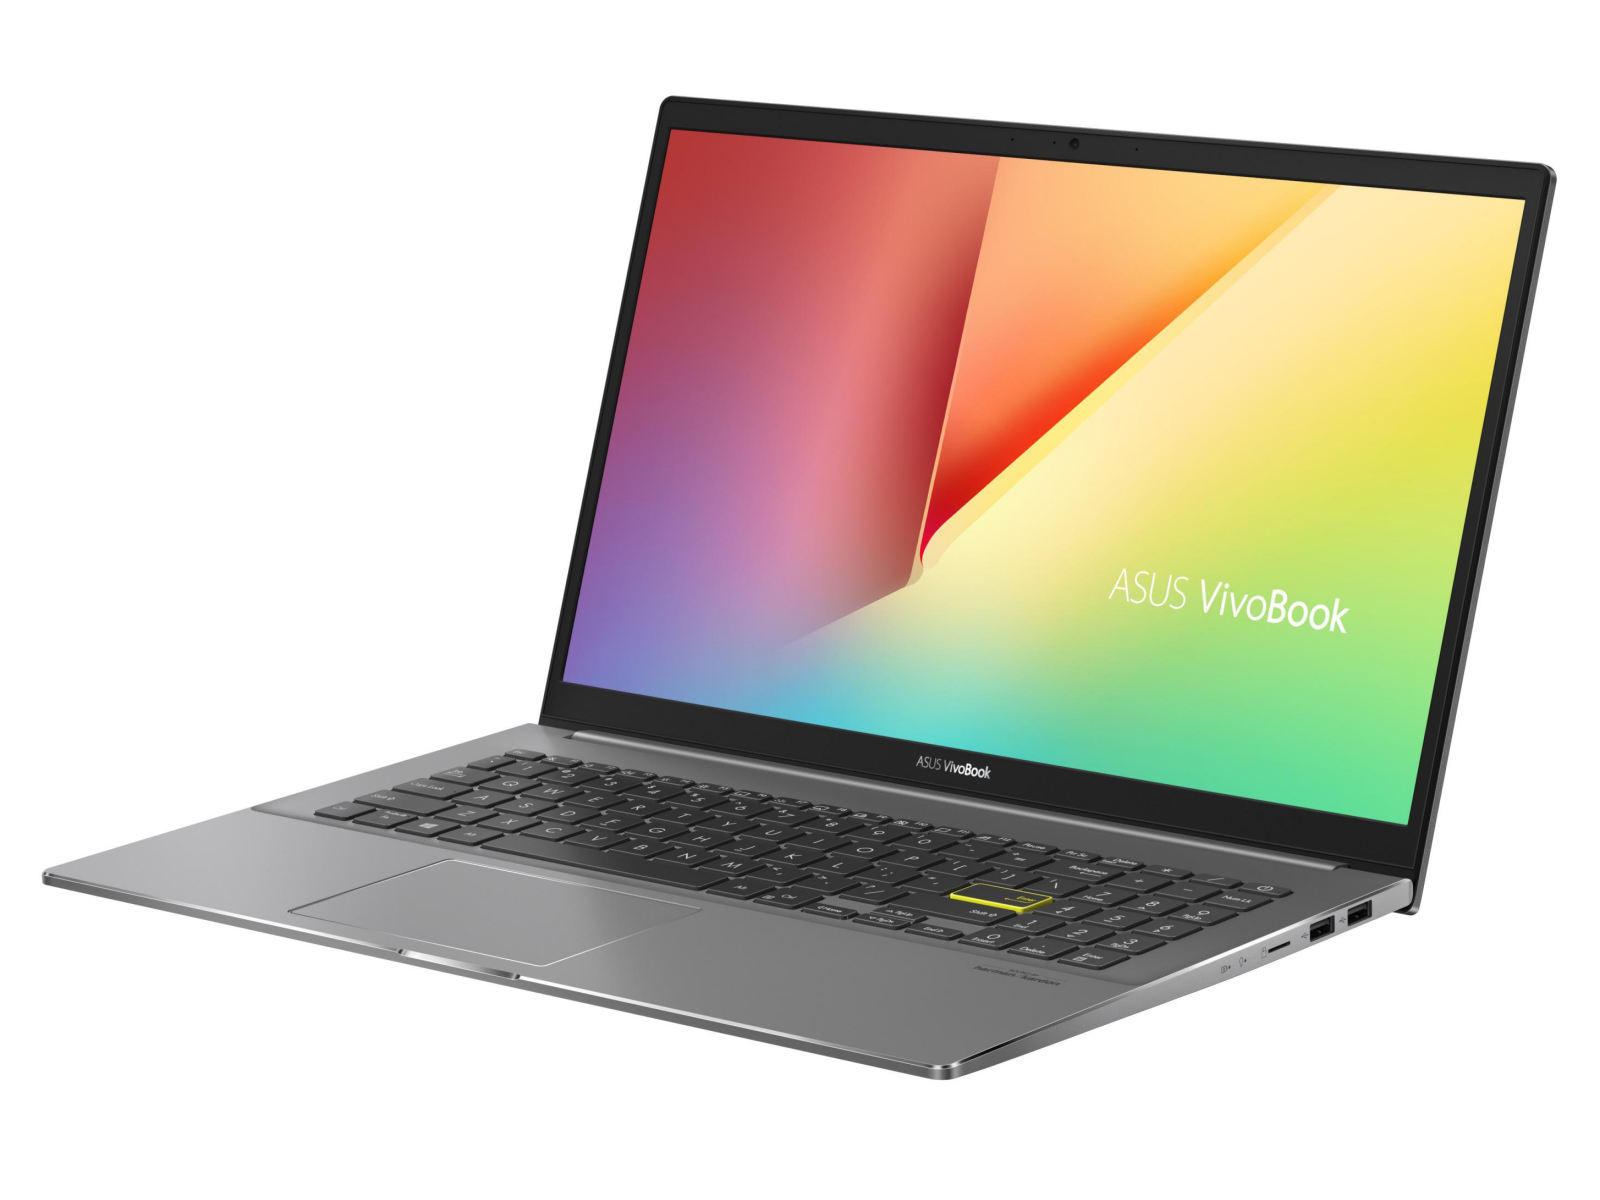
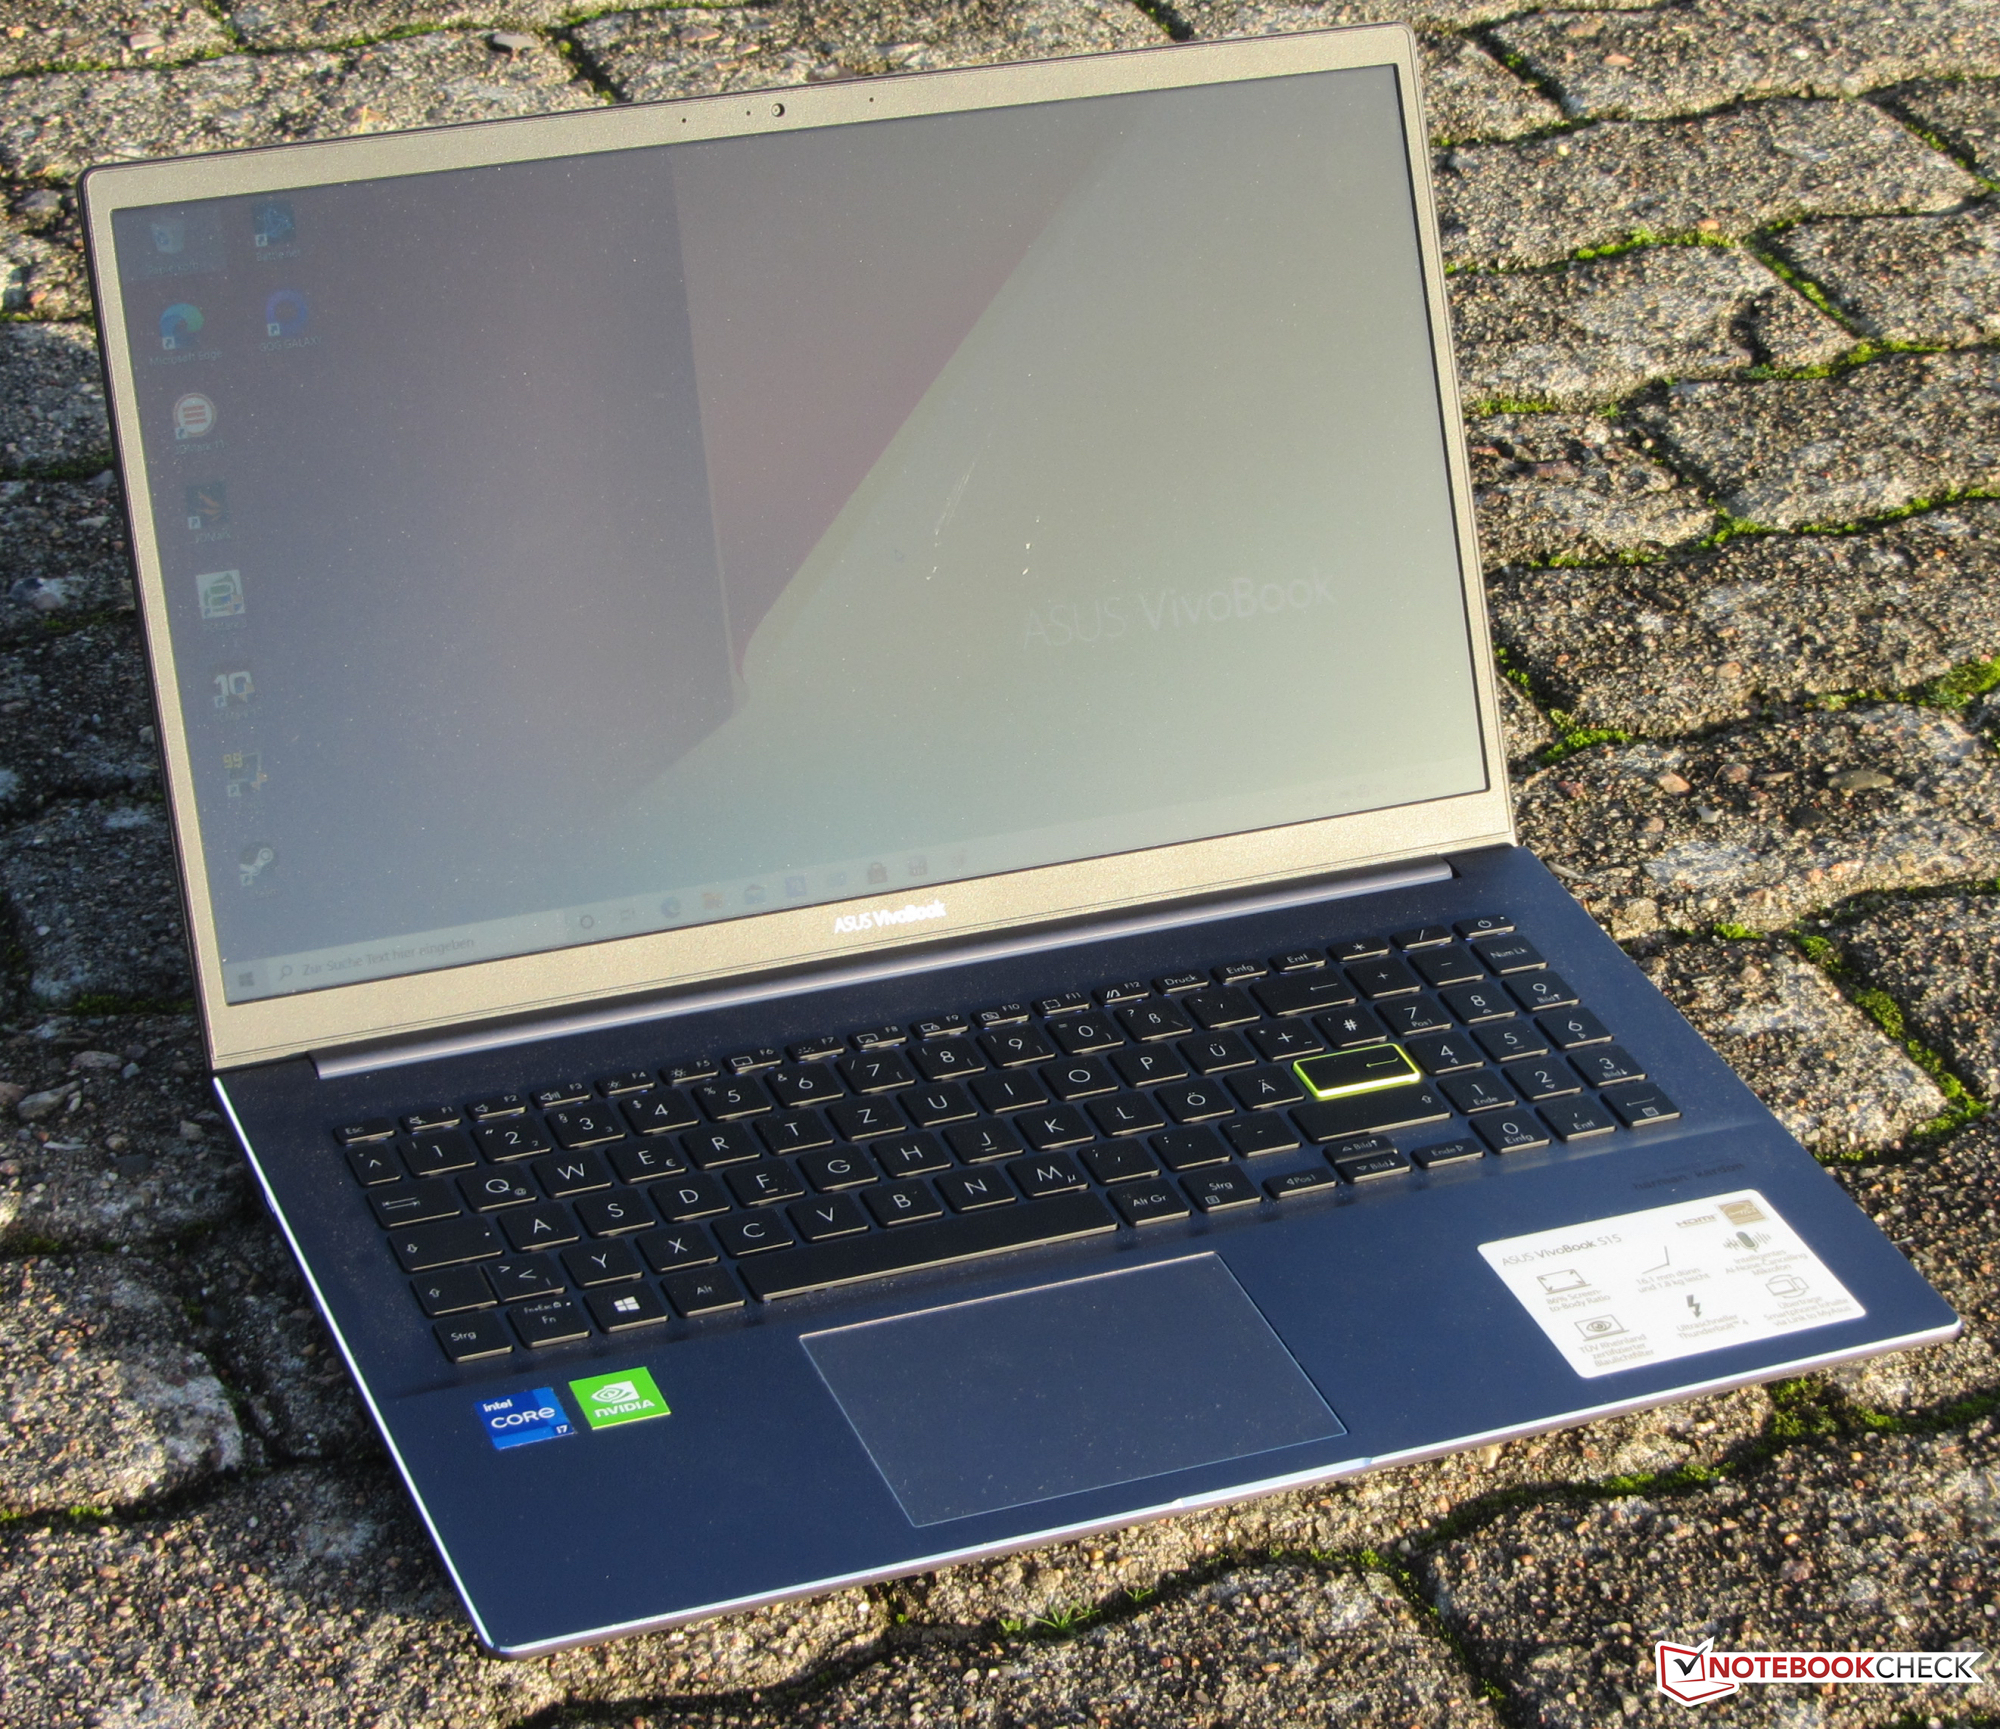
Asus utökar sitt utbud med VivoBook S15 S533EQ, en elegant allt-i-allo på 15.6 tum som har utrustats med en otillräcklig skärm.
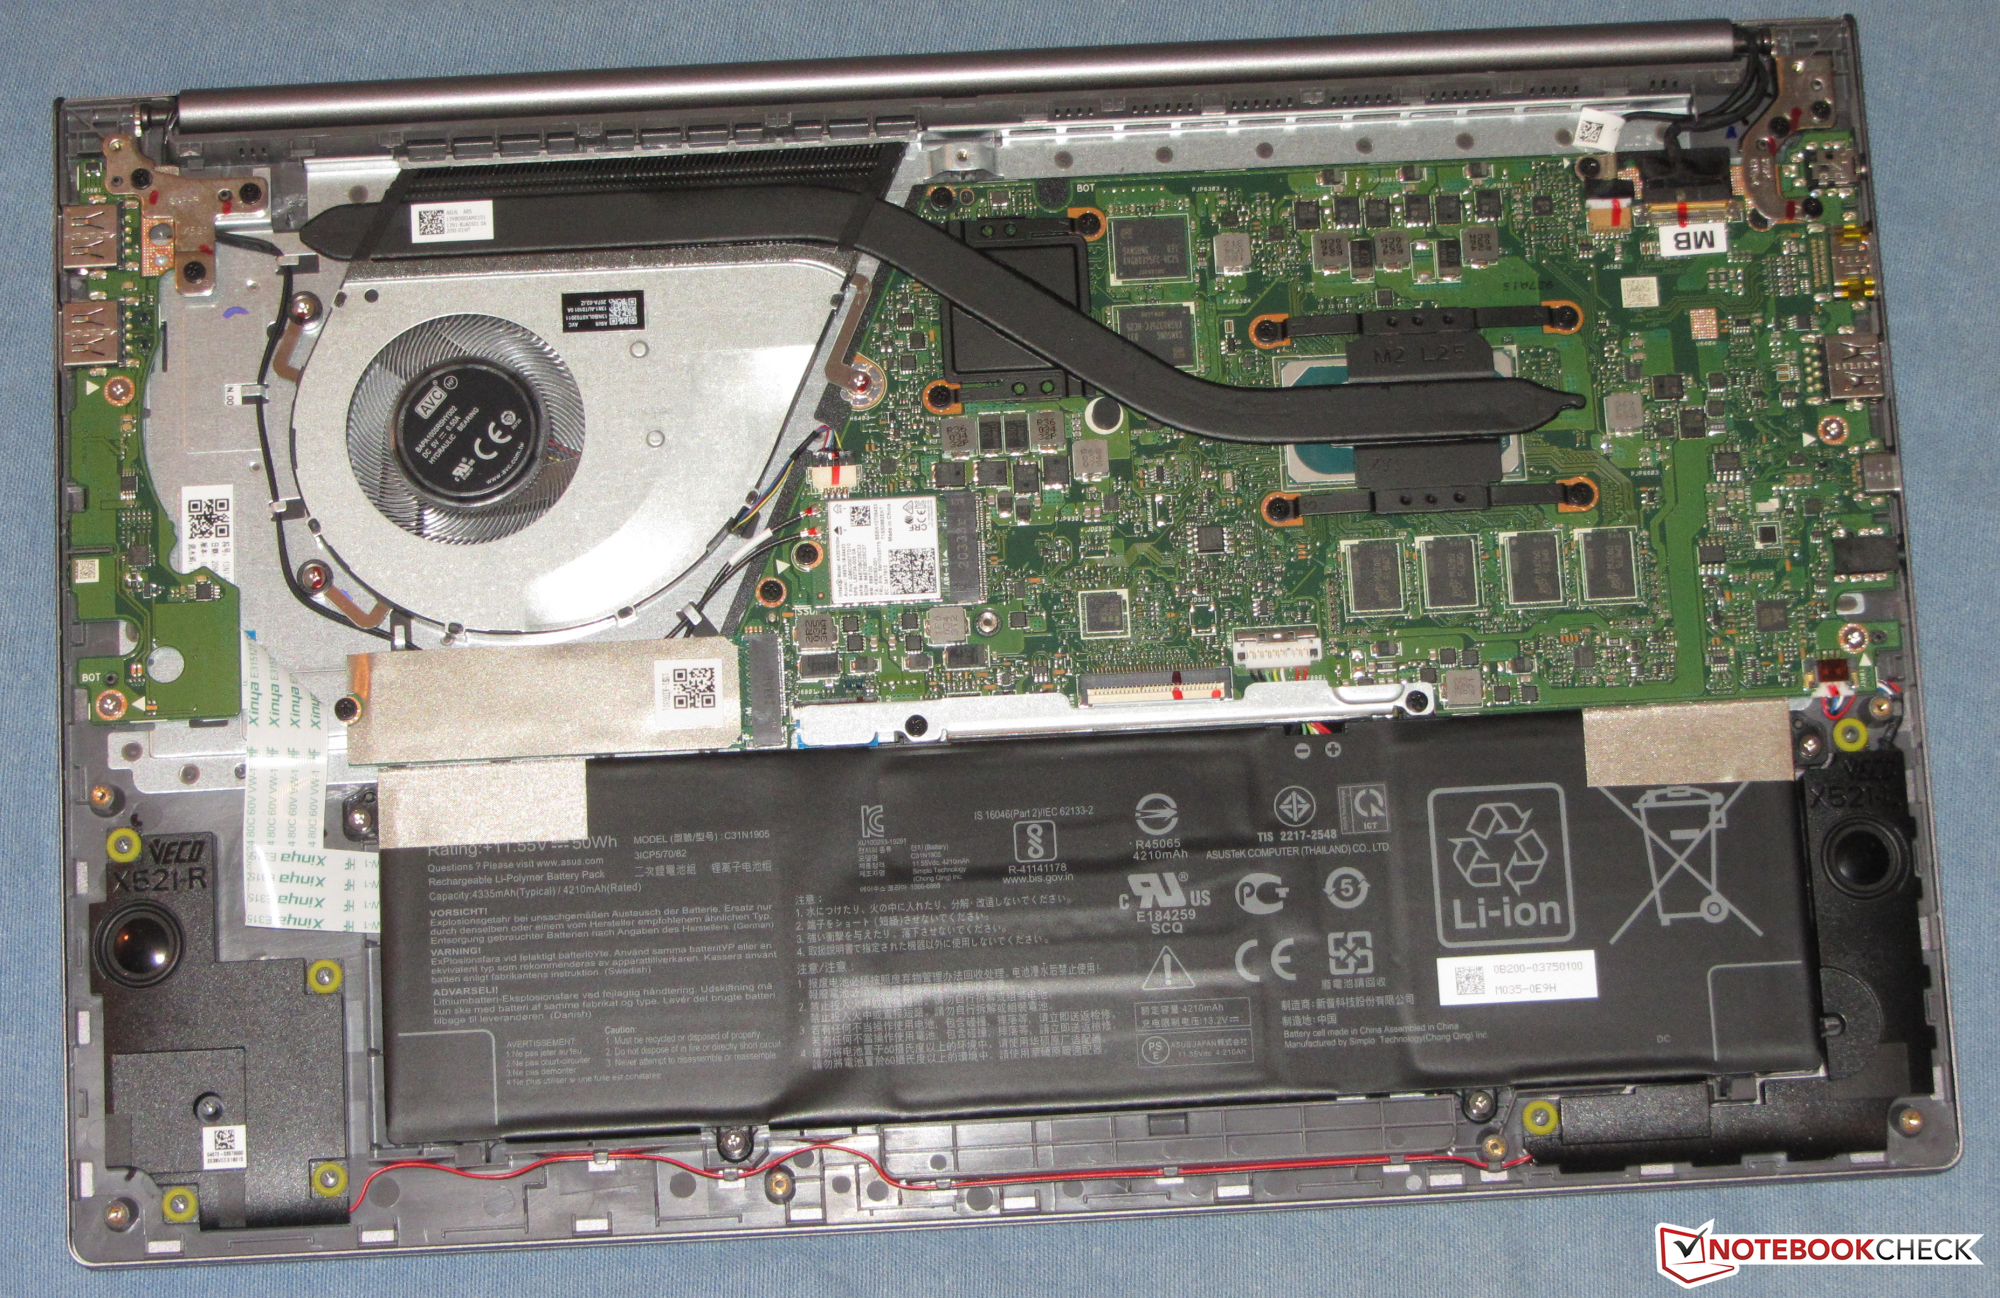
Hårdvaran har stöd av 16 GB minne (med dubbla kanaler) och en NVMe SSD på 1 TB. Det går inte att utöka det fastlödda minnet, men SSD-enheten kan bytas mot en större/snabbare modell vid behov. Det sistnämnda kan vara intressant eftersom Asus har installerat en relativt långsam modell.
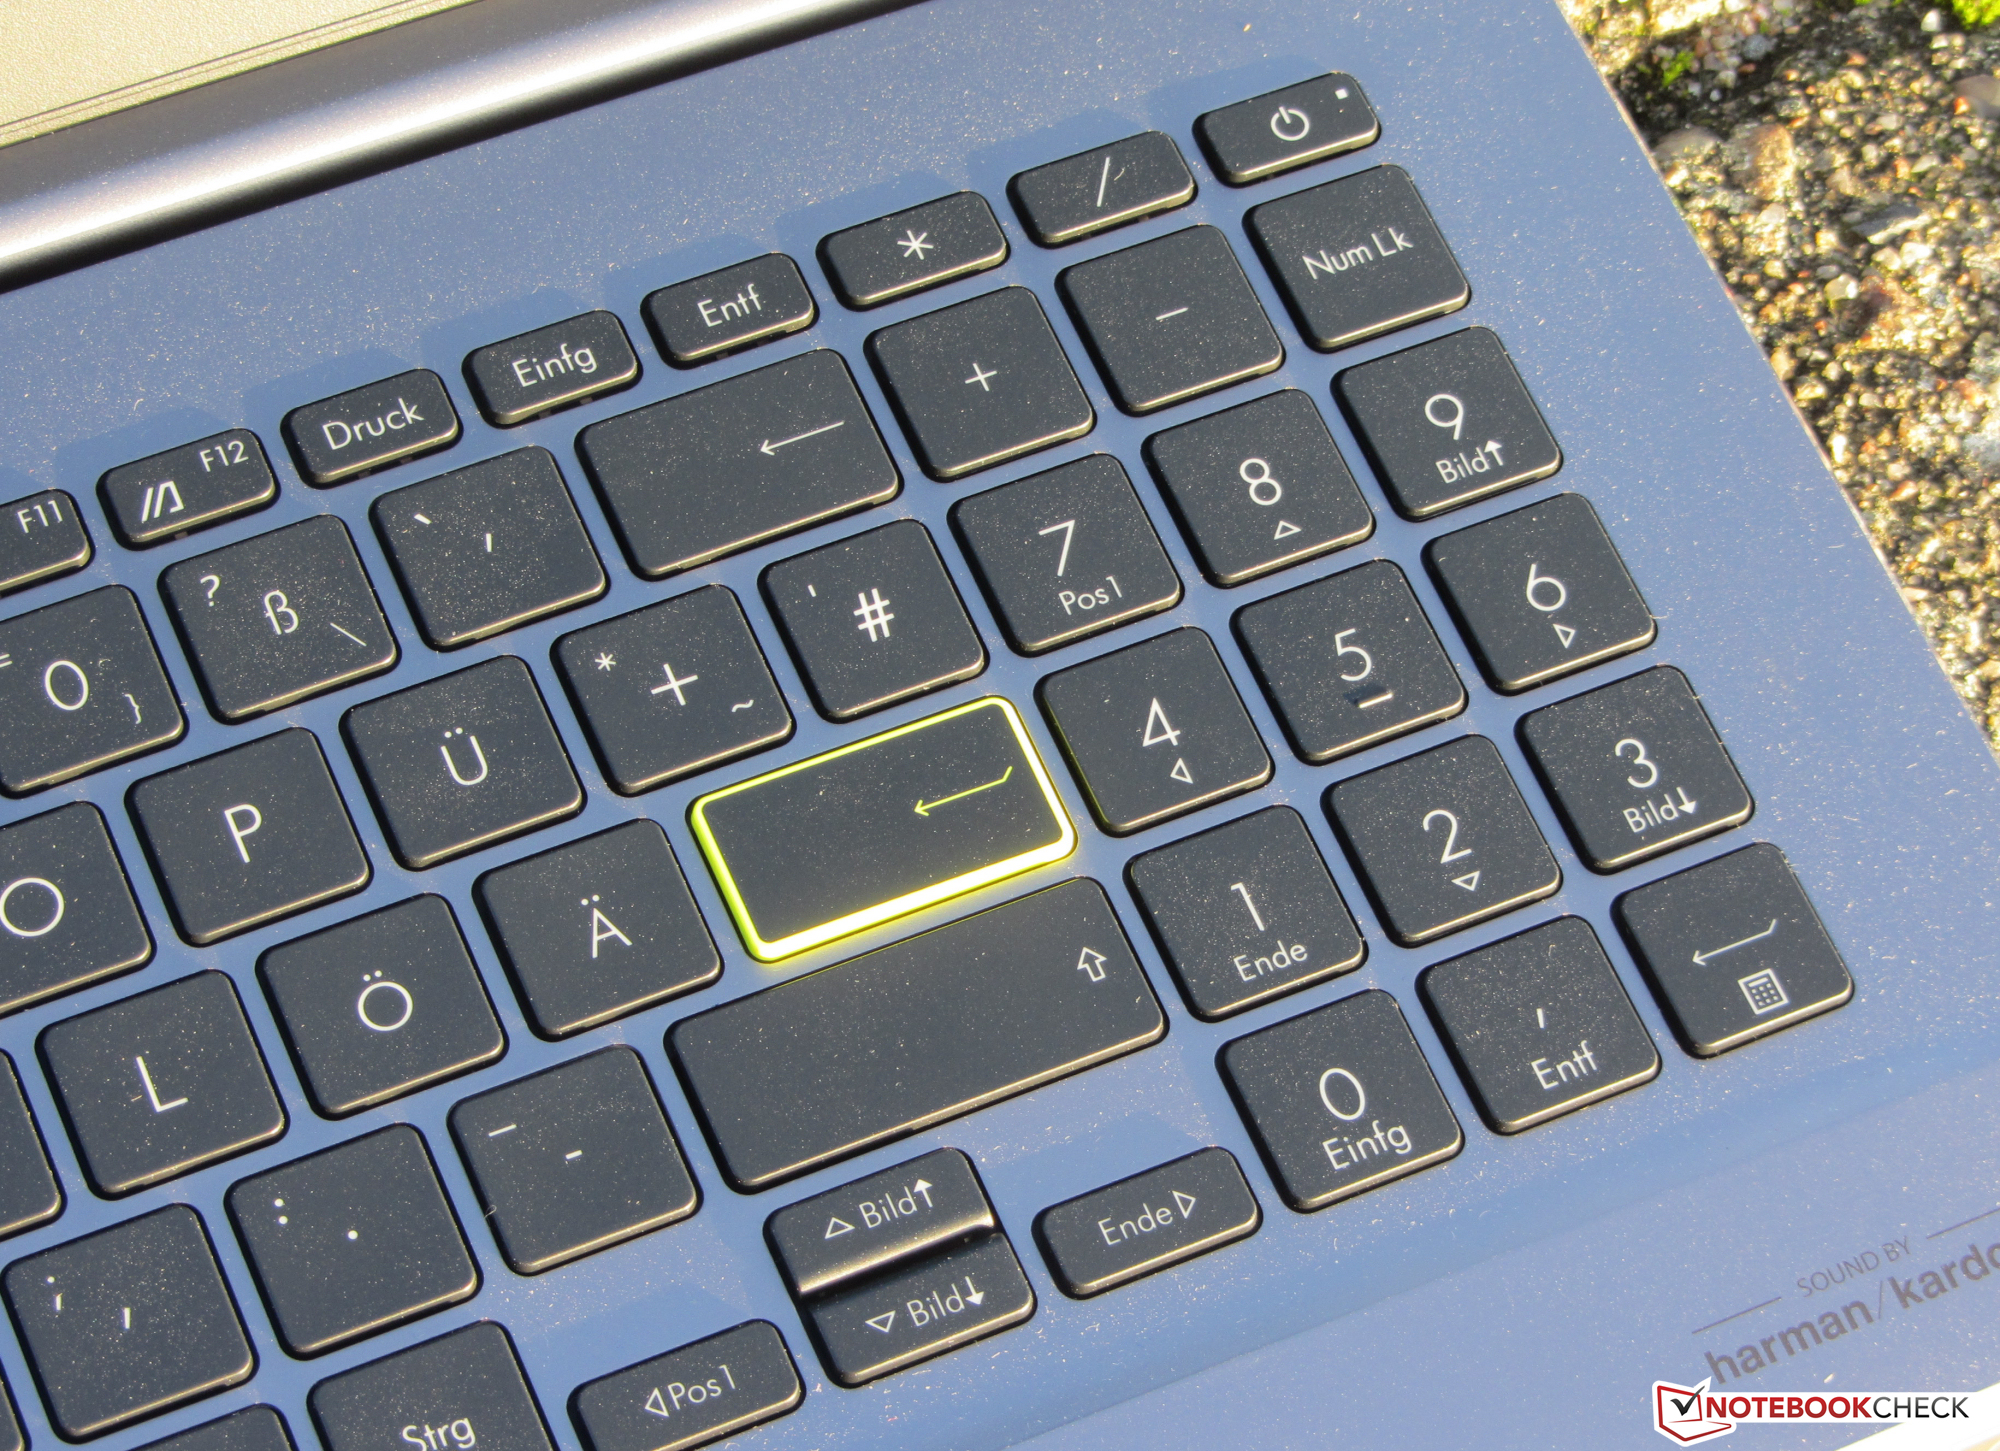
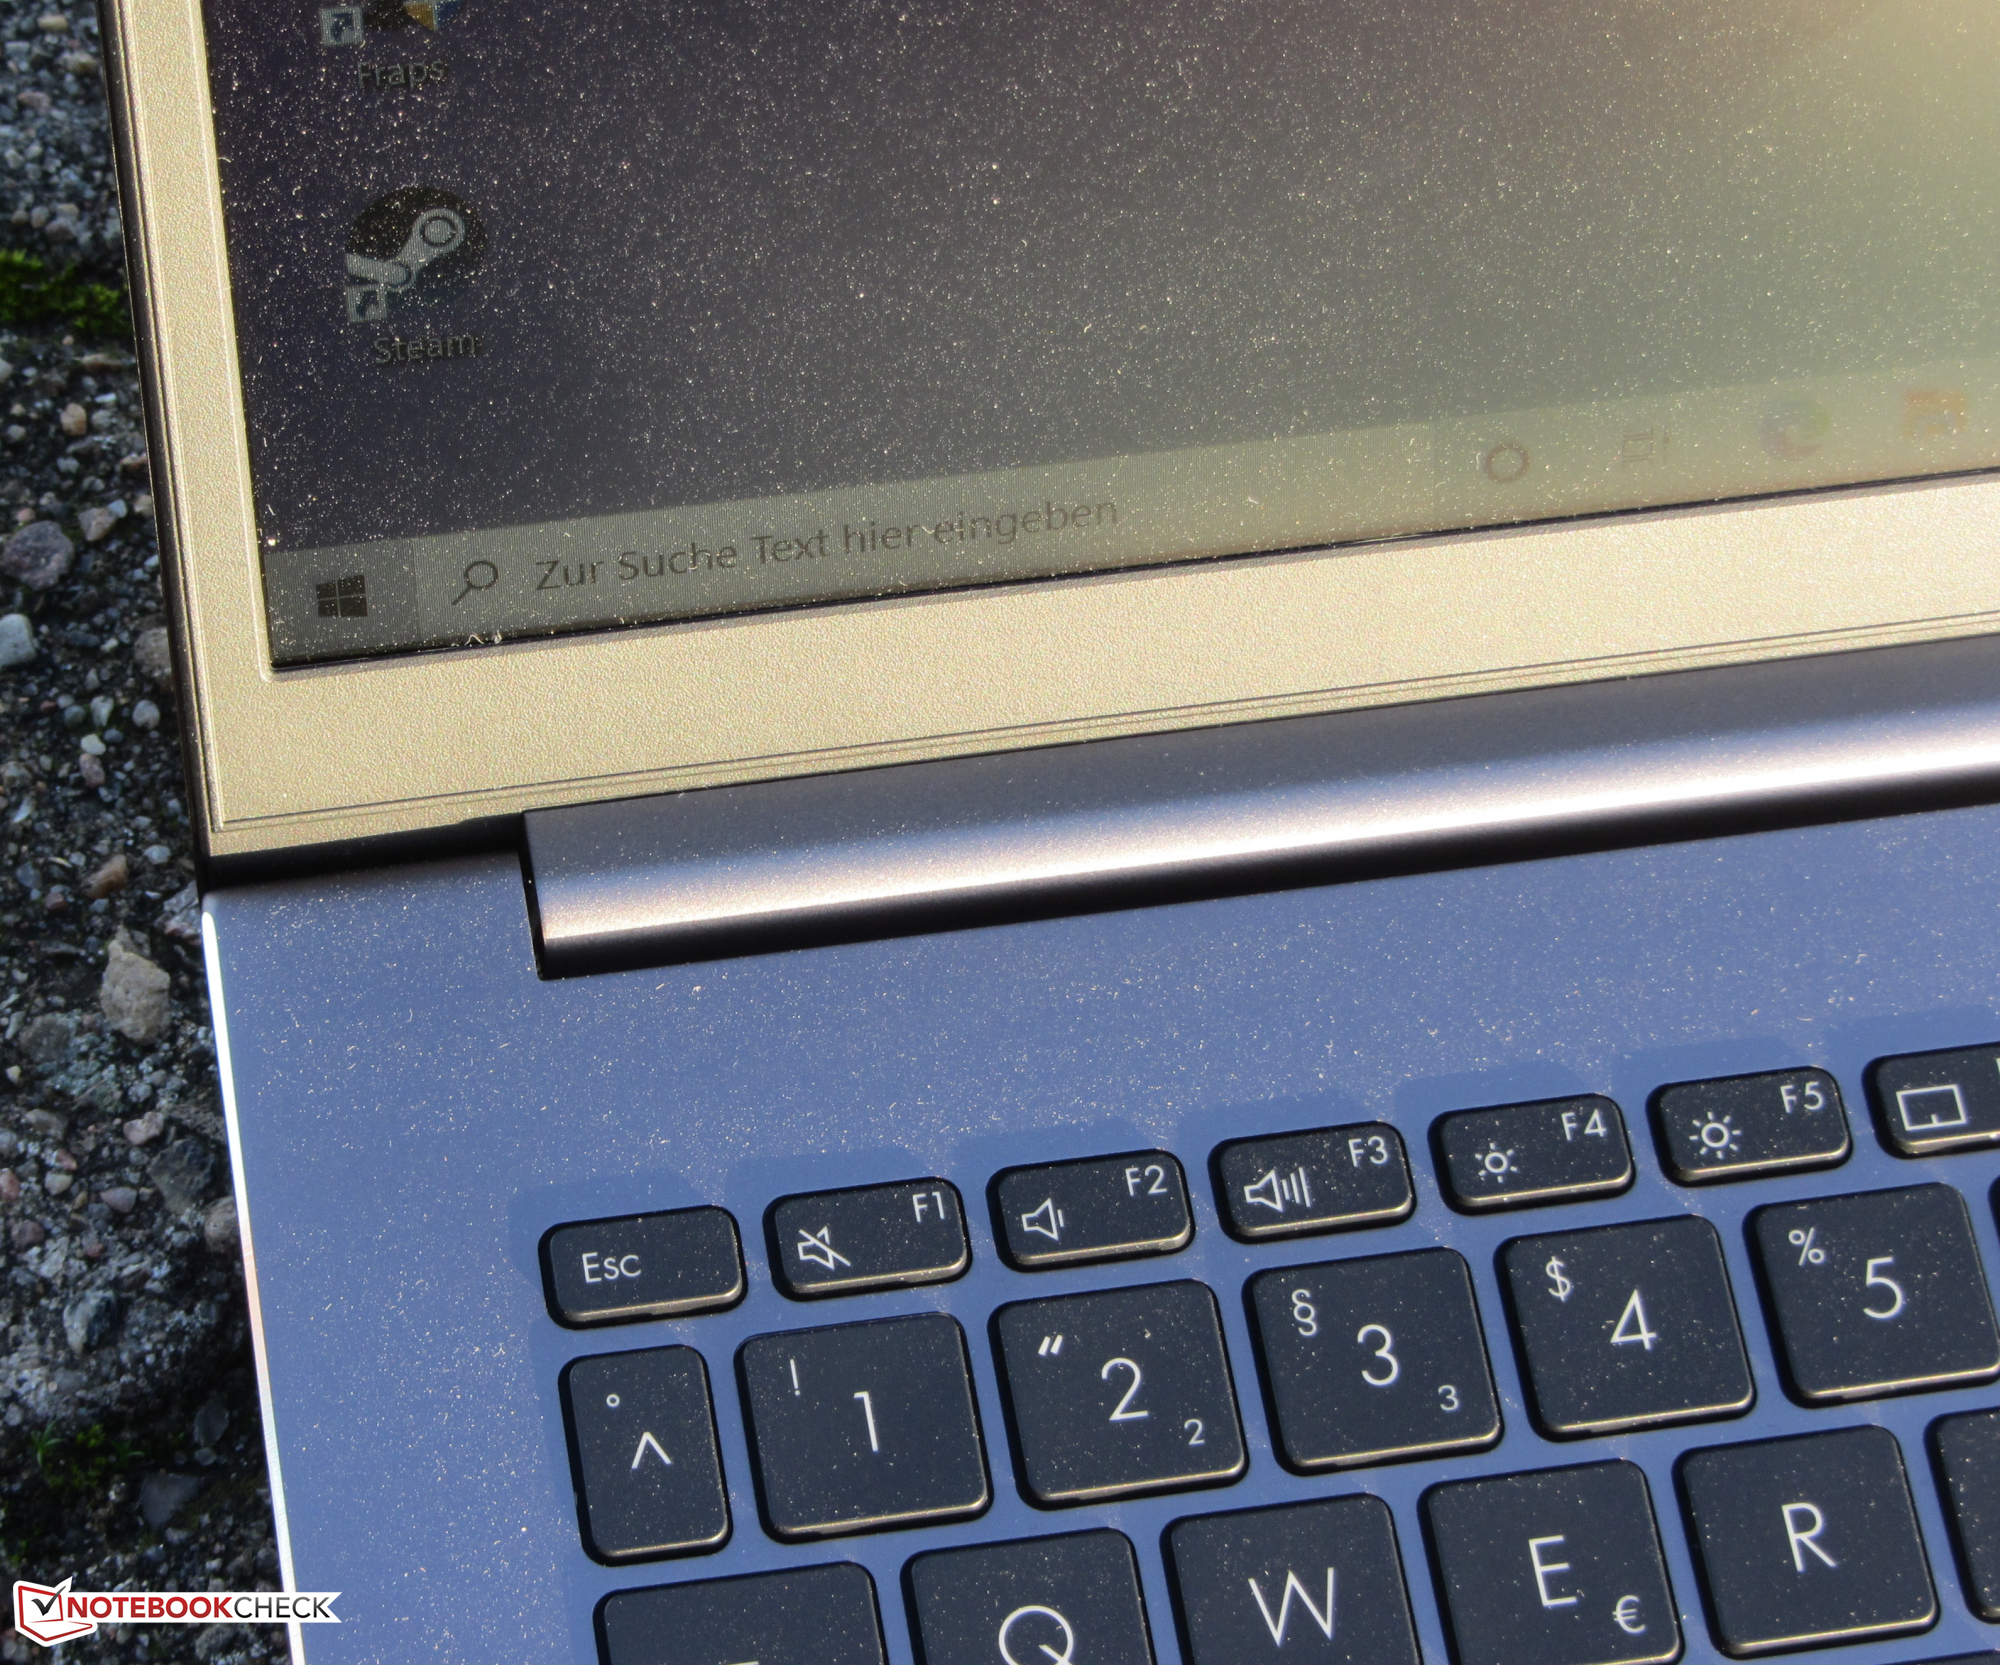
Skärmen (Full HD, IPS) får poäng för stabila betraktningsvinklar, en matt yta och hyfsad färgåtergivning. Ljusstyrkan, kontrastförhållandet och färgomfånget var däremot en besvikelse. En laptop för 13.000 kronor behöver erbjuda mycket mer på den punkten. Det bakgrundsbelysta tangentbordet passade bra för vardagsbruk. Den har också riktigt bra batteritid.
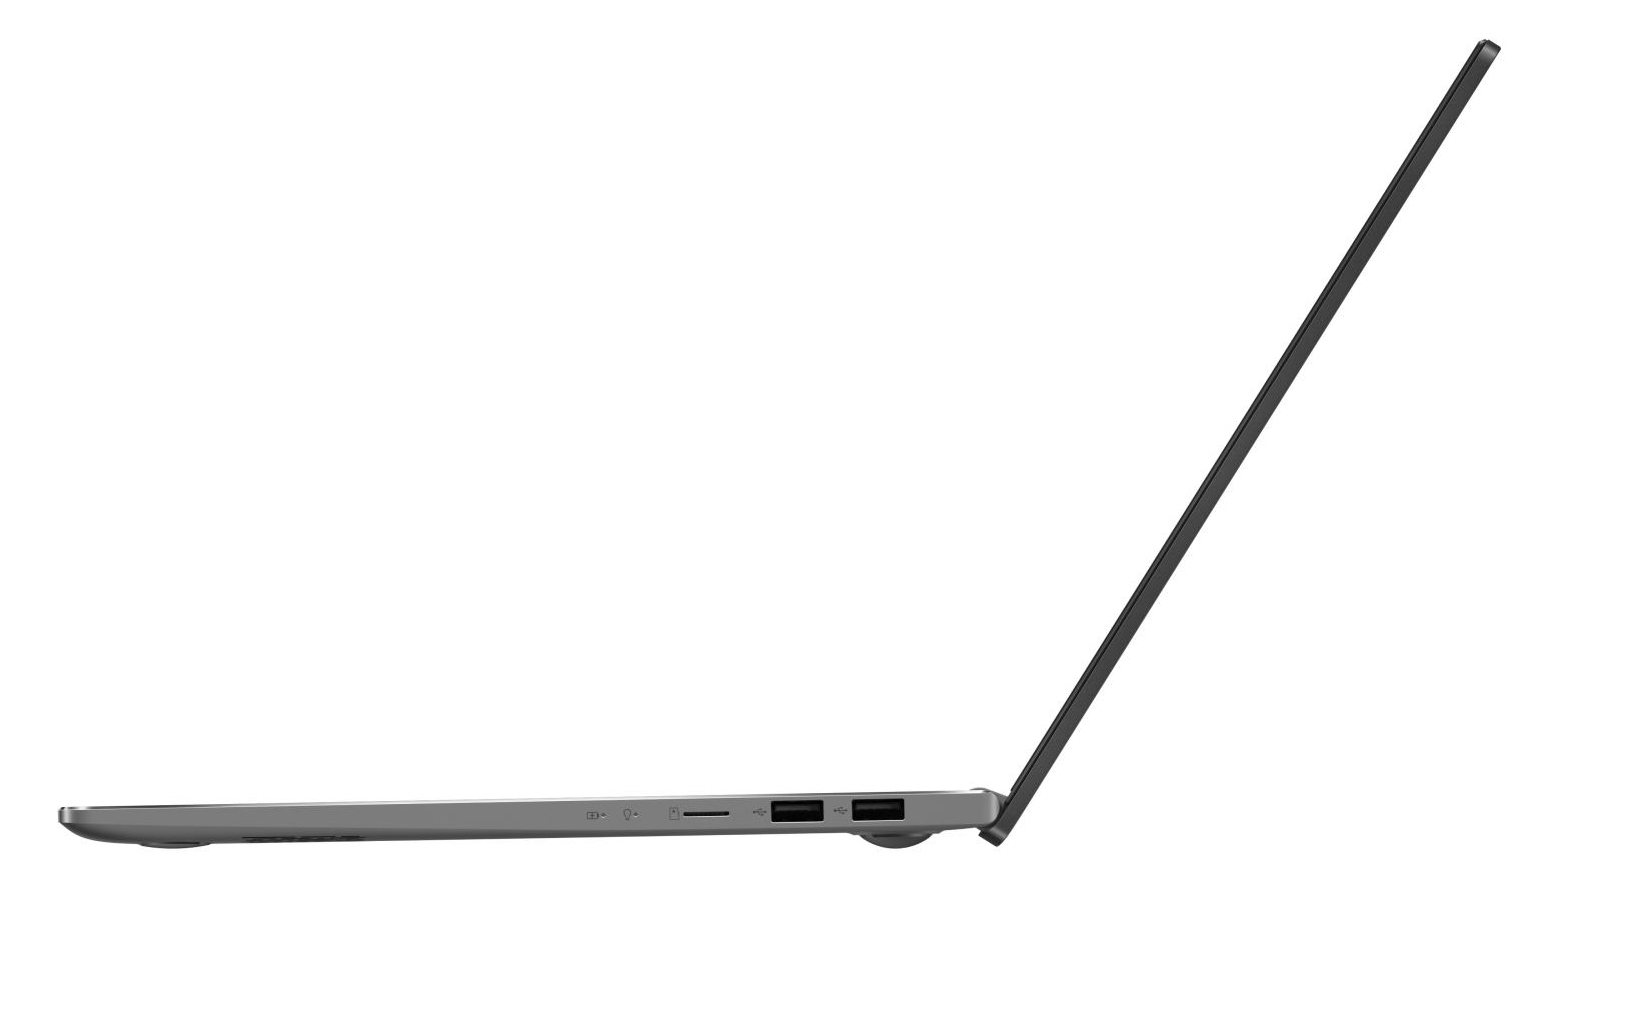
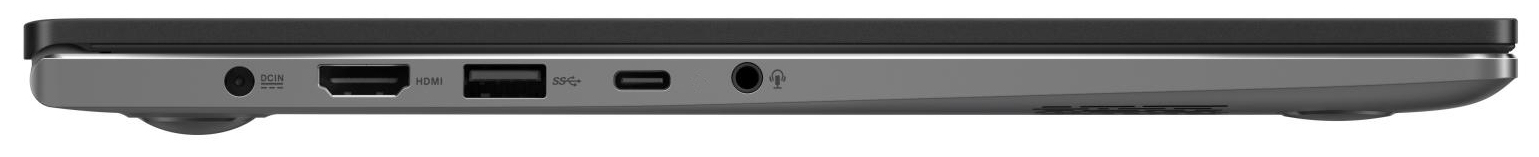
Det går att driva datorn både med den inkluderade propretiära nätadaptern samt med en USB-laddare. Detta möjliggörs av en USB Typ C-port (Thunderbolt 4; DisplayPort via USB-C, Power Delivery). Den gör det också möjligt att ansluta avancerade dockningslösningar eller ett externt grafikkort.
Asus VivoBook S15 S533EQ-BQ002T
- 12/26/2020 v7 (old)
Sascha Mölck
Price comparison
