Test: Recension av Asus Vivobook 15 K513EQ OLED: Alternativ till Lenovo IdeaPad
Om du tar ett steg ner från den avancerade Asus ZenBook-serien så hamnar du i den budgetorienterade Asus VivoBook-serien. Familjen har snabbt expanderat till ett förvirrande stort utbud av modeller som består av både Intel- och AMD-processorer med integrerad eller diskret grafik och till och med OLED-alternativ. Det har definitivt varit svårt att hänga med och den senaste VivoBook 15 K513 gör inte direkt saken lättare.
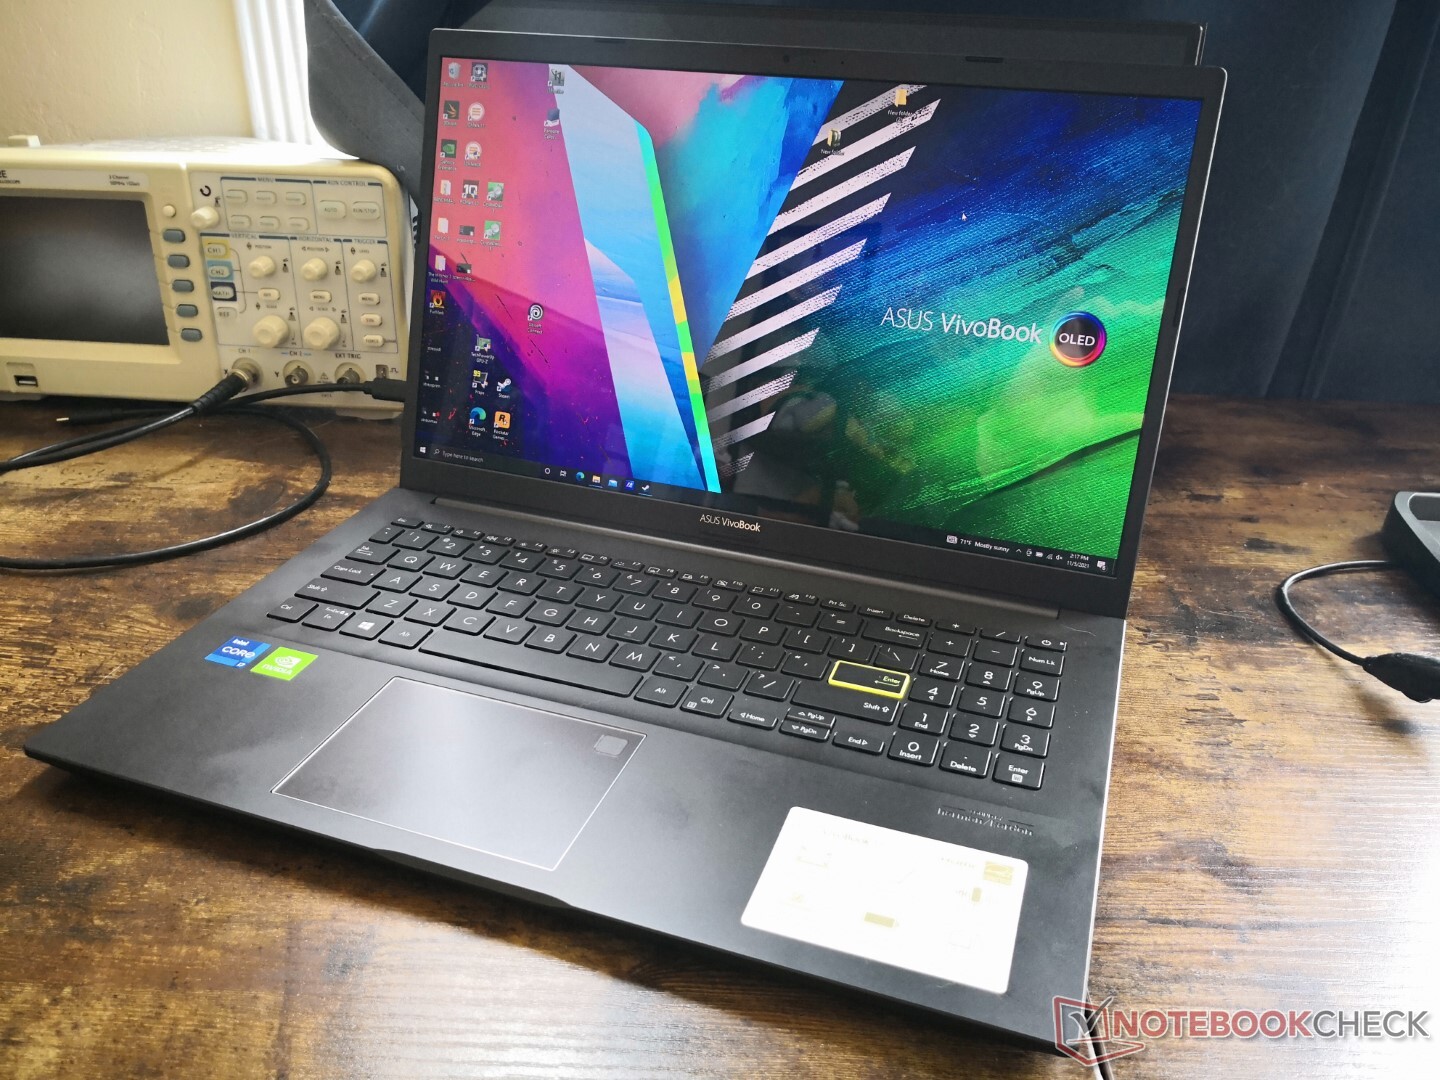
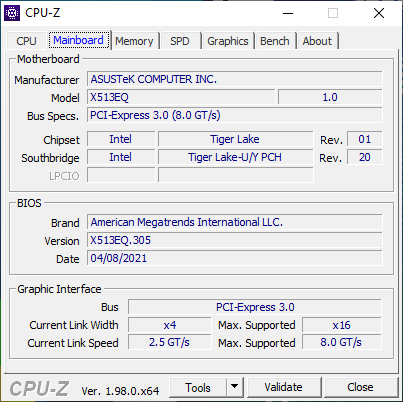
Bortsett från namnkonvention är vår VivoBook 15 K513-testenhet verkligen olik de flesta andra bärbara multimedie-datorer i budget- eller mellanklassegmentet där ute med sin ovanliga Intel 11th gen Core i7-1165G7 och GeForce MX350-parning. Dessutom är den en av de första bärbara 15,6-tumsdatorer som kommer med en beröringsfri 1080p OLED-skärm jämfört med alla 4K OLED-paneler där ute. Vi kommer att ta en närmare titt på prestanda, skärm och fysiska egenskaper hos VivoBook 15 K513 för att ta reda på vad som exakt gör den så annorlunda jämfört med alla andra VivoBook 15-modeller på marknaden
Bland konkurrenterna i detta område finns andra bärbara multimediebärbara datorer i mellanklass som t.ex Lenovo IdeaPad 5 15, Dell Inspiron 15, HP Pavilion 15, eller MSI Summit B15/E15serien. Vår specifika testenhet kan hittas på nätet för cirka 900-1000 USD.
Fler recensioner av Asus VivoBook:
Potential Competitors in Comparison
Gradering | Datum | Modell | Vikt | Höjd | Storlek | Upplösning | Pris |
|---|---|---|---|---|---|---|---|
| 80.6 % v7 (old) | 11/2021 | Asus Vivobook 15 K513EQ i7-1165G7, GeForce MX350 | 1.6 kg | 17.9 mm | 15.60" | 1920x1080 | |
| 85.9 % v7 (old) | 11/2021 | Asus VivoBook 15 Pro M3500QC-L1062 R5 5600H, GeForce RTX 3050 4GB Laptop GPU | 1.7 kg | 19.9 mm | 15.60" | 1920x1080 | |
| 83.4 % v7 (old) | 01/2021 | Asus VivoBook S15 S533EQ-BQ002T i7-1165G7, GeForce MX350 | 1.8 kg | 16.1 mm | 15.60" | 1920x1080 | |
| 83.5 % v7 (old) | 09/2022 | Lenovo IdeaPad 5 15ALC05 R5 5500U, Vega 7 | 1.7 kg | 19.1 mm | 15.60" | 1920x1080 | |
| 80.5 % v7 (old) | 10/2024 | Dell Inspiron 15 3501 i7-1165G7, Iris Xe G7 96EUs | 2 kg | 19.9 mm | 15.60" | 1920x1080 | |
| 81.2 % v7 (old) | 07/2021 | HP Pavilion 15-eg i7-1165G7, GeForce MX450 | 1.7 kg | 17.9 mm | 15.60" | 1920x1080 |
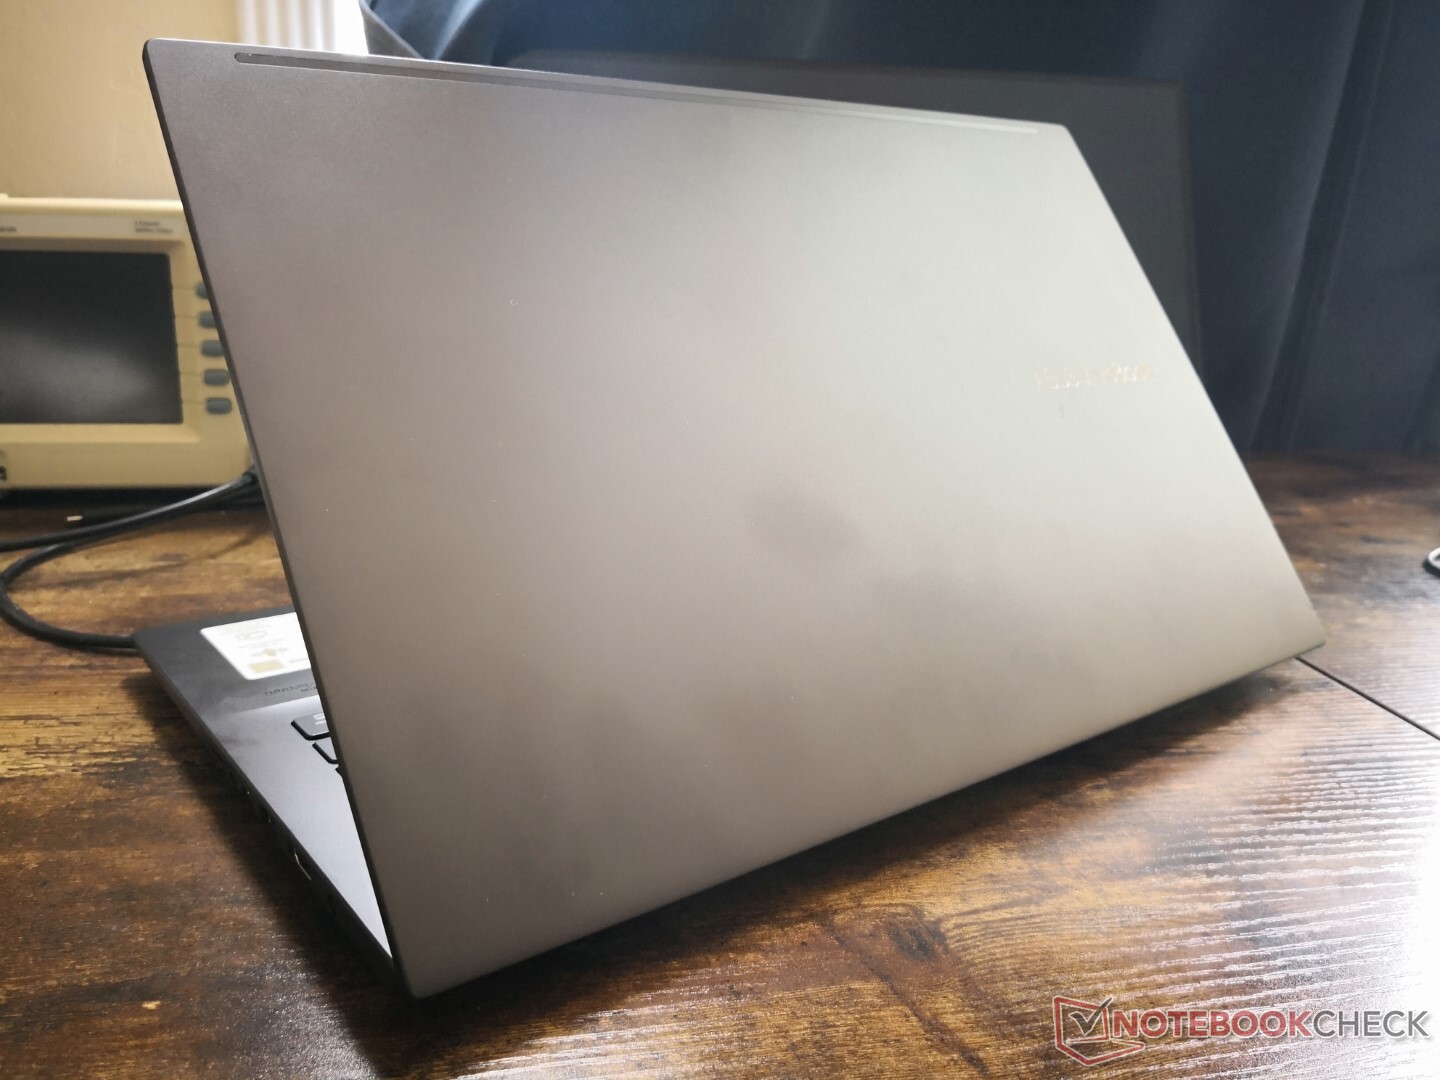
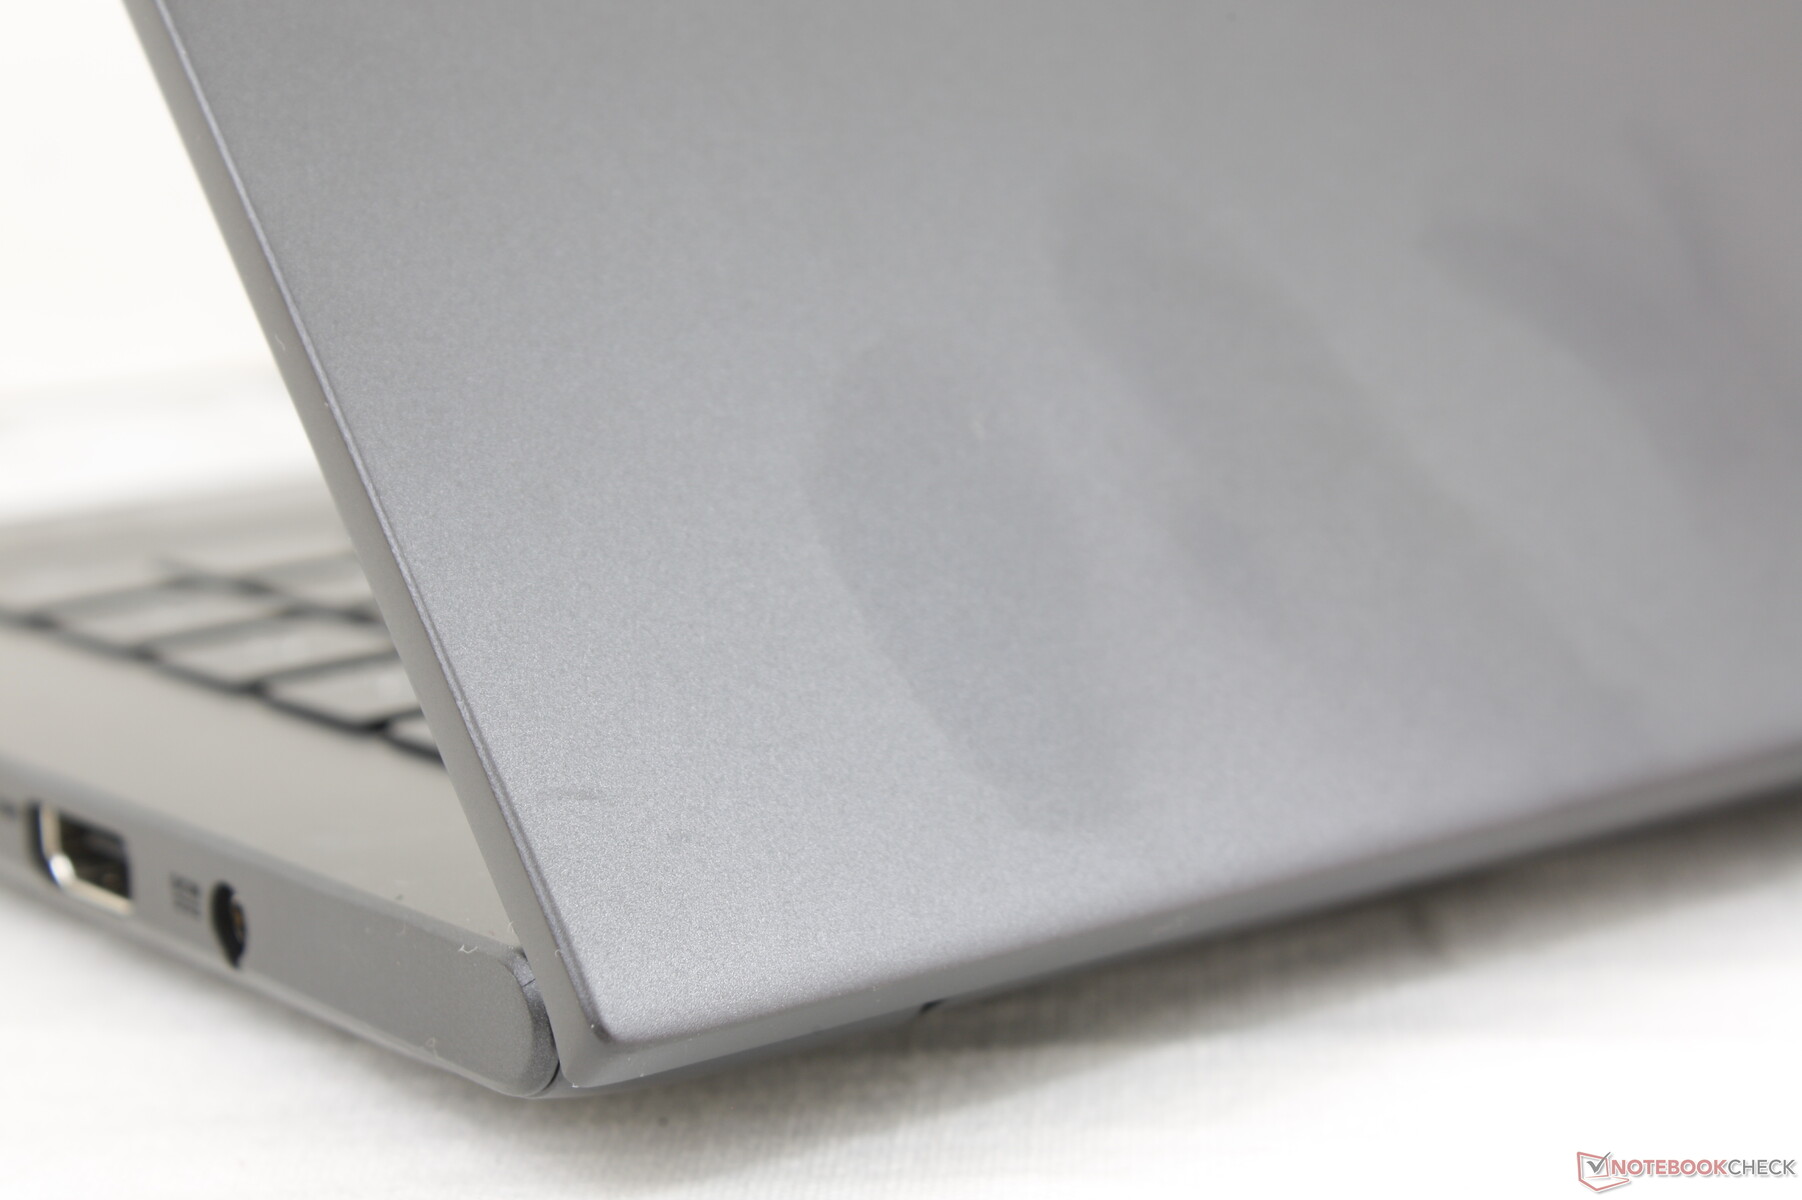
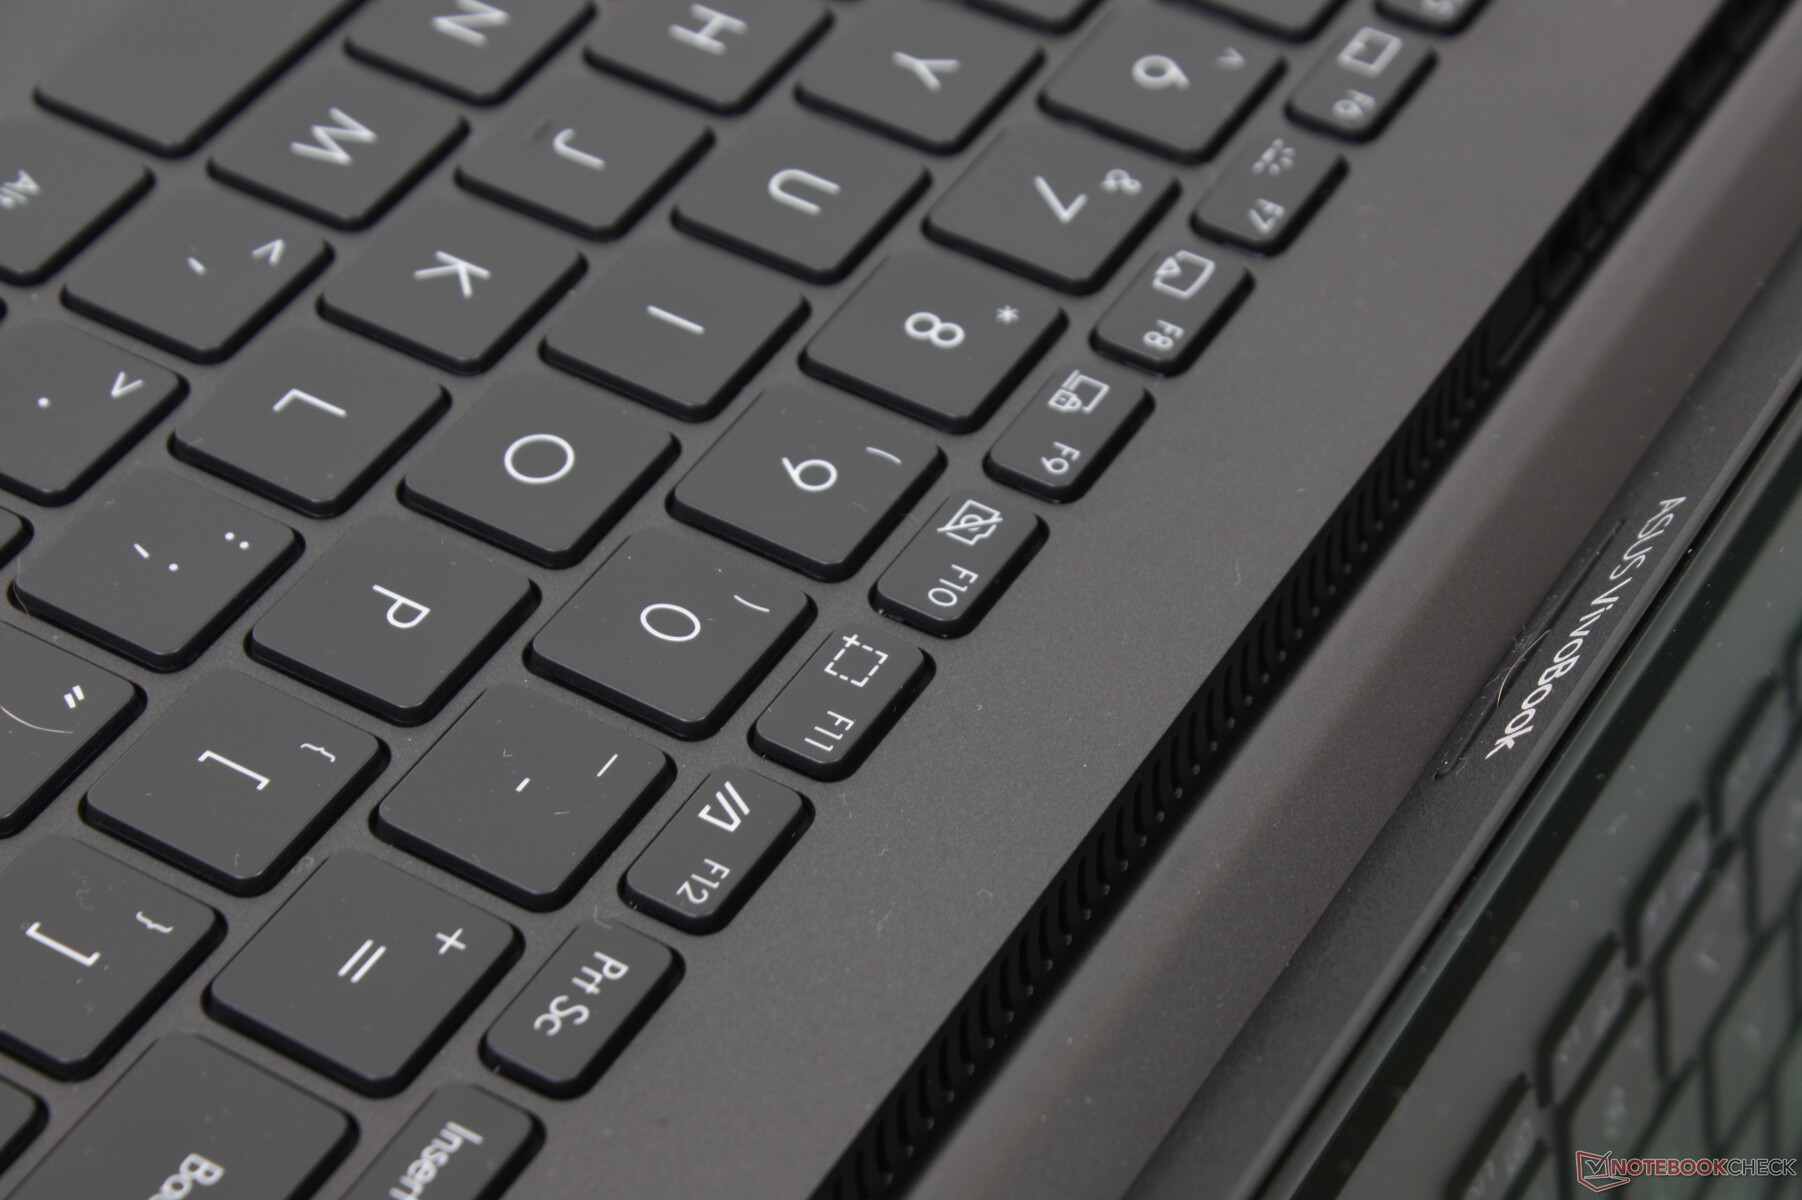
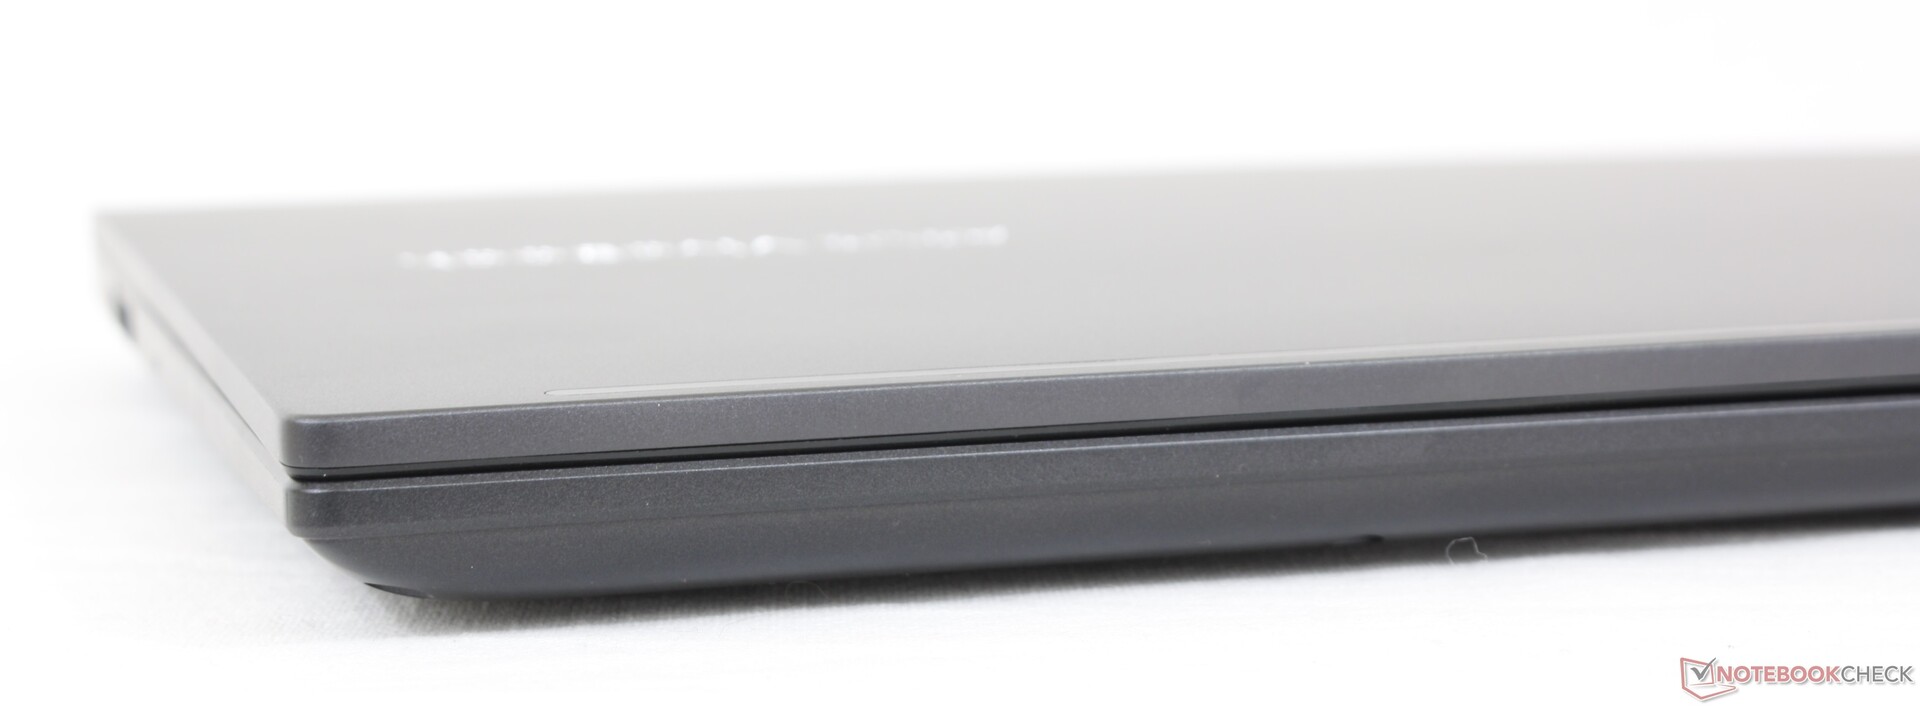
Case - Hoppas du gillar plast
Det finns måttliga skillnader både på insidan och utsidan mellan de olika 15,6-tums VivoBook 15-modellerna. I vårt fall är VivoBook 15 K513 mest lik VivoBook 15 K513 VivoBook 15 F512 när det gäller placering av portar och moderkortets layout. Särskilt plastbasen är inte alls lika fast eller lyxig som en typisk ZenBook 15, HP Spectre eller Dell XPS 15 vilket är att vänta. Chassiets styvhet är istället mer i linje med Lenovo IdeaPad 5 15 eller Dell Inspiron 3501 medan den är lite svagare än den senaste HP Pavilion 15. Dess tangentbordscenter böjs till exempel lättare än vad vi skulle vilja.
Systemet är lättare än många av sina konkurrenter med mellan 100 och 200 g trots den diskreta GPU:n och OLED-panelen. De totala måtten liknar mest den senaste HP Pavilion 15 samtidigt som den är tunnare och tjockare än VivoBook 15 Pro respektive VivoBook S15.
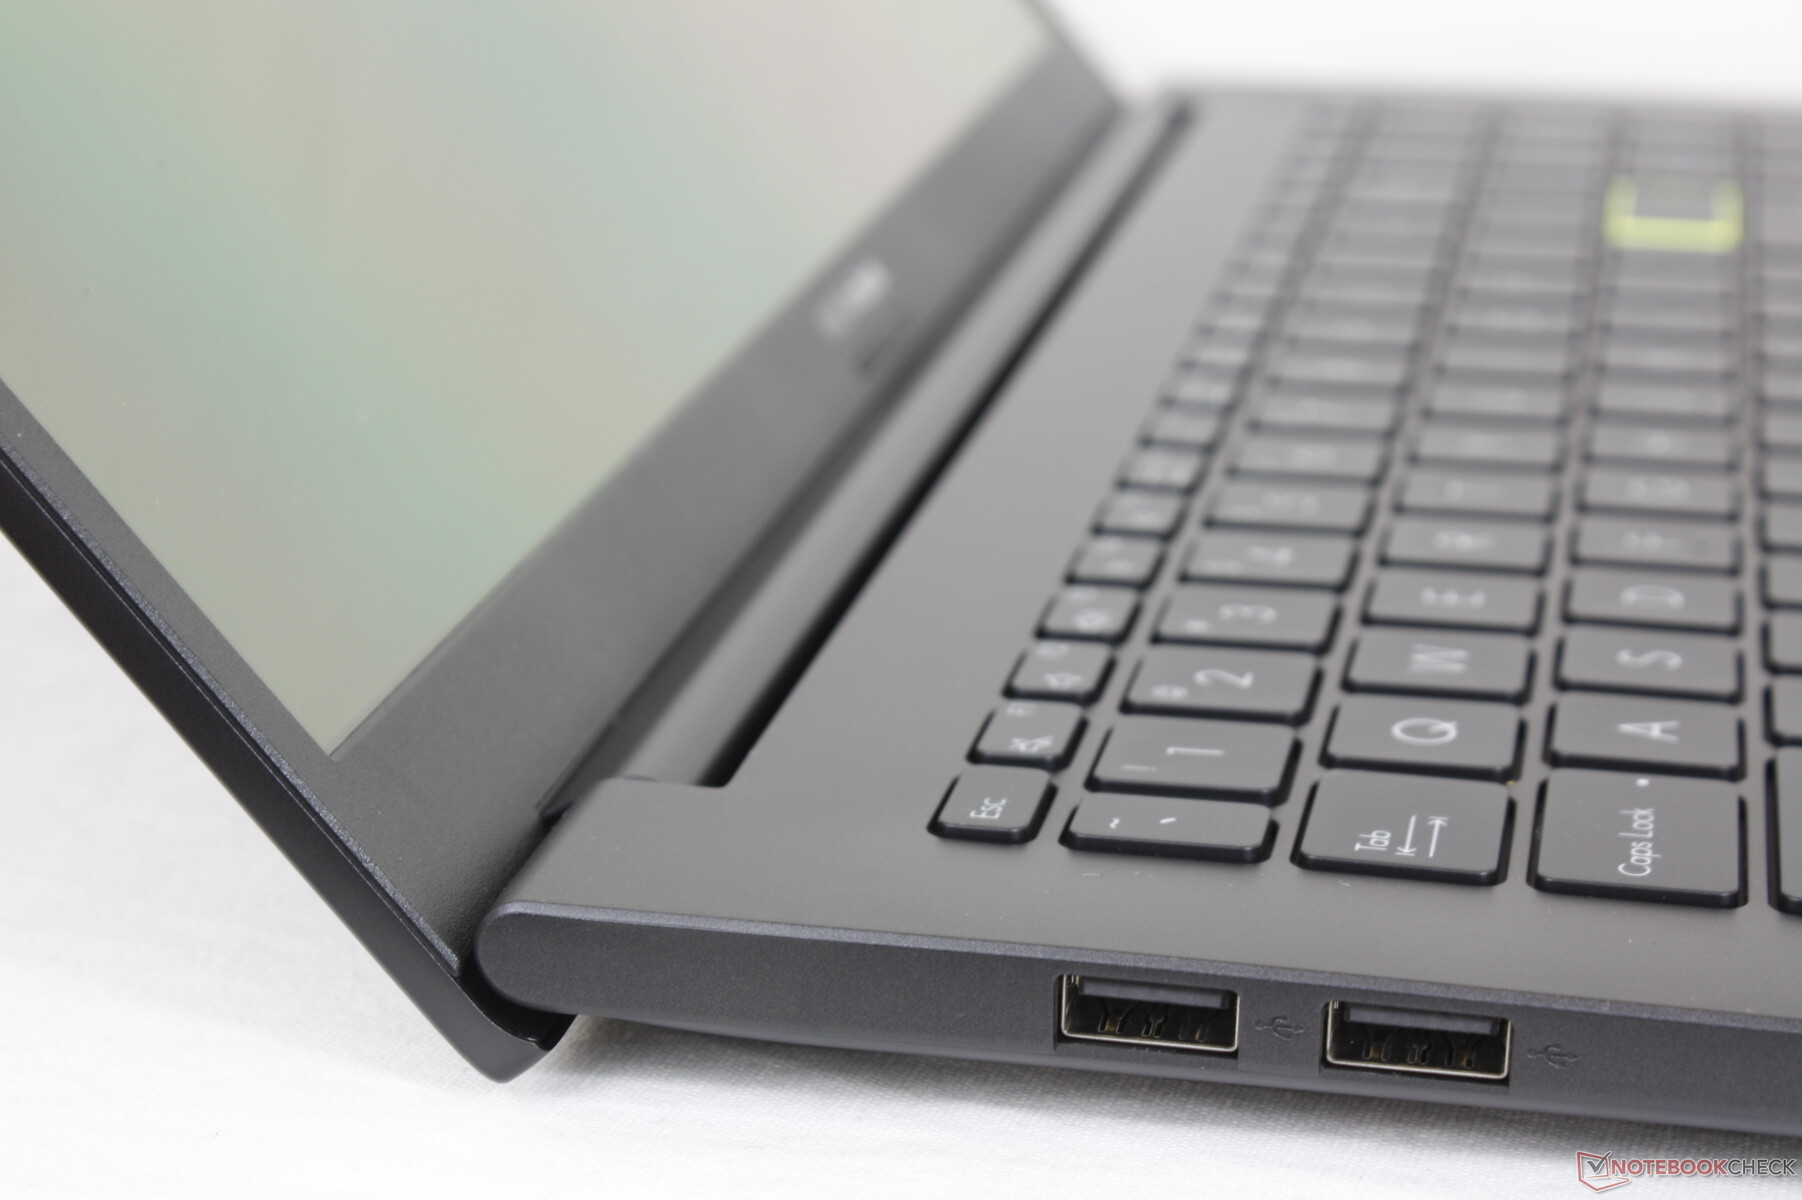
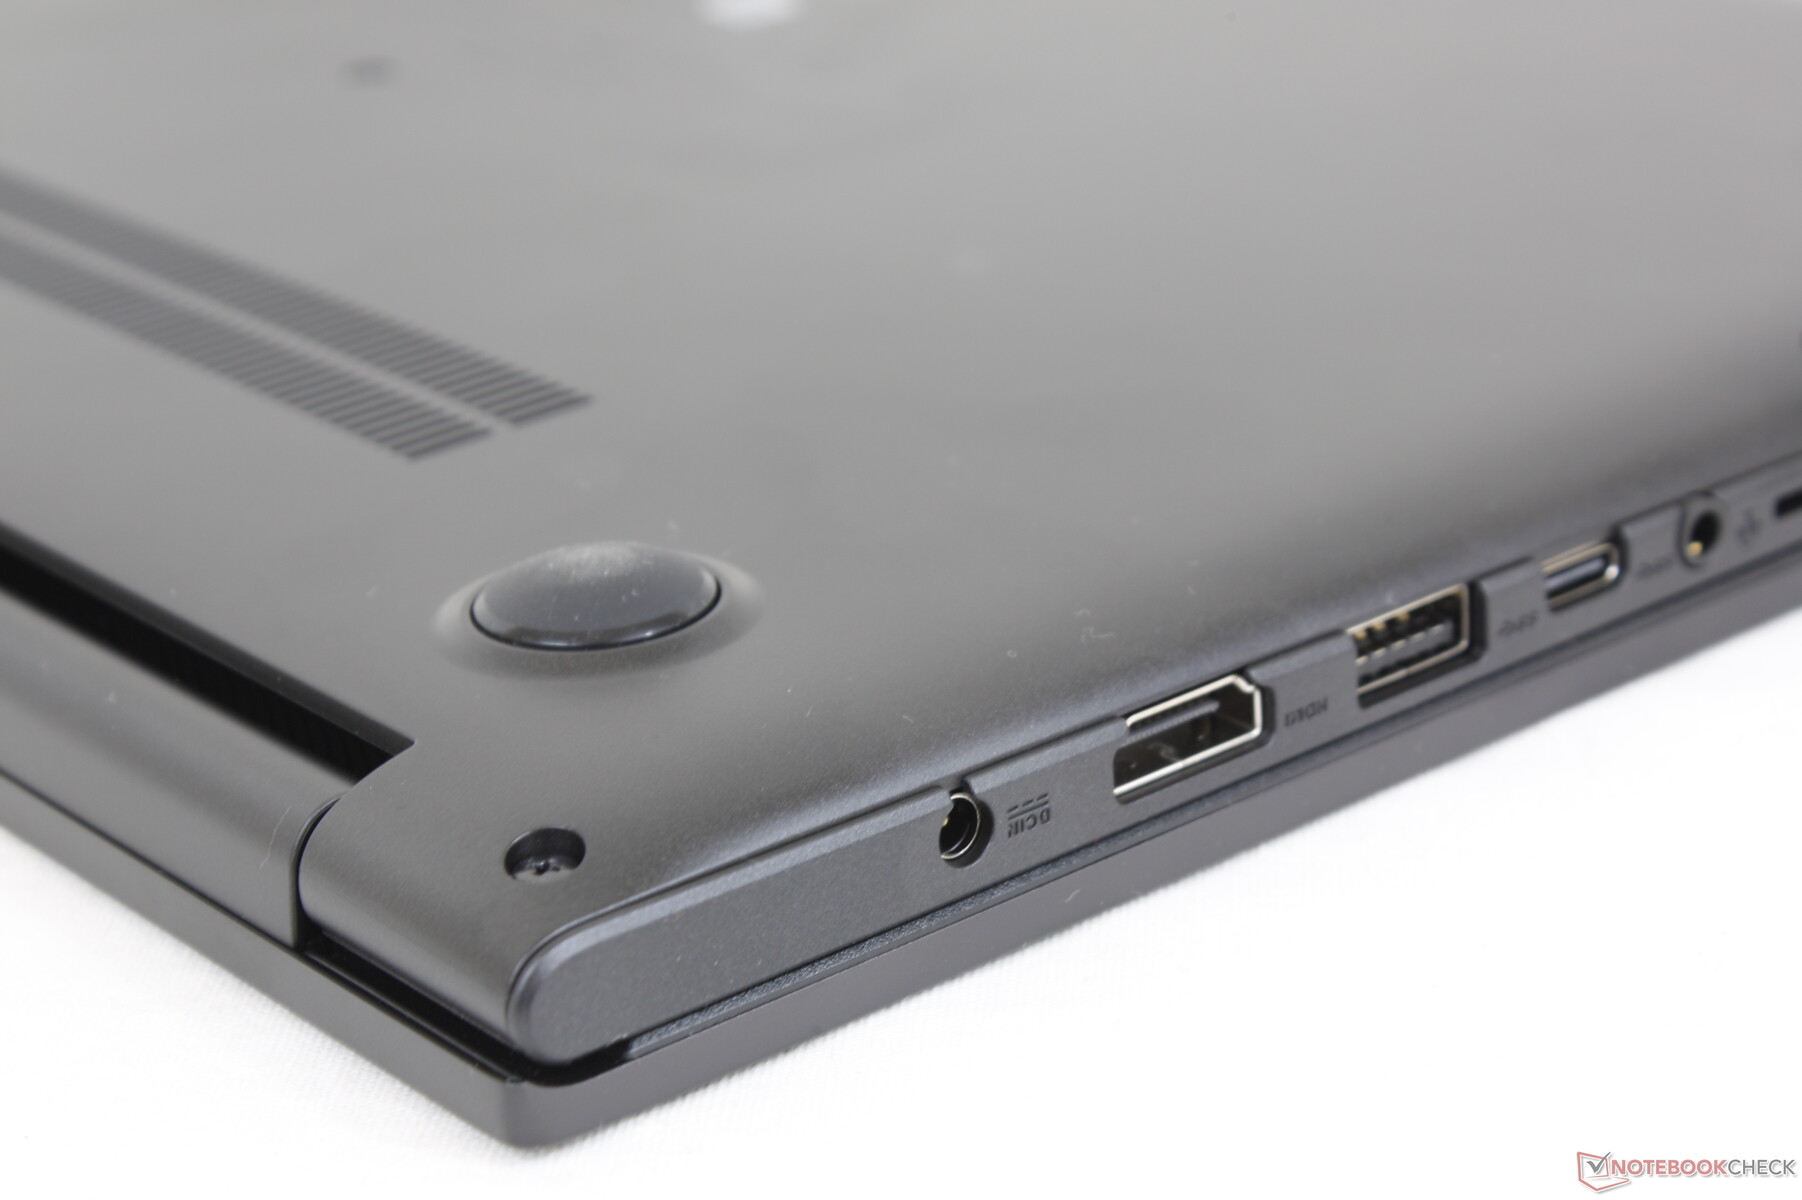
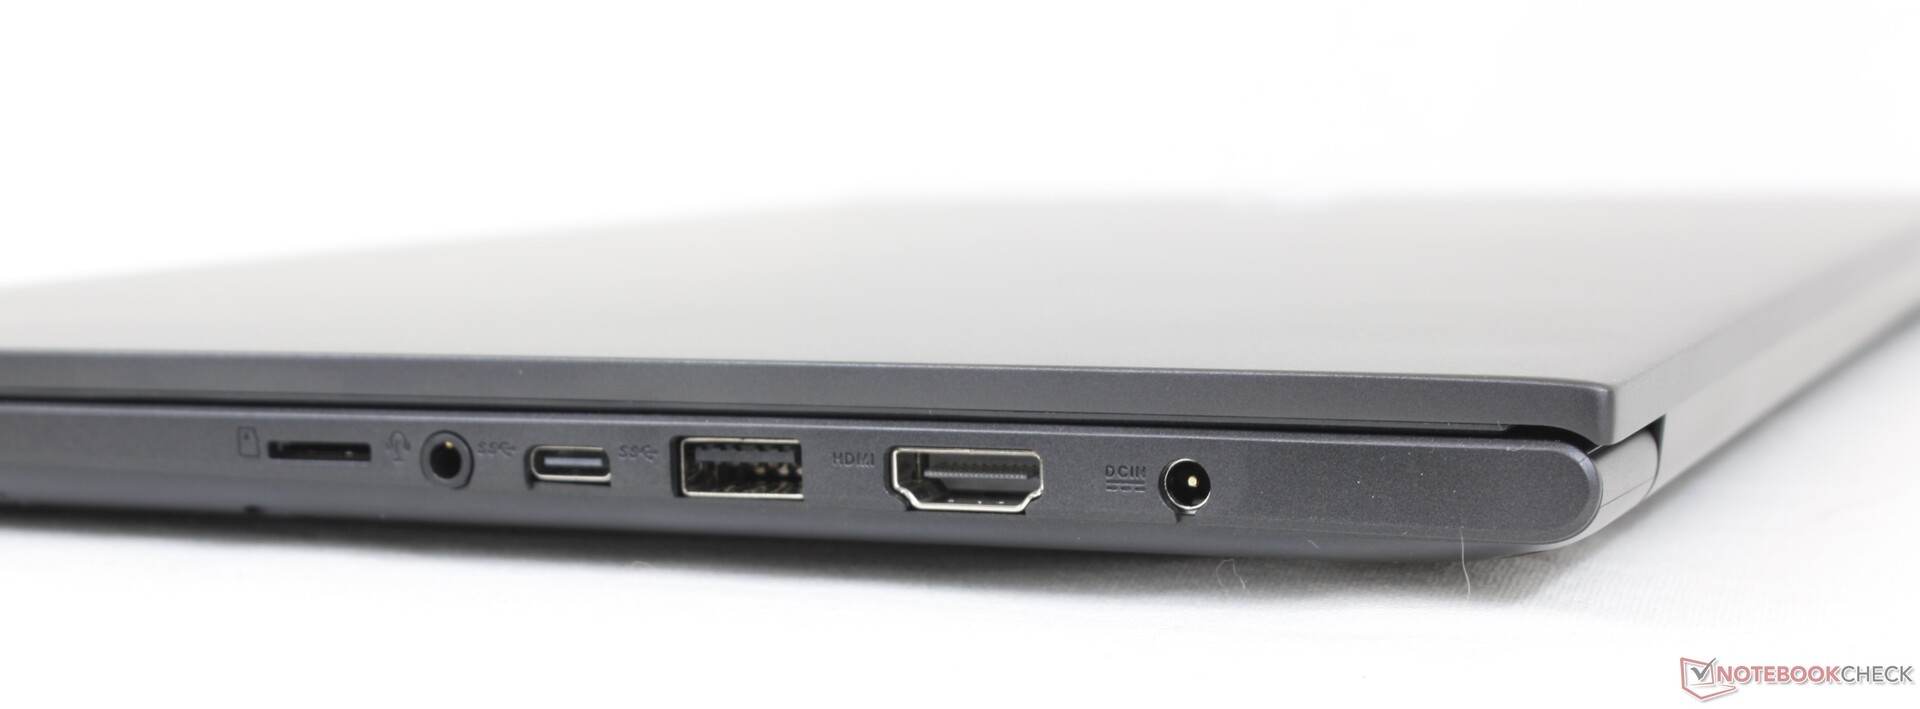
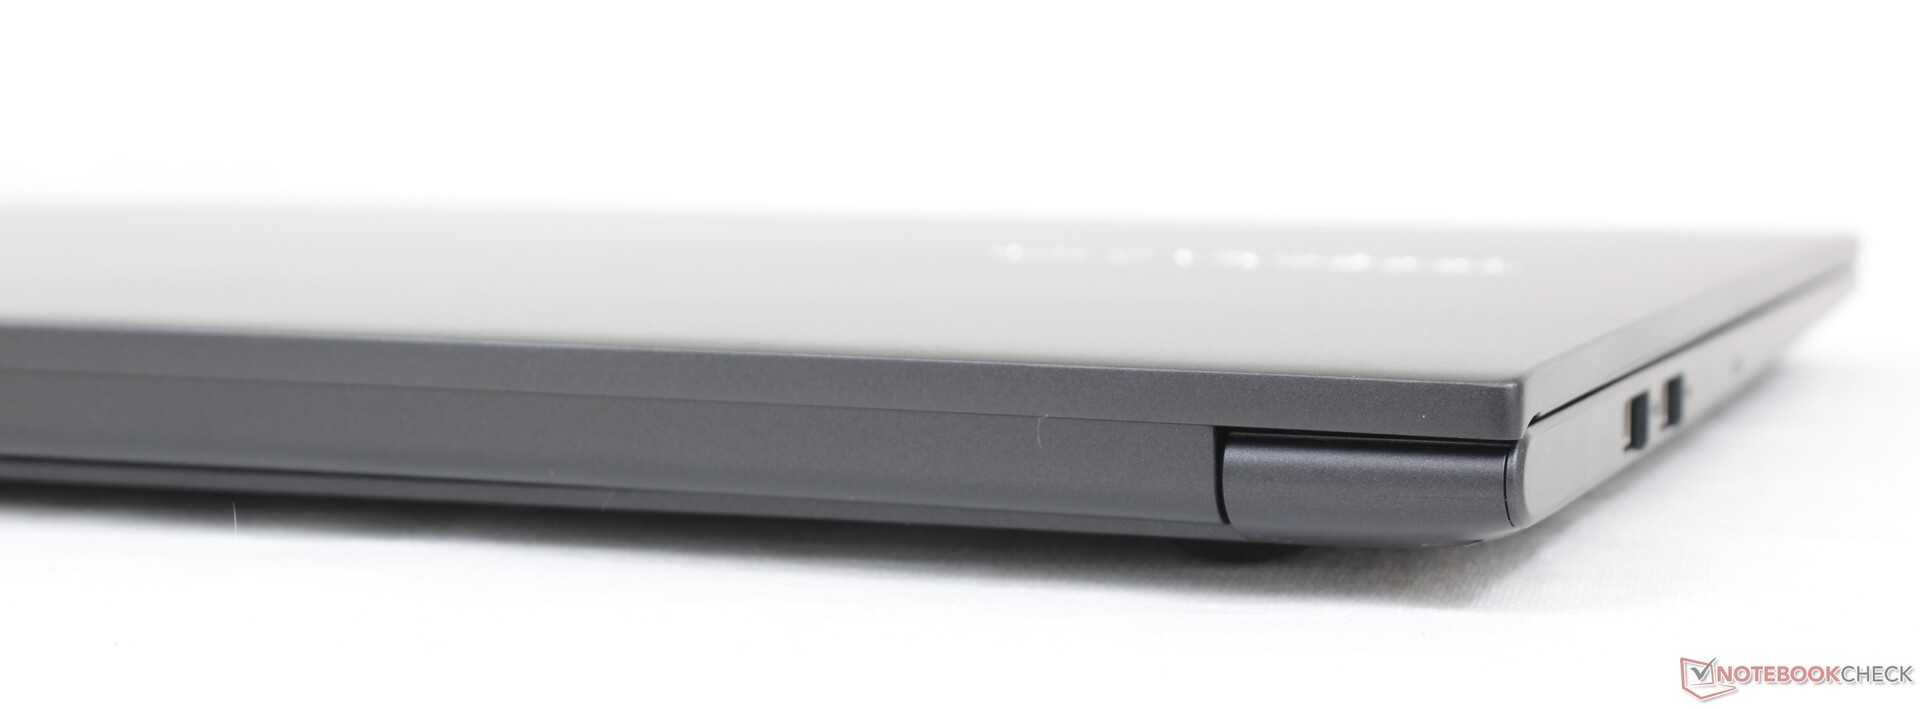
Anslutning - Ingen Thunderbolt- eller USB-C-laddning
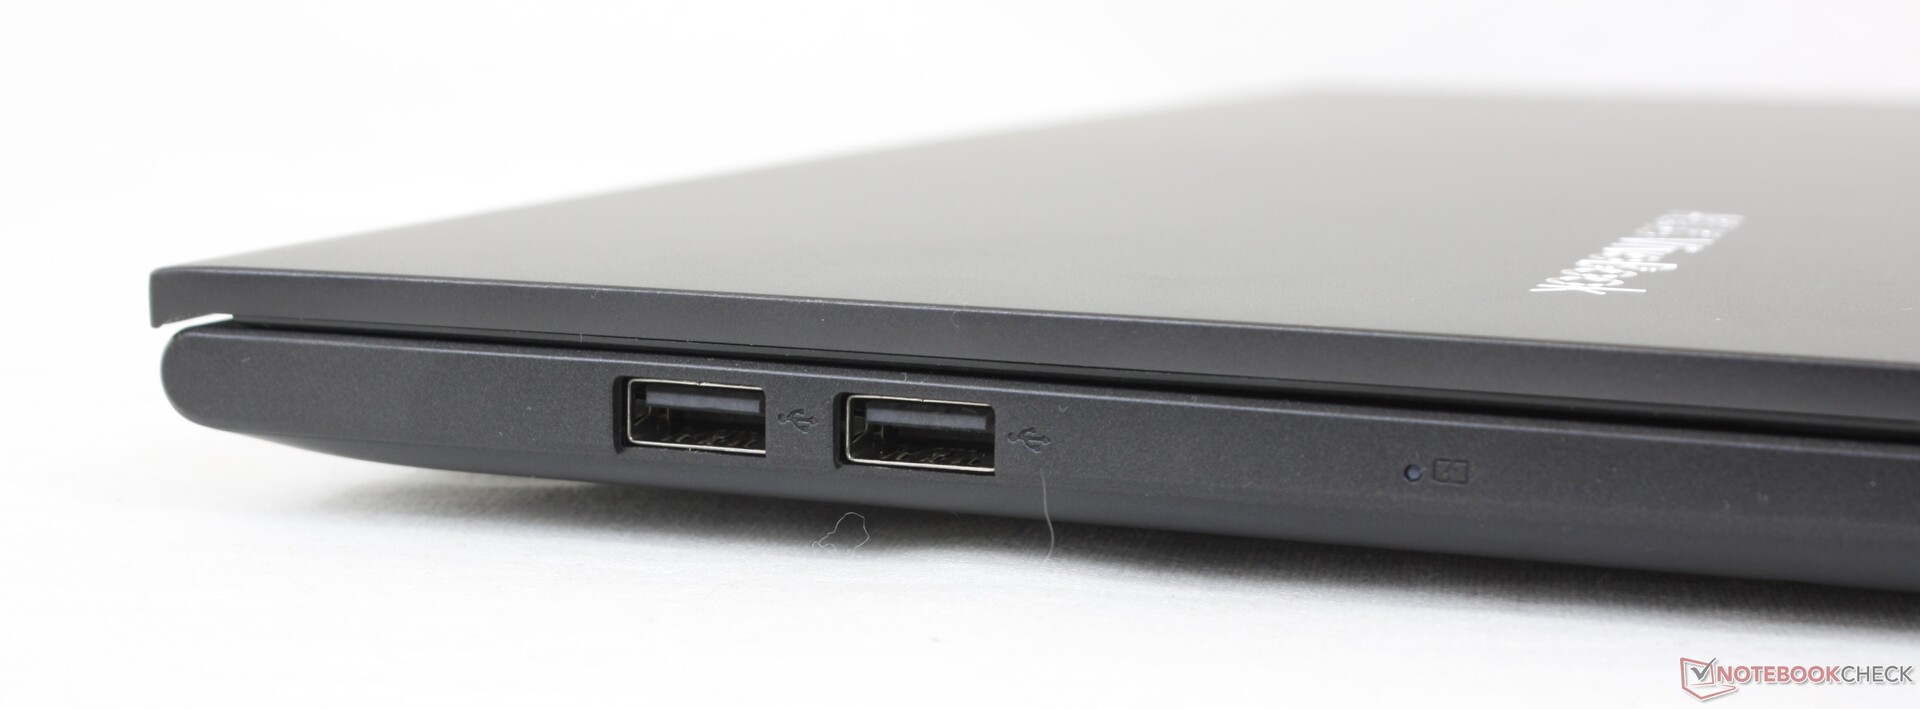
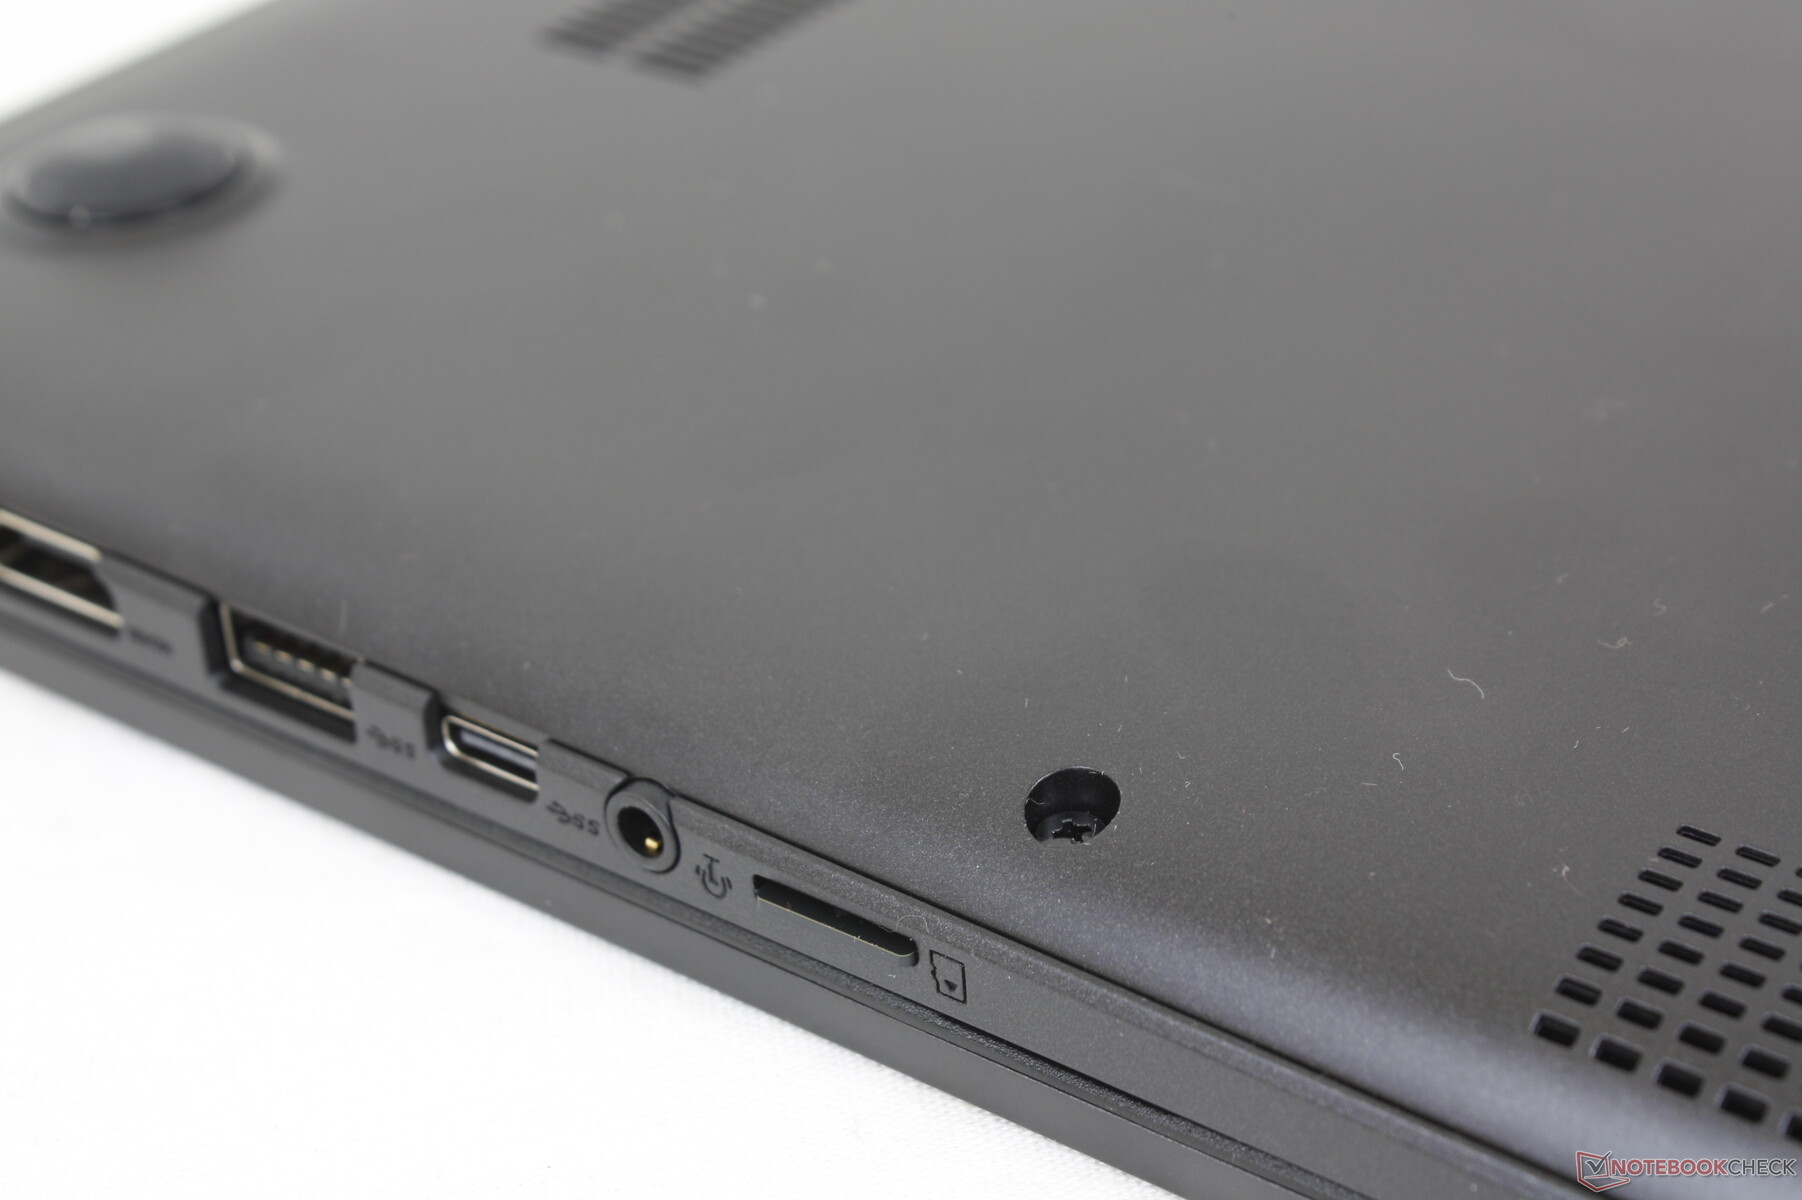
Portalternativen är anständiga, men med besvikna förbehåll. För det första har USB-C-porten inte stöd för DisplayPort eller Power Delivery, vilket innebär att du inte kan ansluta externa bildskärmar eller ladda systemet via denna port, till skillnad från de flesta andra bärbara datorer. För det andra har HDMI-porten endast version 1.4, vilket innebär att den saknar stöd för externa 4K-skärmar vid 60 FPS. Modellen använder även fler långsammare USB-A 2.0-portar än USB-A 3.0.
SD-kortläsare
Den fjäderbelastade MicroSD-kortläsaren är fortfarande långsam för att återspegla Vivobook-sortimentet i budgetklassen. Att flytta 1 GB bilder från vårt UHS-II-testkort till skrivbordet tar cirka 30 sekunder jämfört med endast 14 sekunder på ZenBook 15.
| SD Card Reader | |
| average JPG Copy Test (av. of 3 runs) | |
| HP Pavilion 15-eg (AV PRO microSD 128 GB V60) | |
| Asus VivoBook 15 Pro M3500QC-L1062 (AV Pro V60) | |
| Asus Vivobook 15 K513EQ (AV Pro V60) | |
| Lenovo IdeaPad 5 15ALC05 (Toshiba Exceria Pro SDXC 64 GB UHS-II) | |
| Asus VivoBook S15 S533EQ-BQ002T (Toshiba Exceria Pro M501 microSDXC 64GB) | |
| Dell Inspiron 15 3501 (AV Pro SD 128 GB V60) | |
| maximum AS SSD Seq Read Test (1GB) | |
| HP Pavilion 15-eg (AV PRO microSD 128 GB V60) | |
| Asus VivoBook 15 Pro M3500QC-L1062 (AV Pro V60) | |
| Asus Vivobook 15 K513EQ (AV Pro V60) | |
| Lenovo IdeaPad 5 15ALC05 (Toshiba Exceria Pro SDXC 64 GB UHS-II) | |
| Dell Inspiron 15 3501 (AV Pro SD microSD 128 GB V60) | |
| Asus VivoBook S15 S533EQ-BQ002T (Toshiba Exceria Pro M501 microSDXC 64GB) | |
Kommunikation
Vår testenhet har Wi-Fi 6 medan mindre enheter har Wi-Fi 5. Vi kan nå utmärkta genomsnittliga mottagningshastigheter på över 1,2 Gbps på vår Netgear RAX200-testrouter, medan överföringshastigheterna är mer nedslående, bara ~600 Mbps.
Webbkamera
Kamerakvaliteten är dålig och har i stort sett varit oförändrad i flera år. Windows Hello stöds inte heller eftersom det inte finns någon integrerad IR-sensor eller ens en fysisk sekretesslucka.


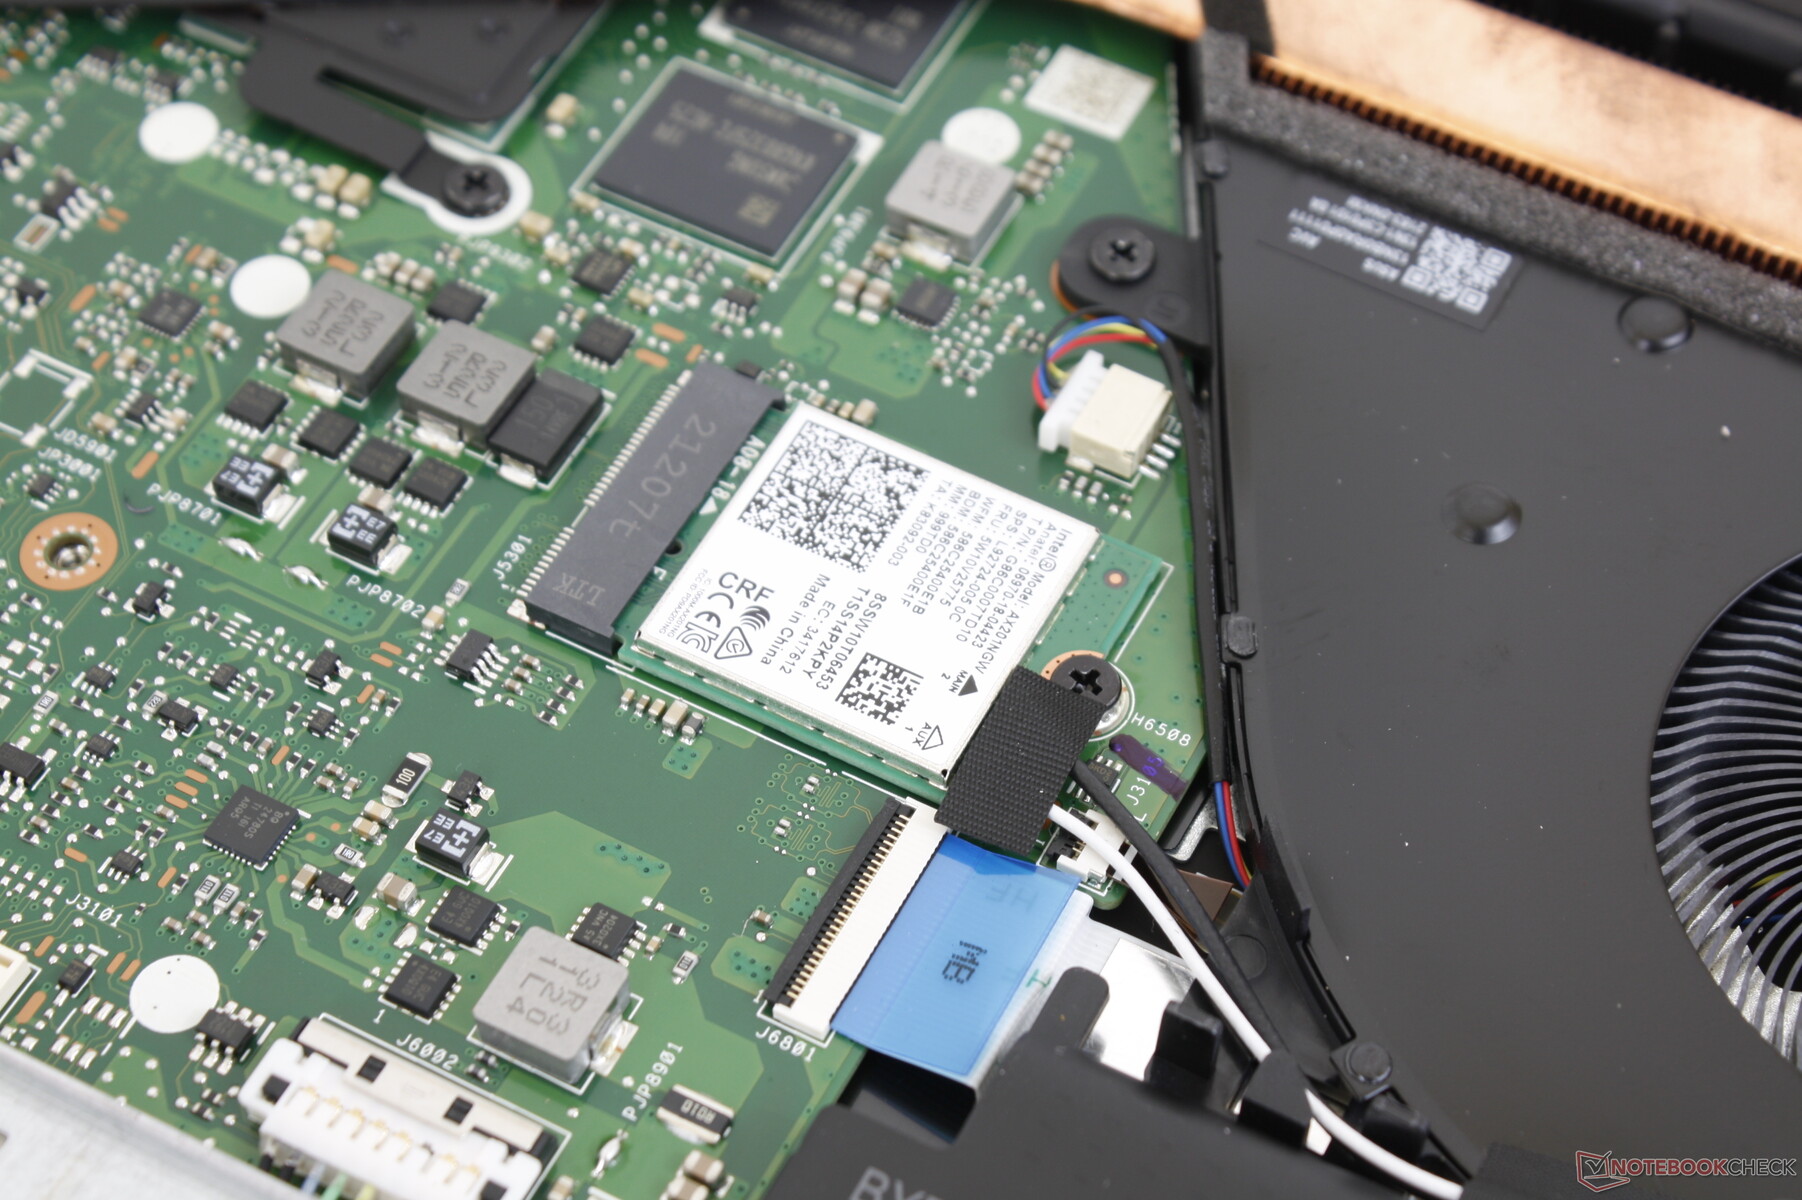
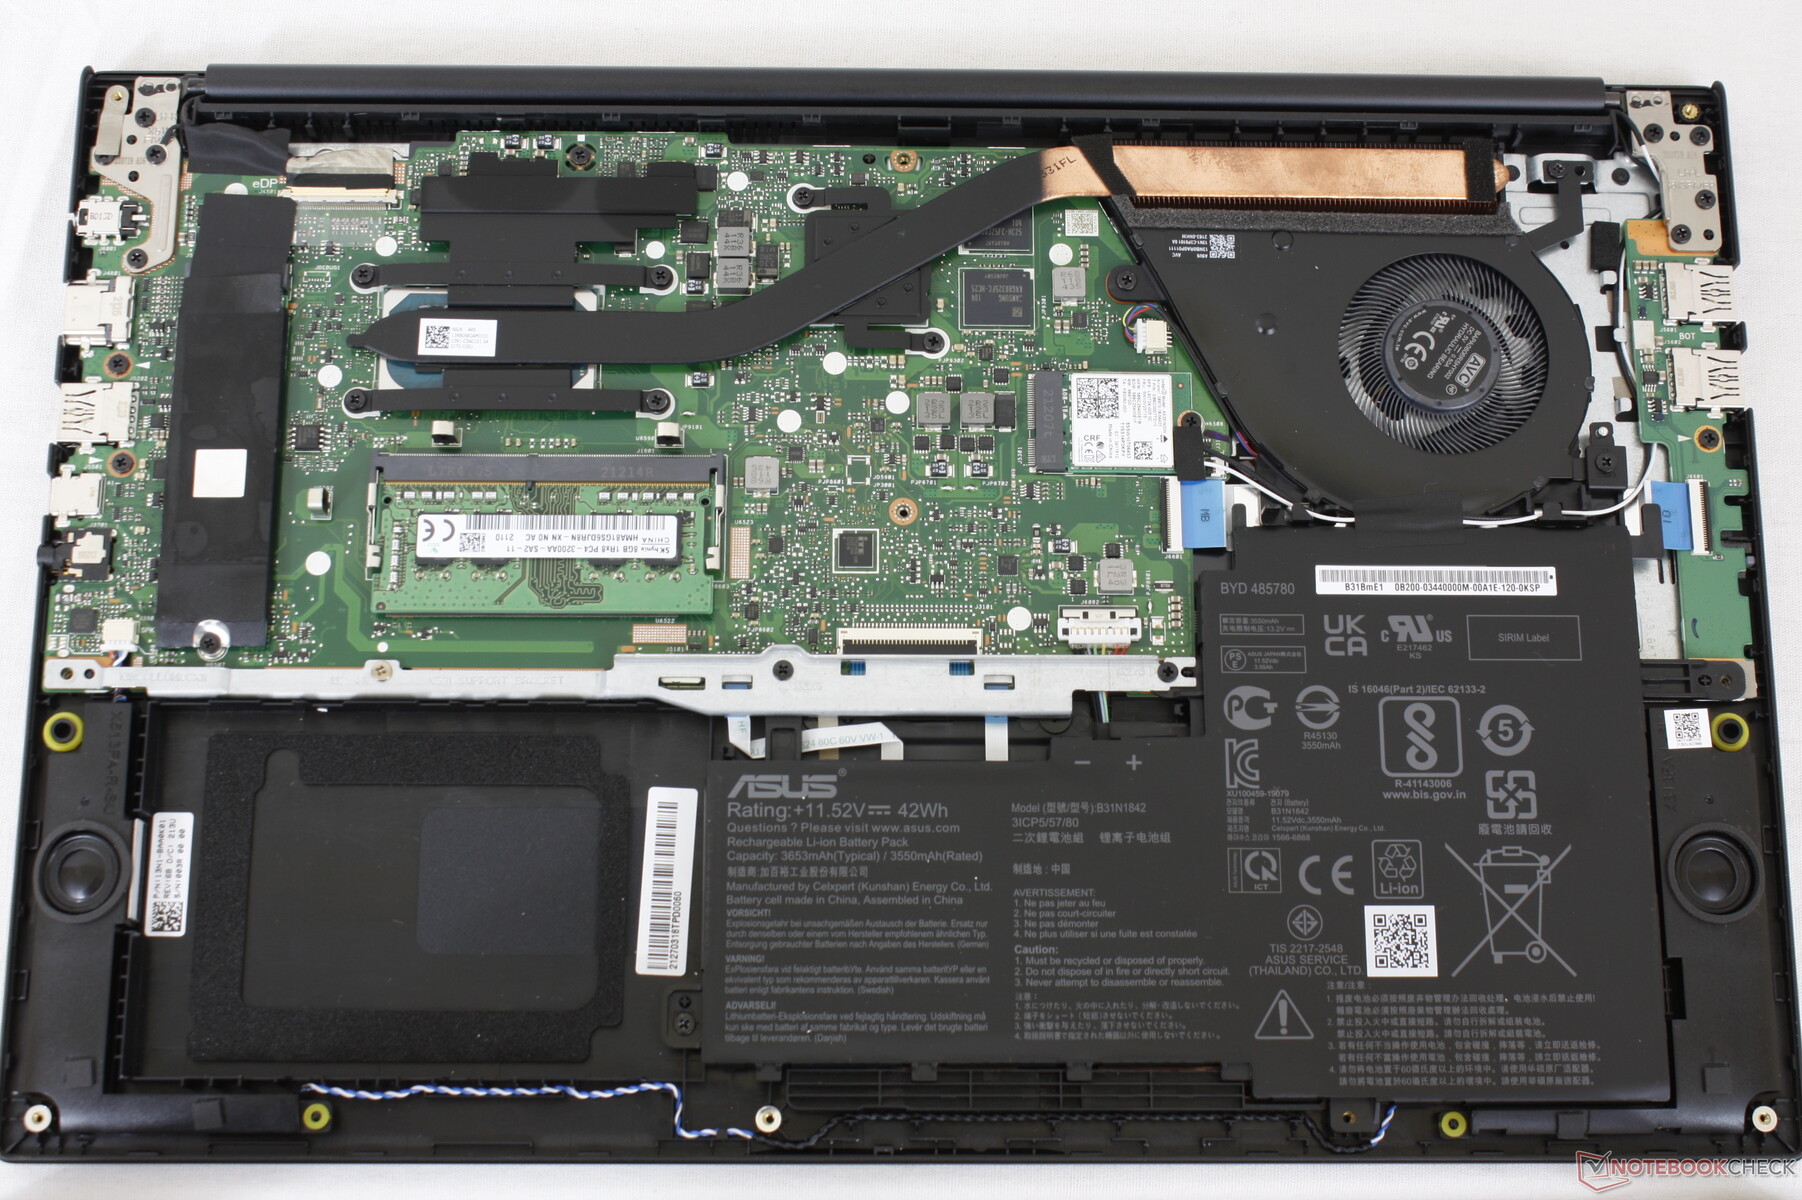
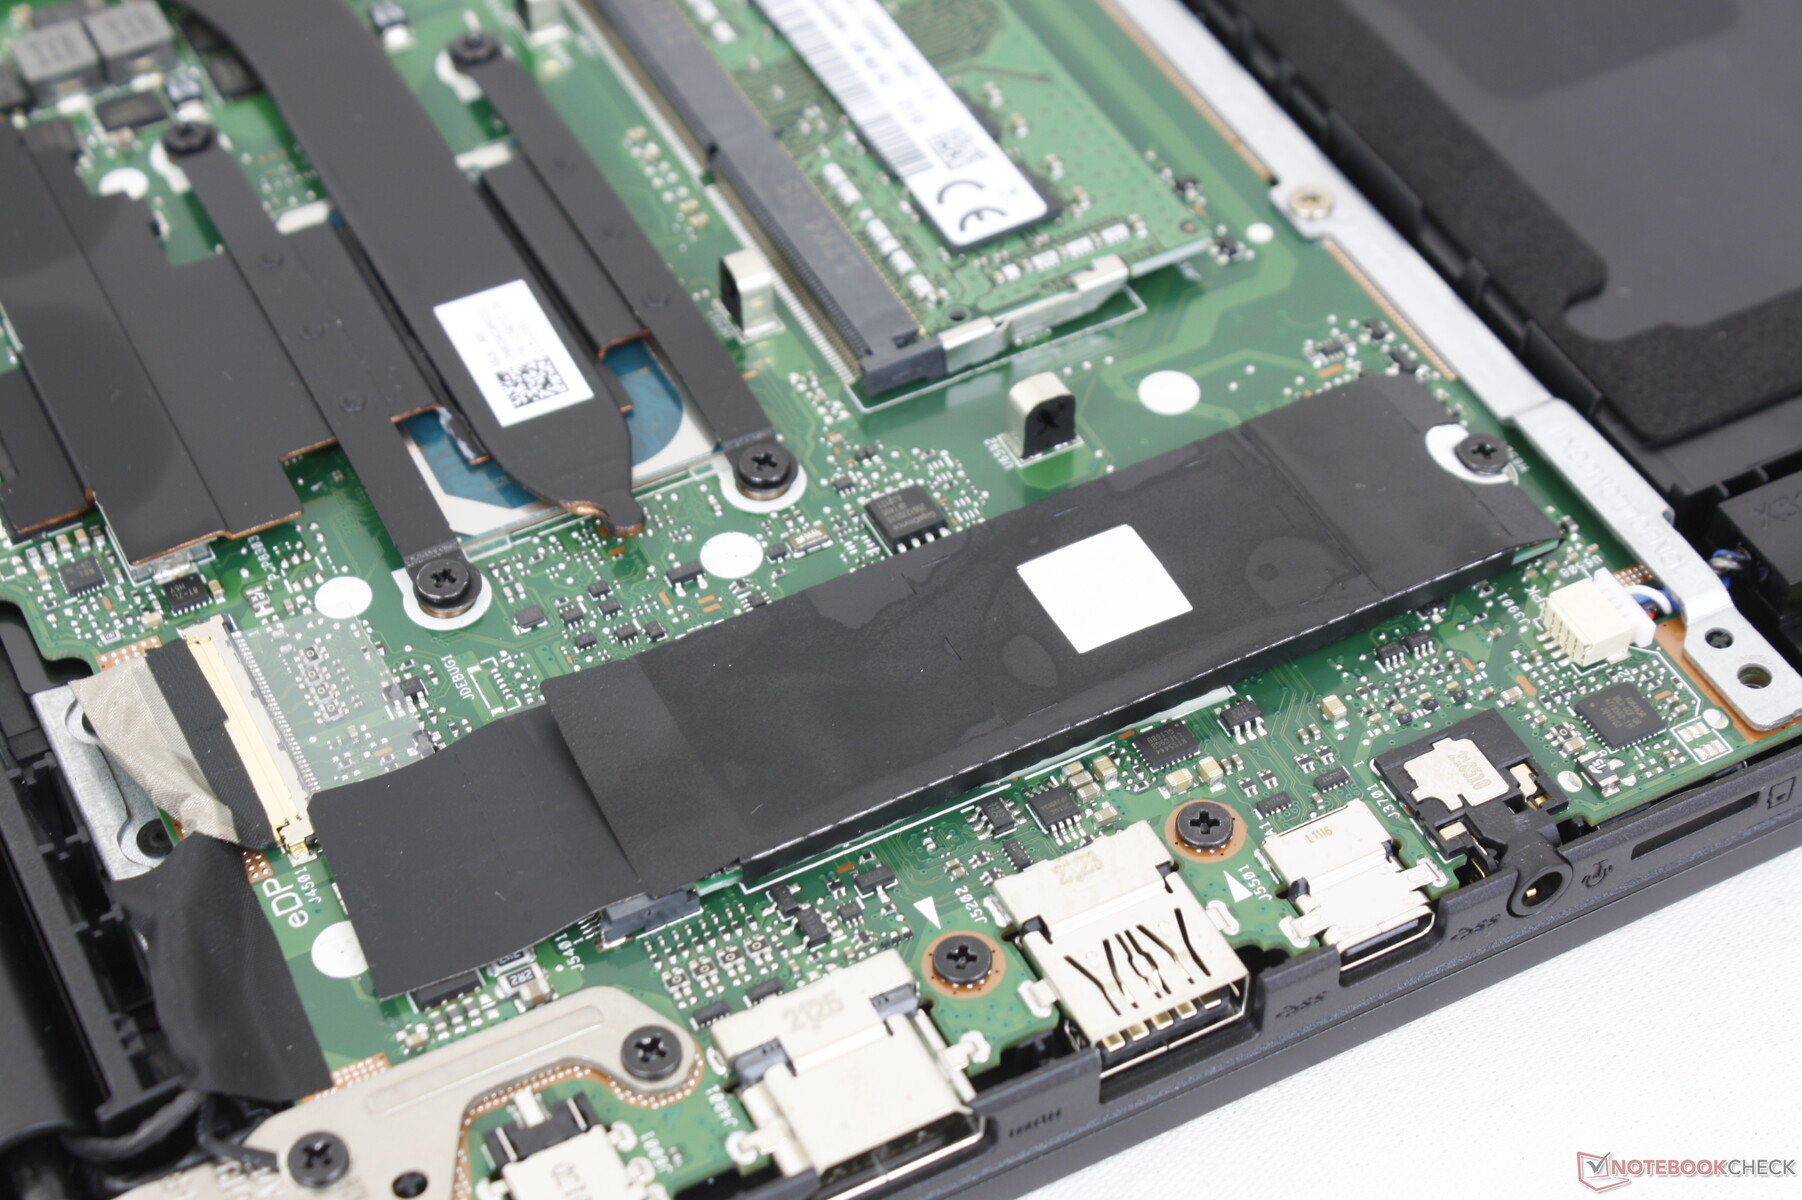
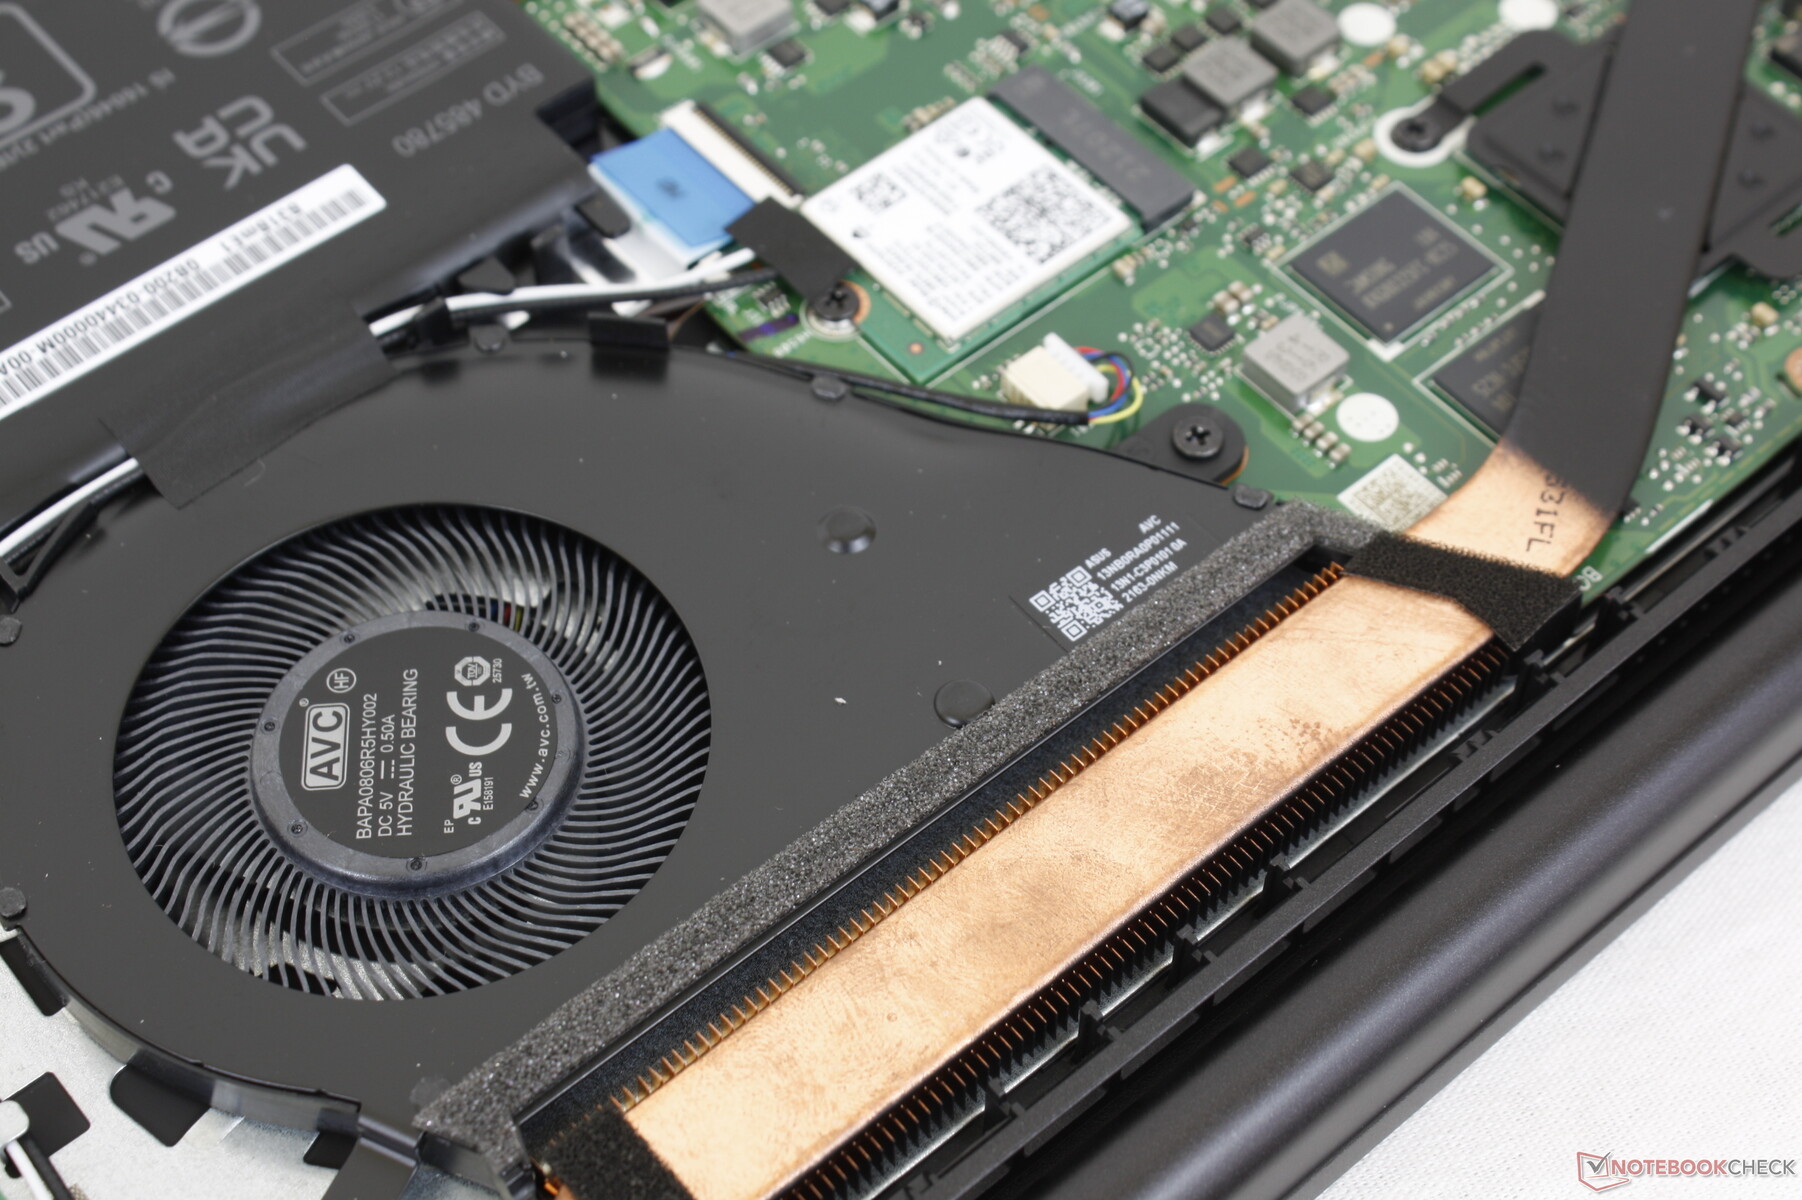
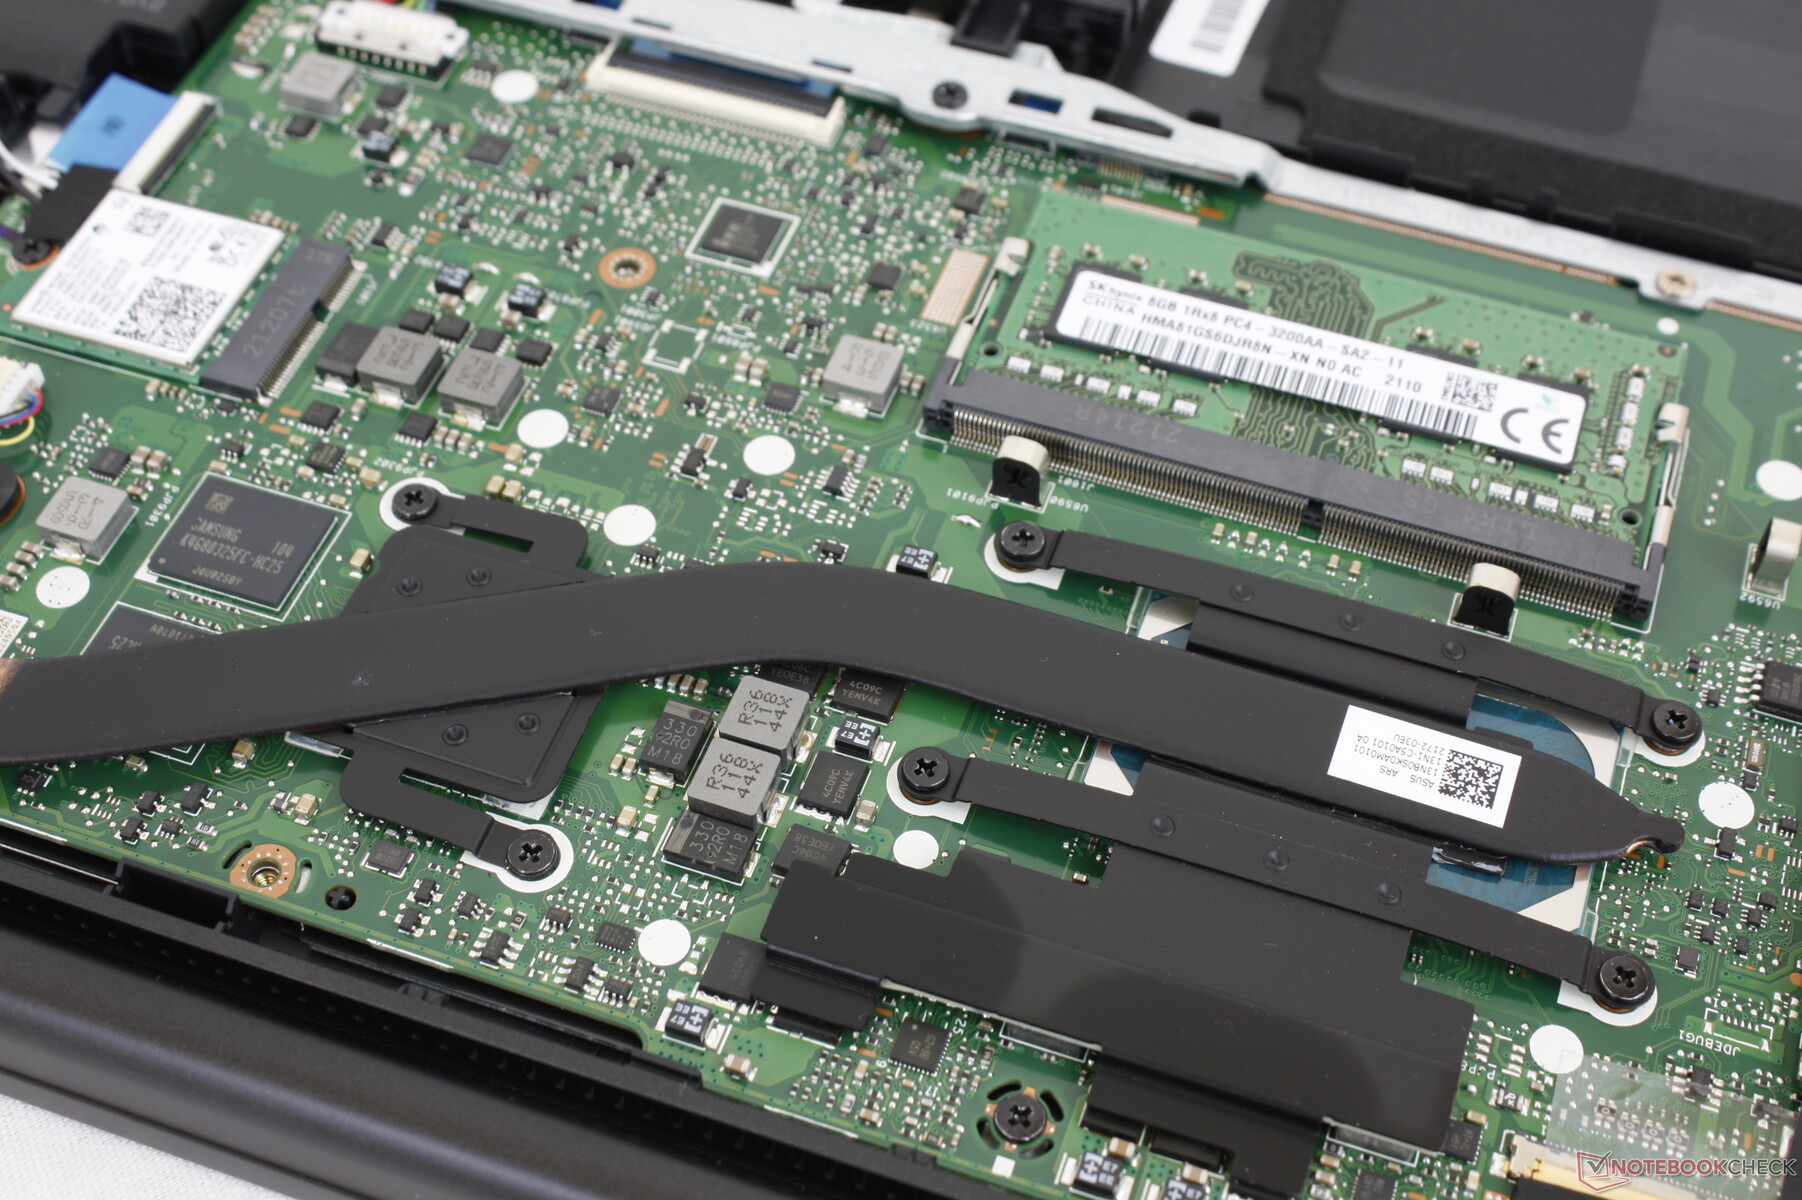
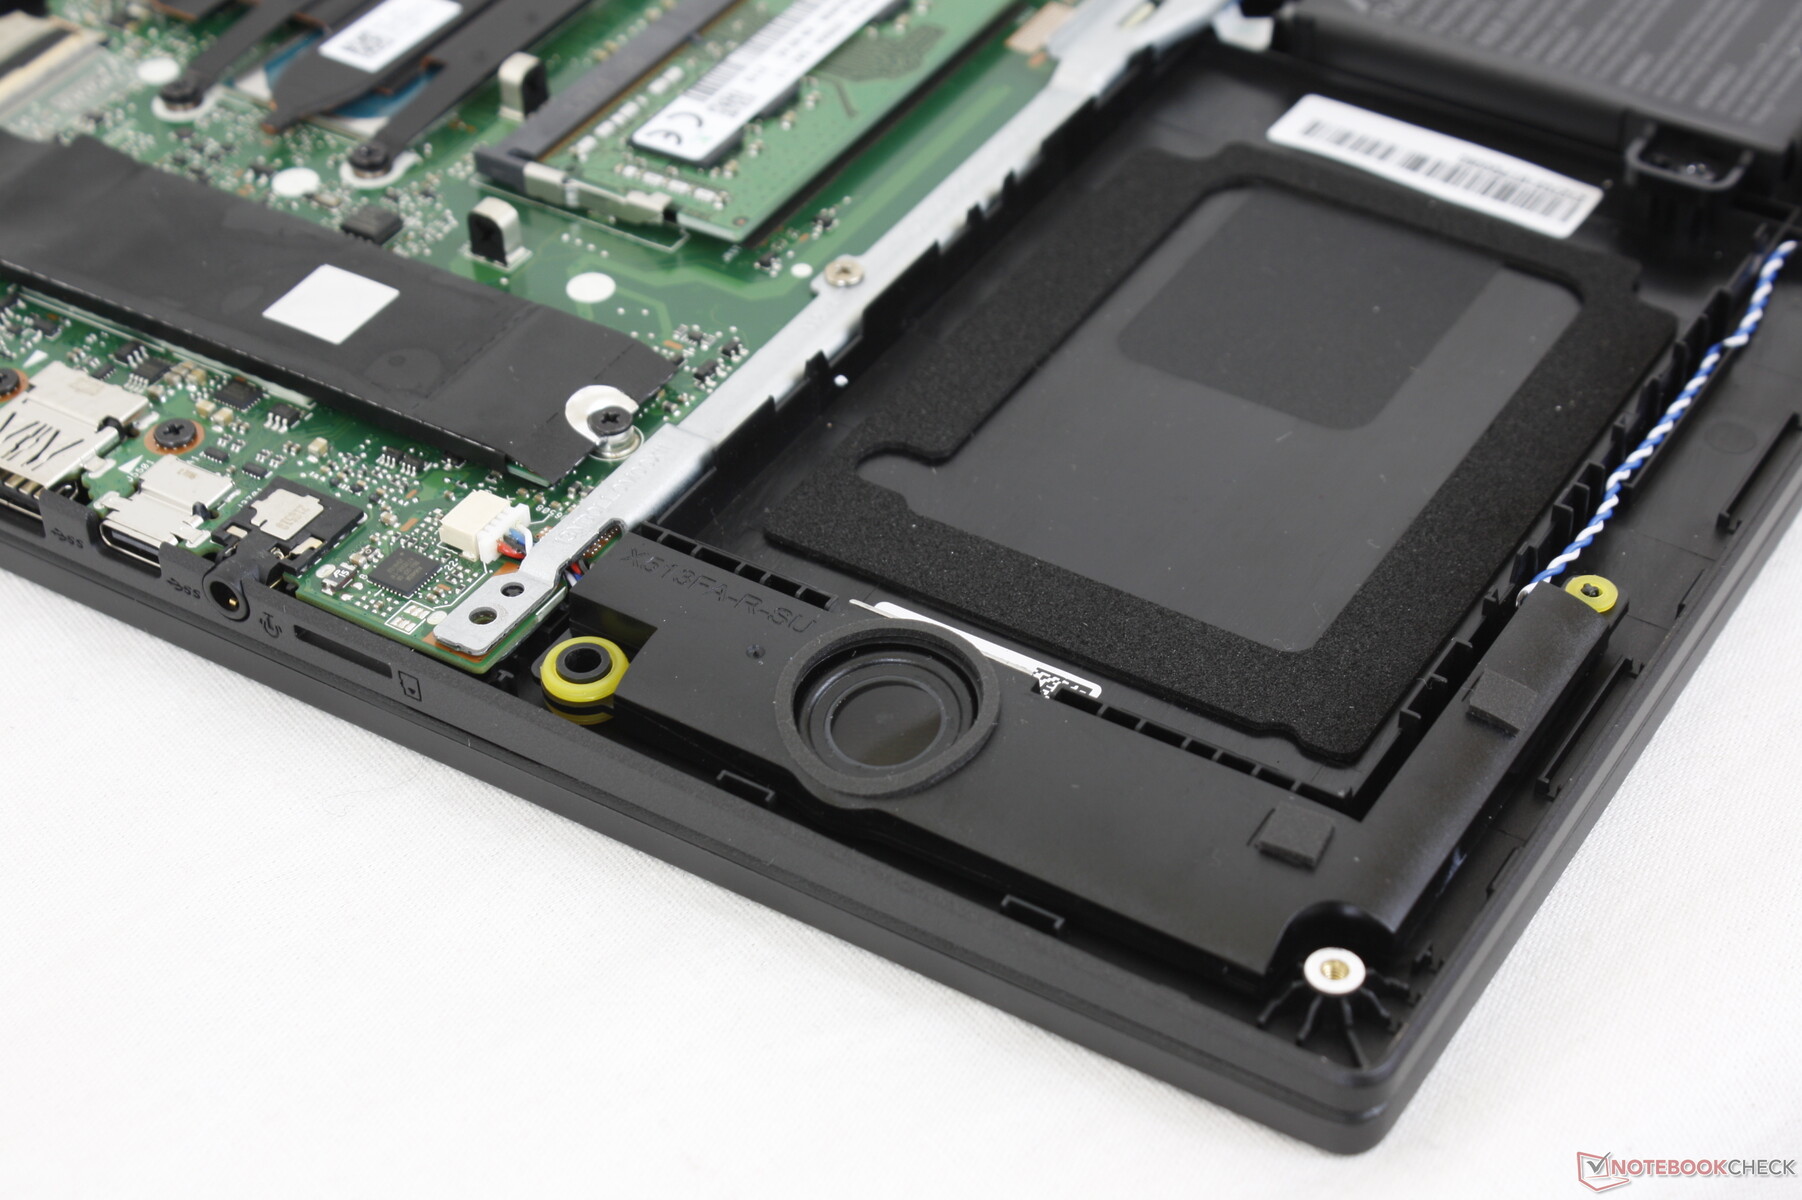
Underhåll - lätt att öppna
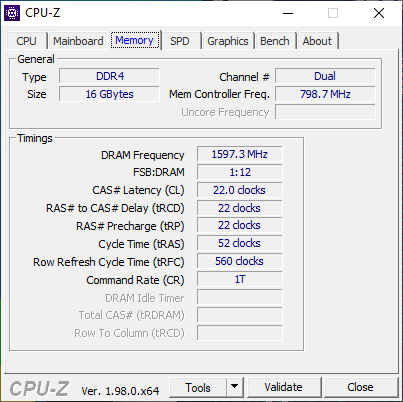
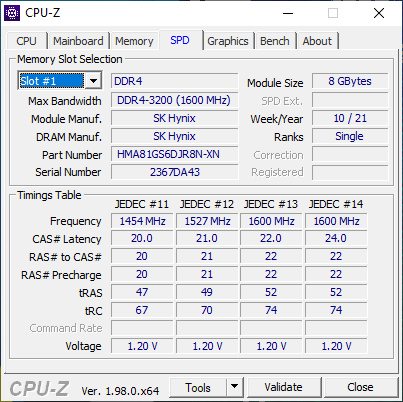
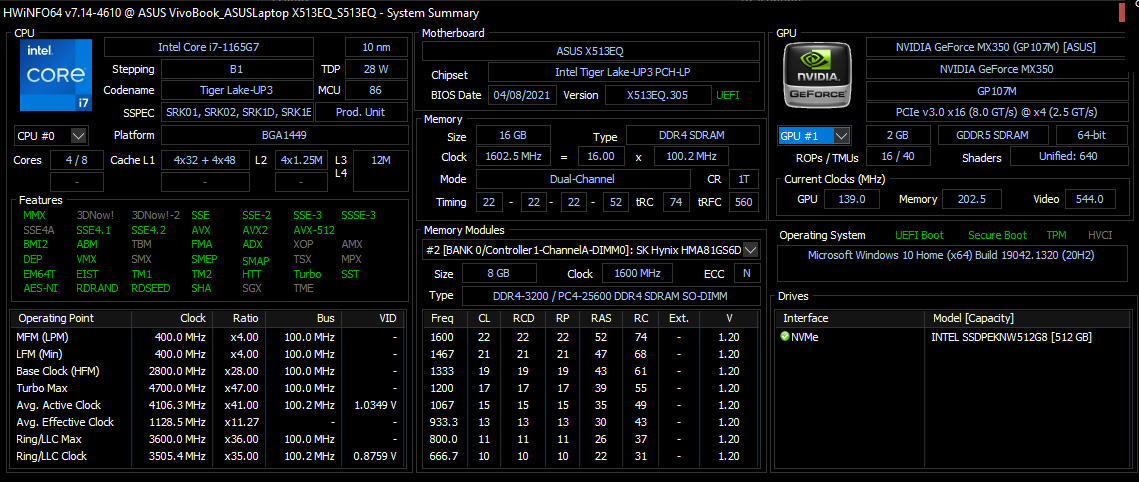
Bottenpanelen kan enkelt tas bort med en Philips-skruvmejsel och en vass kant för att avslöja det enda SODIMM-facket, WLAN-modulen och M.2 2280 PCIe3 x4-facket. En bas 8 GB enkelkanals RAM-minne kommer fastlödd vilket kan paras ihop med en 8 GB flyttbar modul för upp till 16 GB totalt.
Tillbehör och garanti
I butikslådan finns inga andra tillbehör än pappersarbete och nätadapter. Den vanliga ettåriga begränsade tillverkargarantin gäller
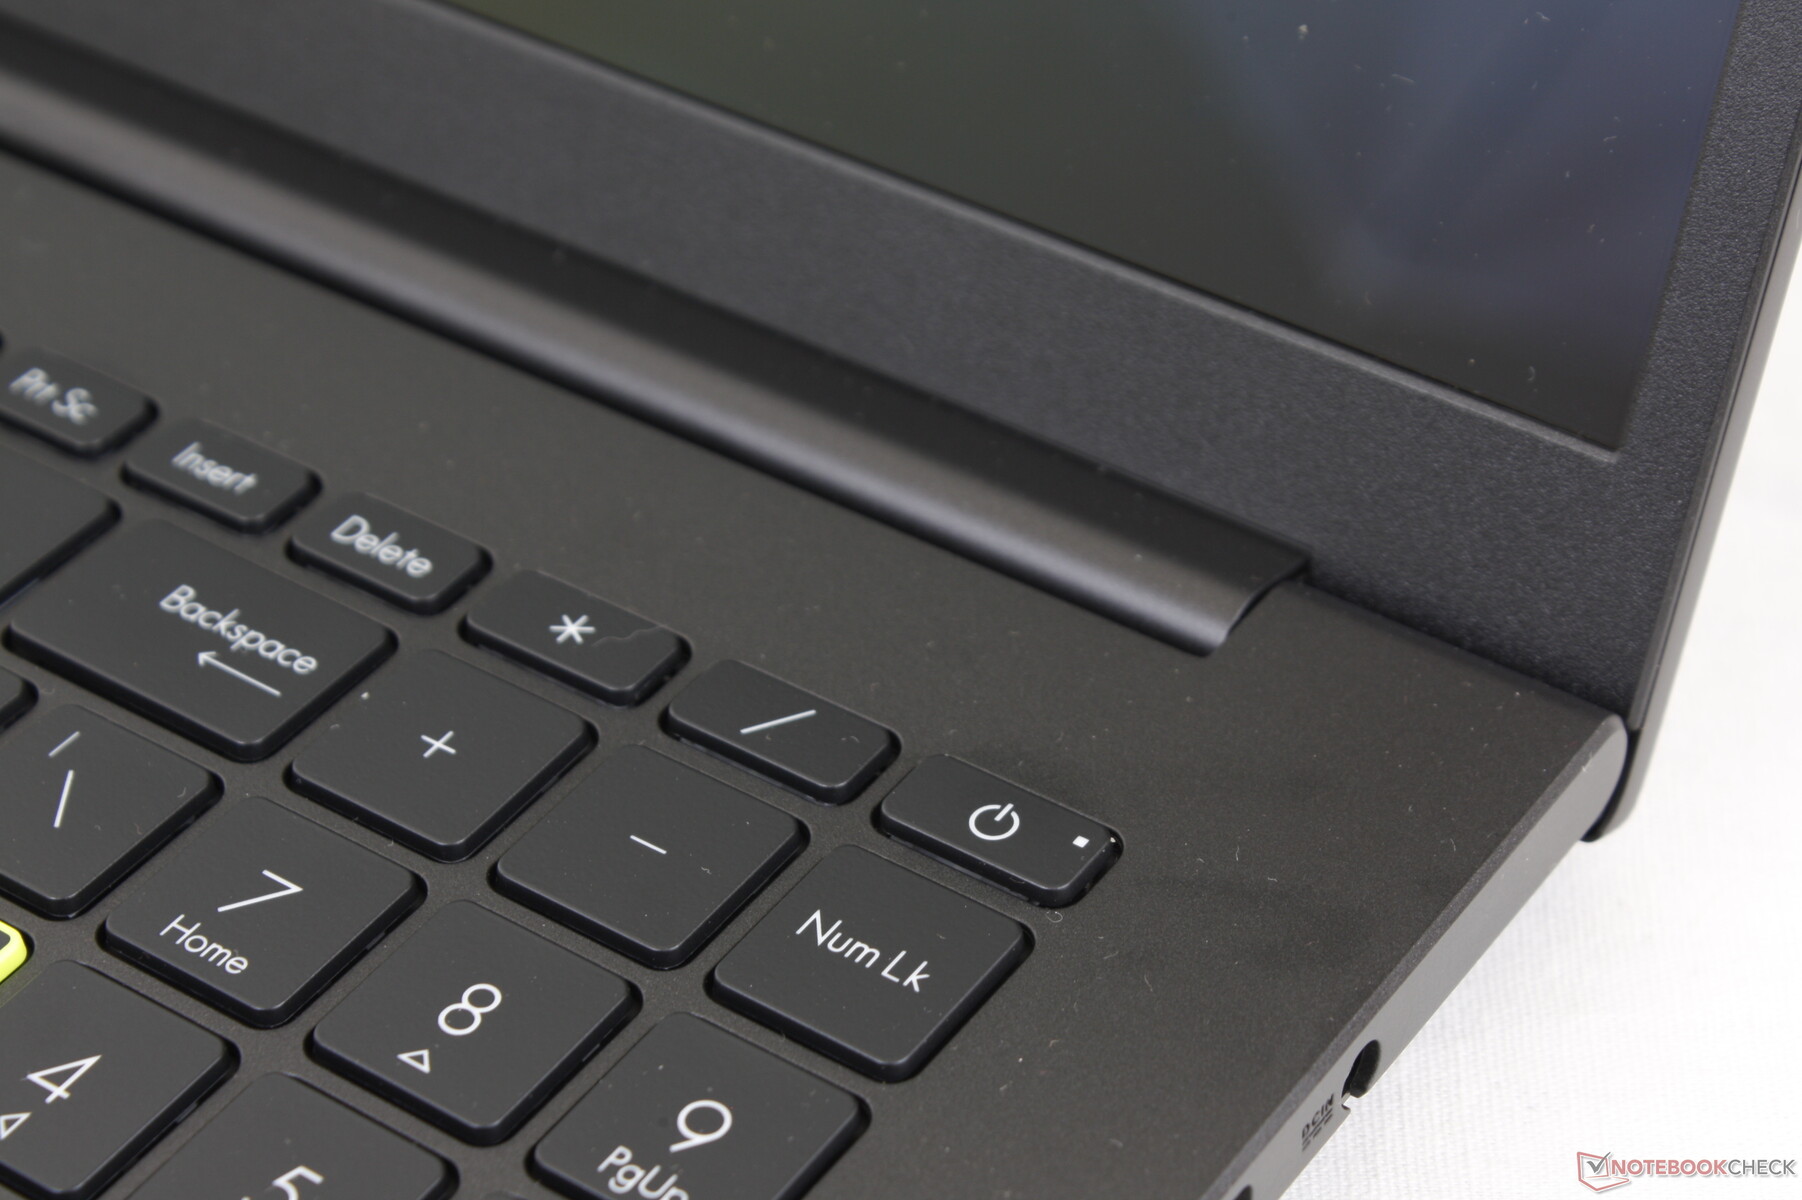
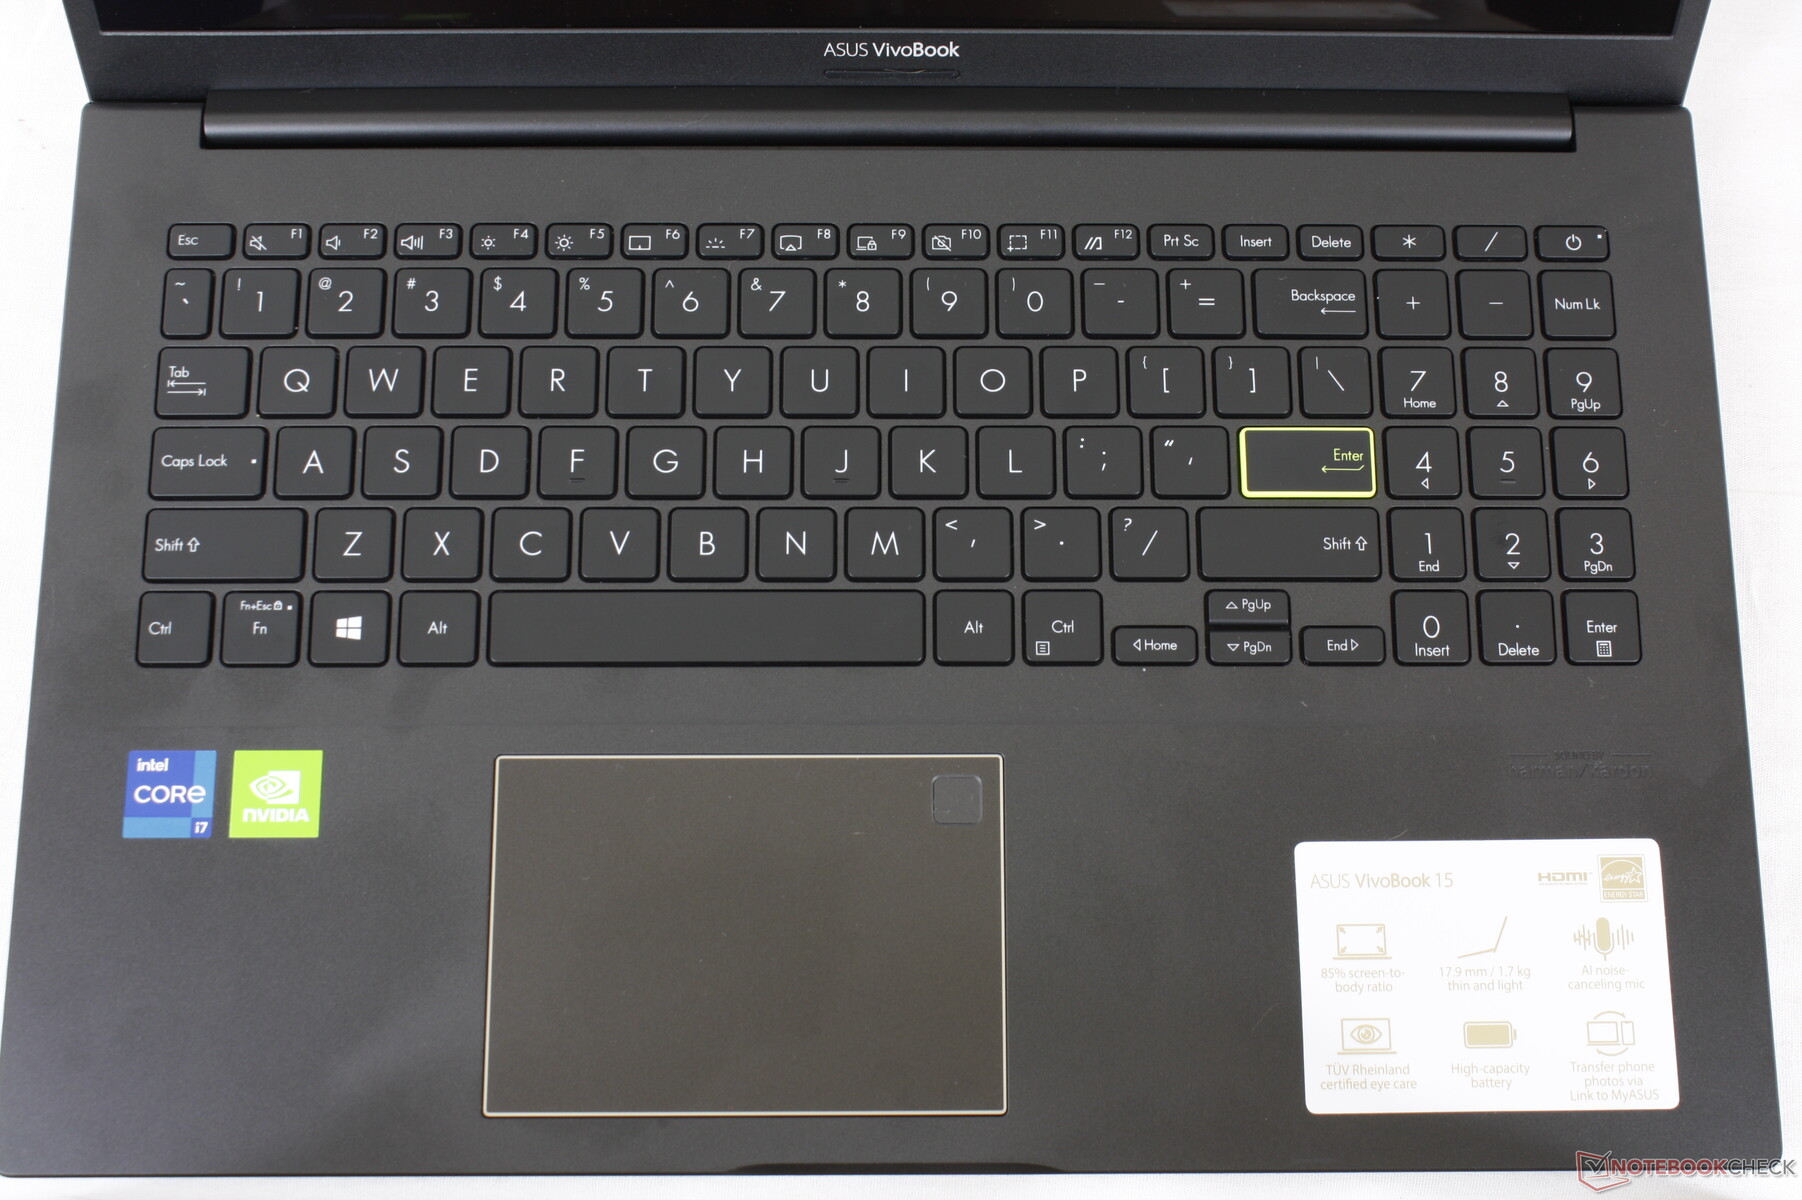
Inmatningsenheter - Svampig klickplatta
Tangentbord
Om du har skrivit på en bärbar VivoBook-dator tidigare vet du exakt vad du kan förvänta dig av VivoBook 15 K513, eftersom det finns mycket små variationer mellan modellerna när det gäller tangentbordsfeedback. Både resning och taktilitet förblir grunda respektive mjuka, jämfört med de fastare tangenterna på den affärsinriktade Lenovo ThinkPad eller HP EliteBook. Tangenterna på Lenovo IdeaPad 5 15känns liknande som de vi har här på Asus, men tangentskrammelet är måttligt högre på Asus.
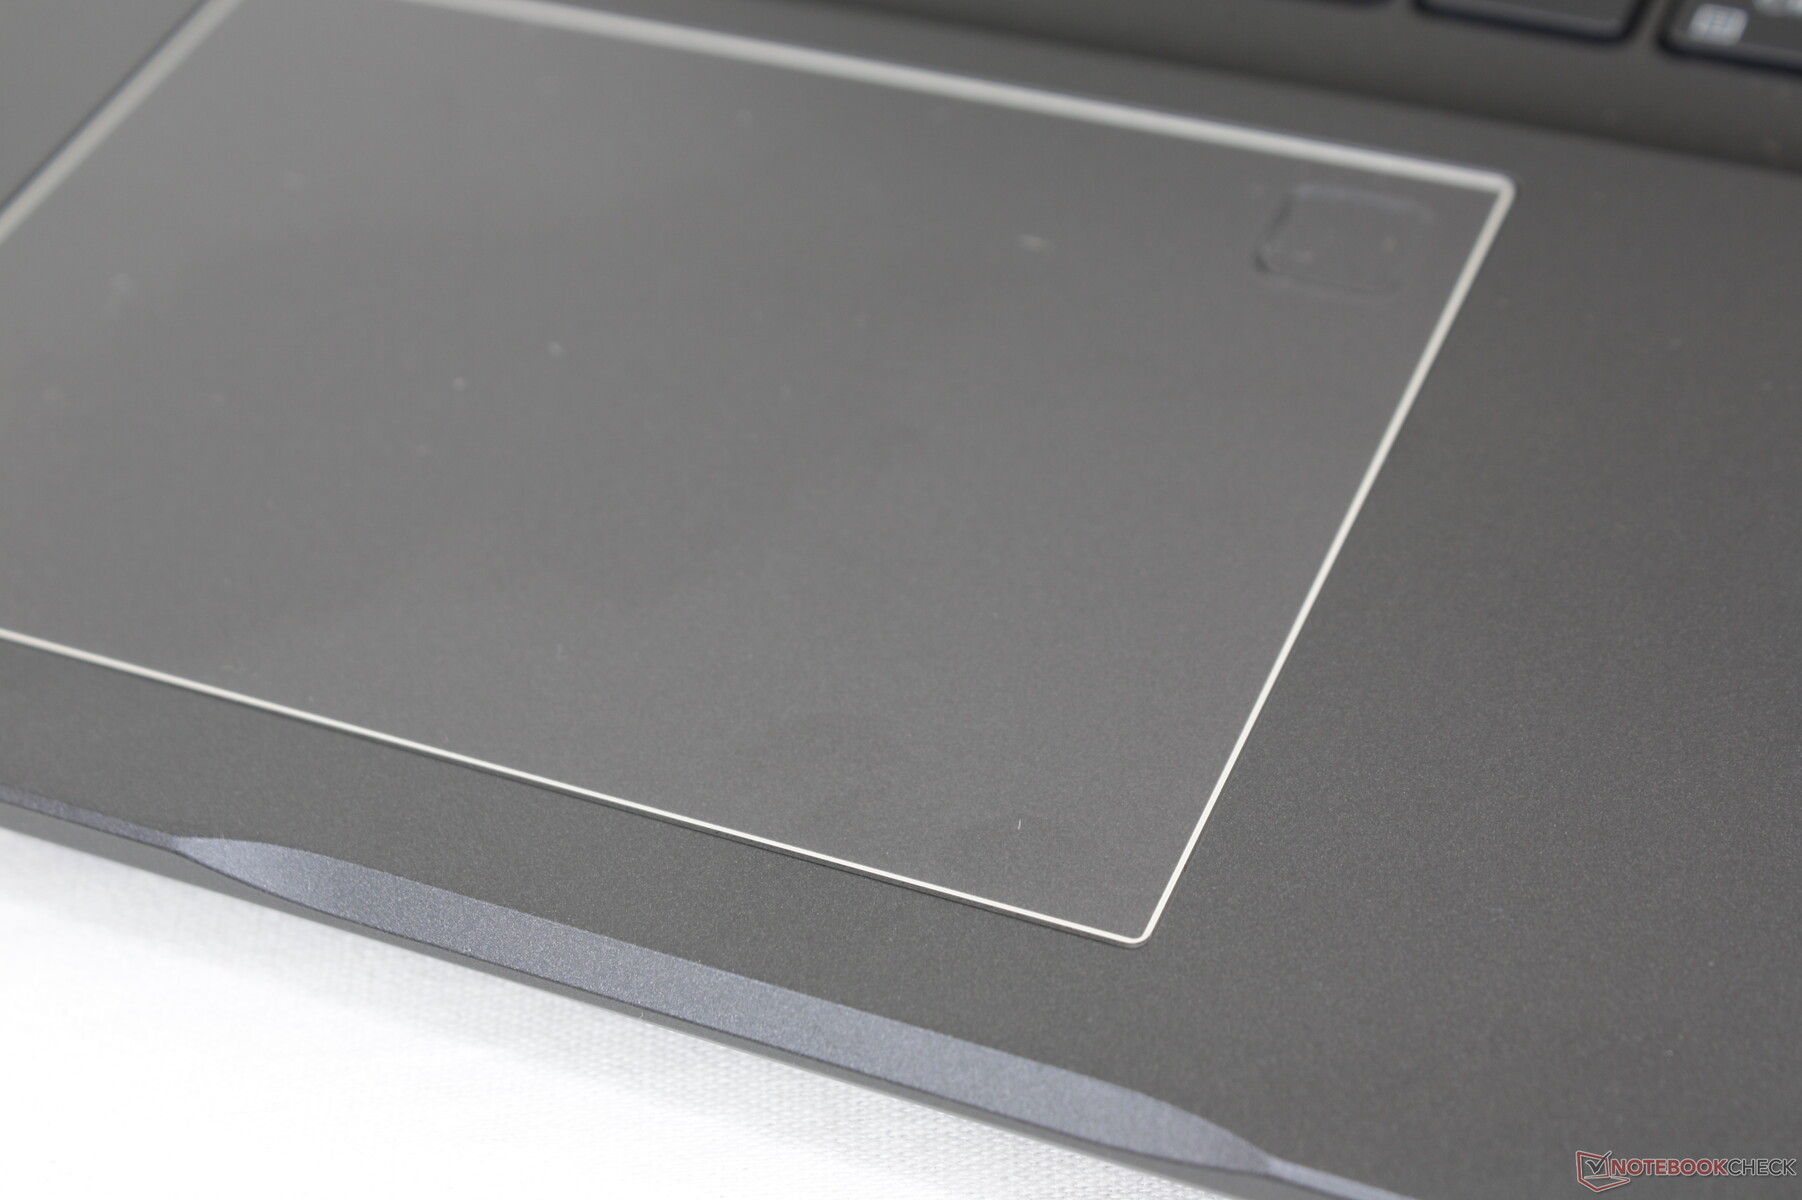
Pekplatta
Klickplattan (~10,5 x 7,3 cm) är dålig och ligger under genomsnittet även med budgetstandard. Medan den vanliga markörrörelsen är smidig och utan plötsliga hopp är de integrerade musknapparna alldeles för svampiga och grunda. Klickandet känns därför otillfredsställande, särskilt om man klickar och drar eller utför andra multi-touch-åtgärder.


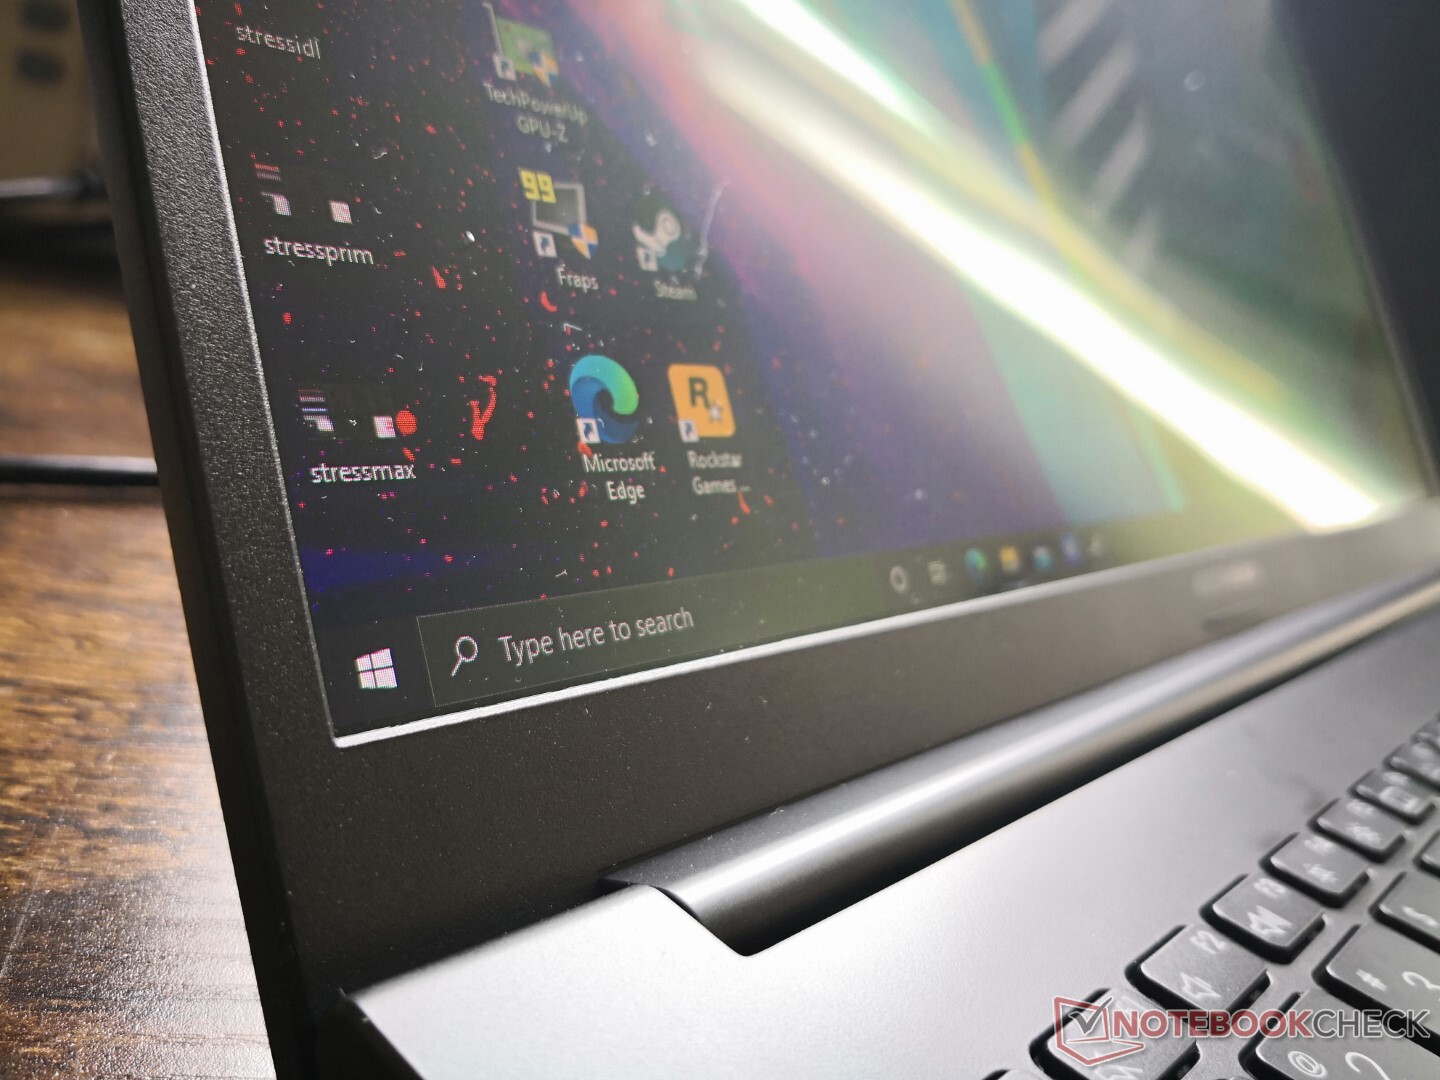
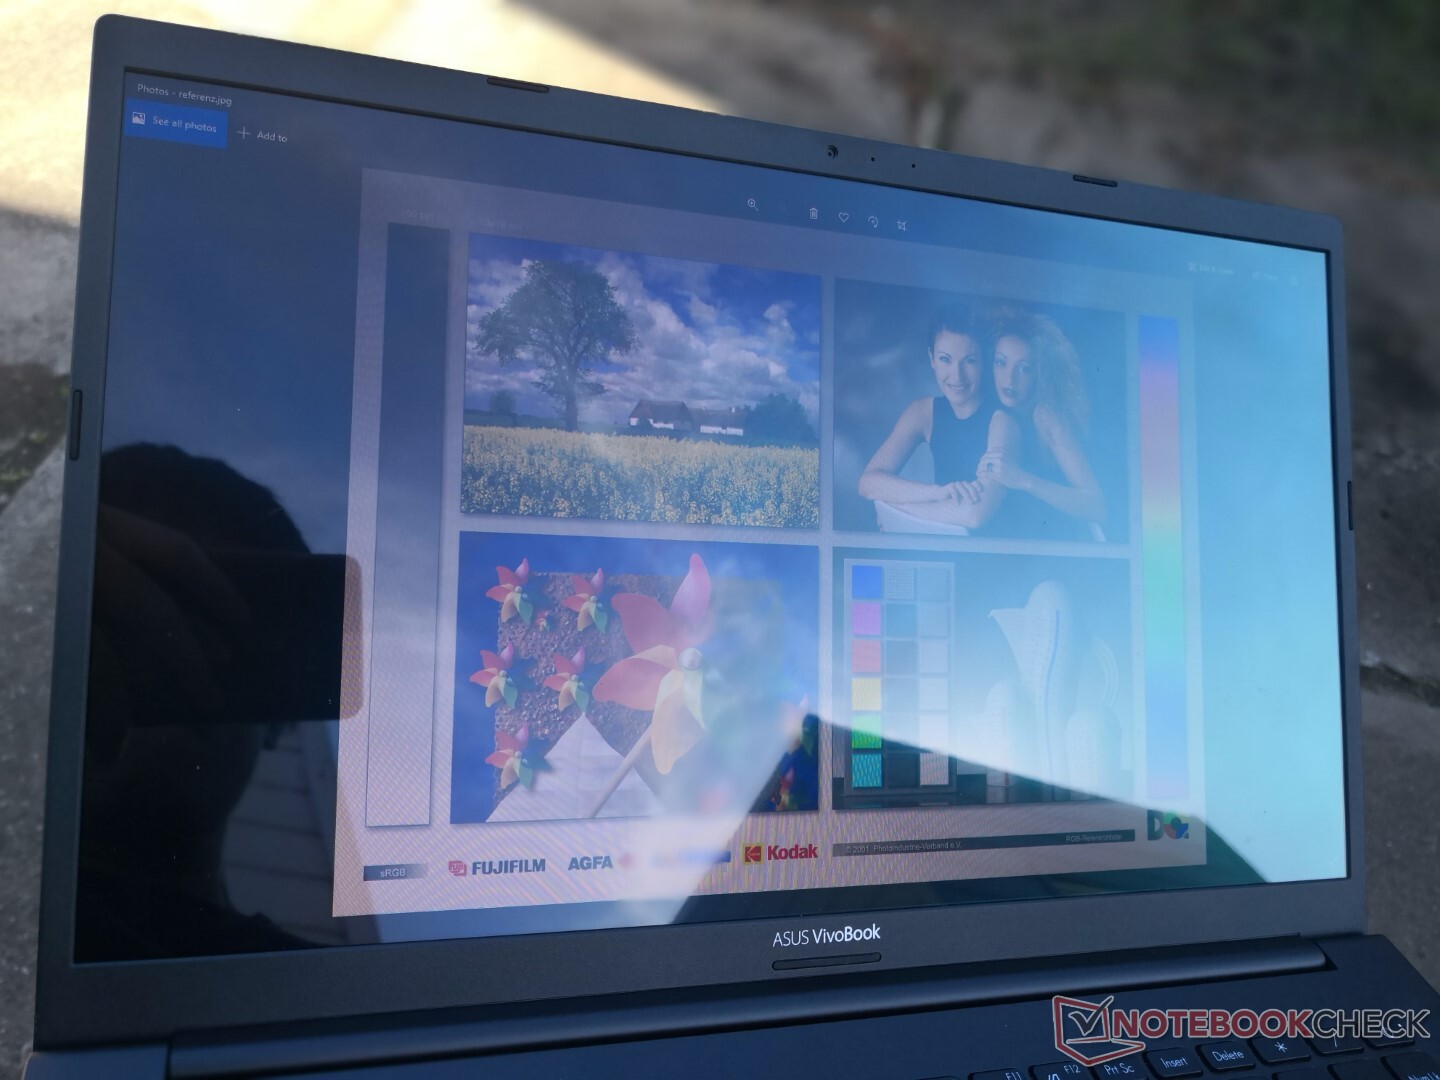
Skärm - Oftast bättre än IPS
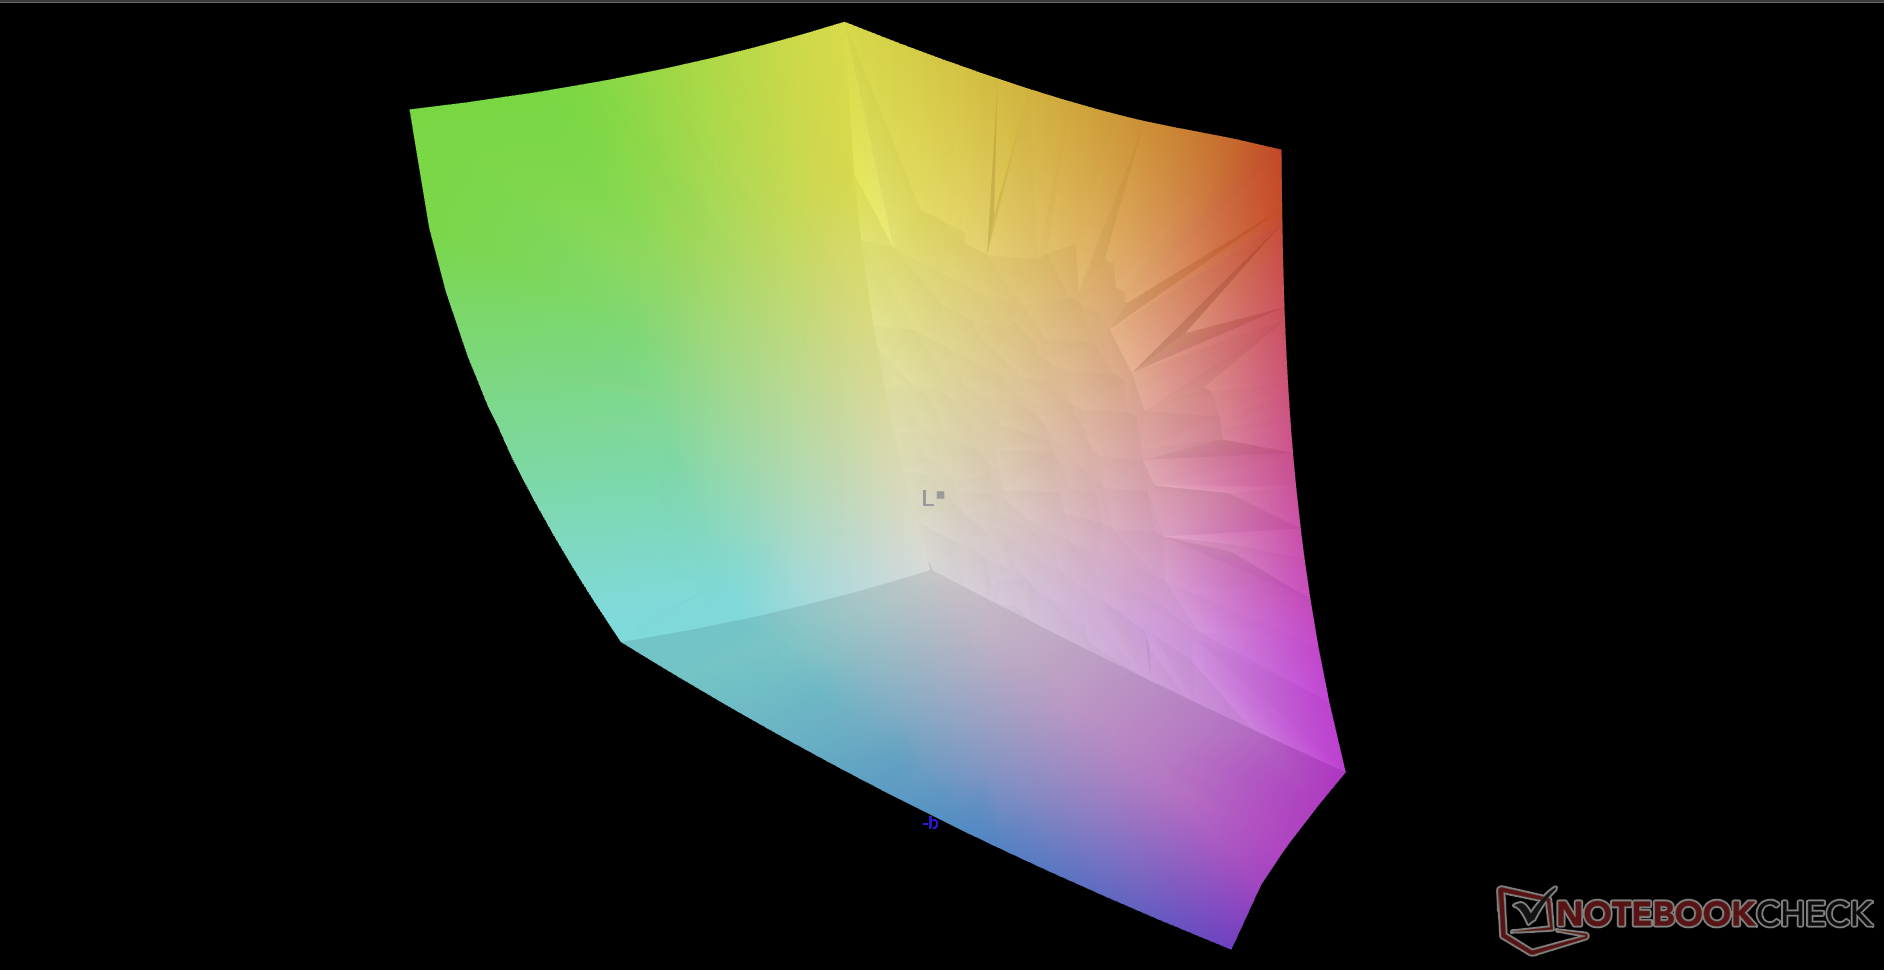
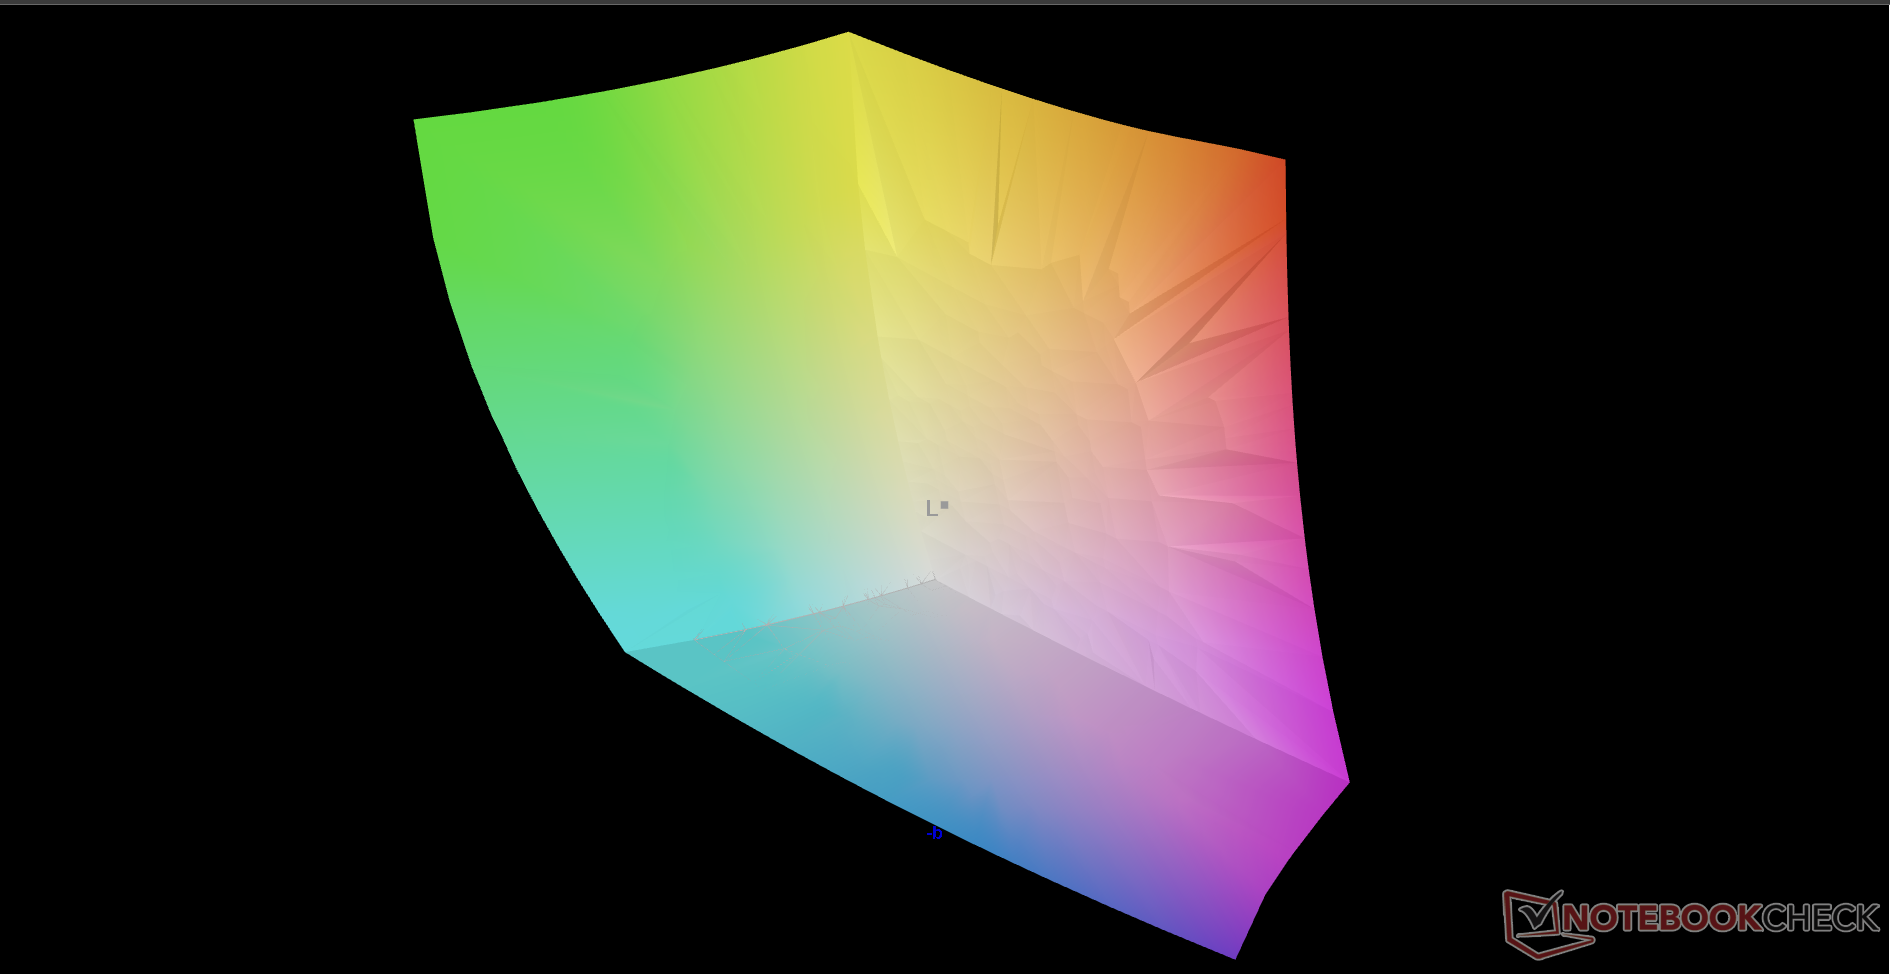
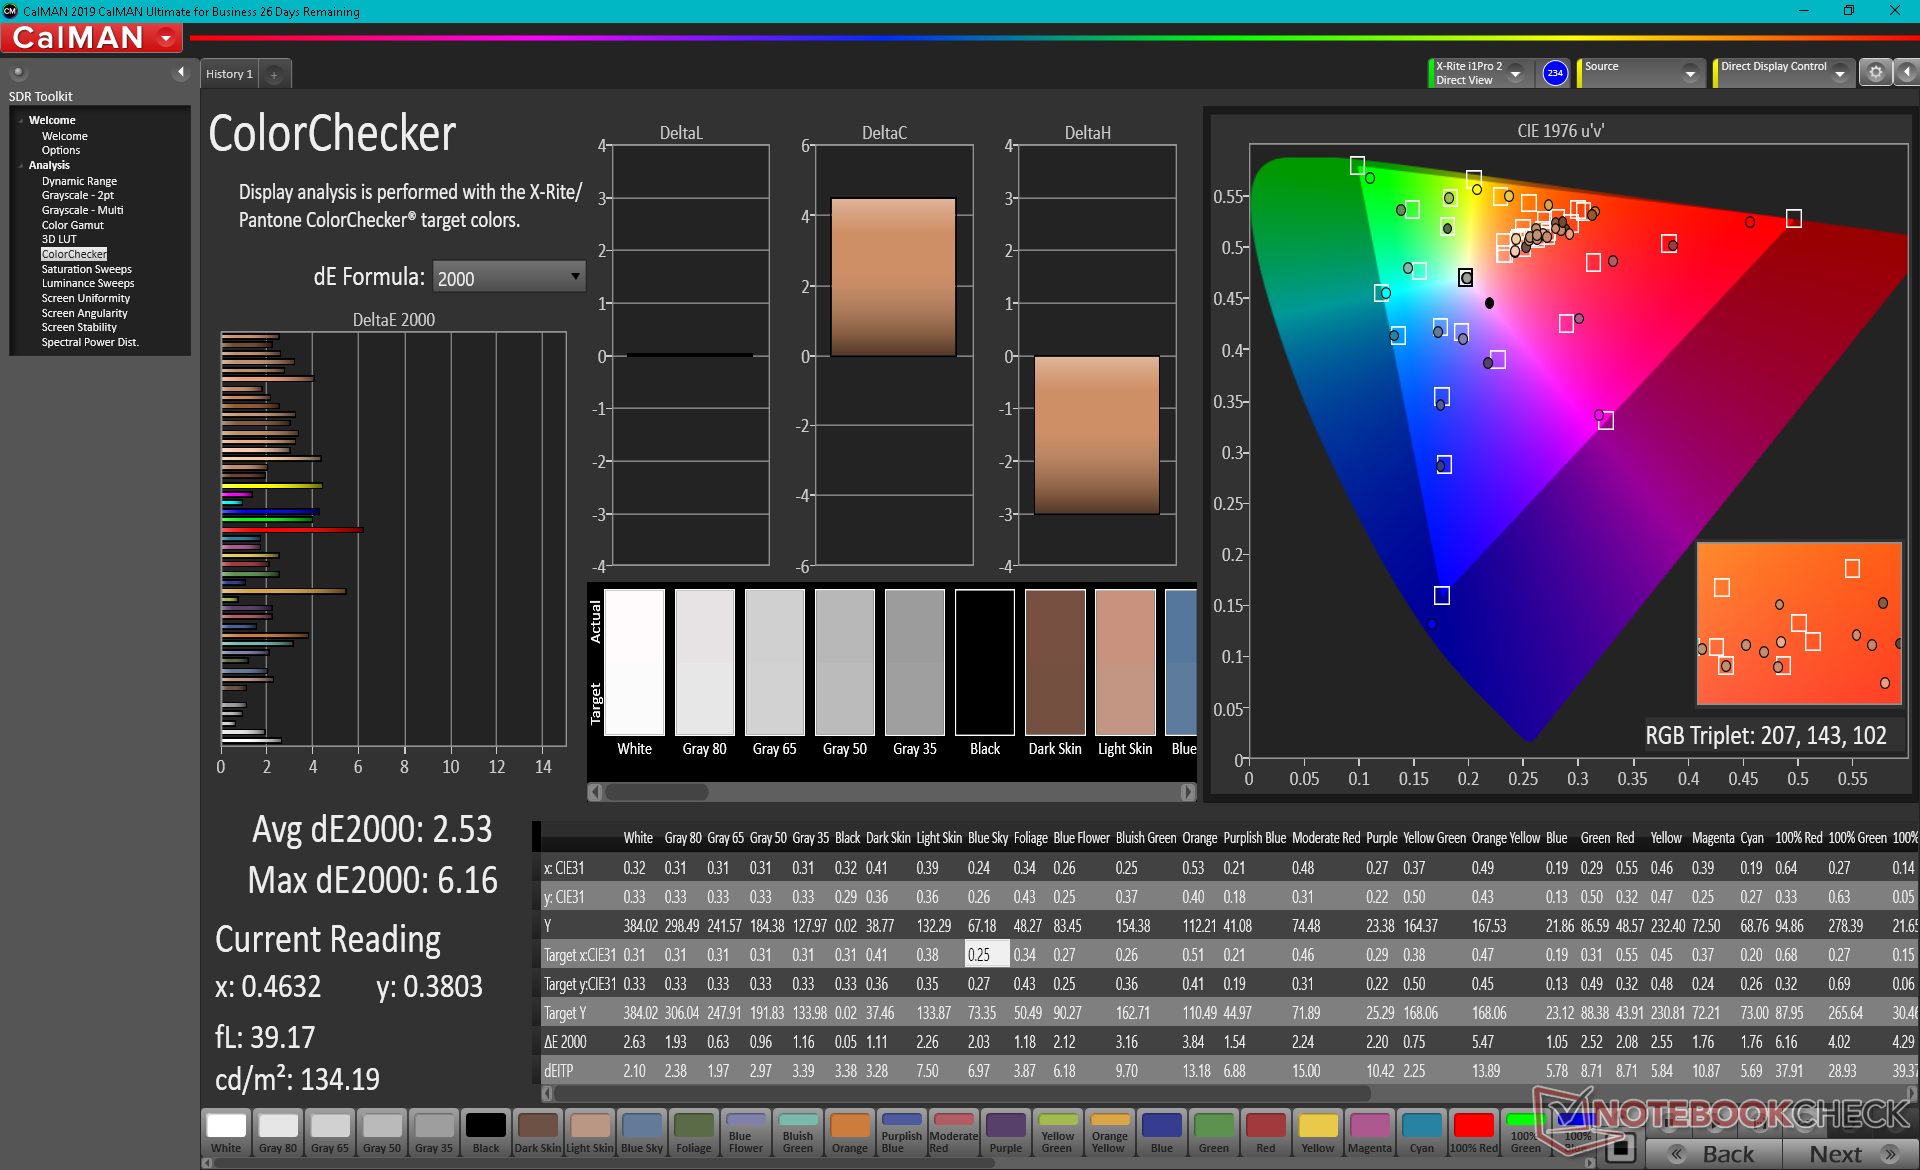
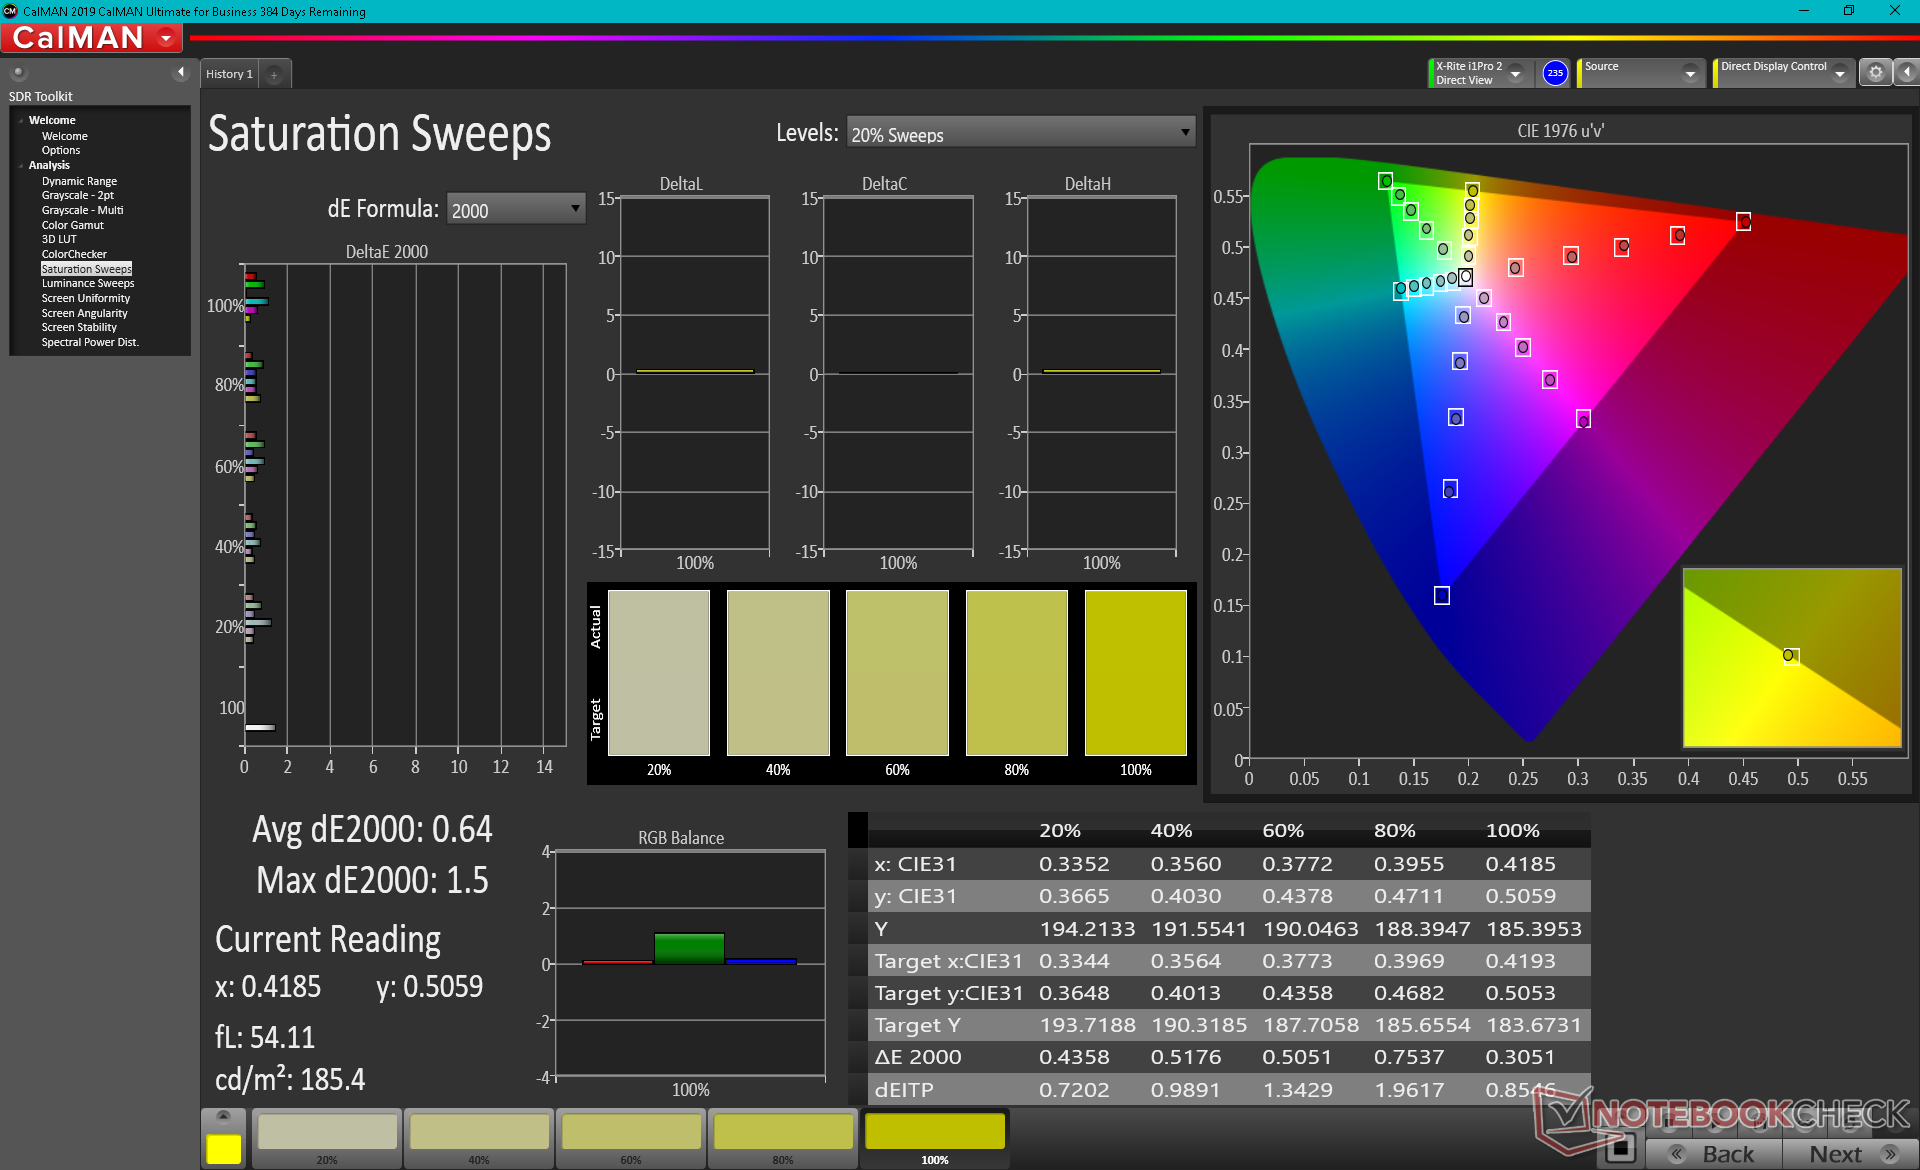
Asus använder samma 1080p Samsung ATNA56YX03-0 OLED-panel för både VivoBook 15 K513 och VivoBook 15 Pro-serien. Panelen är anmärkningsvärd för att erbjuda full DCI-P3-täckning som de flesta IPS-paneler inte kan nå, särskilt i denna prisklass < 1000 USD. De extra snabba svarstiderna, den relativt ljusa bakgrundsbelysningen och det extrema kontrastförhållandet gör vår VivoBook bättre än väntat för grafikredigering
Tänk på att pulsbreddsmodulering finns på alla ljusstyrkor till skillnad från de flesta andra bärbara datorer. Vi kan registrera en frekvens på 59 Hz när ljusstyrkan är inställd på 50 procent eller högre och 434 Hz när ljusstyrkan är inställd på 49 procent eller lägre.


| |||||||||||||||||||||||||
Distribution av ljusstyrkan: 98 %
Mitt på batteriet: 384.5 cd/m²
Kontrast: ∞:1 (Svärta: 0 cd/m²)
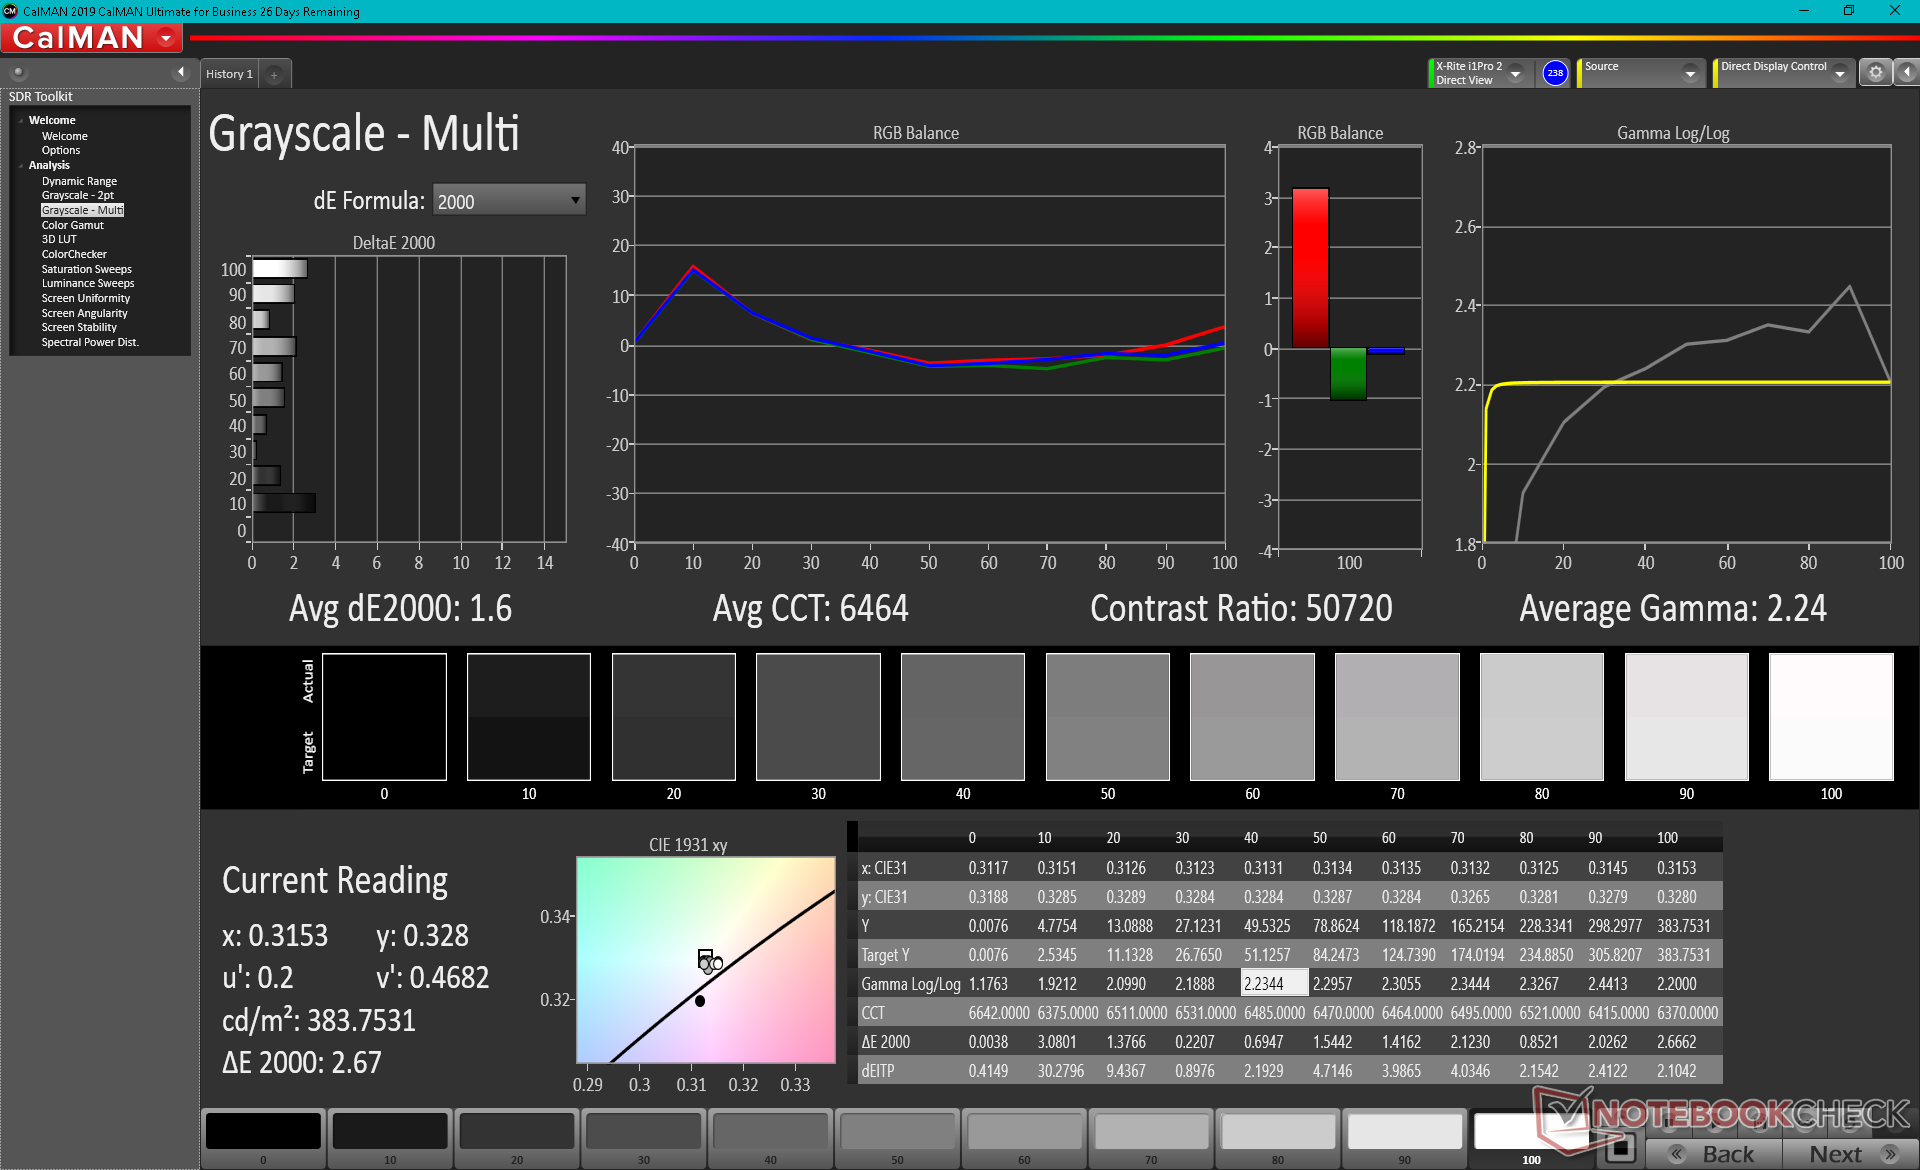
ΔE ColorChecker Calman: 2.53 | ∀{0.5-29.43 Ø4.73}
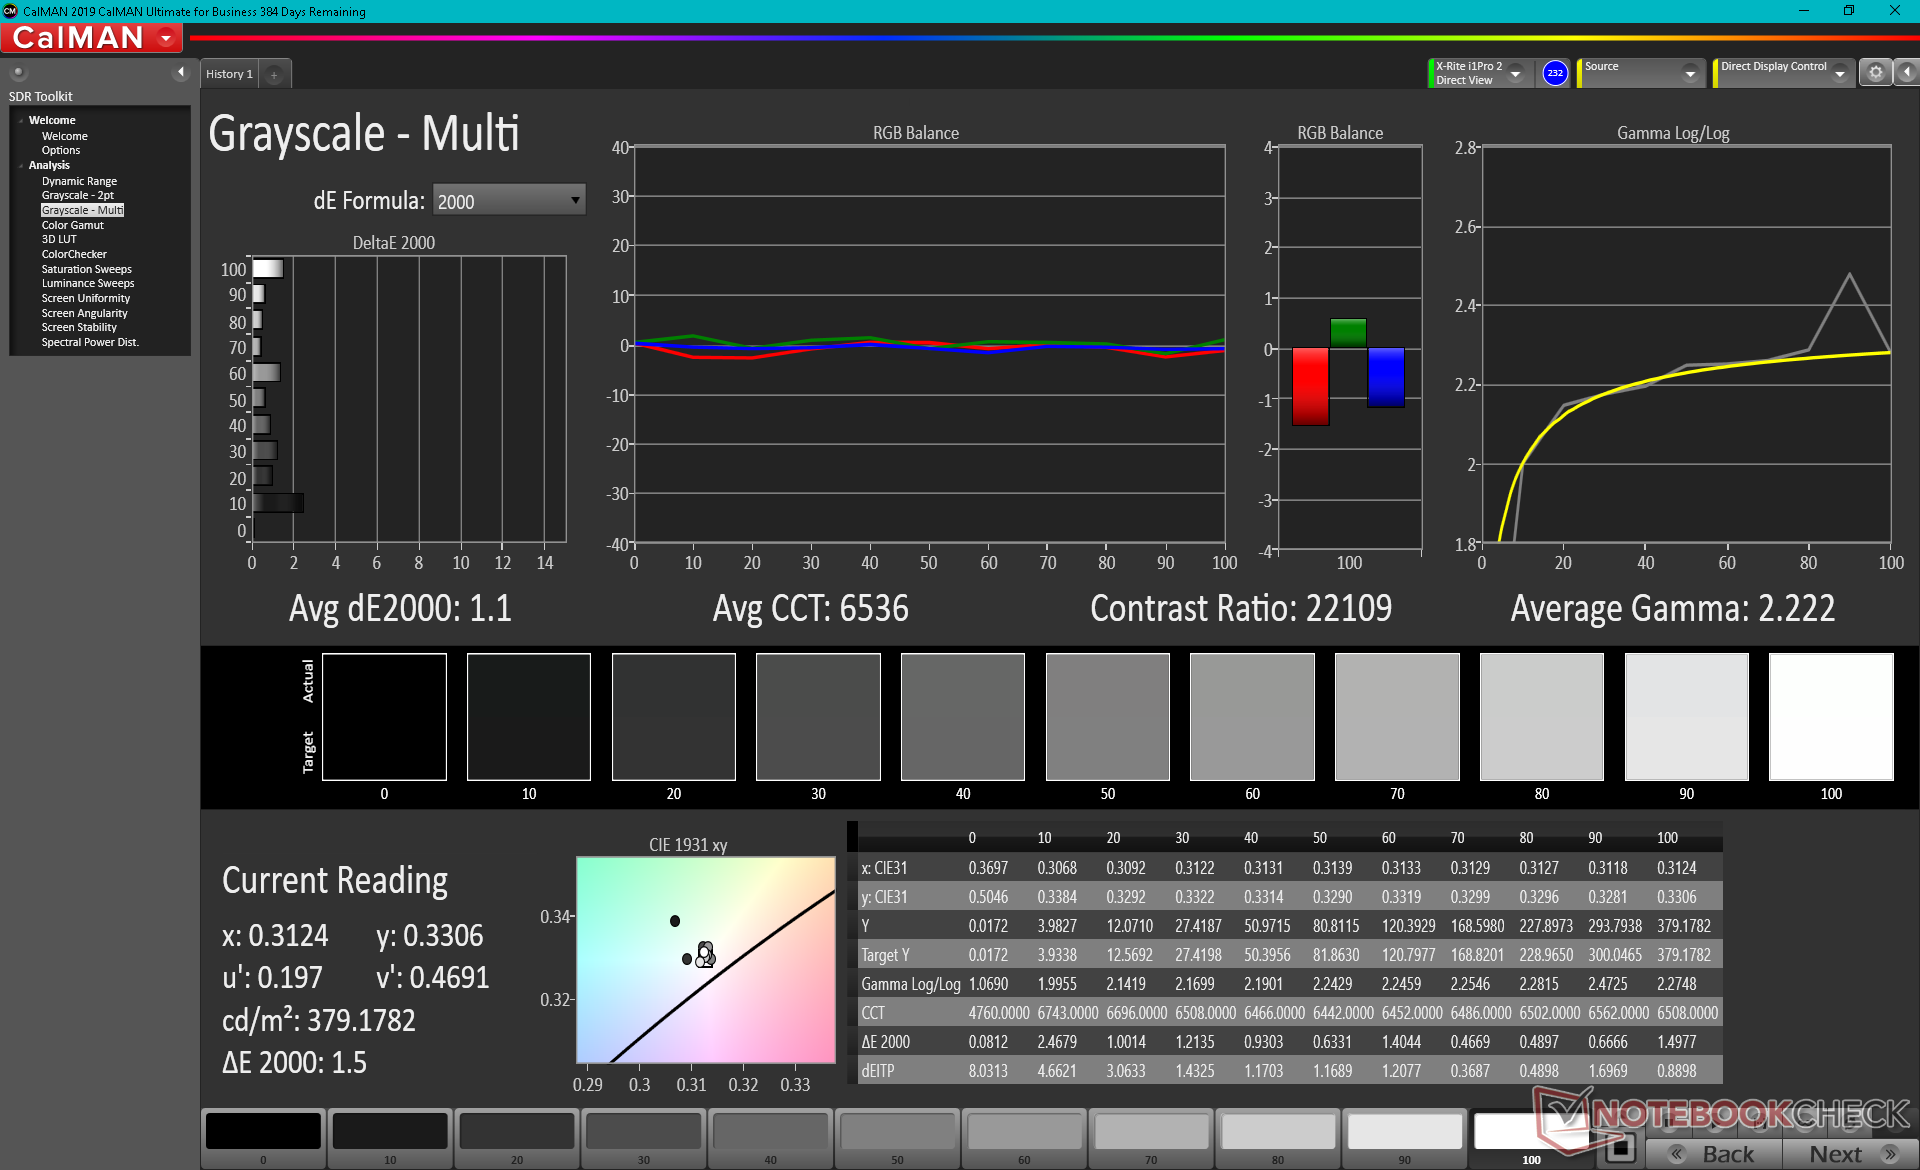
ΔE Greyscale Calman: 1.6 | ∀{0.09-98 Ø4.97}
99.9% AdobeRGB 1998 (Argyll 3D)
100% sRGB (Argyll 3D)
99.9% Display P3 (Argyll 3D)
Gamma: 2.24
CCT: 6464 K
| Asus Vivobook 15 K513EQ Samsung ATNA56YX03-0, OLED, 1920x1080, 15.6" | Asus VivoBook 15 Pro M3500QC-L1062 ATNA56YX03-0, AMOLED, 1920x1080, 15.6" | Asus VivoBook S15 S533EQ-BQ002T Panda LM156LF-5L04, IPS, 1920x1080, 15.6" | Lenovo IdeaPad 5 15ALC05 Lenovo LEN156FHD, IPS, 1920x1080, 15.6" | Dell Inspiron 15 3501 BOE NV15N3D (Dell P/N: N39X1), IPS, 1920x1080, 15.6" | HP Pavilion 15-eg Chi Mei CMN1523, IPS, 1920x1080, 15.6" | |
|---|---|---|---|---|---|---|
| Display | -1% | -54% | -52% | -54% | -50% | |
| Display P3 Coverage (%) | 99.9 | 99.9 0% | 39.01 -61% | 39.4 -61% | 42.9 -57% | |
| sRGB Coverage (%) | 100 | 99.9 0% | 58.5 -41% | 59 -41% | 58.7 -41% | 64 -36% |
| AdobeRGB 1998 Coverage (%) | 99.9 | 95.8 -4% | 40.33 -60% | 38 -62% | 40.7 -59% | 44.4 -56% |
| Response Times | -28% | -1229% | -870% | -1429% | -825% | |
| Response Time Grey 50% / Grey 80% * (ms) | 2.2 ? | 3.2 ? -45% | 38 ? -1627% | 29 ? -1218% | 43 ? -1855% | 22.8 ? -936% |
| Response Time Black / White * (ms) | 2.9 ? | 3.2 ? -10% | 27 ? -831% | 18 ? -521% | 32 ? -1003% | 23.6 ? -714% |
| PWM Frequency (Hz) | 59.5 ? | 60.2 ? | 1000 ? | 26320 ? | ||
| Screen | 14% | -65% | -101% | -47% | -74% | |
| Brightness middle (cd/m²) | 384.5 | 396 3% | 287 -25% | 376 -2% | 271 -30% | 294.3 -23% |
| Brightness (cd/m²) | 388 | 397 2% | 261 -33% | 341 -12% | 263 -32% | 251 -35% |
| Brightness Distribution (%) | 98 | 99 1% | 84 -14% | 78 -20% | 92 -6% | 76 -22% |
| Black Level * (cd/m²) | 0.51 | 0.66 | 0.15 | 0.26 | ||
| Colorchecker dE 2000 * | 2.53 | 2 21% | 4.72 -87% | 6.4 -153% | 4.83 -91% | 4.08 -61% |
| Colorchecker dE 2000 max. * | 6.16 | 4.8 22% | 17.94 -191% | 20.45 -232% | 7 -14% | 19.49 -216% |
| Greyscale dE 2000 * | 1.6 | 1 37% | 2.2 -38% | 4.59 -187% | 3.36 -110% | 3 -88% |
| Gamma | 2.24 98% | 2.17 101% | 2.51 88% | 2.26 97% | 2.56 86% | 2.21 100% |
| CCT | 6464 101% | 6608 98% | 6758 96% | 6819 95% | 6764 96% | 6616 98% |
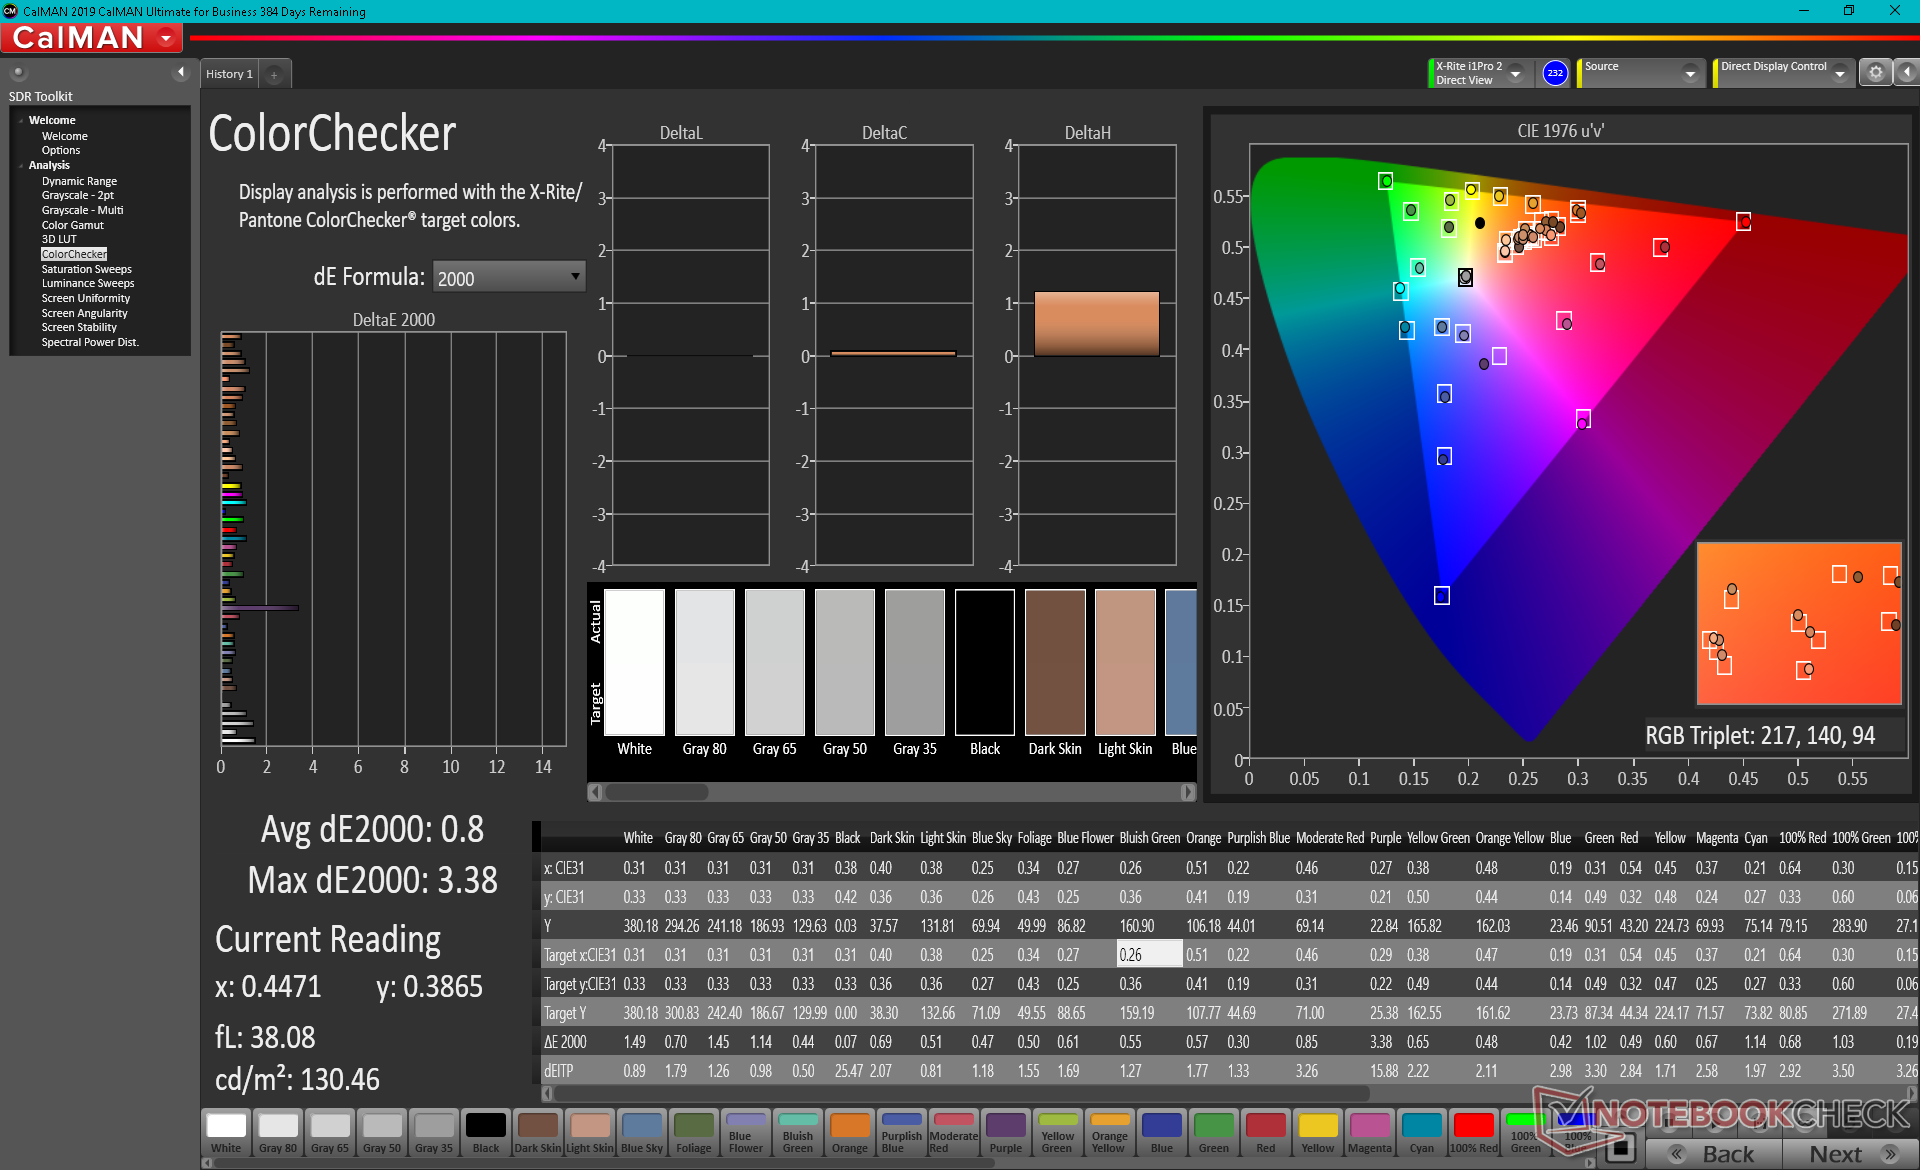
| Colorchecker dE 2000 calibrated * | 1.8 | 3.74 | 3.7 | |||
| Contrast (:1) | 563 | 570 | 1807 | 1132 | ||
| Color Space (Percent of AdobeRGB 1998) (%) | 37 | 38 | ||||
| Color Space (Percent of sRGB) (%) | 58 | 59 | ||||
| Totalt genomsnitt (program/inställningar) | -5% /
2% | -449% /
-273% | -341% /
-245% | -510% /
-300% | -316% /
-204% |
* ... mindre är bättre
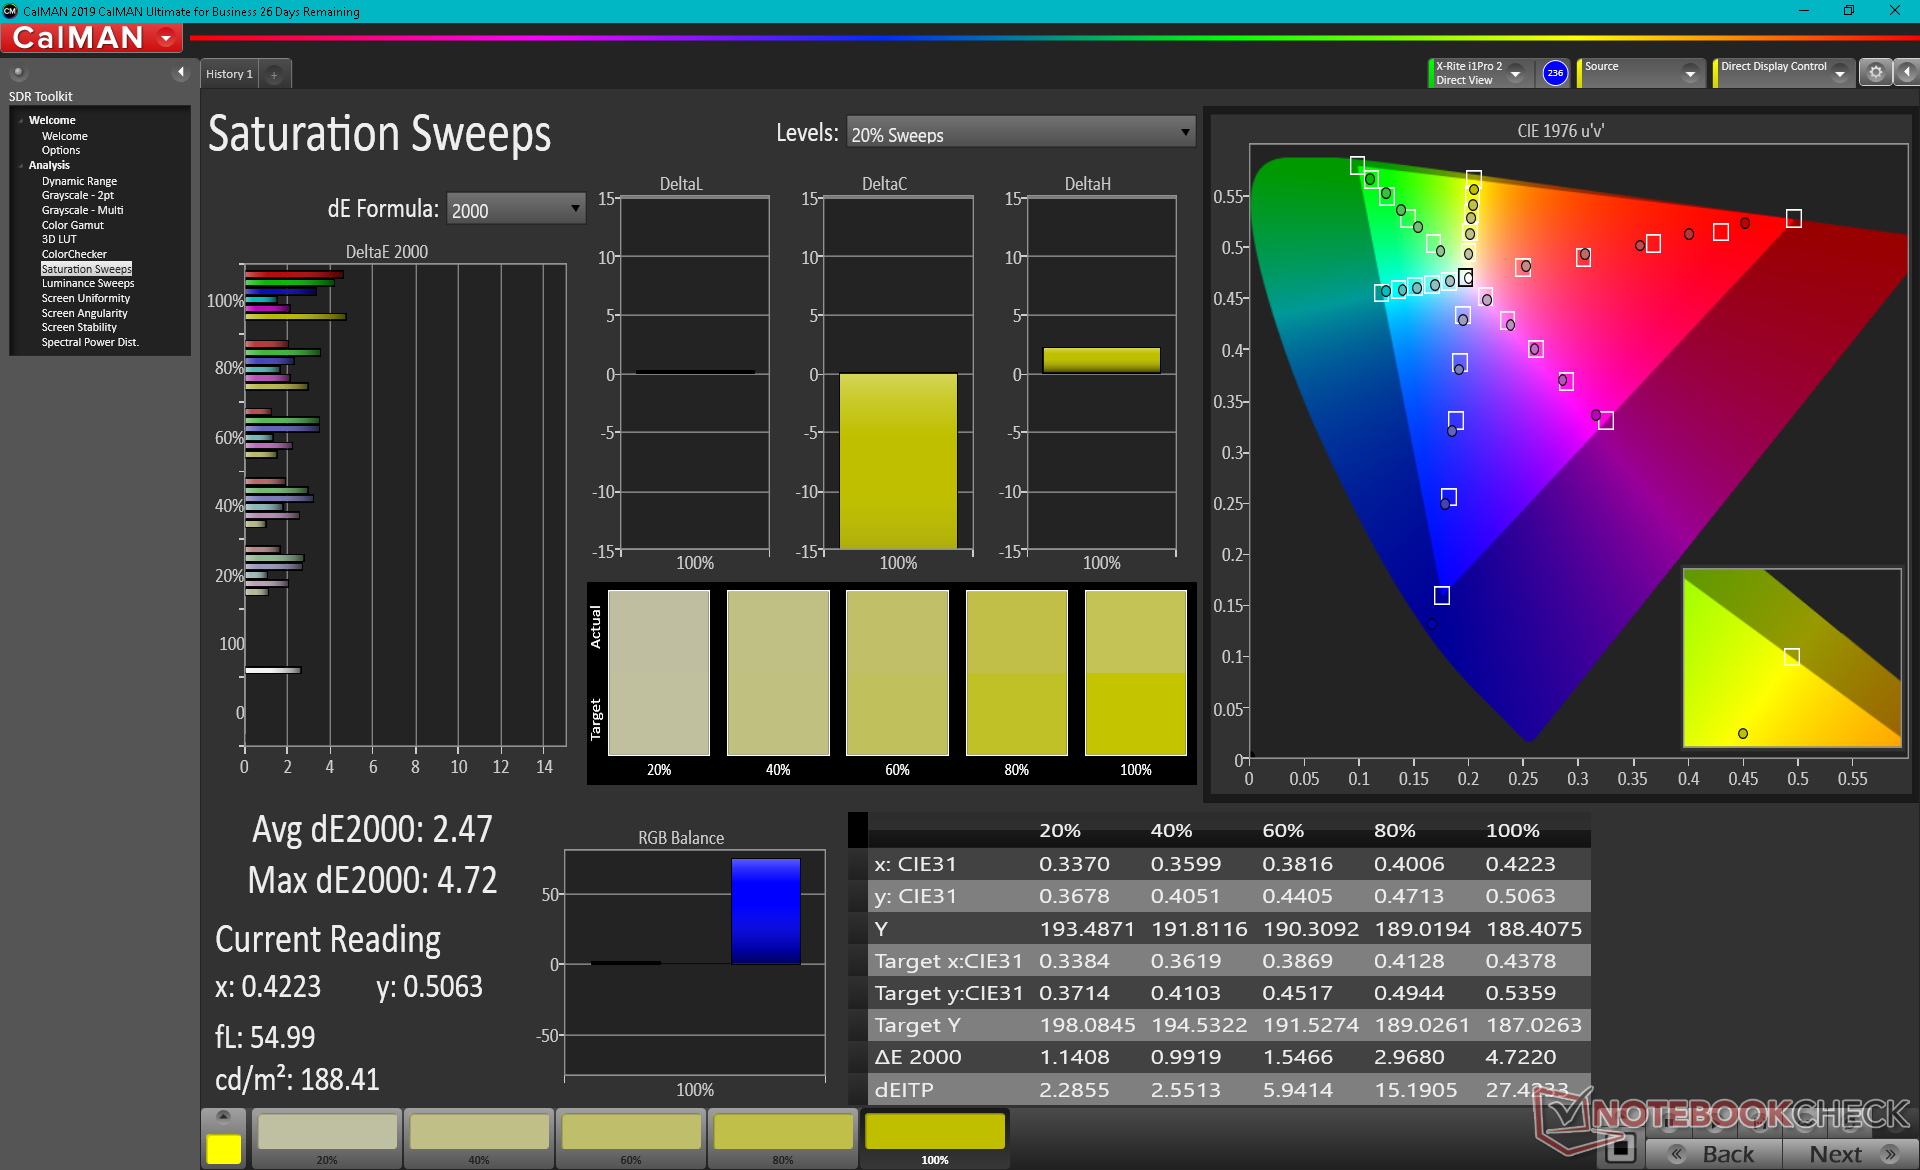
Skärmen är hyfsat kalibrerad direkt från förpackningen med genomsnittliga deltaE-värden för gråskala och färg på endast 1,6 respektive 2,53 jämfört med P3-standarden. Färgerna rött och gult verkar vara de mer felaktiga jämfört med andra primära och sekundära färger
Visa svarstider
| ↔ Svarstid svart till vitt | ||
|---|---|---|
| 2.9 ms ... stiga ↗ och falla ↘ kombinerat | ↗ 1.1 ms stiga | 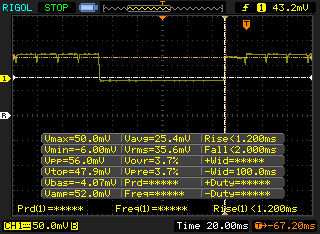 |
| ↘ 1.8 ms hösten | ||
| Skärmen visar väldigt snabba svarsfrekvenser i våra tester och borde vara mycket väl lämpad för fartfyllt spel. I jämförelse sträcker sig alla testade enheter från 0.1 (minst) till 240 (maximalt) ms. » 14 % av alla enheter är bättre. Det betyder att den uppmätta svarstiden är bättre än genomsnittet av alla testade enheter (19.9 ms). | ||
| ↔ Svarstid 50 % grått till 80 % grått | ||
| 2.2 ms ... stiga ↗ och falla ↘ kombinerat | ↗ 1.1 ms stiga | 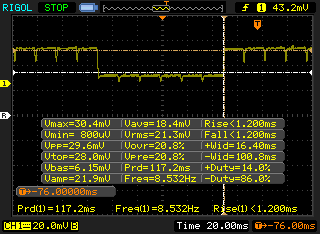 |
| ↘ 1.1 ms hösten | ||
| Skärmen visar väldigt snabba svarsfrekvenser i våra tester och borde vara mycket väl lämpad för fartfyllt spel. I jämförelse sträcker sig alla testade enheter från 0.165 (minst) till 636 (maximalt) ms. » 11 % av alla enheter är bättre. Det betyder att den uppmätta svarstiden är bättre än genomsnittet av alla testade enheter (31.1 ms). | ||
Skärmflimmer / PWM (Puls-Width Modulation)
| Skärmflimmer / PWM upptäckt | 59.5 Hz | ≤ 100 % ljusstyrka inställning | 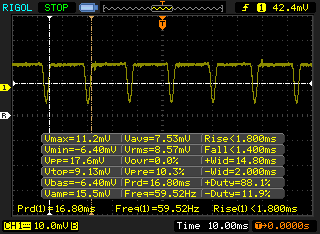 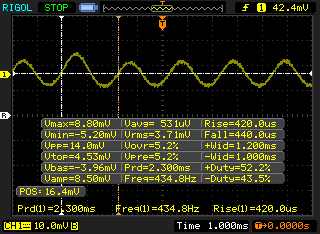 |
Displayens bakgrundsbelysning flimrar vid 59.5 Hz (i värsta fall, t.ex. med PWM) Flimrande upptäckt vid en ljusstyrkeinställning på 100 % och lägre. Det ska inte finnas något flimmer eller PWM över denna ljusstyrkeinställning. Frekvensen för 59.5 Hz är mycket låg, så flimmer kan orsaka ögon- och huvudvärk efter långvarig användning. Som jämförelse: 52 % av alla testade enheter använder inte PWM för att dämpa skärmen. Om PWM upptäcktes mättes ett medelvärde av 7798 (minst: 5 - maximum: 343500) Hz. | |||
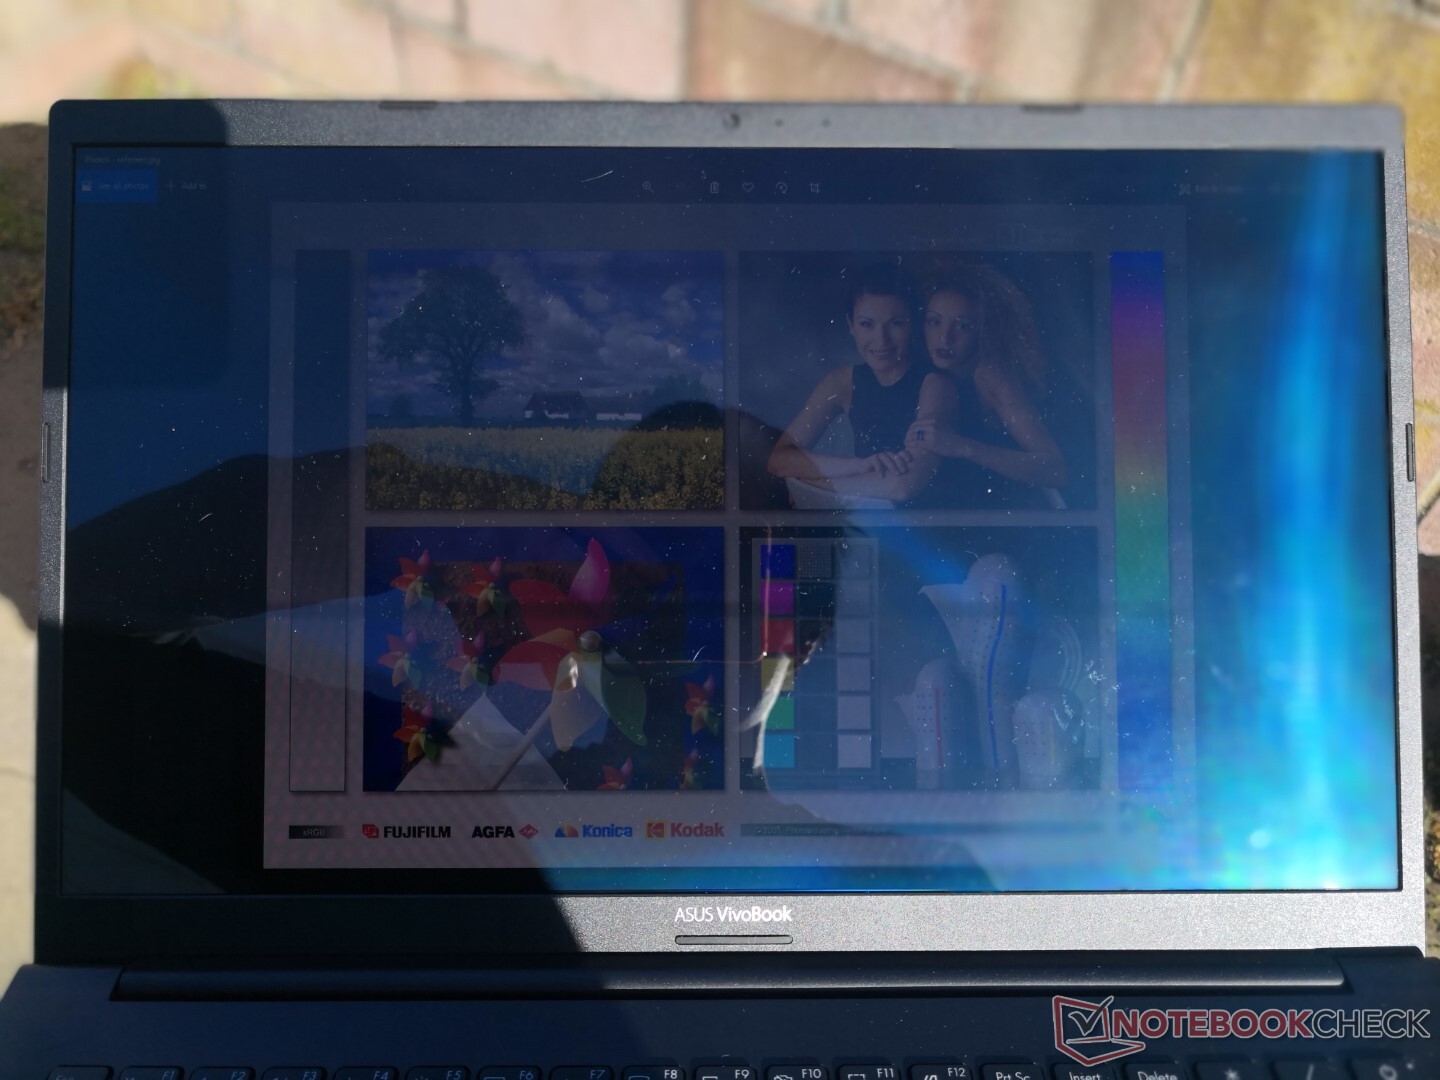
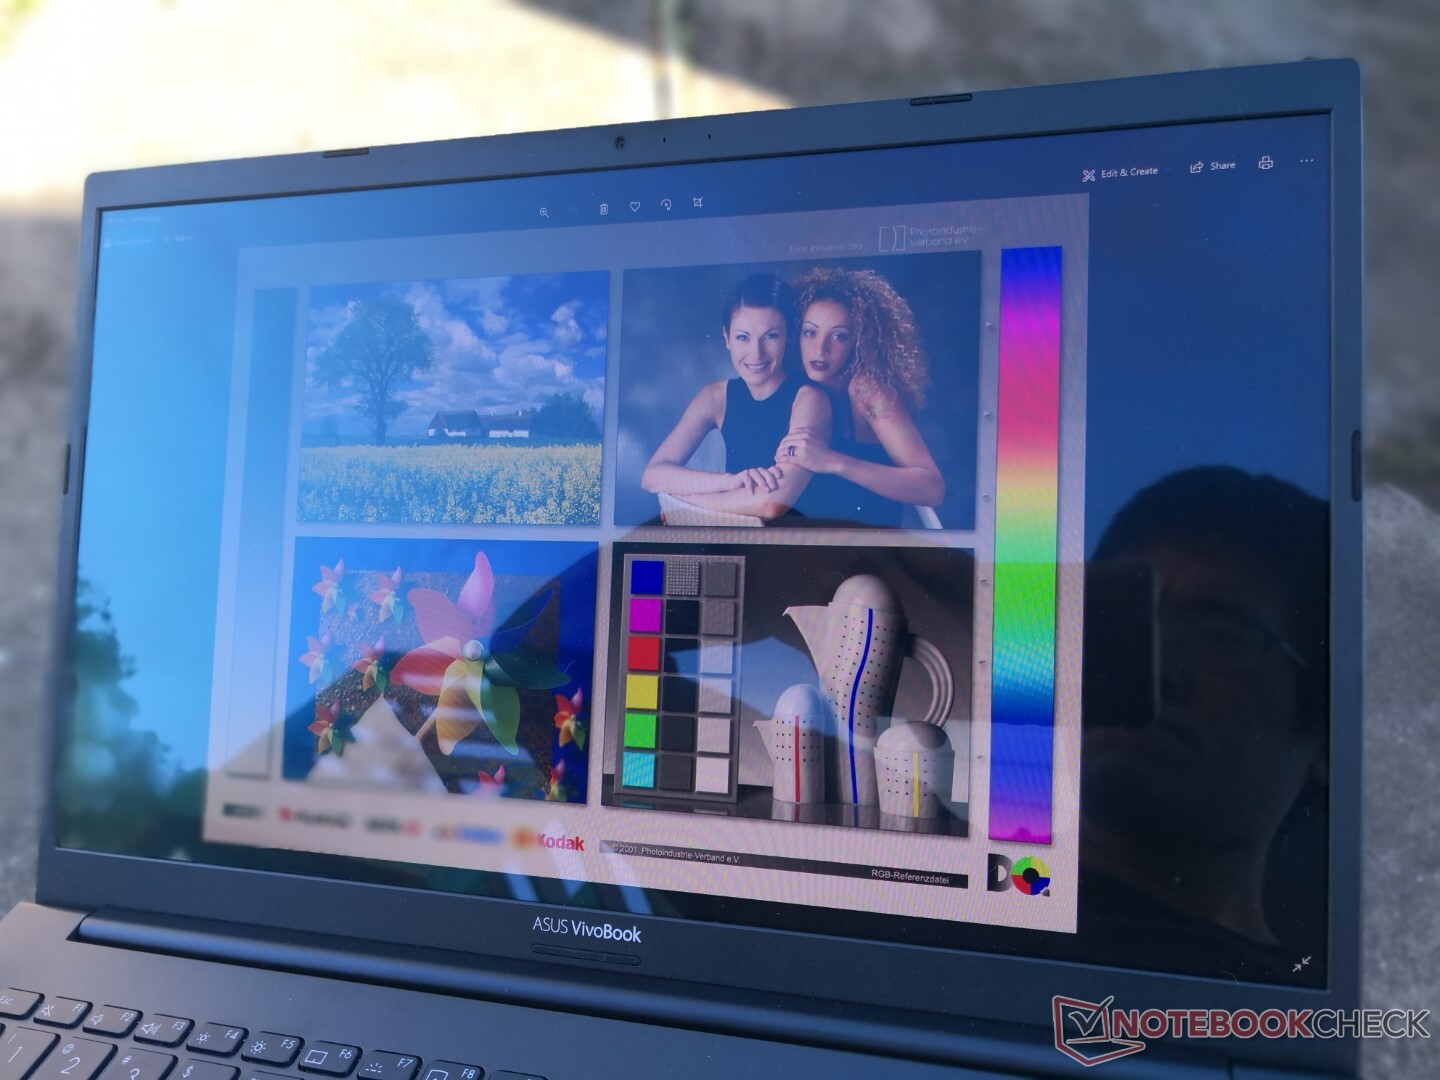
Synligheten utomhus är genomsnittlig om den är i skugga och något bättre än IPS vid samma ljusstyrka på grund av OLED:s mycket djupare svarta nivåer. Skärmen tvättas inte ut lika lätt som följd av detta, men bländning är ändå fortfarande svår att undvika.

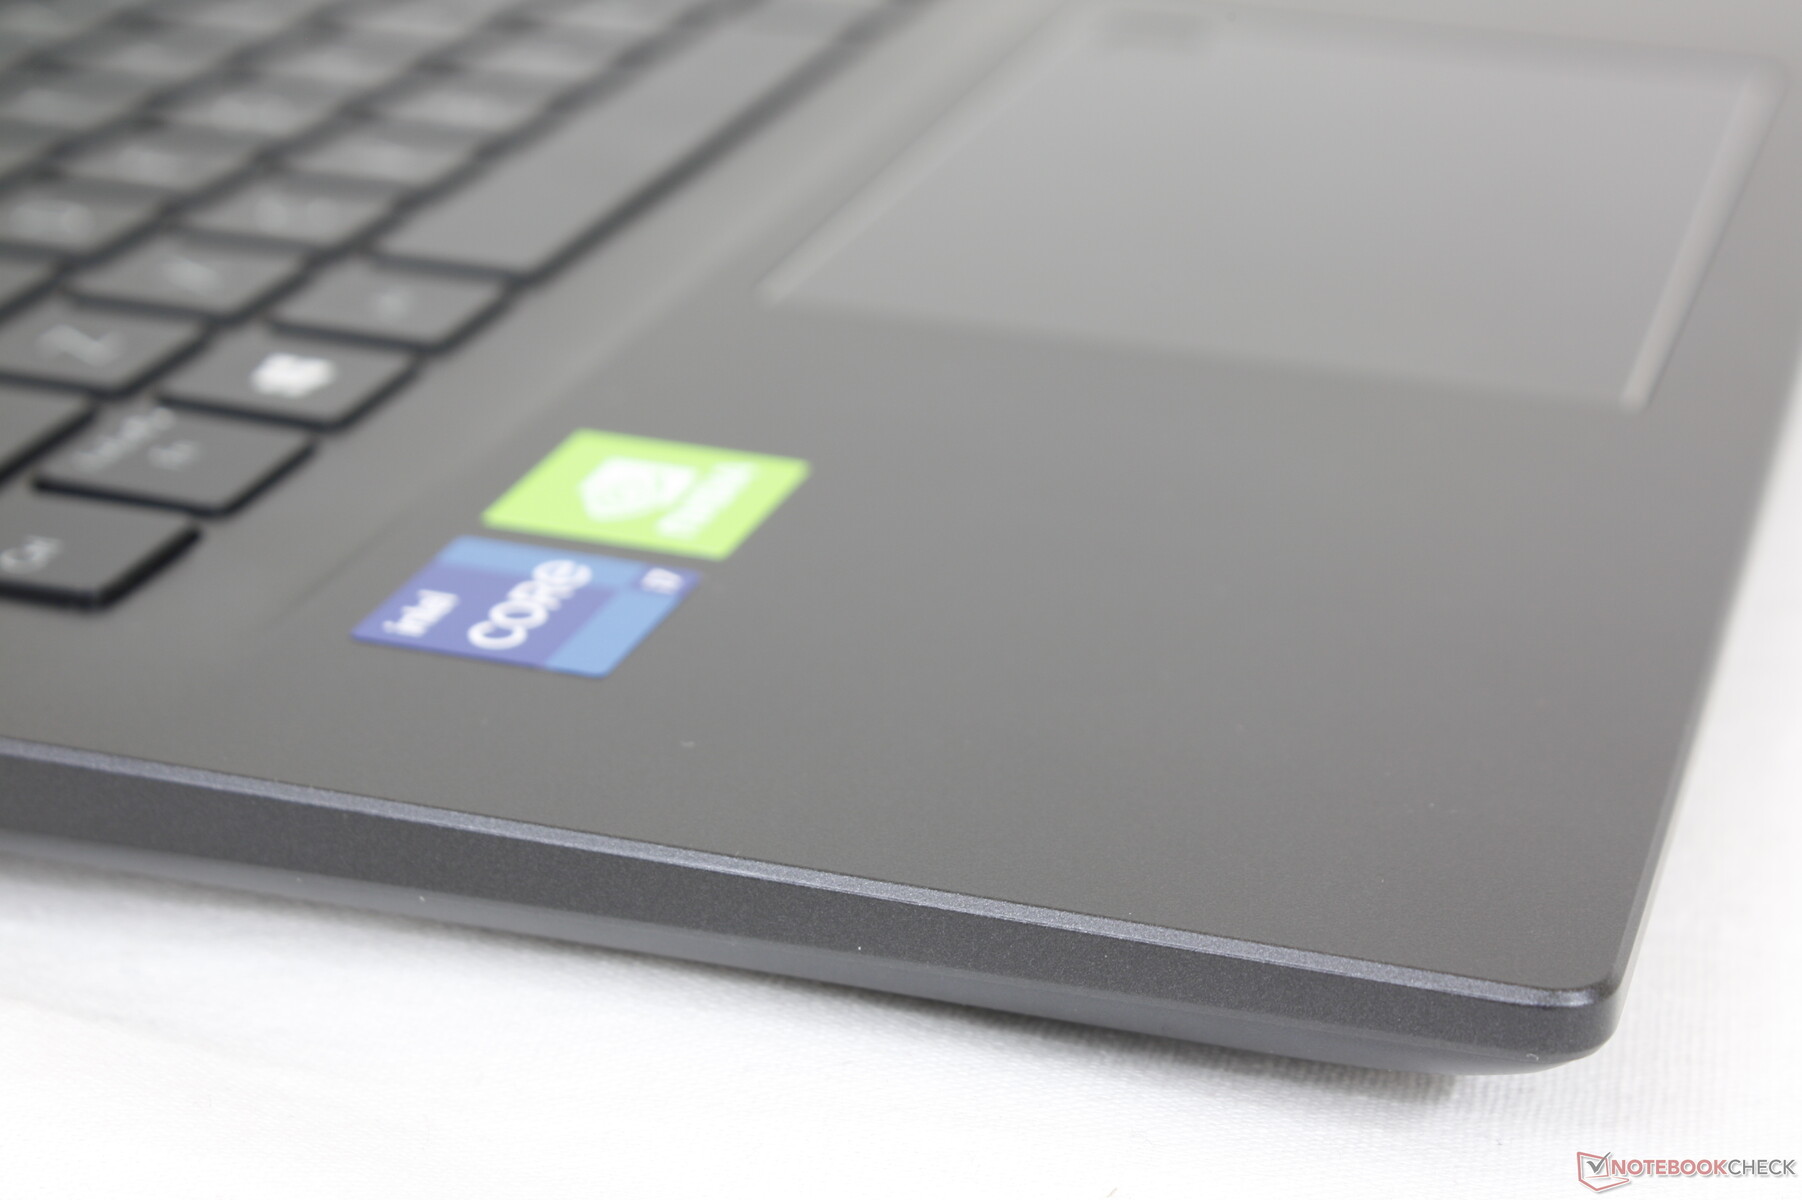
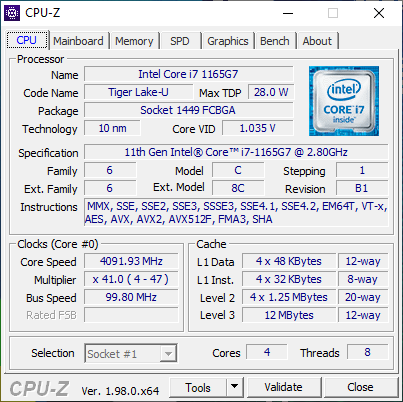
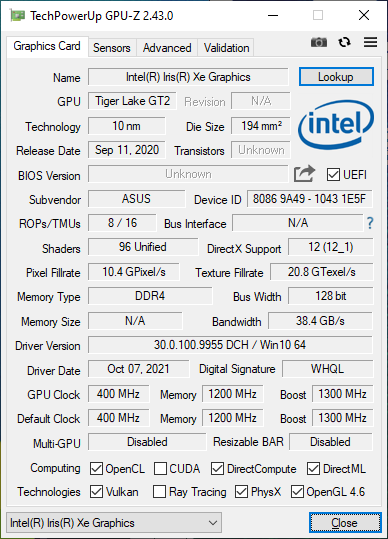
Prestanda - 11th Gen Tiger Lake-U
De nuvarande SKU:erna är utrustade med U-serien Core i3-1115G4 CPU upp till Core i7-1165G7 plus valfri GeForce MX330 eller MX350 grafik på Optimus 1.0. Den tidigare nämnda Core i3 SKU:n levereras endast med integrerad UHD Graphics som är betydligt långsammare än Iris Xe eller den diskreta Nvidia GPU:n. Användarna måste titta på de högre priserna VivoBook 15 Pro serien om de vill ha snabbare CPU:er i Core H-serien och GeForce RTX-grafik
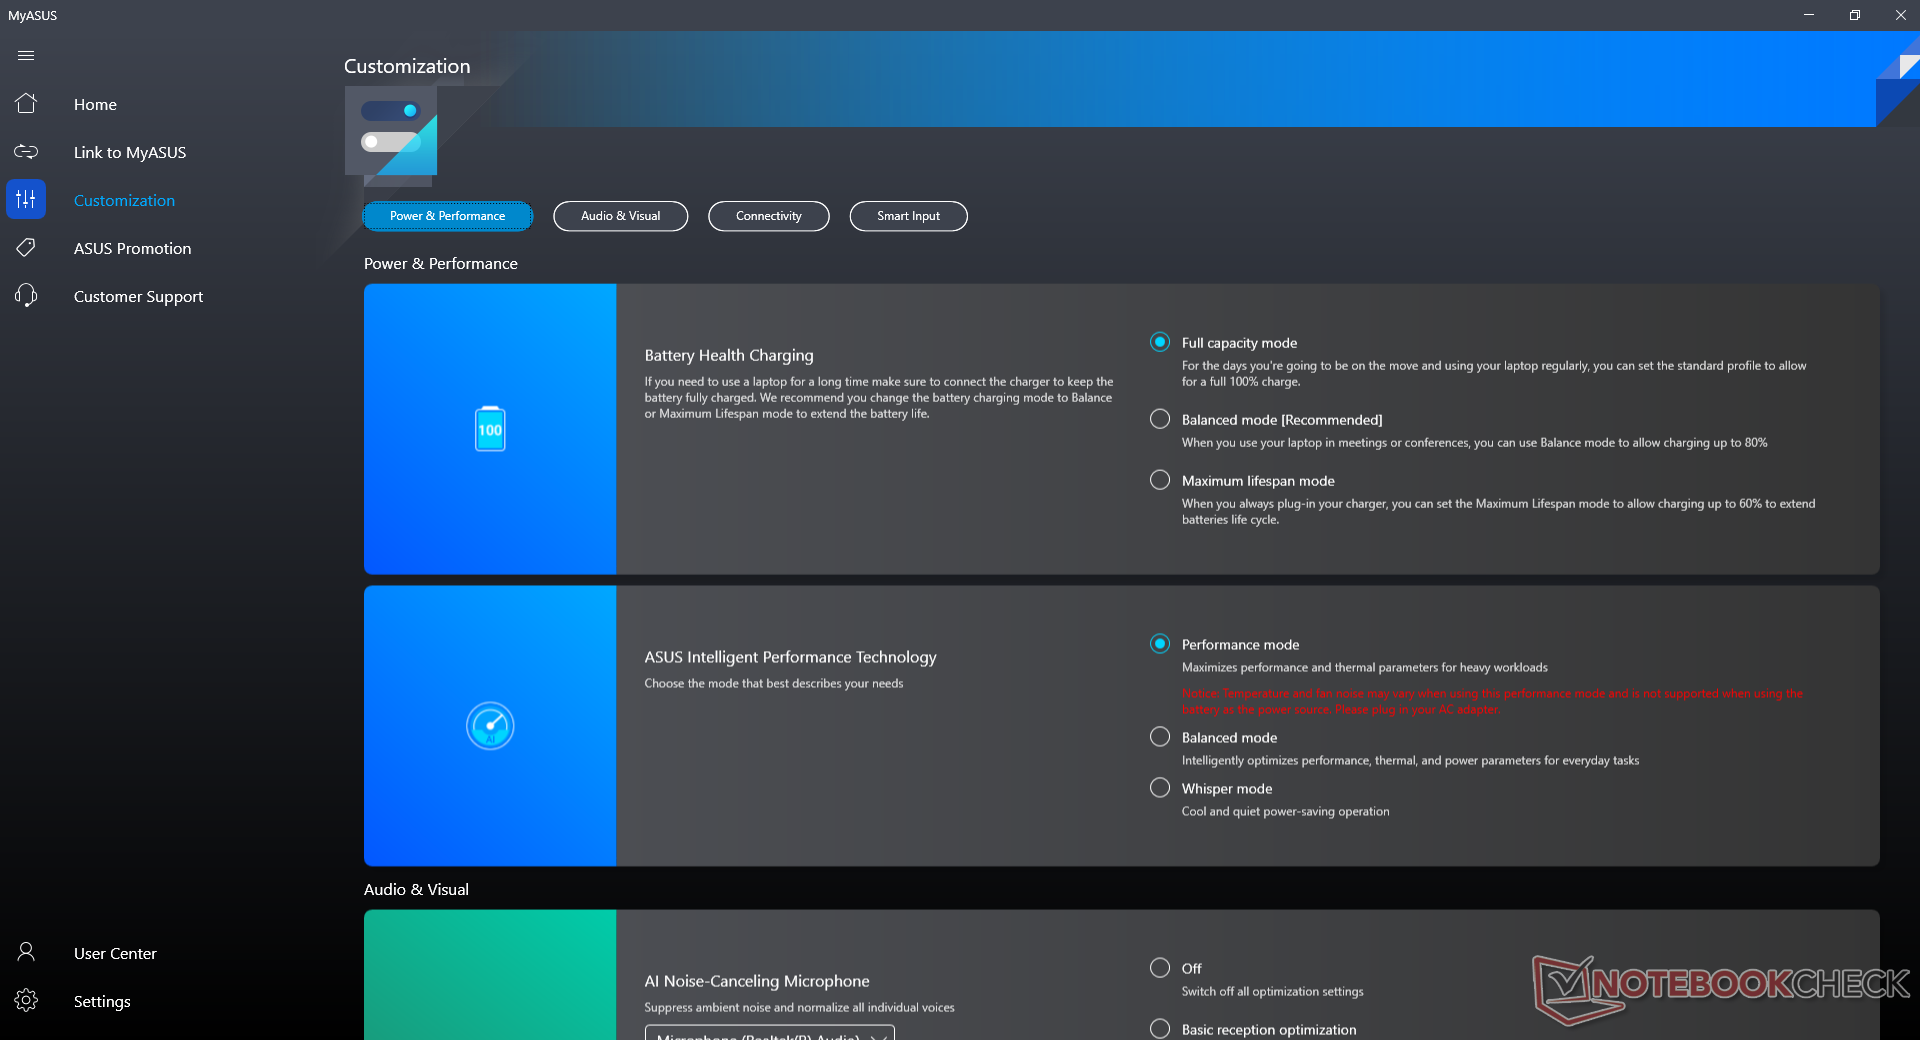
Provningsförhållanden
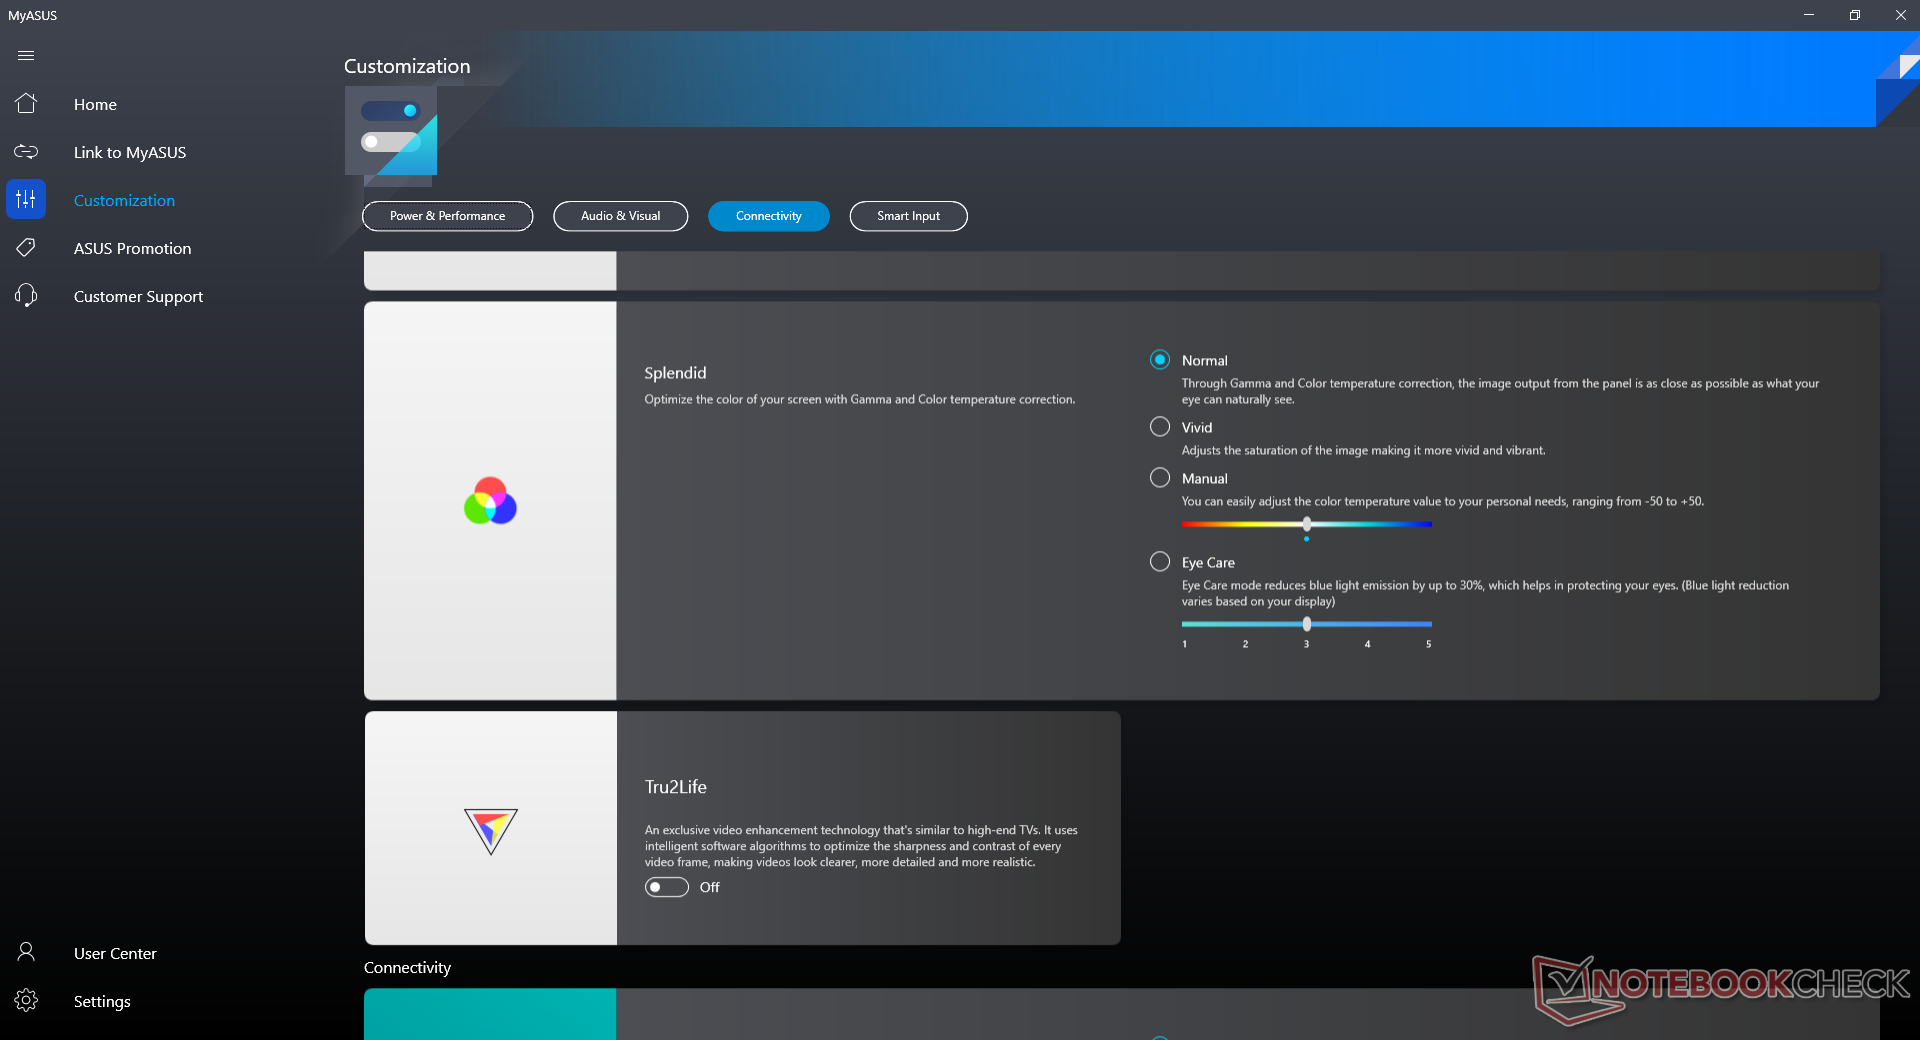
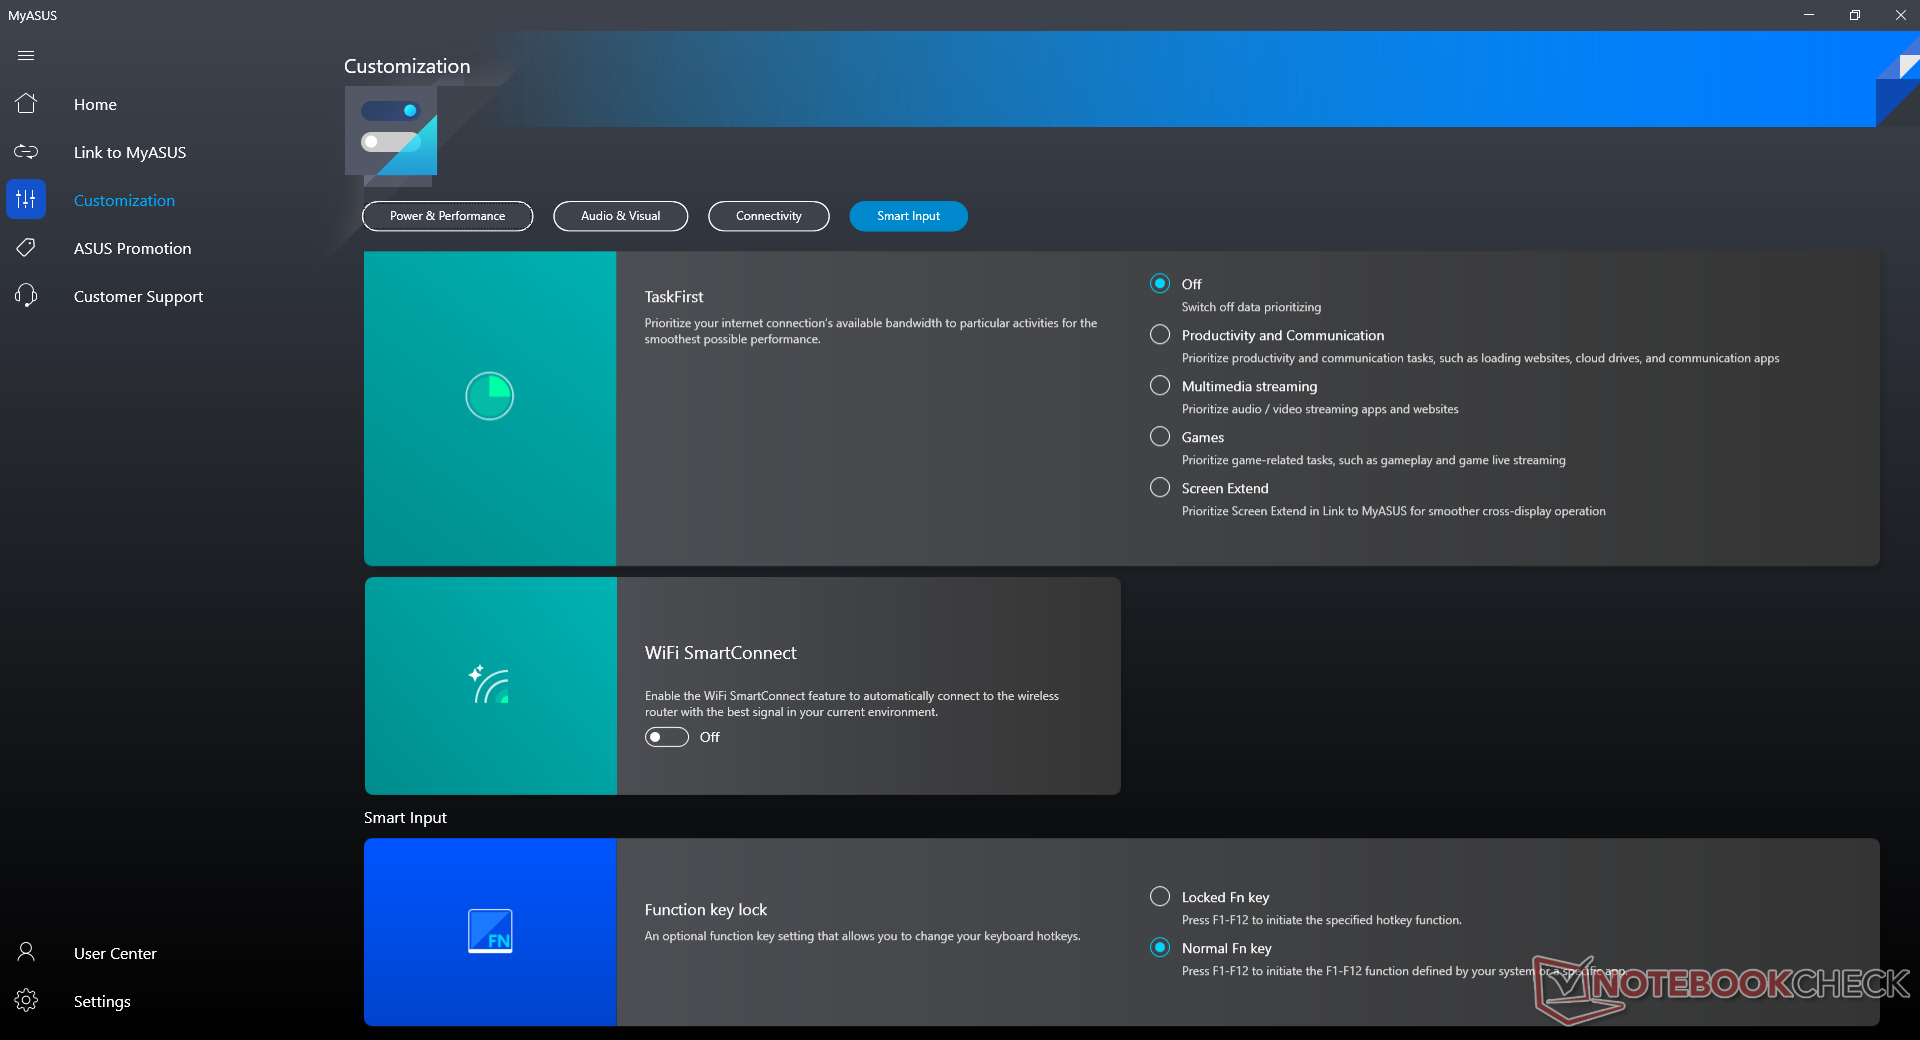
Vår enhet ställdes in i prestandaläge via MyAsus mjukvara för att få bästa möjliga resultat i benchmark. Vi rekommenderar ägare att bekanta sig med den här programvaran eftersom nyckelfunktioner relaterade till OLED, mikrofon, batterihälsa, Asus-uppdateringar med mera alla är tillgängliga här.
Processor
CPU-prestandan är utmärkt med resultat med flera trådar som är cirka 10 procent snabbare än den genomsnittliga bärbara datorn i vår databas med samma Core i7-1165G7 processor. Om du väljer den mindre Core i5-1135G7 alternativet innebär en prestandaförlust på endast cirka 10 till 15 procent.
Cinebench R15 Multi Loop
Cinebench R23: Multi Core | Single Core
Cinebench R20: CPU (Multi Core) | CPU (Single Core)
Cinebench R15: CPU Multi 64Bit | CPU Single 64Bit
Blender: v2.79 BMW27 CPU
7-Zip 18.03: 7z b 4 | 7z b 4 -mmt1
Geekbench 5.5: Multi-Core | Single-Core
HWBOT x265 Benchmark v2.2: 4k Preset
LibreOffice : 20 Documents To PDF
R Benchmark 2.5: Overall mean
| CPU Performance rating | |
| HP Pavilion Aero 13 be0097nr -2! | |
| Lenovo ThinkPad E15 G3-20YG003UGE | |
| Microsoft Surface Laptop 4 15 AMD TFF_00028 | |
| MSI Prestige 15 A10SC -10! | |
| VAIO SX14 VJS144X0111K -2! | |
| Asus Vivobook 15 K513EQ -2! | |
| Genomsnitt Intel Core i7-1165G7 | |
| Microsoft Surface Laptop 3 15 i7-1065G7 -10! | |
| HP Pavilion x360 15-er0155ng | |
| Asus ZenBook 15 UX534FT-DB77 -10! | |
| Lenovo ThinkPad P15s Gen1-20T4000JGE -2! | |
| HP 250 G7-15S40ES -2! | |
| Dell Inspiron 15 5000 5502 -2! | |
| Cinebench R23 / Multi Core | |
| Microsoft Surface Laptop 4 15 AMD TFF_00028 | |
| Lenovo ThinkPad E15 G3-20YG003UGE | |
| HP Pavilion Aero 13 be0097nr | |
| VAIO SX14 VJS144X0111K | |
| Asus Vivobook 15 K513EQ | |
| Genomsnitt Intel Core i7-1165G7 (2525 - 6862, n=64) | |
| HP Pavilion x360 15-er0155ng | |
| Cinebench R23 / Single Core | |
| VAIO SX14 VJS144X0111K | |
| Asus Vivobook 15 K513EQ | |
| Genomsnitt Intel Core i7-1165G7 (1110 - 1539, n=59) | |
| HP Pavilion Aero 13 be0097nr | |
| HP Pavilion x360 15-er0155ng | |
| Microsoft Surface Laptop 4 15 AMD TFF_00028 | |
| Lenovo ThinkPad E15 G3-20YG003UGE | |
| Cinebench R20 / CPU (Multi Core) | |
| Lenovo ThinkPad E15 G3-20YG003UGE | |
| Microsoft Surface Laptop 4 15 AMD TFF_00028 | |
| HP Pavilion Aero 13 be0097nr | |
| MSI Prestige 15 A10SC | |
| VAIO SX14 VJS144X0111K | |
| Asus Vivobook 15 K513EQ | |
| Genomsnitt Intel Core i7-1165G7 (1060 - 2657, n=81) | |
| HP Pavilion x360 15-er0155ng | |
| Microsoft Surface Laptop 3 15 i7-1065G7 | |
| Asus ZenBook 15 UX534FT-DB77 | |
| Lenovo ThinkPad P15s Gen1-20T4000JGE | |
| HP 250 G7-15S40ES | |
| Dell Inspiron 15 5000 5502 | |
| Cinebench R20 / CPU (Single Core) | |
| VAIO SX14 VJS144X0111K | |
| Asus Vivobook 15 K513EQ | |
| HP Pavilion Aero 13 be0097nr | |
| Genomsnitt Intel Core i7-1165G7 (442 - 589, n=81) | |
| HP Pavilion x360 15-er0155ng | |
| Dell Inspiron 15 5000 5502 | |
| Microsoft Surface Laptop 4 15 AMD TFF_00028 | |
| Lenovo ThinkPad E15 G3-20YG003UGE | |
| Lenovo ThinkPad P15s Gen1-20T4000JGE | |
| MSI Prestige 15 A10SC | |
| Microsoft Surface Laptop 3 15 i7-1065G7 | |
| Asus ZenBook 15 UX534FT-DB77 | |
| HP 250 G7-15S40ES | |
| Cinebench R15 / CPU Multi 64Bit | |
| Microsoft Surface Laptop 4 15 AMD TFF_00028 | |
| Lenovo ThinkPad E15 G3-20YG003UGE | |
| HP Pavilion Aero 13 be0097nr | |
| MSI Prestige 15 A10SC | |
| VAIO SX14 VJS144X0111K | |
| Asus Vivobook 15 K513EQ | |
| Genomsnitt Intel Core i7-1165G7 (553 - 1027, n=86) | |
| HP Pavilion x360 15-er0155ng | |
| Microsoft Surface Laptop 3 15 i7-1065G7 | |
| Lenovo ThinkPad P15s Gen1-20T4000JGE | |
| Asus ZenBook 15 UX534FT-DB77 | |
| HP 250 G7-15S40ES | |
| Dell Inspiron 15 5000 5502 | |
| Cinebench R15 / CPU Single 64Bit | |
| VAIO SX14 VJS144X0111K | |
| HP Pavilion Aero 13 be0097nr | |
| Asus Vivobook 15 K513EQ | |
| Genomsnitt Intel Core i7-1165G7 (115 - 230, n=78) | |
| HP Pavilion x360 15-er0155ng | |
| Dell Inspiron 15 5000 5502 | |
| MSI Prestige 15 A10SC | |
| Lenovo ThinkPad E15 G3-20YG003UGE | |
| Lenovo ThinkPad P15s Gen1-20T4000JGE | |
| Microsoft Surface Laptop 3 15 i7-1065G7 | |
| Microsoft Surface Laptop 4 15 AMD TFF_00028 | |
| Asus ZenBook 15 UX534FT-DB77 | |
| HP 250 G7-15S40ES | |
| Blender / v2.79 BMW27 CPU | |
| Dell Inspiron 15 5000 5502 | |
| HP 250 G7-15S40ES | |
| Lenovo ThinkPad P15s Gen1-20T4000JGE | |
| HP Pavilion x360 15-er0155ng | |
| Genomsnitt Intel Core i7-1165G7 (468 - 1138, n=80) | |
| Asus Vivobook 15 K513EQ | |
| VAIO SX14 VJS144X0111K | |
| Microsoft Surface Laptop 4 15 AMD TFF_00028 | |
| HP Pavilion Aero 13 be0097nr | |
| Lenovo ThinkPad E15 G3-20YG003UGE | |
| 7-Zip 18.03 / 7z b 4 | |
| HP Pavilion Aero 13 be0097nr | |
| Microsoft Surface Laptop 4 15 AMD TFF_00028 | |
| Lenovo ThinkPad E15 G3-20YG003UGE | |
| VAIO SX14 VJS144X0111K | |
| Asus Vivobook 15 K513EQ | |
| Genomsnitt Intel Core i7-1165G7 (15347 - 27405, n=80) | |
| HP Pavilion x360 15-er0155ng | |
| Lenovo ThinkPad P15s Gen1-20T4000JGE | |
| HP 250 G7-15S40ES | |
| Dell Inspiron 15 5000 5502 | |
| 7-Zip 18.03 / 7z b 4 -mmt1 | |
| HP Pavilion Aero 13 be0097nr | |
| Asus Vivobook 15 K513EQ | |
| Genomsnitt Intel Core i7-1165G7 (4478 - 5507, n=80) | |
| VAIO SX14 VJS144X0111K | |
| HP Pavilion x360 15-er0155ng | |
| Lenovo ThinkPad P15s Gen1-20T4000JGE | |
| Dell Inspiron 15 5000 5502 | |
| Lenovo ThinkPad E15 G3-20YG003UGE | |
| Microsoft Surface Laptop 4 15 AMD TFF_00028 | |
| HP 250 G7-15S40ES | |
| Geekbench 5.5 / Multi-Core | |
| Microsoft Surface Laptop 4 15 AMD TFF_00028 | |
| Lenovo ThinkPad E15 G3-20YG003UGE | |
| Genomsnitt Intel Core i7-1165G7 (3078 - 5926, n=77) | |
| HP Pavilion x360 15-er0155ng | |
| Lenovo ThinkPad P15s Gen1-20T4000JGE | |
| HP 250 G7-15S40ES | |
| Dell Inspiron 15 5000 5502 | |
| Geekbench 5.5 / Single-Core | |
| Genomsnitt Intel Core i7-1165G7 (1302 - 1595, n=77) | |
| HP Pavilion x360 15-er0155ng | |
| Dell Inspiron 15 5000 5502 | |
| Lenovo ThinkPad P15s Gen1-20T4000JGE | |
| Lenovo ThinkPad E15 G3-20YG003UGE | |
| HP 250 G7-15S40ES | |
| Microsoft Surface Laptop 4 15 AMD TFF_00028 | |
| HWBOT x265 Benchmark v2.2 / 4k Preset | |
| HP Pavilion Aero 13 be0097nr | |
| Lenovo ThinkPad E15 G3-20YG003UGE | |
| Microsoft Surface Laptop 4 15 AMD TFF_00028 | |
| VAIO SX14 VJS144X0111K | |
| Asus Vivobook 15 K513EQ | |
| Genomsnitt Intel Core i7-1165G7 (1.39 - 8.47, n=80) | |
| HP Pavilion x360 15-er0155ng | |
| Lenovo ThinkPad P15s Gen1-20T4000JGE | |
| HP 250 G7-15S40ES | |
| Dell Inspiron 15 5000 5502 | |
| LibreOffice / 20 Documents To PDF | |
| Microsoft Surface Laptop 4 15 AMD TFF_00028 | |
| Lenovo ThinkPad P15s Gen1-20T4000JGE | |
| Dell Inspiron 15 5000 5502 | |
| Lenovo ThinkPad E15 G3-20YG003UGE | |
| HP 250 G7-15S40ES | |
| HP Pavilion Aero 13 be0097nr | |
| VAIO SX14 VJS144X0111K | |
| Genomsnitt Intel Core i7-1165G7 (21.5 - 88.1, n=78) | |
| HP Pavilion x360 15-er0155ng | |
| Asus Vivobook 15 K513EQ | |
| R Benchmark 2.5 / Overall mean | |
| HP 250 G7-15S40ES | |
| Dell Inspiron 15 5000 5502 | |
| Microsoft Surface Laptop 4 15 AMD TFF_00028 | |
| Lenovo ThinkPad P15s Gen1-20T4000JGE | |
| HP Pavilion x360 15-er0155ng | |
| Lenovo ThinkPad E15 G3-20YG003UGE | |
| Genomsnitt Intel Core i7-1165G7 (0.552 - 1.002, n=80) | |
| Asus Vivobook 15 K513EQ | |
| VAIO SX14 VJS144X0111K | |
| HP Pavilion Aero 13 be0097nr | |
Cinebench R23: Multi Core | Single Core
Cinebench R20: CPU (Multi Core) | CPU (Single Core)
Cinebench R15: CPU Multi 64Bit | CPU Single 64Bit
Blender: v2.79 BMW27 CPU
7-Zip 18.03: 7z b 4 | 7z b 4 -mmt1
Geekbench 5.5: Multi-Core | Single-Core
HWBOT x265 Benchmark v2.2: 4k Preset
LibreOffice : 20 Documents To PDF
R Benchmark 2.5: Overall mean
* ... mindre är bättre
AIDA64: FP32 Ray-Trace | FPU Julia | CPU SHA3 | CPU Queen | FPU SinJulia | FPU Mandel | CPU AES | CPU ZLib | FP64 Ray-Trace | CPU PhotoWorxx
| Performance rating | |
| Asus VivoBook 15 Pro M3500QC-L1062 | |
| Lenovo IdeaPad 5 15ALC05 | |
| Asus Vivobook 15 K513EQ | |
| HP Pavilion 15-eg | |
| Asus VivoBook S15 S533EQ-BQ002T | |
| Genomsnitt Intel Core i7-1165G7 | |
| Dell Inspiron 15 3501 | |
| AIDA64 / FP32 Ray-Trace | |
| Asus VivoBook 15 Pro M3500QC-L1062 | |
| Lenovo IdeaPad 5 15ALC05 | |
| Asus Vivobook 15 K513EQ | |
| Asus VivoBook S15 S533EQ-BQ002T | |
| Genomsnitt Intel Core i7-1165G7 (3933 - 8184, n=58) | |
| HP Pavilion 15-eg | |
| Dell Inspiron 15 3501 | |
| AIDA64 / FPU Julia | |
| Asus VivoBook 15 Pro M3500QC-L1062 | |
| Lenovo IdeaPad 5 15ALC05 | |
| Asus Vivobook 15 K513EQ | |
| Asus VivoBook S15 S533EQ-BQ002T | |
| Genomsnitt Intel Core i7-1165G7 (17720 - 34369, n=58) | |
| HP Pavilion 15-eg | |
| Dell Inspiron 15 3501 | |
| AIDA64 / CPU SHA3 | |
| Asus VivoBook 15 Pro M3500QC-L1062 | |
| Asus Vivobook 15 K513EQ | |
| Asus VivoBook S15 S533EQ-BQ002T | |
| Genomsnitt Intel Core i7-1165G7 (958 - 2338, n=58) | |
| HP Pavilion 15-eg | |
| Dell Inspiron 15 3501 | |
| Lenovo IdeaPad 5 15ALC05 | |
| AIDA64 / CPU Queen | |
| Asus VivoBook 15 Pro M3500QC-L1062 | |
| Lenovo IdeaPad 5 15ALC05 | |
| HP Pavilion 15-eg | |
| Asus VivoBook S15 S533EQ-BQ002T | |
| Asus Vivobook 15 K513EQ | |
| Dell Inspiron 15 3501 | |
| Genomsnitt Intel Core i7-1165G7 (44161 - 50624, n=58) | |
| AIDA64 / FPU SinJulia | |
| Lenovo IdeaPad 5 15ALC05 | |
| Asus VivoBook 15 Pro M3500QC-L1062 | |
| Asus Vivobook 15 K513EQ | |
| Asus VivoBook S15 S533EQ-BQ002T | |
| Genomsnitt Intel Core i7-1165G7 (3183 - 4796, n=58) | |
| HP Pavilion 15-eg | |
| Dell Inspiron 15 3501 | |
| AIDA64 / FPU Mandel | |
| Asus VivoBook 15 Pro M3500QC-L1062 | |
| Lenovo IdeaPad 5 15ALC05 | |
| Asus Vivobook 15 K513EQ | |
| Asus VivoBook S15 S533EQ-BQ002T | |
| Genomsnitt Intel Core i7-1165G7 (11876 - 20468, n=58) | |
| HP Pavilion 15-eg | |
| Dell Inspiron 15 3501 | |
| AIDA64 / CPU AES | |
| Asus VivoBook 15 Pro M3500QC-L1062 | |
| Asus Vivobook 15 K513EQ | |
| Asus VivoBook S15 S533EQ-BQ002T | |
| HP Pavilion 15-eg | |
| Dell Inspiron 15 3501 | |
| Genomsnitt Intel Core i7-1165G7 (29506 - 73387, n=58) | |
| Lenovo IdeaPad 5 15ALC05 | |
| AIDA64 / CPU ZLib | |
| Asus VivoBook 15 Pro M3500QC-L1062 | |
| Lenovo IdeaPad 5 15ALC05 | |
| Asus Vivobook 15 K513EQ | |
| Asus VivoBook S15 S533EQ-BQ002T | |
| Dell Inspiron 15 3501 | |
| HP Pavilion 15-eg | |
| Genomsnitt Intel Core i7-1165G7 (169 - 402, n=65) | |
| AIDA64 / FP64 Ray-Trace | |
| Asus VivoBook 15 Pro M3500QC-L1062 | |
| Lenovo IdeaPad 5 15ALC05 | |
| Asus Vivobook 15 K513EQ | |
| Asus VivoBook S15 S533EQ-BQ002T | |
| Dell Inspiron 15 3501 | |
| Genomsnitt Intel Core i7-1165G7 (2033 - 4461, n=58) | |
| HP Pavilion 15-eg | |
| AIDA64 / CPU PhotoWorxx | |
| HP Pavilion 15-eg | |
| Genomsnitt Intel Core i7-1165G7 (12392 - 45694, n=58) | |
| Asus VivoBook S15 S533EQ-BQ002T | |
| Asus Vivobook 15 K513EQ | |
| Dell Inspiron 15 3501 | |
| Lenovo IdeaPad 5 15ALC05 | |
| Asus VivoBook 15 Pro M3500QC-L1062 | |
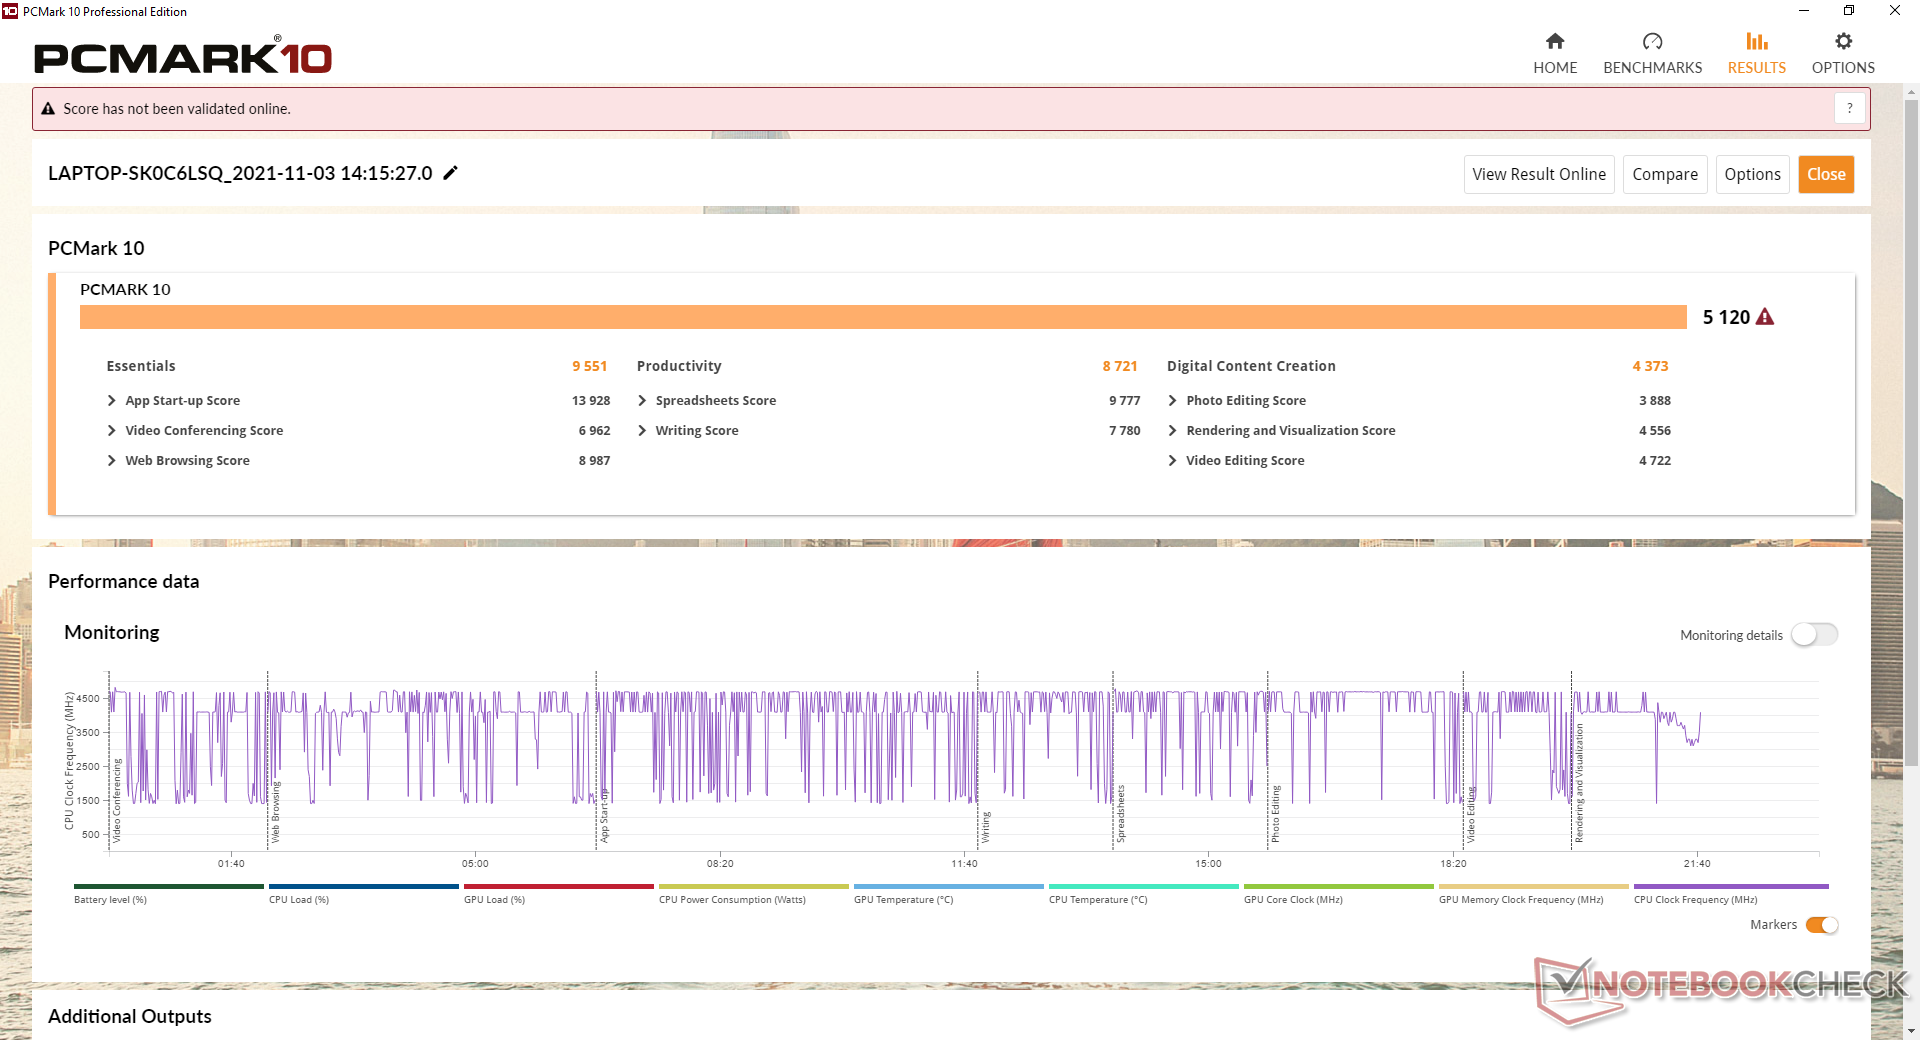
Systemets prestanda
| PCMark 10 / Score | |
| Asus VivoBook 15 Pro M3500QC-L1062 | |
| HP Pavilion 15-eg | |
| Asus VivoBook S15 S533EQ-BQ002T | |
| Lenovo IdeaPad 5 15ALC05 | |
| Asus Vivobook 15 K513EQ | |
| Genomsnitt Intel Core i7-1165G7, NVIDIA GeForce MX350 (4855 - 5306, n=5) | |
| Dell Inspiron 15 3501 | |
| PCMark 10 / Essentials | |
| Asus VivoBook 15 Pro M3500QC-L1062 | |
| HP Pavilion 15-eg | |
| Dell Inspiron 15 3501 | |
| Asus Vivobook 15 K513EQ | |
| Lenovo IdeaPad 5 15ALC05 | |
| Asus VivoBook S15 S533EQ-BQ002T | |
| Genomsnitt Intel Core i7-1165G7, NVIDIA GeForce MX350 (8026 - 9551, n=5) | |
| PCMark 10 / Productivity | |
| HP Pavilion 15-eg | |
| Asus Vivobook 15 K513EQ | |
| Genomsnitt Intel Core i7-1165G7, NVIDIA GeForce MX350 (8343 - 9071, n=5) | |
| Asus VivoBook 15 Pro M3500QC-L1062 | |
| Asus VivoBook S15 S533EQ-BQ002T | |
| Lenovo IdeaPad 5 15ALC05 | |
| Dell Inspiron 15 3501 | |
| PCMark 10 / Digital Content Creation | |
| Asus VivoBook 15 Pro M3500QC-L1062 | |
| HP Pavilion 15-eg | |
| Asus VivoBook S15 S533EQ-BQ002T | |
| Lenovo IdeaPad 5 15ALC05 | |
| Dell Inspiron 15 3501 | |
| Genomsnitt Intel Core i7-1165G7, NVIDIA GeForce MX350 (4373 - 5330, n=5) | |
| Asus Vivobook 15 K513EQ | |
| PCMark 10 Score | 5120 poäng | |
Hjälp | ||
| AIDA64 / Memory Copy | |
| Genomsnitt Intel Core i7-1165G7 (20032 - 65446, n=58) | |
| HP Pavilion 15-eg | |
| Asus VivoBook 15 Pro M3500QC-L1062 | |
| Asus VivoBook S15 S533EQ-BQ002T | |
| Asus Vivobook 15 K513EQ | |
| Lenovo IdeaPad 5 15ALC05 | |
| Dell Inspiron 15 3501 | |
| AIDA64 / Memory Read | |
| Genomsnitt Intel Core i7-1165G7 (23033 - 64524, n=58) | |
| HP Pavilion 15-eg | |
| Asus VivoBook 15 Pro M3500QC-L1062 | |
| Asus Vivobook 15 K513EQ | |
| Asus VivoBook S15 S533EQ-BQ002T | |
| Lenovo IdeaPad 5 15ALC05 | |
| Dell Inspiron 15 3501 | |
| AIDA64 / Memory Write | |
| Genomsnitt Intel Core i7-1165G7 (21736 - 66791, n=58) | |
| HP Pavilion 15-eg | |
| Asus Vivobook 15 K513EQ | |
| Asus VivoBook S15 S533EQ-BQ002T | |
| Asus VivoBook 15 Pro M3500QC-L1062 | |
| Dell Inspiron 15 3501 | |
| Lenovo IdeaPad 5 15ALC05 | |
| AIDA64 / Memory Latency | |
| Lenovo IdeaPad 5 15ALC05 | |
| Dell Inspiron 15 3501 | |
| Asus Vivobook 15 K513EQ | |
| Asus VivoBook S15 S533EQ-BQ002T | |
| Genomsnitt Intel Core i7-1165G7 (69 - 110, n=65) | |
| Asus VivoBook 15 Pro M3500QC-L1062 | |
| HP Pavilion 15-eg | |
* ... mindre är bättre
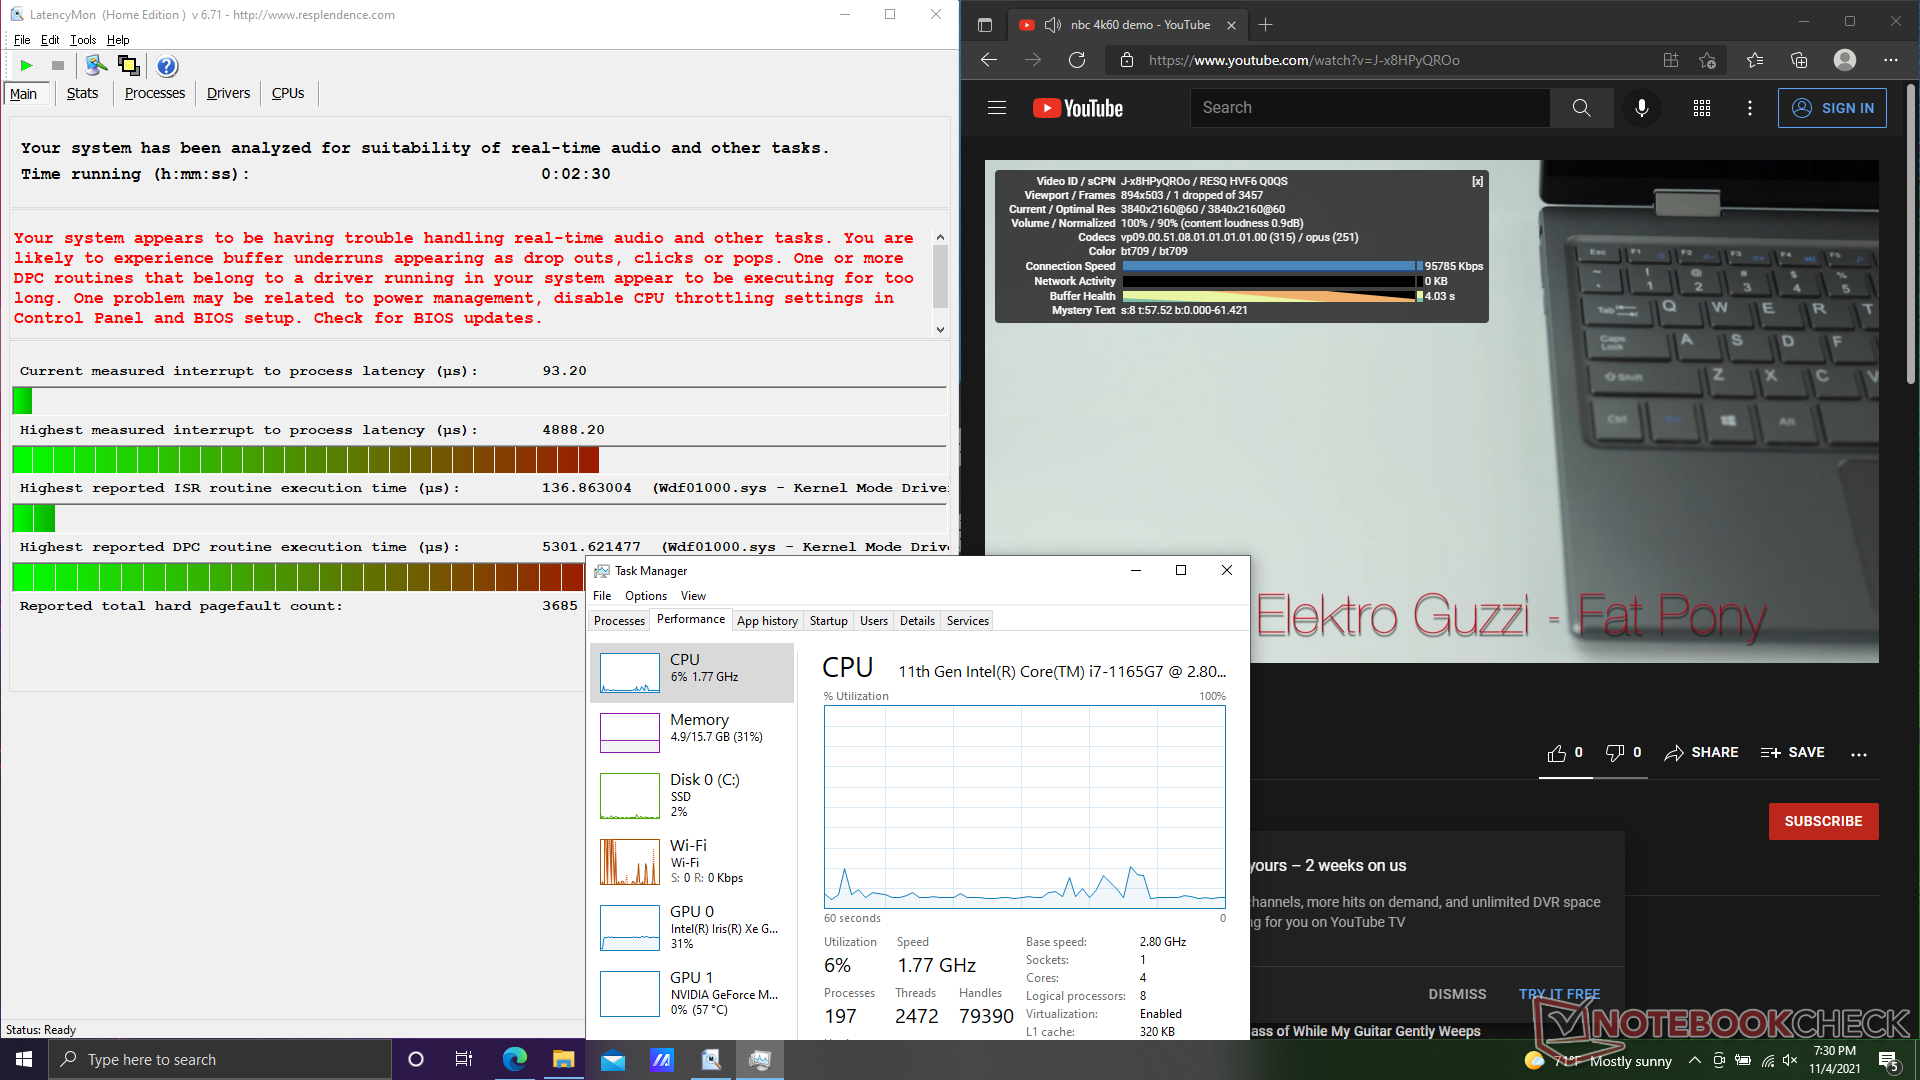
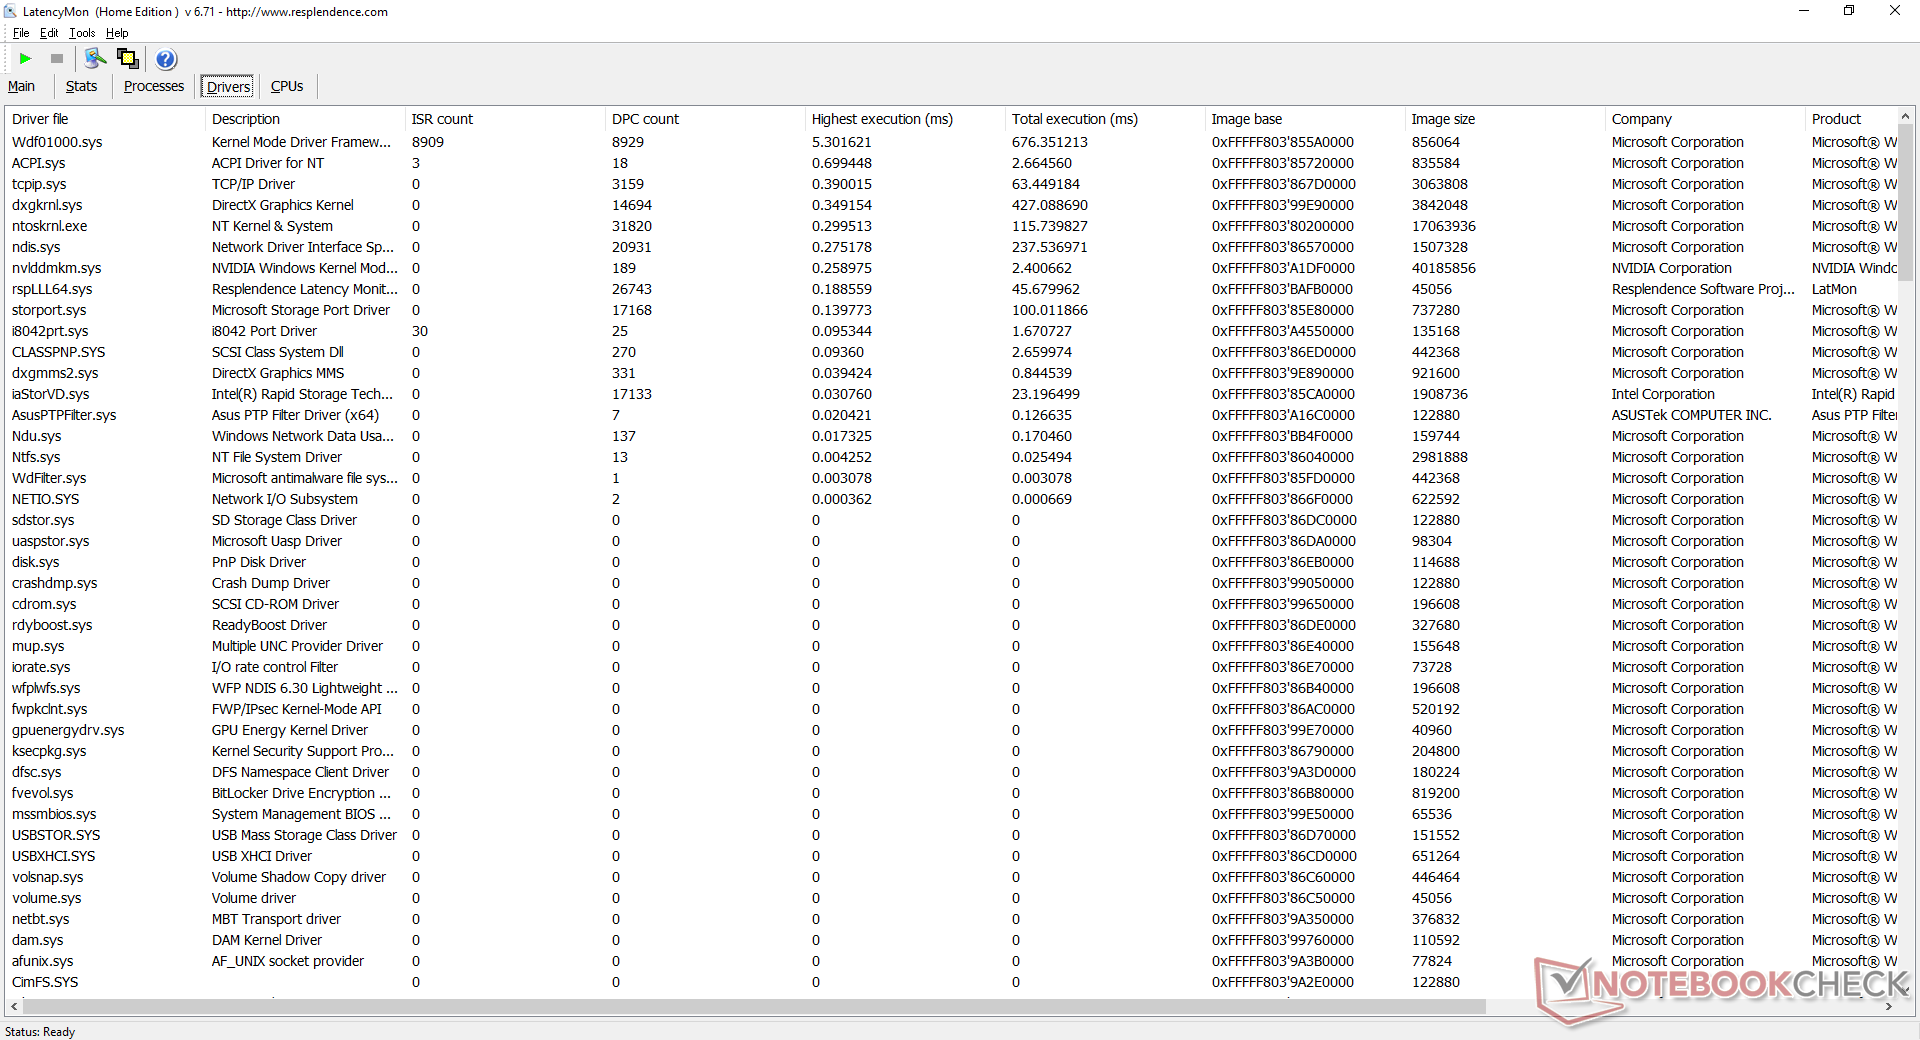
DPC-latenstid
LatencyMon visar DPC-problem när man öppnar flera webbläsarflikar på vår hemsida. Uppspelning av native 4K-video vid 60 FPS går annars smidigt och utan problem.
| DPC Latencies / LatencyMon - interrupt to process latency (max), Web, Youtube, Prime95 | |
| Asus Vivobook 15 K513EQ | |
| HP Pavilion 15-eg | |
| Dell Inspiron 15 3501 | |
| Lenovo IdeaPad 5 15ALC05 | |
| Asus VivoBook S15 S533EQ-BQ002T | |
| Asus VivoBook 15 Pro M3500QC-L1062 | |
* ... mindre är bättre
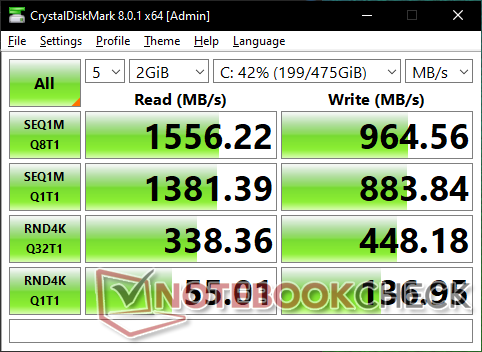
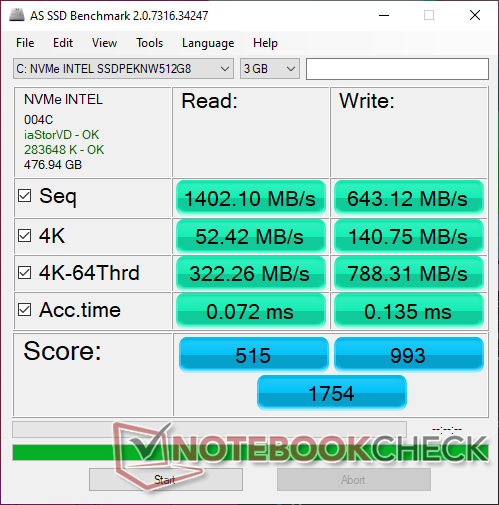
Lagringsenheter - Endast plats för en enhet
Vår enhet är konfigurerad med en 512 GB Intel 660p SSDPEKNW512G8 PCIe3 NVMe SSD för teoretiska maximala läs- och skrivhastigheter på endast 1500 MB/s respektive 1000 MB/s, vilket är ungefär två gånger långsammare än den dyrare Samsung PM981a-serien. Prestandan kommer sannolikt att vara tillräcklig för målgruppen, särskilt med tanke på ULV U-seriens CPU och GeForce MX-grafik som enheten är parat med. En värmespridare är inte lika nödvändig för att bevara prestandan när den utsätts för stress eftersom Intel 660p endast är en NVMe-lösning i budget- till mellanklassegmentet.

| Drive Performance rating - Percent | |
| Asus VivoBook 15 Pro M3500QC-L1062 | |
| Dell Inspiron 15 3501 | |
| Lenovo IdeaPad 5 15ALC05 | |
| Asus VivoBook S15 S533EQ-BQ002T | |
| HP Pavilion 15-eg | |
| Asus Vivobook 15 K513EQ | |
* ... mindre är bättre
Disk Throttling: DiskSpd Read Loop, Queue Depth 8
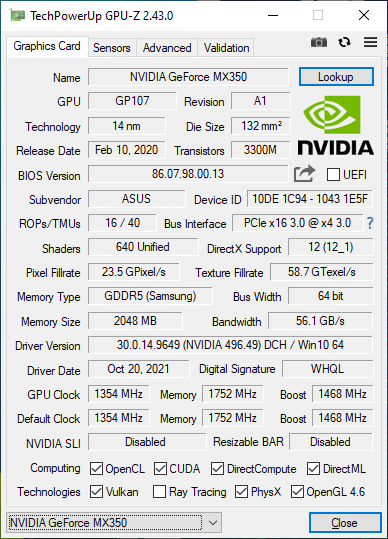
GPU-prestanda - Iris Xe vs. GeForce MX350
Grafikprestanda är där vi förväntar oss att den ska vara i förhållande till andra bärbara datorer som är utrustade med samma GeForce MX350 GPU. Intels konkurrerande integrerade Iris Xe plattform har stadigt förbättrats med tiden när det gäller drivrutiner och spelstöd till den grad att den nu ligger hals i hals med Nvidias GPU i de flesta fall. GTA V och DOTA 2 Reborn är två anmärkningsvärda undantag där vår GeForce-drivna Vivobook fortfarande skulle ha anmärkningsvärda prestandafördelar jämfört med Iris Xe.
Uppgradering från MX330 till MX350 ökar prestandan med cirka 15-20 procent.
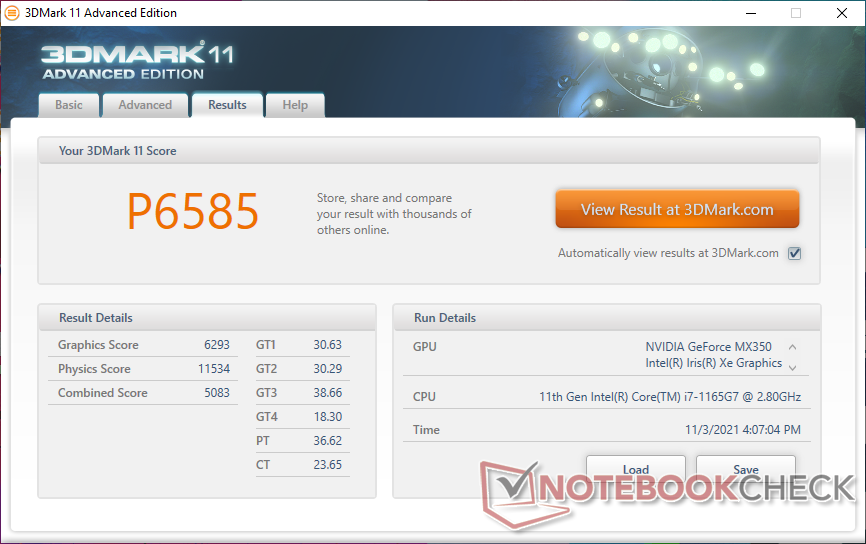
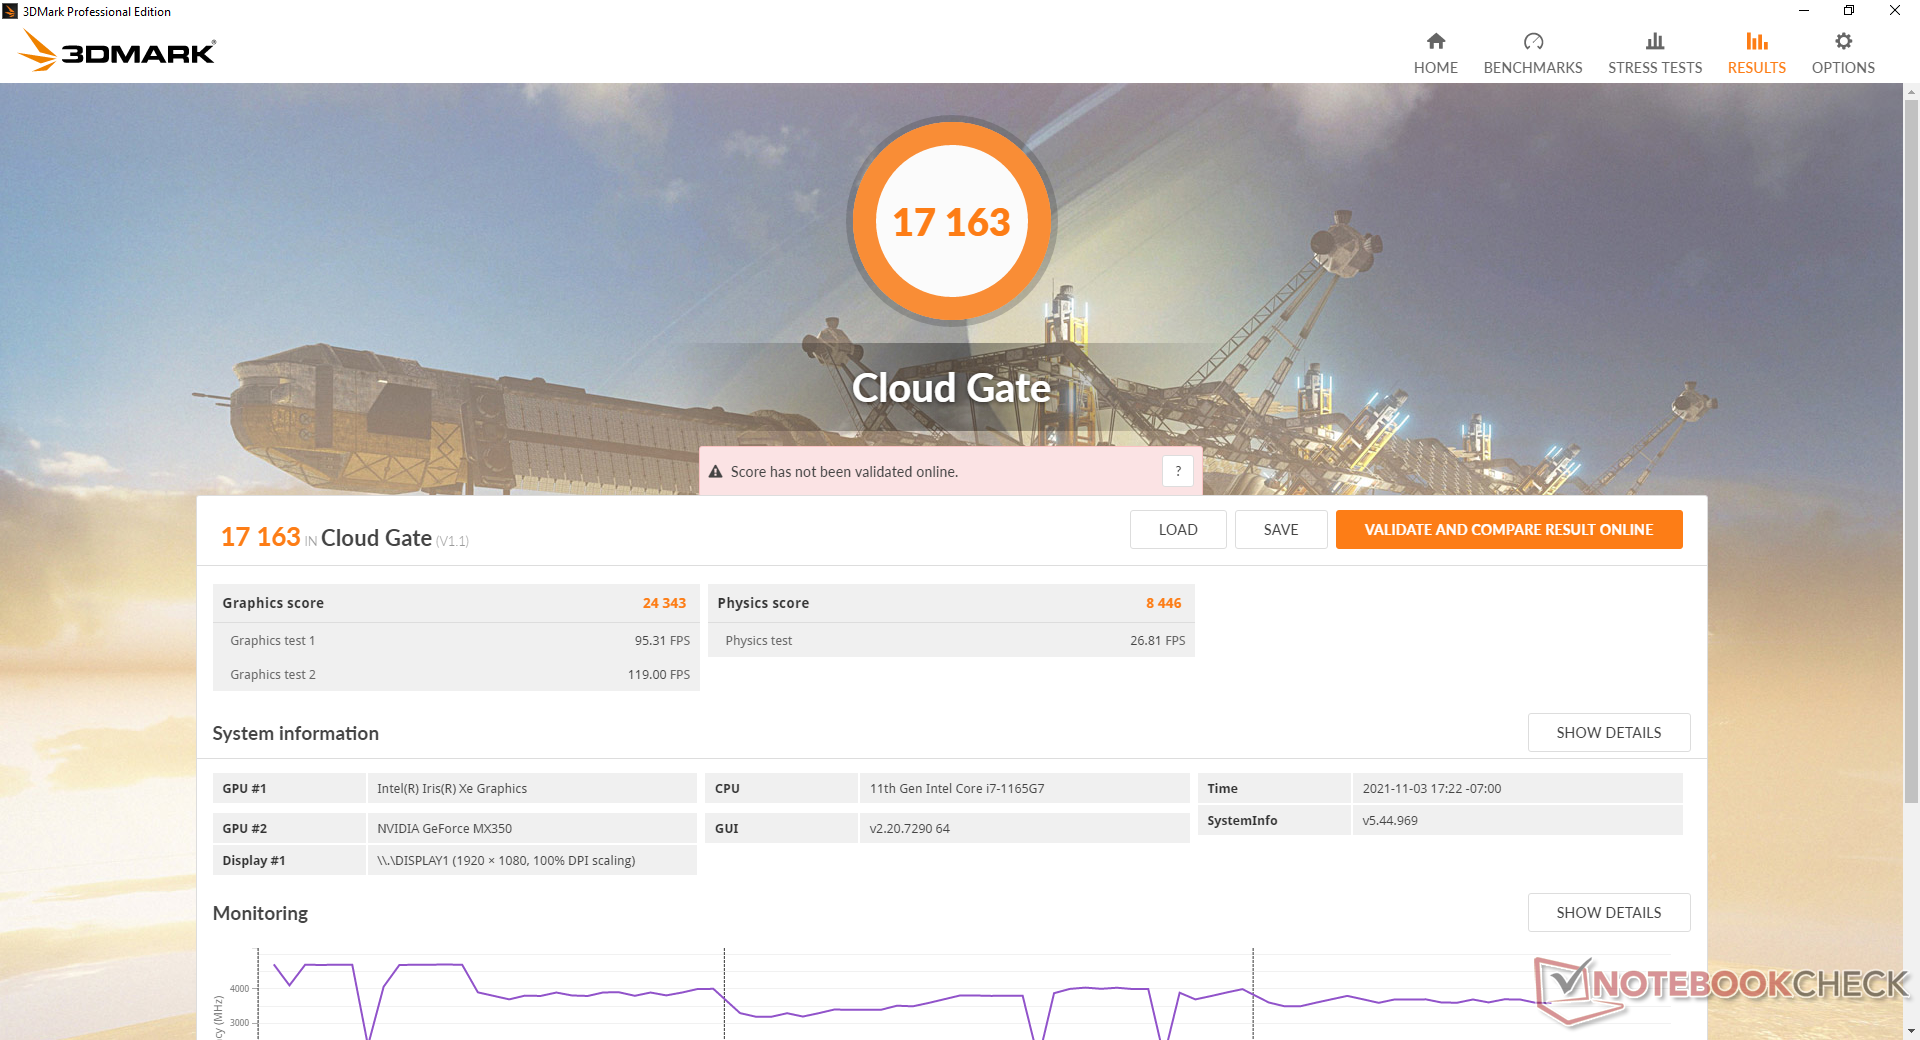
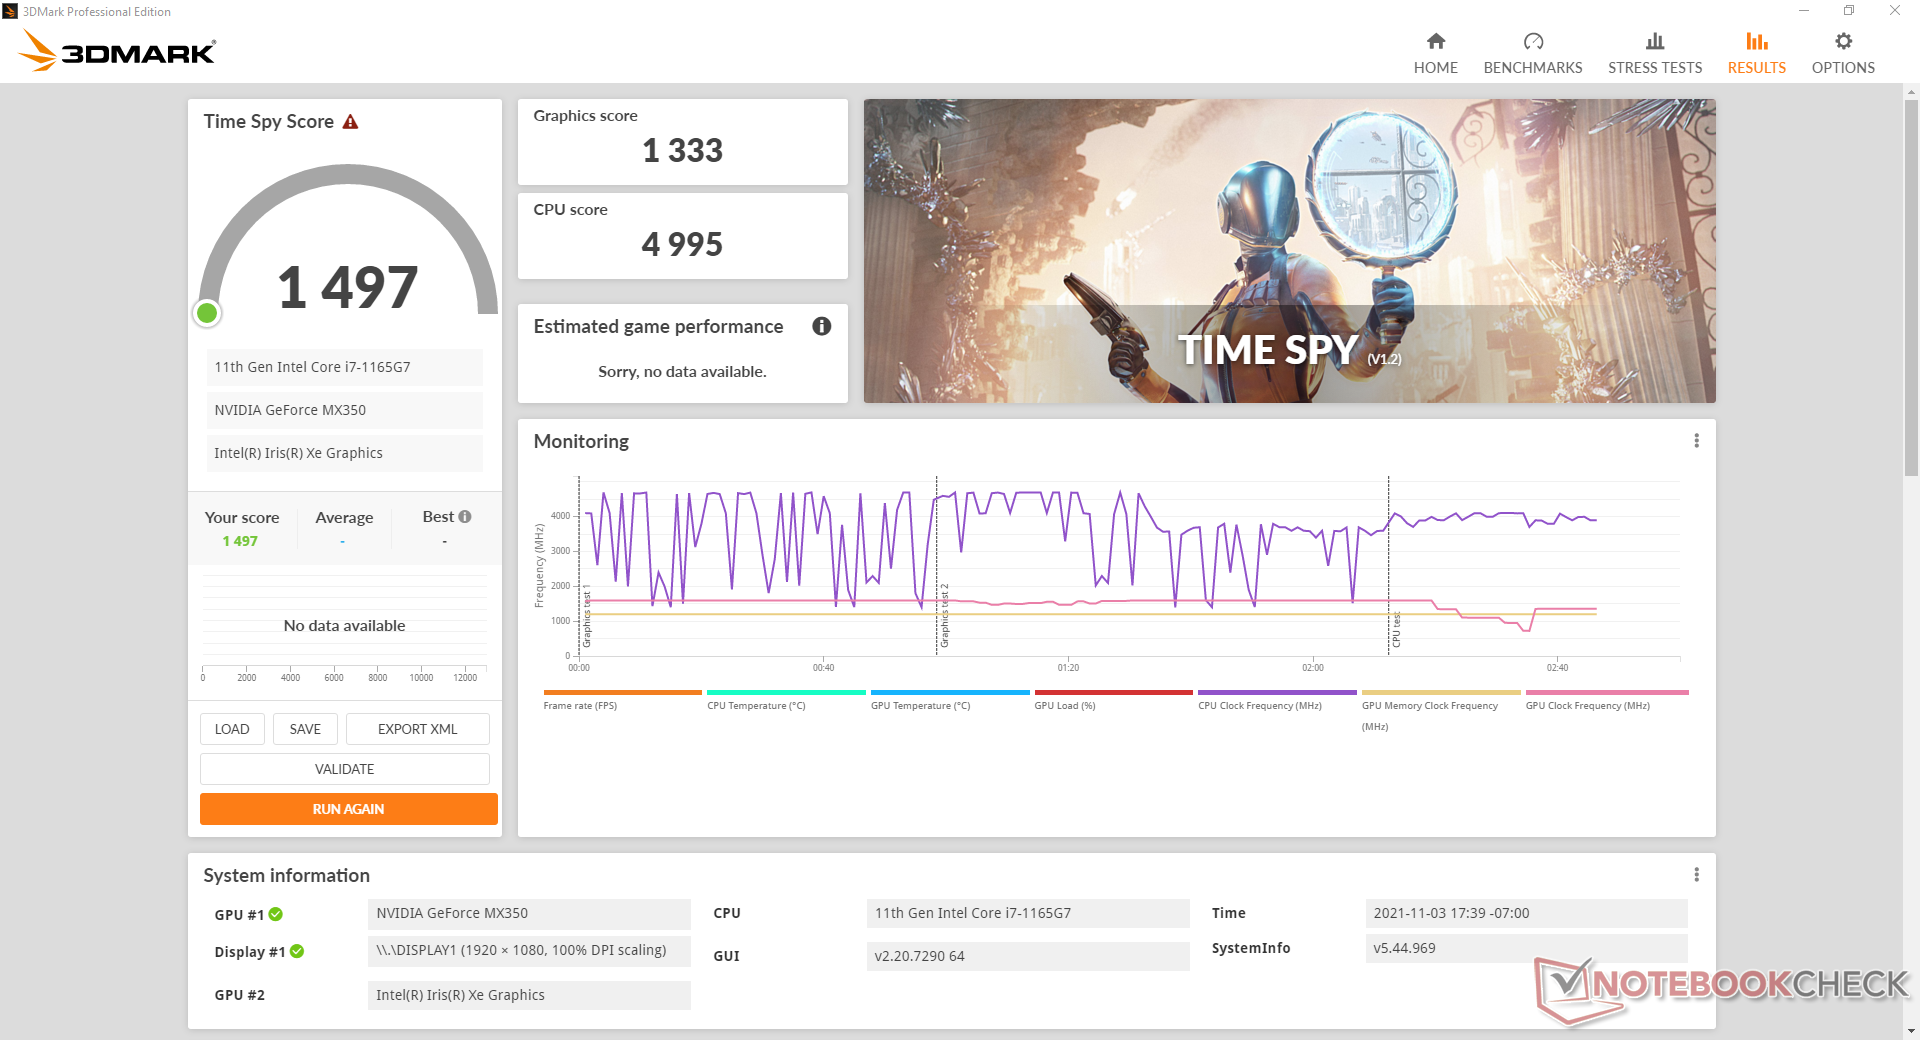
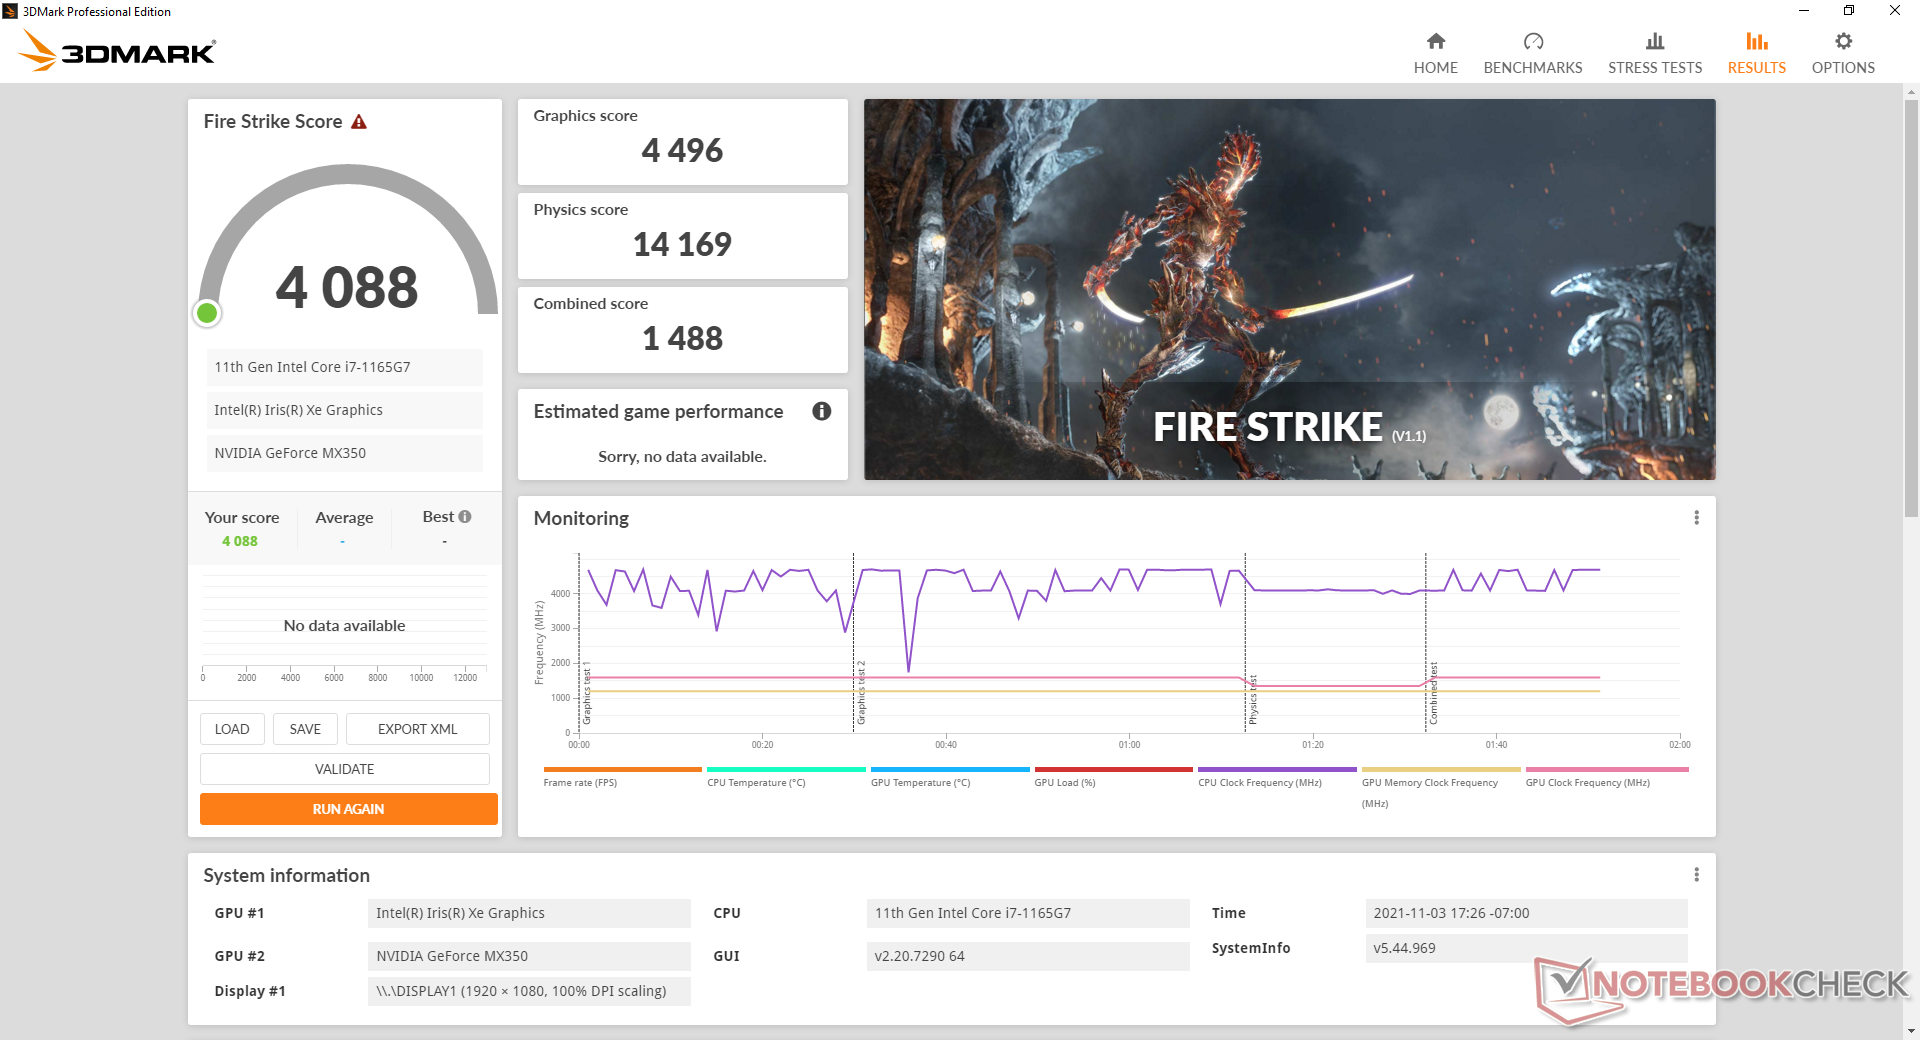
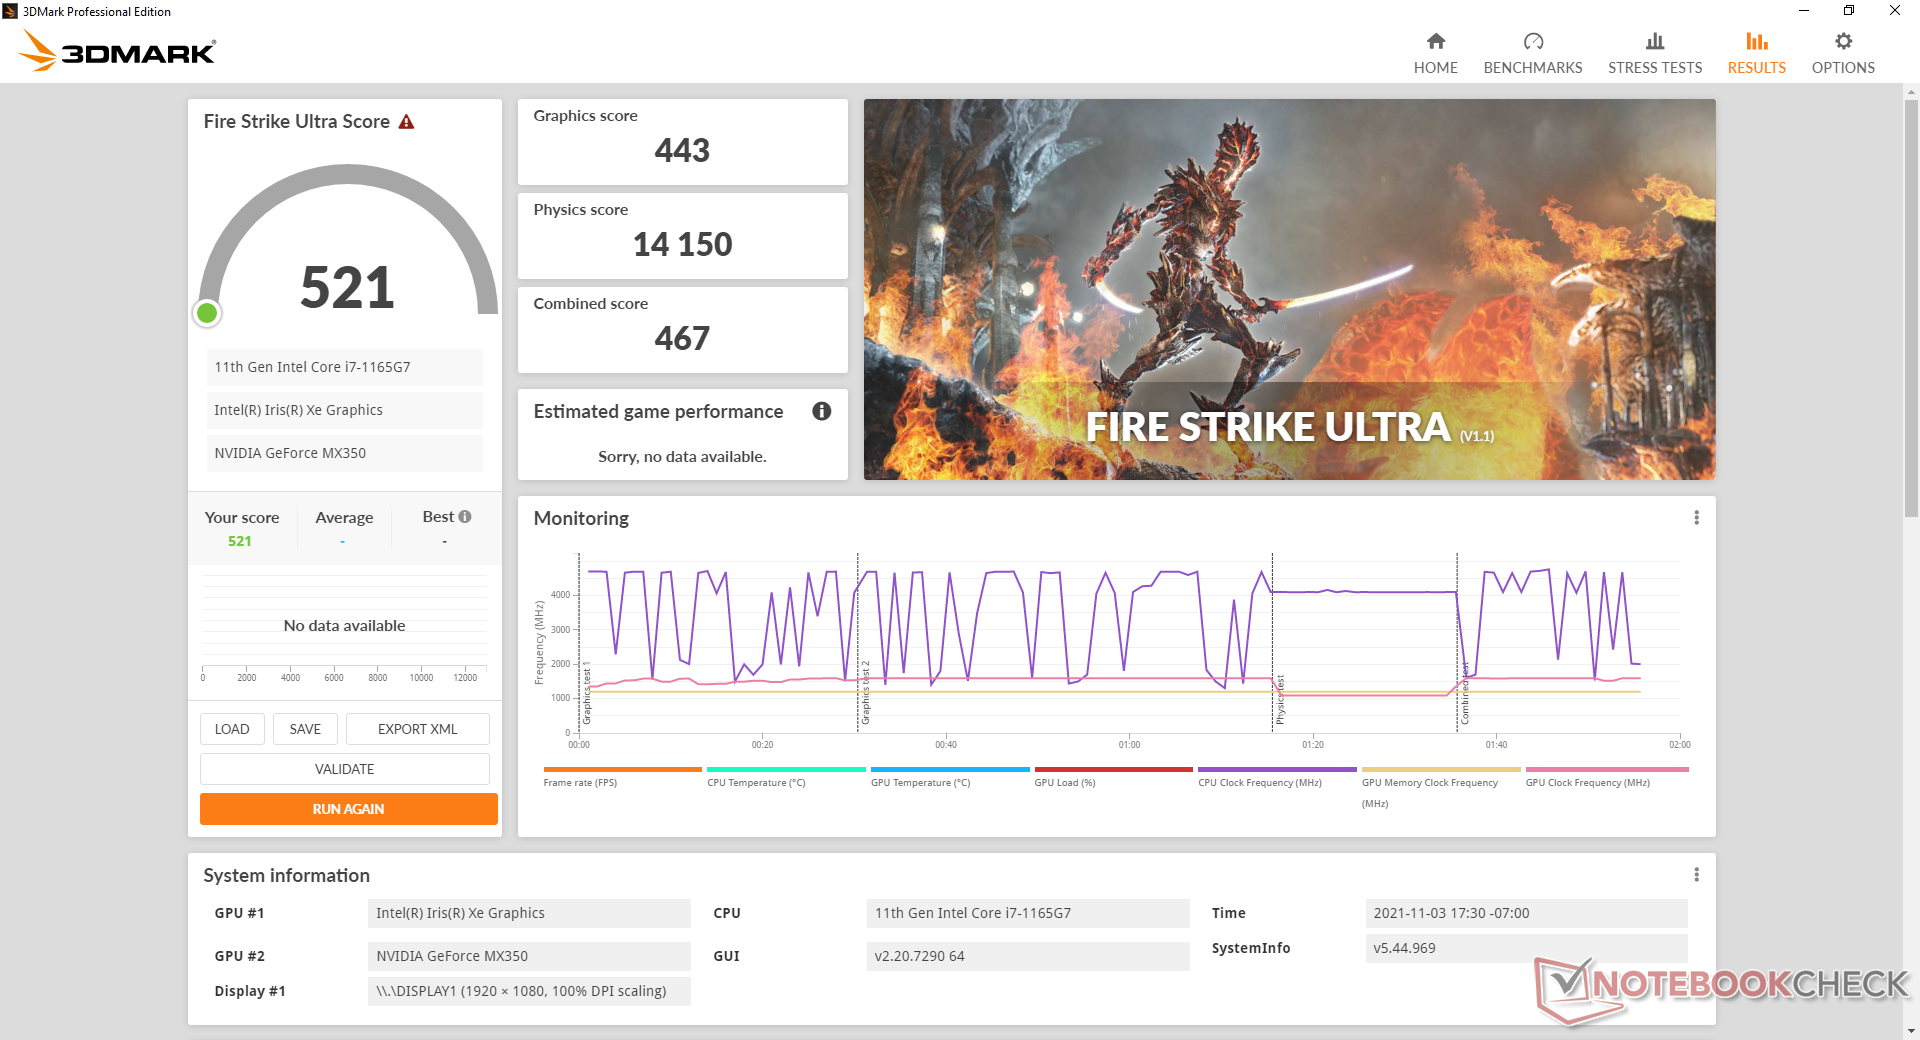
| 3DMark 11 Performance | 6585 poäng | |
| 3DMark Cloud Gate Standard Score | 17163 poäng | |
| 3DMark Fire Strike Score | 4088 poäng | |
| 3DMark Time Spy Score | 1497 poäng | |
Hjälp | ||
| Far Cry 5 | |
| 1280x720 Low Preset AA:T | |
| VAIO SX14 VJS144X0111K | |
| Genomsnitt NVIDIA GeForce MX350 (58 - 64, n=7) | |
| Asus Vivobook 15 K513EQ | |
| Microsoft Surface Laptop 4 15 AMD TFF_00028 | |
| HP Pavilion Aero 13 be0097nr | |
| HP 250 G7-15S40ES | |
| 1920x1080 Low Preset AA:T | |
| Genomsnitt NVIDIA GeForce MX350 (32 - 34, n=3) | |
| VAIO SX14 VJS144X0111K | |
| Asus Vivobook 15 K513EQ | |
| HP Pavilion Aero 13 be0097nr | |
| HP 250 G7-15S40ES | |
| 1920x1080 Medium Preset AA:T | |
| VAIO SX14 VJS144X0111K | |
| Genomsnitt NVIDIA GeForce MX350 (24 - 30, n=7) | |
| Asus Vivobook 15 K513EQ | |
| HP Pavilion Aero 13 be0097nr | |
| Microsoft Surface Laptop 4 15 AMD TFF_00028 | |
| HP 250 G7-15S40ES | |
| 1920x1080 High Preset AA:T | |
| VAIO SX14 VJS144X0111K | |
| Asus Vivobook 15 K513EQ | |
| Genomsnitt NVIDIA GeForce MX350 (22 - 25, n=7) | |
| HP Pavilion Aero 13 be0097nr | |
| HP 250 G7-15S40ES | |
| 1920x1080 Ultra Preset AA:T | |
| VAIO SX14 VJS144X0111K | |
| Asus Vivobook 15 K513EQ | |
| Genomsnitt NVIDIA GeForce MX350 (20 - 22, n=6) | |
| HP Pavilion Aero 13 be0097nr | |
| HP 250 G7-15S40ES | |
| X-Plane 11.11 | |
| 1280x720 low (fps_test=1) | |
| Genomsnitt NVIDIA GeForce MX350 (49.1 - 90.8, n=14) | |
| Asus Vivobook 15 K513EQ | |
| Lenovo ThinkPad P15s Gen1-20T4000JGE | |
| HP Pavilion Aero 13 be0097nr | |
| VAIO SX14 VJS144X0111K | |
| Lenovo ThinkPad E15 G3-20YG003UGE | |
| HP 250 G7-15S40ES | |
| HP Pavilion x360 15-er0155ng | |
| Microsoft Surface Laptop 4 15 AMD TFF_00028 | |
| 1920x1080 med (fps_test=2) | |
| Asus Vivobook 15 K513EQ | |
| Genomsnitt NVIDIA GeForce MX350 (35.5 - 72.3, n=14) | |
| VAIO SX14 VJS144X0111K | |
| HP Pavilion x360 15-er0155ng | |
| Lenovo ThinkPad E15 G3-20YG003UGE | |
| HP Pavilion Aero 13 be0097nr | |
| Microsoft Surface Laptop 4 15 AMD TFF_00028 | |
| HP 250 G7-15S40ES | |
| Lenovo ThinkPad P15s Gen1-20T4000JGE | |
| 1920x1080 high (fps_test=3) | |
| Asus Vivobook 15 K513EQ | |
| Genomsnitt NVIDIA GeForce MX350 (30.2 - 63.7, n=14) | |
| VAIO SX14 VJS144X0111K | |
| HP Pavilion x360 15-er0155ng | |
| HP Pavilion Aero 13 be0097nr | |
| Lenovo ThinkPad E15 G3-20YG003UGE | |
| Microsoft Surface Laptop 4 15 AMD TFF_00028 | |
| HP 250 G7-15S40ES | |
| Lenovo ThinkPad P15s Gen1-20T4000JGE | |
Witcher 3 FPS Chart
| låg | med. | hög | ultra | |
|---|---|---|---|---|
| GTA V (2015) | 141 | 115 | 45.8 | 23.7 |
| The Witcher 3 (2015) | 86 | 48.6 | 29.9 | 16.7 |
| Dota 2 Reborn (2015) | 126 | 119 | 80.4 | 73.4 |
| Final Fantasy XV Benchmark (2018) | 48.6 | 23 | 14.5 | |
| X-Plane 11.11 (2018) | 66.7 | 62.7 | 53.9 | |
| Far Cry 5 (2018) | 59 | 26 | 23 | 22 |
| Strange Brigade (2018) | 92.7 | 32.3 | 25 | 18.8 |
Utsläpp - tyst för det mesta
Systembrus
Den interna fläkten gör ett bra jobb genom att vara så tyst som möjligt och med minimalt pulserande beteende vid låg belastning. Fläktljudet ligger i allmänhet på 27 dB(A) eller lägre när du surfar på webben eller streamar video mot en tyst bakgrund på 23,4 dB(A). Ett visst litet elektroniskt brus eller spolningsljud på vår testenhet hindrar den från att vara helt ljudlös
Fläktljudet är knutet till de tre prestandainställningarna (Whisper, Balanced och Performance) i MyAsus-programvaran. Körning av Witcher 3 i läget Balanced eller Performance resulterar i ett konstant fläktljud på 40,7 dB(A) respektive 42,9 dB(A), vilket är något högre än många Ultrabooks som endast drivs av integrerad grafik. Extrema bearbetningsbelastningar som Prime95 och FurMark ger ett ännu högre maximalt fläktljud på 47 dB(A).
Ljudnivå
| Låg belastning |
| 23.6 / 23.6 / 23.6 dB(A) |
| Hög belastning |
| 41 / 47 dB(A) |
 | ||
30 dB tyst 40 dB(A) hörbar 50 dB(A) högt ljud |
||
min: | ||
| Asus Vivobook 15 K513EQ GeForce MX350, i7-1165G7, Intel SSD 660p SSDPEKNW512G8 | Asus VivoBook 15 Pro M3500QC-L1062 GeForce RTX 3050 4GB Laptop GPU, R5 5600H, SK Hynix HFM512GD3JX013N | Asus VivoBook S15 S533EQ-BQ002T GeForce MX350, i7-1165G7, Intel SSD 660p 1TB SSDPEKNW010T8 | Lenovo IdeaPad 5 15ALC05 Vega 7, R5 5500U | Dell Inspiron 15 3501 Iris Xe G7 96EUs, i7-1165G7, Samsung PM991a MZ9LQ512HBLU-00BD1 | HP Pavilion 15-eg GeForce MX450, i7-1165G7, Samsung PM991 MZVLQ1T0HALB | |
|---|---|---|---|---|---|---|
| Noise | -3% | -0% | -4% | -1% | -1% | |
| av / miljö * (dB) | 23.4 | 24.8 -6% | 25 -7% | 26 -11% | 26 -11% | 25.4 -9% |
| Idle Minimum * (dB) | 23.6 | 24.8 -5% | 25 -6% | 26 -10% | 26 -10% | 25.6 -8% |
| Idle Average * (dB) | 23.6 | 24.8 -5% | 25 -6% | 26 -10% | 26 -10% | 25.6 -8% |
| Idle Maximum * (dB) | 23.6 | 26.4 -12% | 25 -6% | 26 -10% | 26 -10% | 25.6 -8% |
| Load Average * (dB) | 41 | 42.8 -4% | 39.5 4% | 42.6 -4% | 35.9 12% | 39.2 4% |
| Witcher 3 ultra * (dB) | 42.9 | 42.8 -0% | 39.3 8% | 39.1 9% | ||
| Load Maximum * (dB) | 47 | 42.8 9% | 41.6 11% | 37.4 20% | 35.8 24% | 41.5 12% |
* ... mindre är bättre
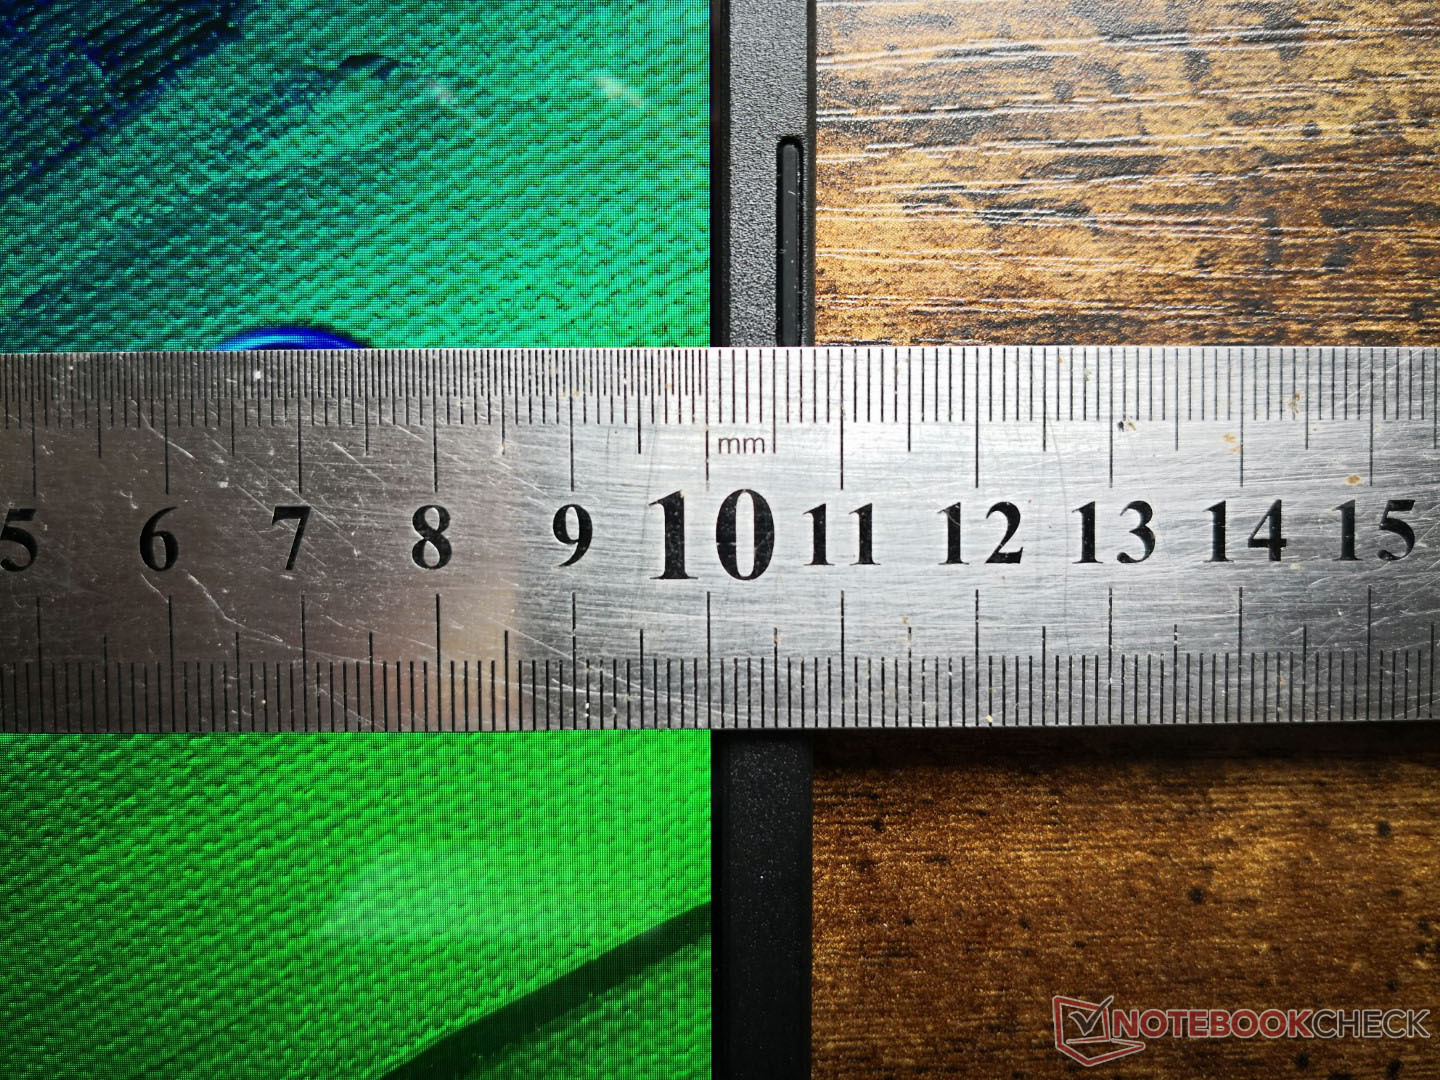
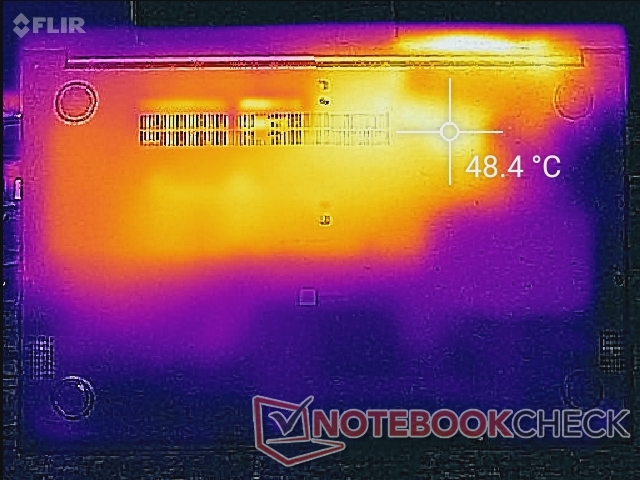
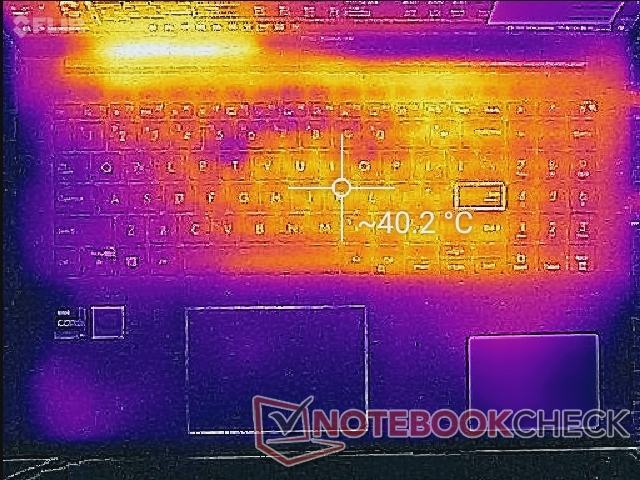
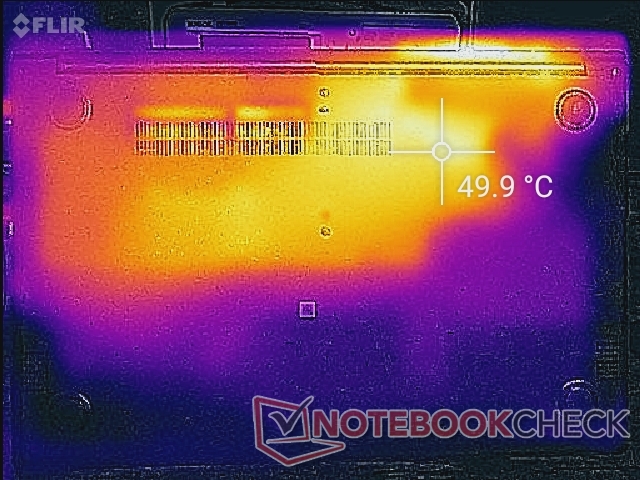
Temperatur
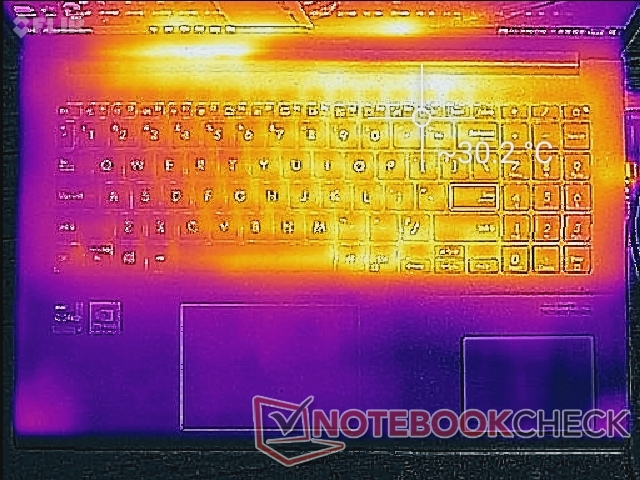
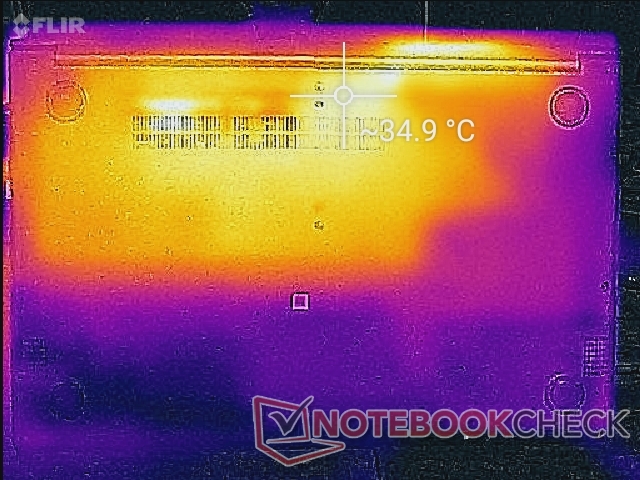
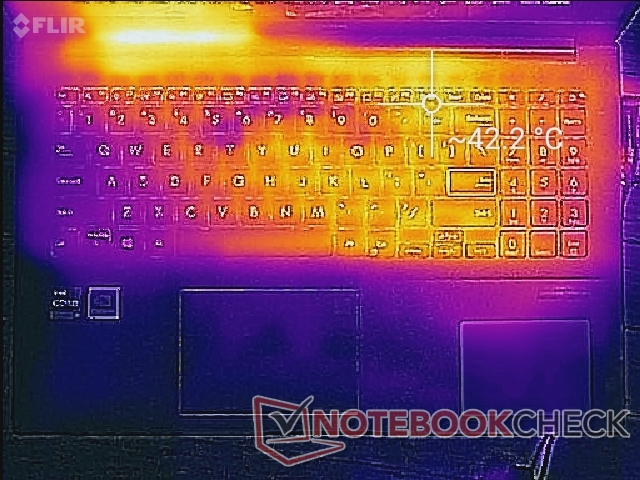
Den högra halvan av den bärbara datorn kommer alltid att vara varmare än den vänstra halvan på grund av utformningen av kylningslösningen. Hot spots på tangentbordet kan bli så varma som 42 C när du spelar, vilket är jämförbart med den HP Pavilion 15 som är utrustad med integrerad Iris Xe-grafik. Bottendelen kan dock vara ännu varmare med nästan 50 C nära baksidan.
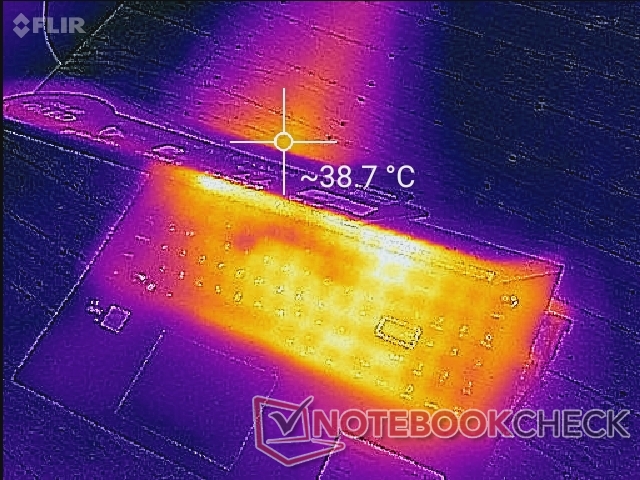
(-) Den maximala temperaturen på ovansidan är 48.8 °C / 120 F, jämfört med genomsnittet av 36.8 °C / 98 F , allt från 21 till 71 °C för klassen Multimedia.
(±) Botten värms upp till maximalt 42 °C / 108 F, jämfört med genomsnittet av 39.1 °C / 102 F
(+) Vid tomgångsbruk är medeltemperaturen för ovansidan 25.6 °C / 78 F, jämfört med enhetsgenomsnittet på 31.3 °C / ### class_avg_f### F.
(±) När du spelar The Witcher 3 är medeltemperaturen för ovansidan 33.9 °C / 93 F, jämfört med enhetsgenomsnittet på 31.3 °C / ## #class_avg_f### F.
(+) Handledsstöden och pekplattan är kallare än hudtemperaturen med maximalt 28.2 °C / 82.8 F och är därför svala att ta på.
(±) Medeltemperaturen för handledsstödsområdet på liknande enheter var 28.7 °C / 83.7 F (+0.5 °C / 0.9 F).
| Asus Vivobook 15 K513EQ Intel Core i7-1165G7, NVIDIA GeForce MX350 | Asus VivoBook 15 Pro M3500QC-L1062 AMD Ryzen 5 5600H, NVIDIA GeForce RTX 3050 4GB Laptop GPU | Asus VivoBook S15 S533EQ-BQ002T Intel Core i7-1165G7, NVIDIA GeForce MX350 | Lenovo IdeaPad 5 15ALC05 AMD Ryzen 5 5500U, AMD Radeon RX Vega 7 | Dell Inspiron 15 3501 Intel Core i7-1165G7, Intel Iris Xe Graphics G7 96EUs | HP Pavilion 15-eg Intel Core i7-1165G7, NVIDIA GeForce MX450 | |
|---|---|---|---|---|---|---|
| Heat | 14% | 16% | 12% | 8% | 3% | |
| Maximum Upper Side * (°C) | 48.8 | 37.8 23% | 38.1 22% | 40.5 17% | 45.6 7% | 44 10% |
| Maximum Bottom * (°C) | 42 | 48.4 -15% | 41.3 2% | 42 -0% | 41 2% | 53.4 -27% |
| Idle Upper Side * (°C) | 30 | 24 20% | 24.5 18% | 26.5 12% | 28.2 6% | 27.4 9% |
| Idle Bottom * (°C) | 35 | 25.1 28% | 26.8 23% | 29 17% | 29.1 17% | 28.8 18% |
* ... mindre är bättre
Stresstest
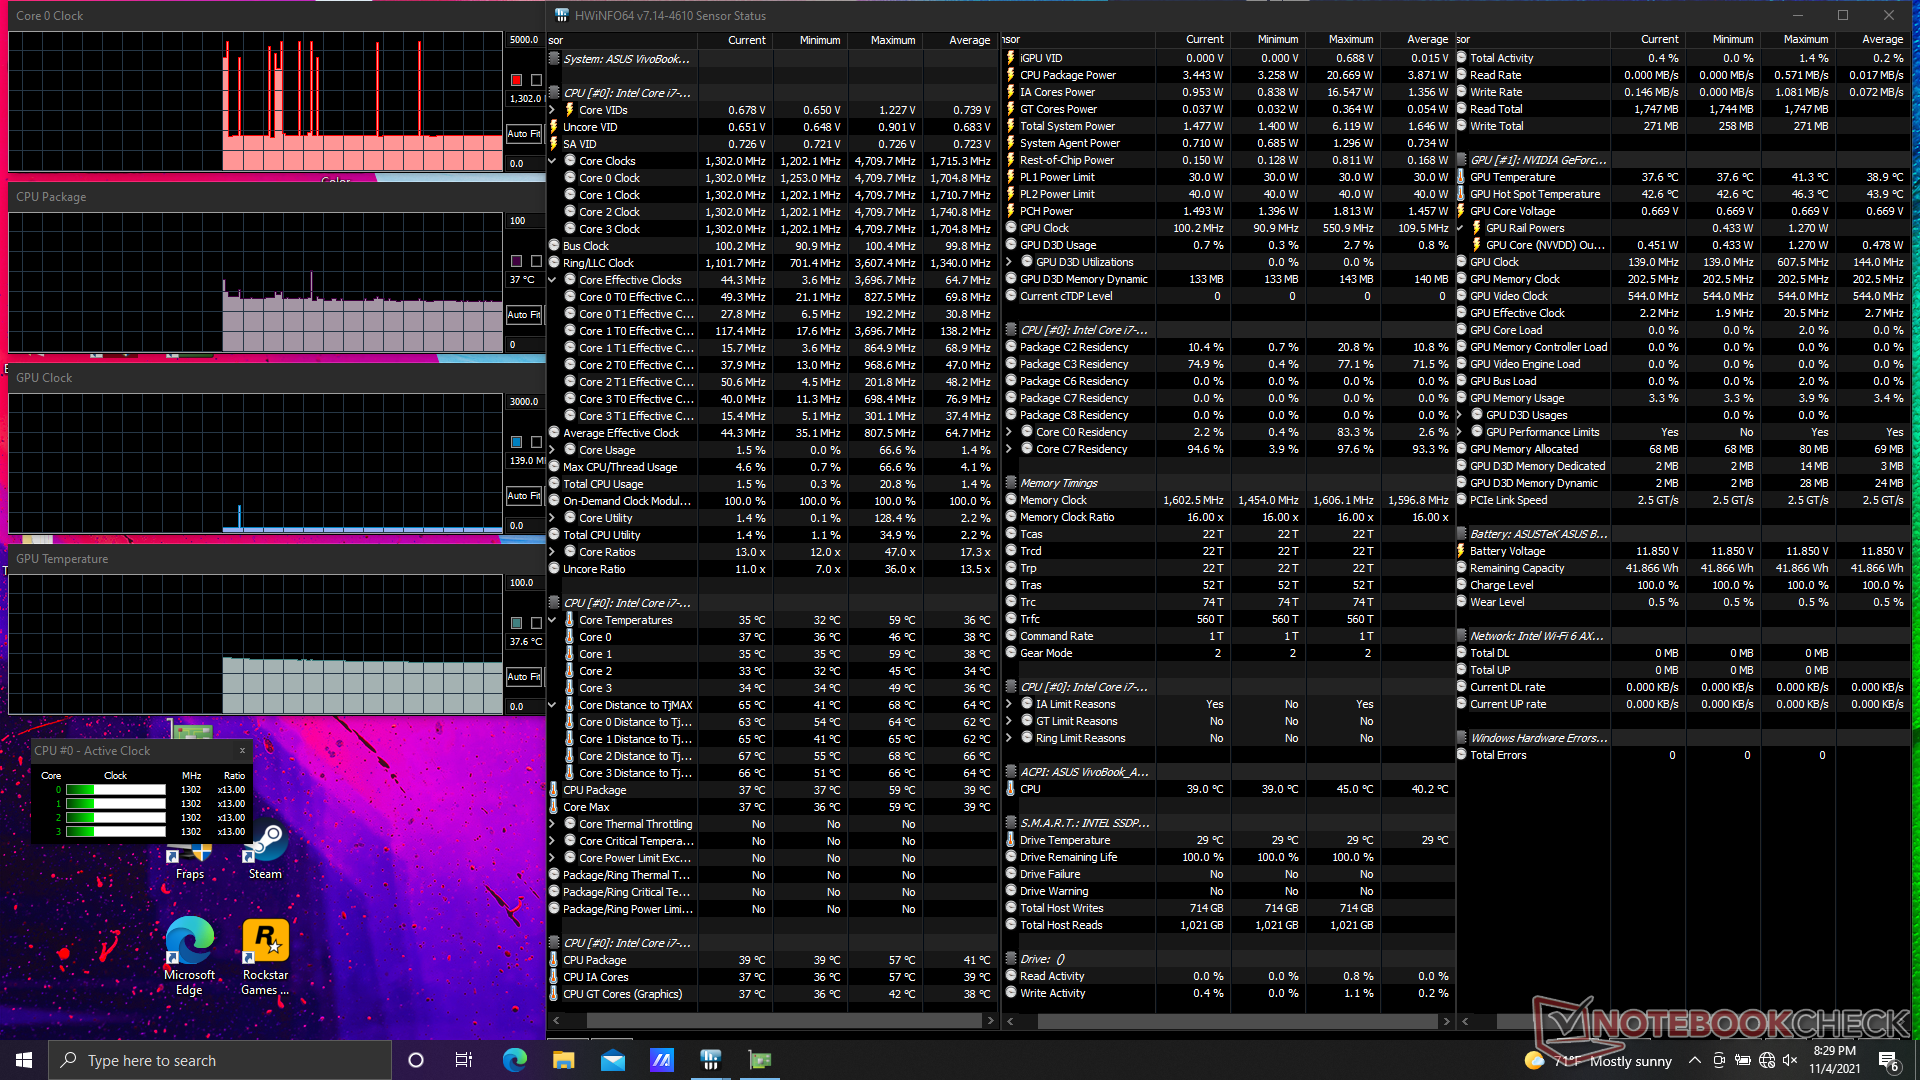
När processorn stressades under Prime95 ökade den till 4,1 GHz under de första 30 sekunderna tills den nådde en kärntemperatur på 91 C. Klockfrekvensen sjönk sedan till under 3,1 GHz för att behålla en svalare kärntemperatur på 78 C Framework bärbar datorsom använder samma Core i7-1165G7-processor skulle stabiliseras vid en något högre temperatur på 82 C när den utsattes för liknande belastningar.
Att köra i prestandaläget ger något snabbare grafikprestanda. GPU-klockfrekvensen ligger mellan 1100 och 1455 MHz när den körs Witcher 3 i balanserat läge jämfört med 1595 MHz när samma spel körs i prestandaläget. Användarna måste alltså klara av det högre fläktljudet i samband med Performance-läget om de vill utnyttja den bärbara datorn till fullo.
Att köra på batterier påverkar prestandan. Ett 3DMark 11-test på batterier skulle ge fysik- och grafikresultat på 8064 respektive 6075 poäng, jämfört med 11534 och 6293 poäng när den är på strömförsörjning.
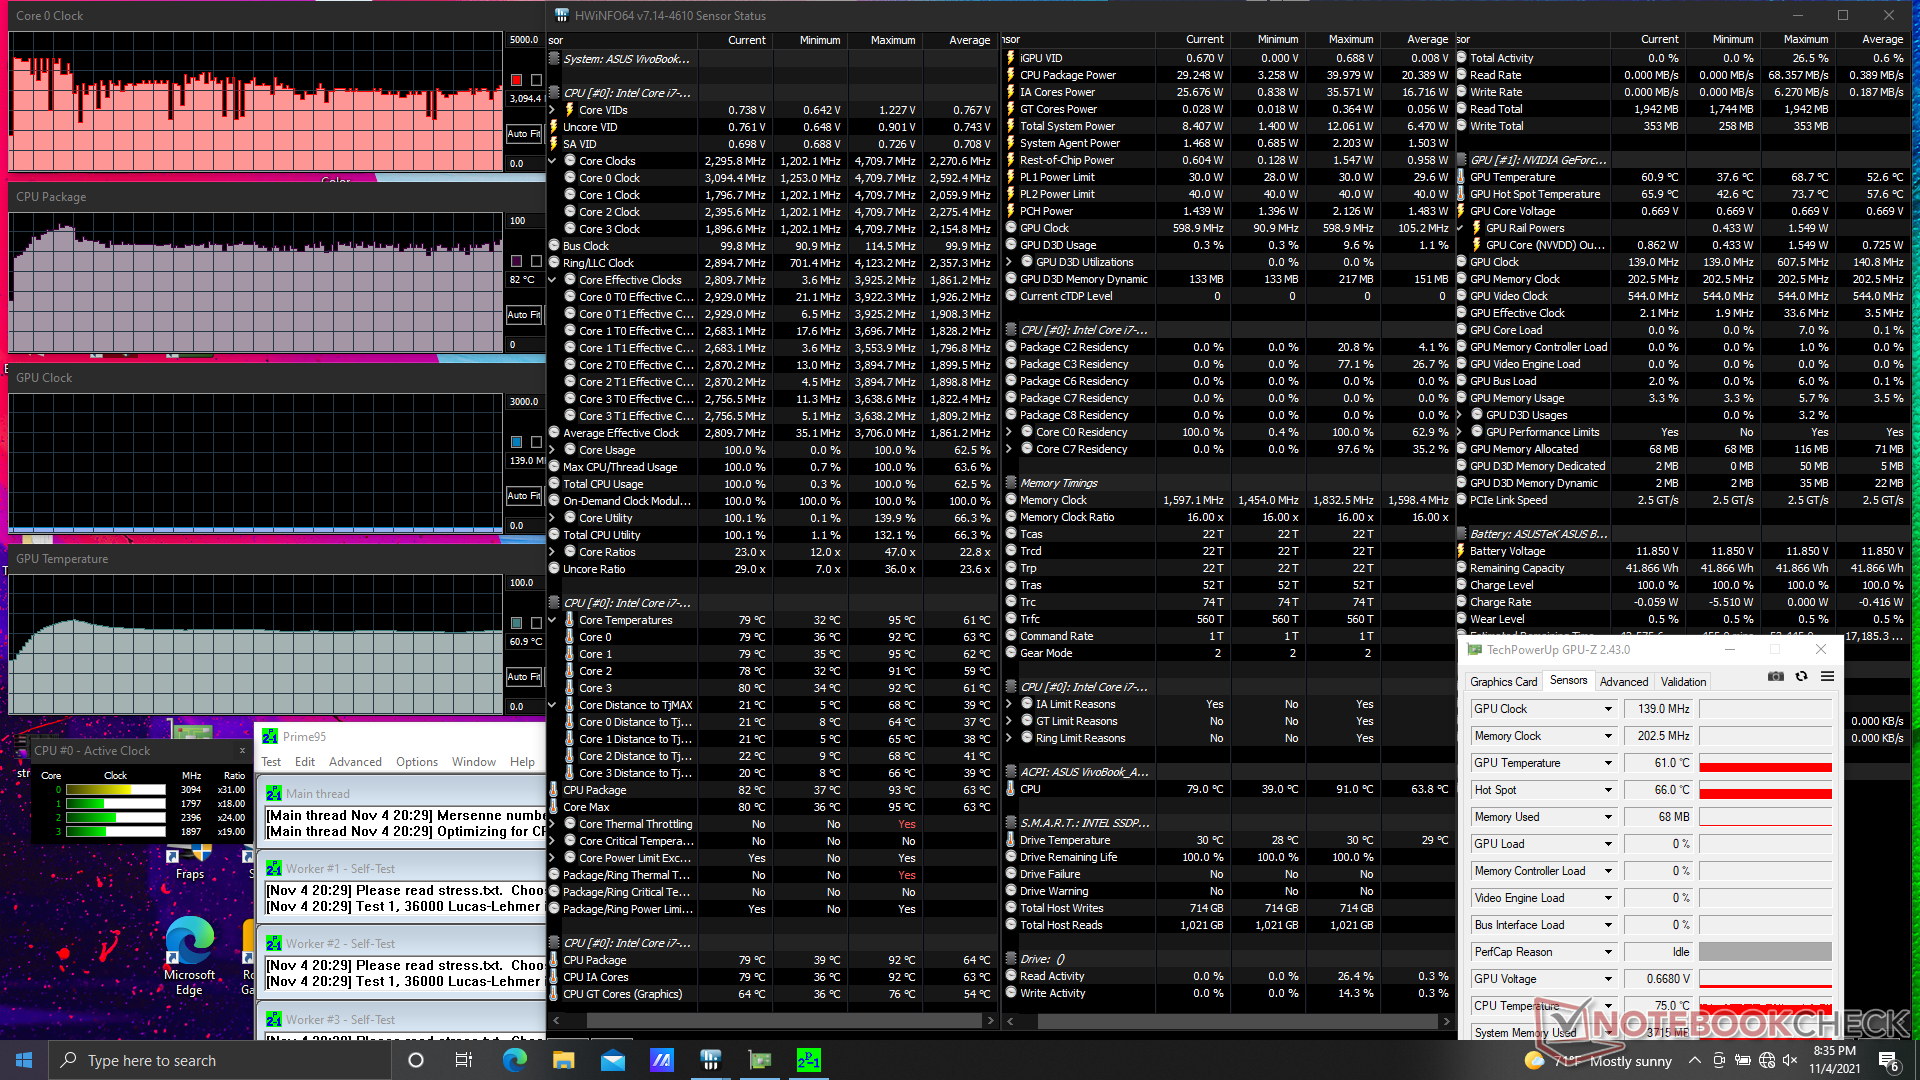
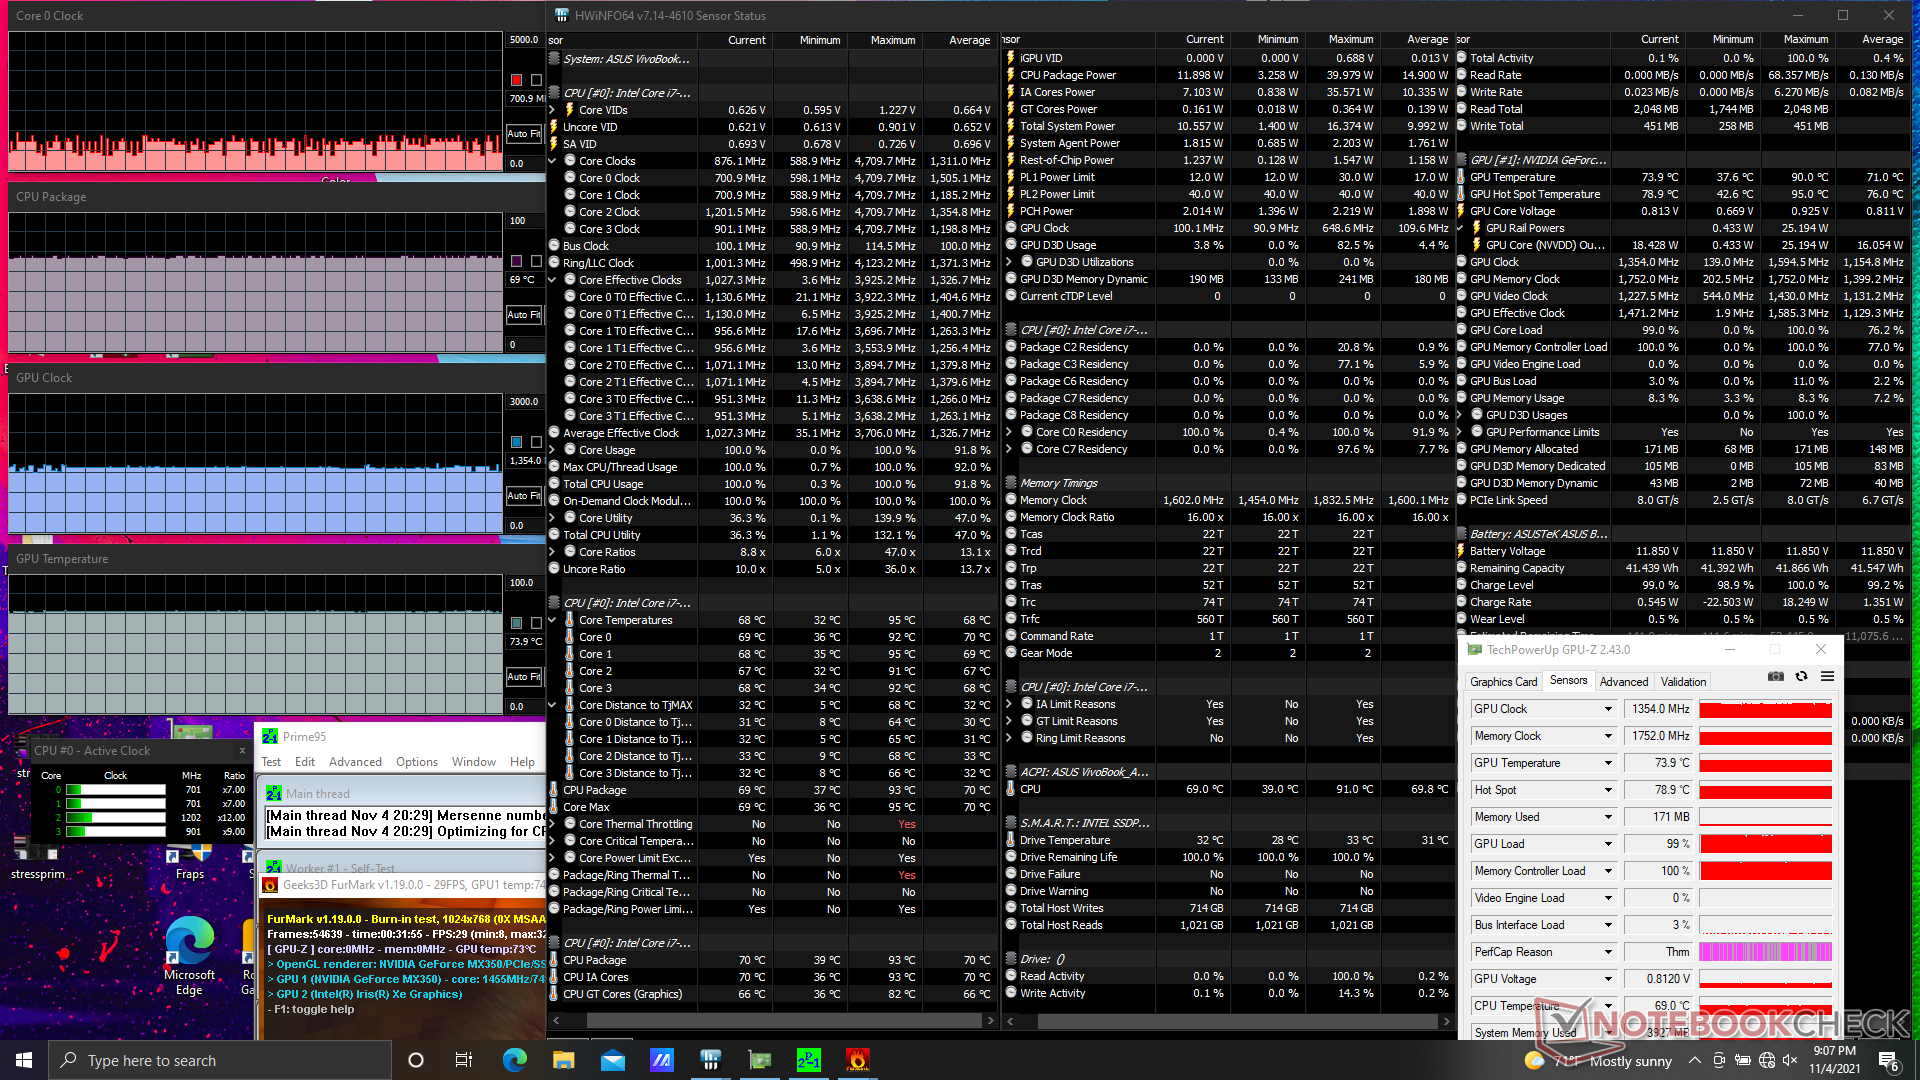
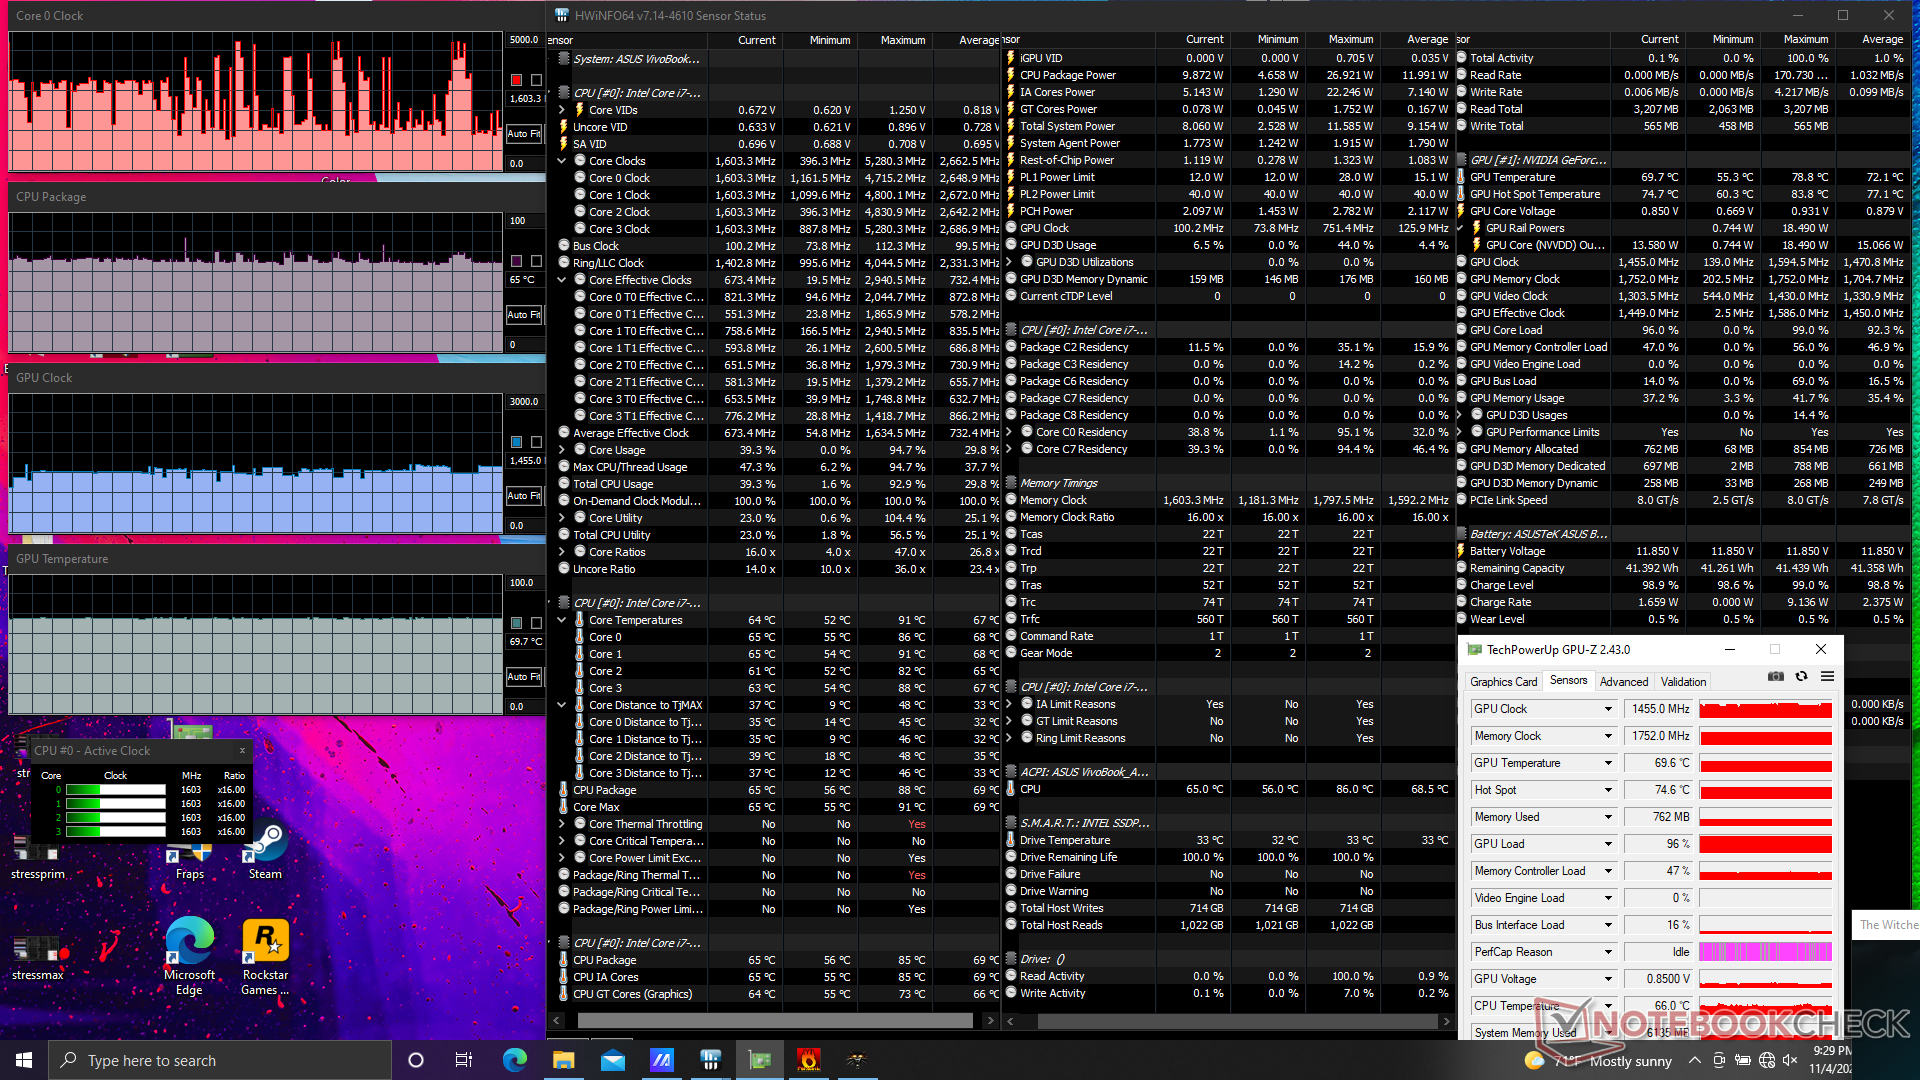
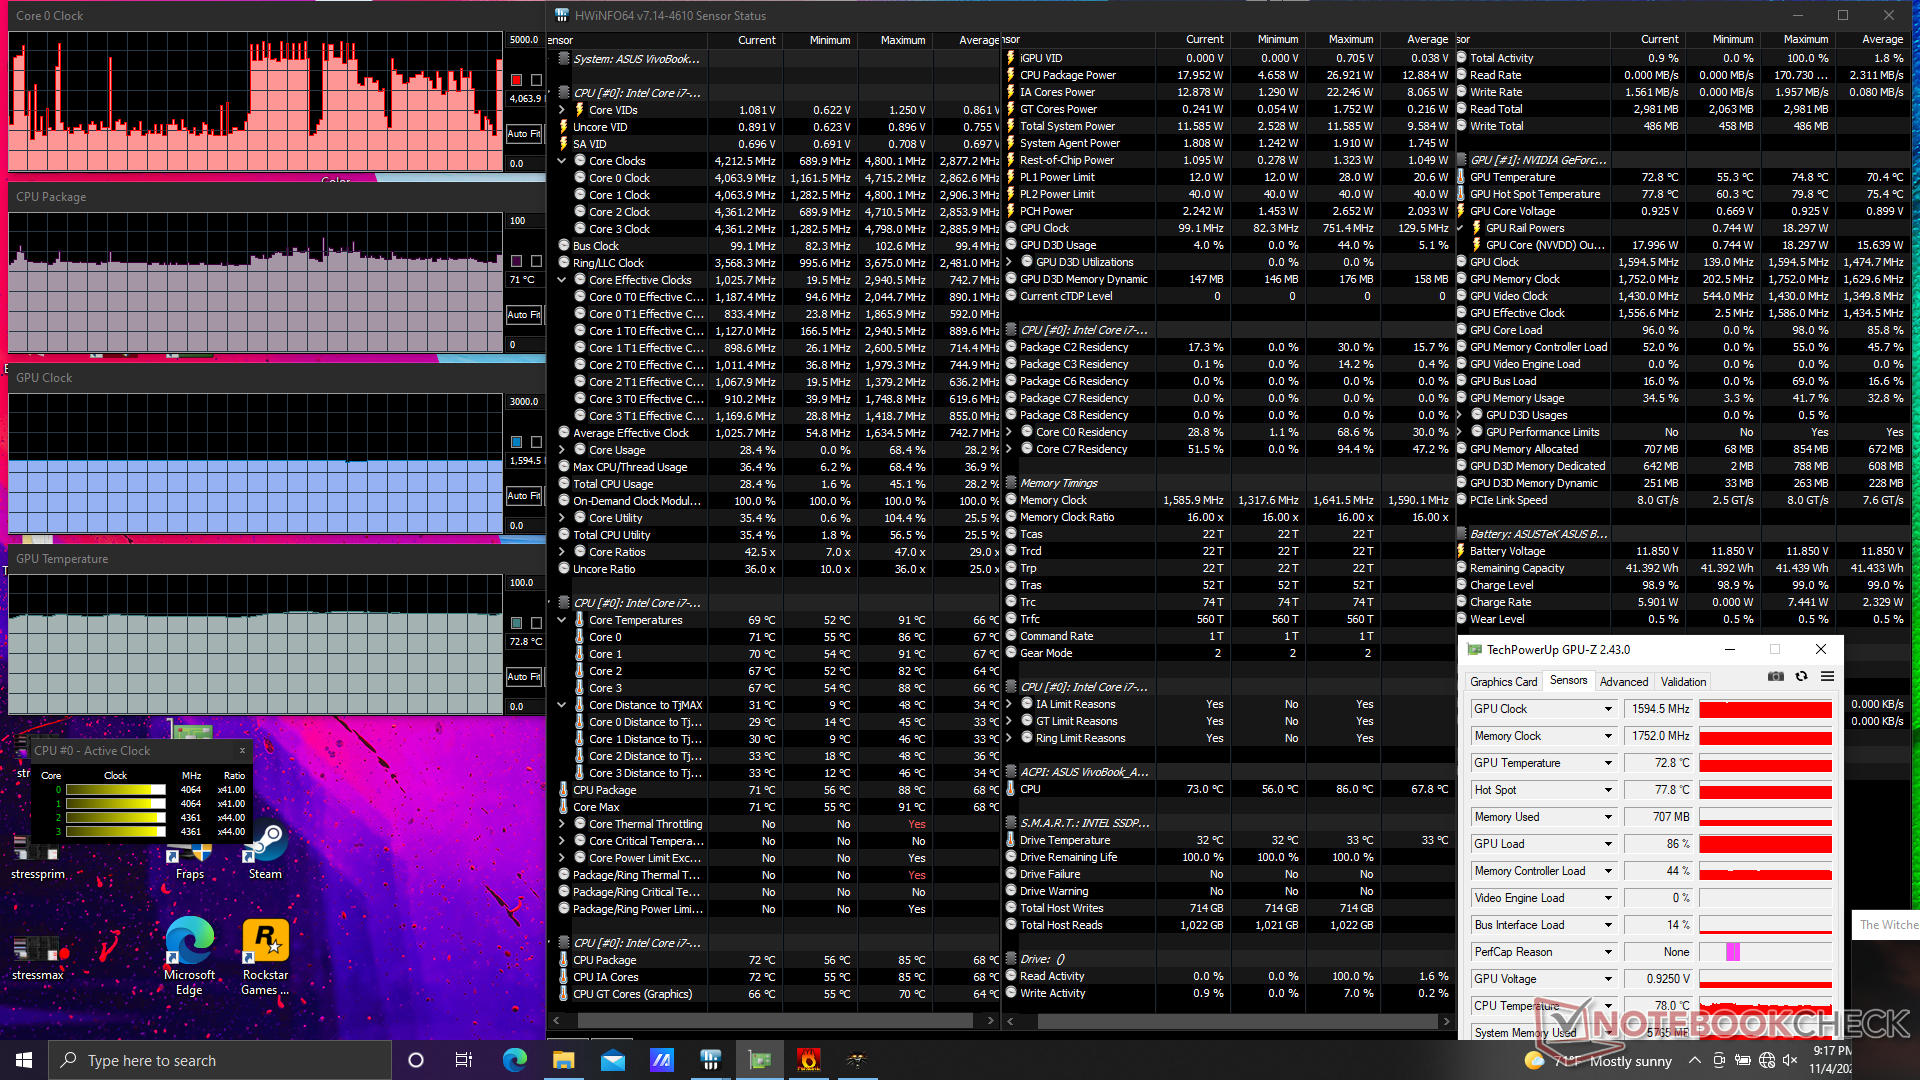
| CPU-klocka (GHz) | GPU-klocka (MHz) | GenomsnittligCPU-temperatur (°C) | GenomsnittligGPU-temperatur (°C) | |
| Systemets tomgång | -- | -- | -- | 37 |
| Prime95 Stress | 1.7 - 2.9 | ~82 | ---- | 61 |
| Prime95 + FurMark Stress | 0,7 - 1,1 | 1354 | 69 | 74 |
| Witcher 3 Stress (balanserat läge) | 0,6 - 0,8 | 1100 - 1455 | 65 | 70 |
| Witcher 3 Stress (prestationsläge) | 0,8 - 1,2 | 1595 | 71 | 73 |
Högtalare
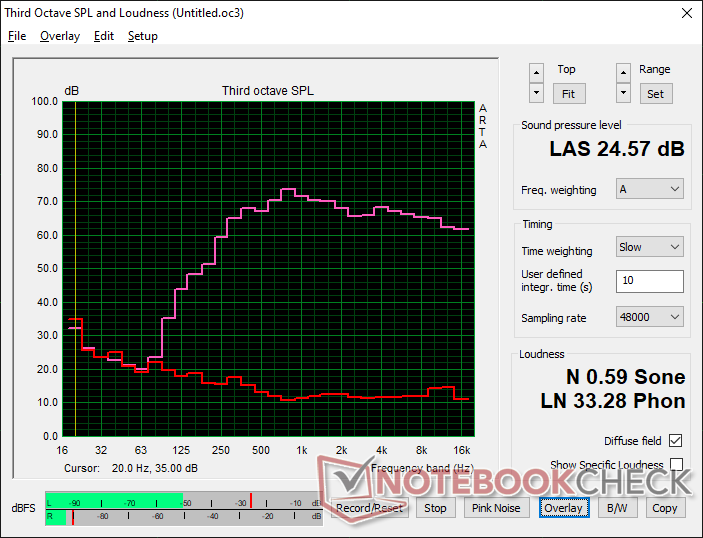
Asus Vivobook 15 K513EQ ljudanalys
(±) | högtalarljudstyrkan är genomsnittlig men bra (80.8 dB)
Bas 100 - 315 Hz
(-) | nästan ingen bas - i genomsnitt 15.3% lägre än medianen
(±) | linjäriteten för basen är genomsnittlig (13% delta till föregående frekvens)
Mellan 400 - 2000 Hz
(+) | balanserad mellan - endast 4.2% från medianen
(+) | mids är linjära (3.8% delta till föregående frekvens)
Högsta 2 - 16 kHz
(+) | balanserade toppar - endast 0.8% från medianen
(+) | toppar är linjära (2.3% delta till föregående frekvens)
Totalt 100 - 16 000 Hz
(+) | det totala ljudet är linjärt (12.5% skillnad mot median)
Jämfört med samma klass
» 24% av alla testade enheter i den här klassen var bättre, 3% liknande, 73% sämre
» Den bästa hade ett delta på 5%, genomsnittet var 17%, sämst var 45%
Jämfört med alla testade enheter
» 11% av alla testade enheter var bättre, 2% liknande, 87% sämre
» Den bästa hade ett delta på 4%, genomsnittet var 24%, sämst var 134%
Apple MacBook 12 (Early 2016) 1.1 GHz ljudanalys
(+) | högtalare kan spela relativt högt (83.6 dB)
Bas 100 - 315 Hz
(±) | reducerad bas - i genomsnitt 11.3% lägre än medianen
(±) | linjäriteten för basen är genomsnittlig (14.2% delta till föregående frekvens)
Mellan 400 - 2000 Hz
(+) | balanserad mellan - endast 2.4% från medianen
(+) | mids är linjära (5.5% delta till föregående frekvens)
Högsta 2 - 16 kHz
(+) | balanserade toppar - endast 2% från medianen
(+) | toppar är linjära (4.5% delta till föregående frekvens)
Totalt 100 - 16 000 Hz
(+) | det totala ljudet är linjärt (10.2% skillnad mot median)
Jämfört med samma klass
» 7% av alla testade enheter i den här klassen var bättre, 2% liknande, 91% sämre
» Den bästa hade ett delta på 5%, genomsnittet var 18%, sämst var 53%
Jämfört med alla testade enheter
» 5% av alla testade enheter var bättre, 1% liknande, 94% sämre
» Den bästa hade ett delta på 4%, genomsnittet var 24%, sämst var 134%
Energiförvaltning
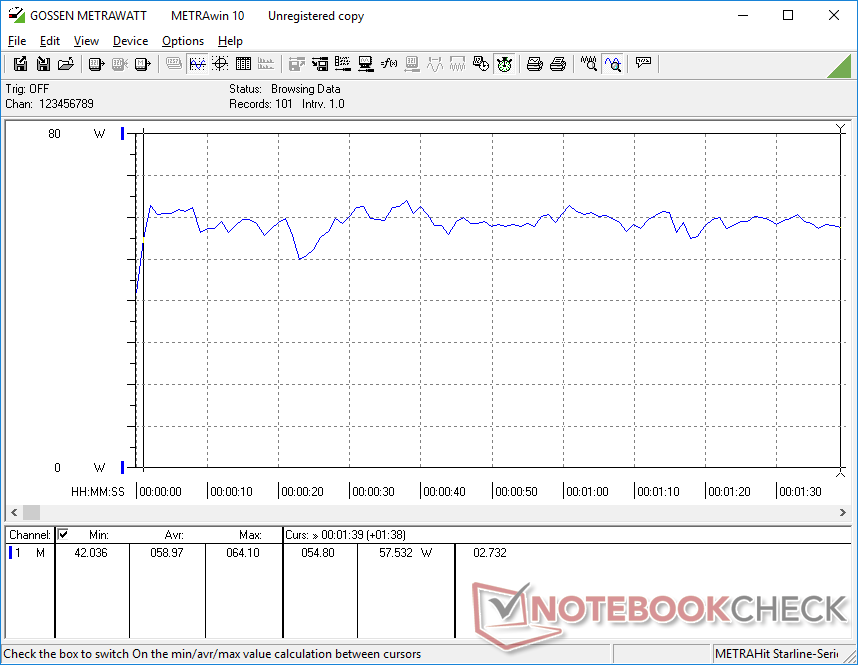
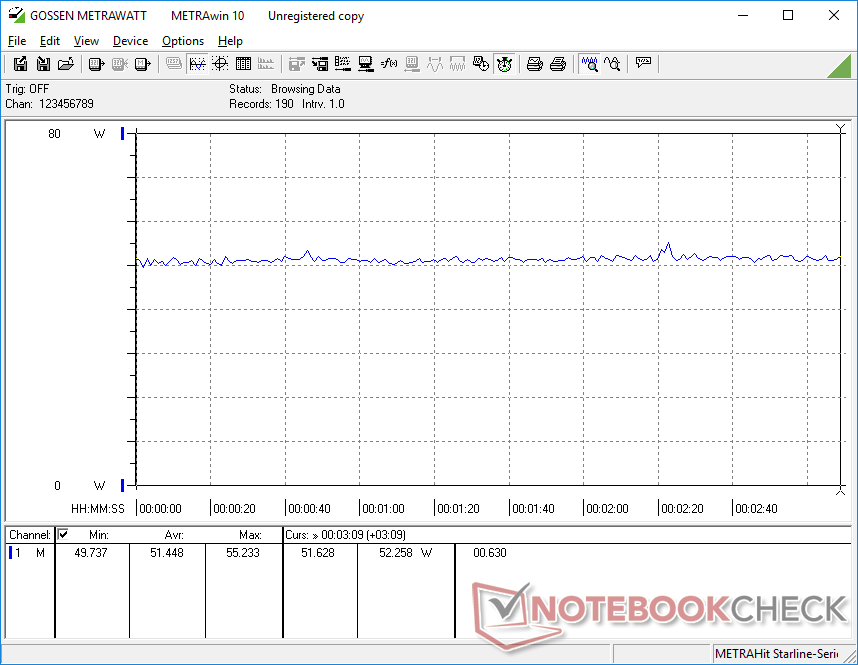
Strömförbrukning - högre krav på grund av Nvidias GPU
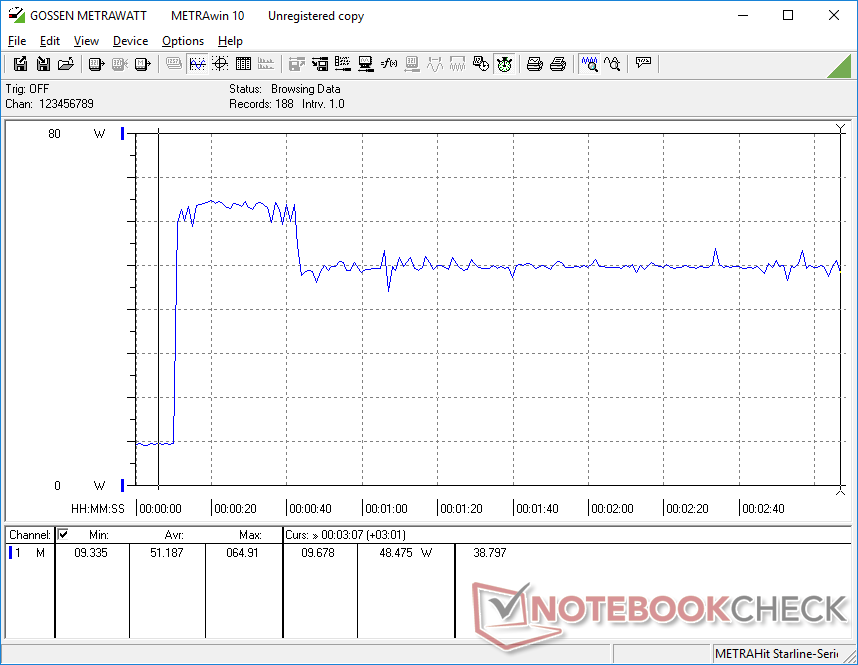
Tomgångskörning på skrivbordet förbrukar mellan 3 W och 9 W beroende på inställd ljusstyrka och strömprofil. Strömförbrukningen beror också på vilka färger som visas, eftersom vår enhet använder en OLED-panel enligt vår resultat här.
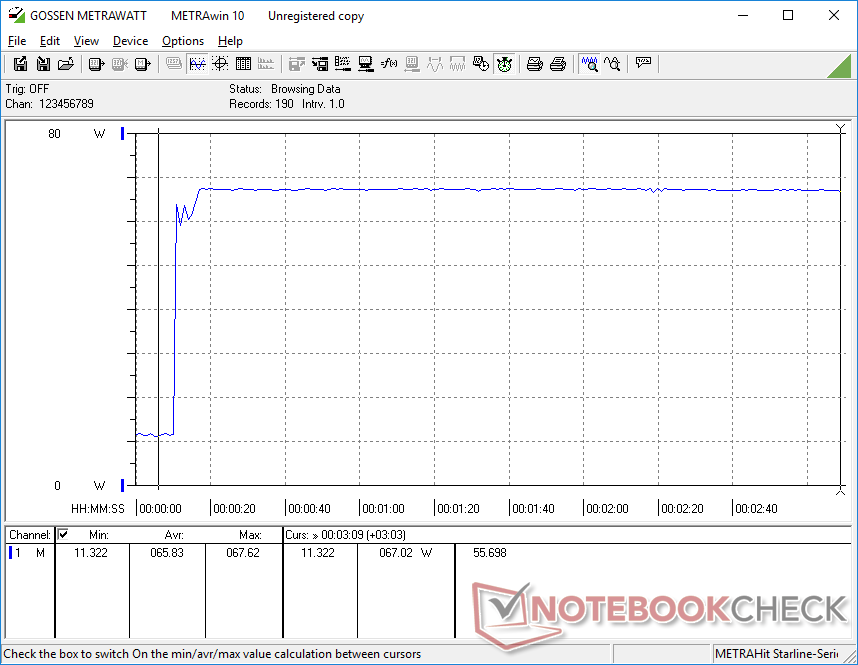
Högre belastningar som spel förbrukar mellan 51 W och 59 W jämfört med cirka 40 W vardera på den AMD-drivna Lenovo IdeaPad 5 15ALC05 eller den Iris Xe-drivnaDell Inspiron 15 3501. Den diskreta grafikkomponenten från Nvidia är den största orsaken till den anmärkningsvärda ökningen av strömförbrukningen med 48 procent jämfört med andra ultrabooks som endast drivs av integrerad grafik. Naturligtvis kommer ägarna också att dra nytta av den mer tillförlitliga och generellt snabbare prestandan hos GeForce MX350.
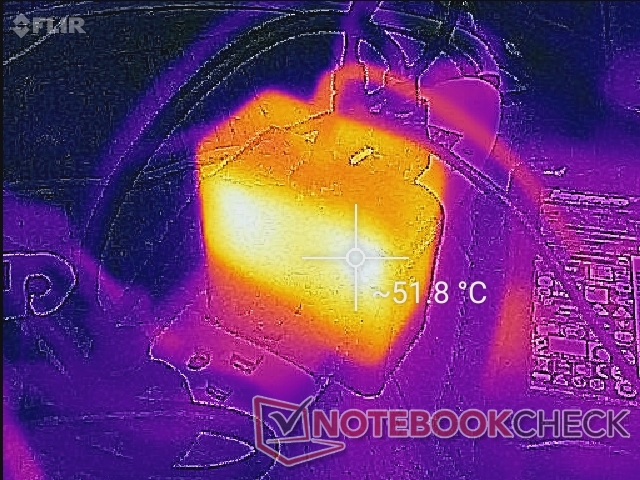
Vi kan registrera maximalt 67,6 W när vi kör extrema Prime95- och FurMark-belastningar. Den lilla adaptern (~6,4 x 6,4 x 3 cm) är endast dimensionerad för 65 W, vilket innebär att batteriladdningshastigheten kommer att sakta ner till en sakta takt om man kör så höga belastningar. Systemet hade potentiellt kunnat dra nytta av en större och mer kapabel växelströmsadapter.
| Av/Standby | |
| Låg belastning | |
| Hög belastning |
|
Förklaring:
min: | |
| Asus Vivobook 15 K513EQ i7-1165G7, GeForce MX350, Intel SSD 660p SSDPEKNW512G8, OLED, 1920x1080, 15.6" | Asus VivoBook 15 Pro M3500QC-L1062 R5 5600H, GeForce RTX 3050 4GB Laptop GPU, SK Hynix HFM512GD3JX013N, AMOLED, 1920x1080, 15.6" | Asus VivoBook S15 S533EQ-BQ002T i7-1165G7, GeForce MX350, Intel SSD 660p 1TB SSDPEKNW010T8, IPS, 1920x1080, 15.6" | Lenovo IdeaPad 5 15ALC05 R5 5500U, Vega 7, , IPS, 1920x1080, 15.6" | Dell Inspiron 15 3501 i7-1165G7, Iris Xe G7 96EUs, Samsung PM991a MZ9LQ512HBLU-00BD1, IPS, 1920x1080, 15.6" | HP Pavilion 15-eg i7-1165G7, GeForce MX450, Samsung PM991 MZVLQ1T0HALB, IPS, 1920x1080, 15.6" | |
|---|---|---|---|---|---|---|
| Power Consumption | -33% | 7% | 9% | 20% | -20% | |
| Idle Minimum * (Watt) | 3.7 | 4.7 -27% | 3 19% | 3.7 -0% | 3.6 3% | 4.9 -32% |
| Idle Average * (Watt) | 6.3 | 9.4 -49% | 6.4 -2% | 7.9 -25% | 6.4 -2% | 7.9 -25% |
| Idle Maximum * (Watt) | 9.7 | 10 -3% | 7.9 19% | 9.3 4% | 7.9 19% | 14.2 -46% |
| Load Average * (Watt) | 59 | 74.3 -26% | 59 -0% | 41 31% | 39 34% | 64.3 -9% |
| Witcher 3 ultra * (Watt) | 51.4 | 67.7 -32% | 48 7% | 41 20% | 37.6 27% | 55.6 -8% |
| Load Maximum * (Watt) | 67.7 | 106.9 -58% | 68 -0% | 52.2 23% | 41.8 38% | 65.4 3% |
* ... mindre är bättre
Power Consumption Witcher 3 / Stresstest
Batteritid - Liten kapacitet innebär kortare drifttid
Batterikapaciteten är liten med bara 41 Wh jämfört med 71 Wh på den dyrare ZenBook 15. Driftstiden är endast genomsnittlig med cirka 6 timmars verklig WLAN-användning medan den tidigare nämnda ZenBook kan nå över 12 timmar vid liknande belastning. Som budgetsystem är 6 timmar dock jämförbart med modeller som HP Pavilion 15 eller Dell Inspiron 15.
Laddning från tom till full tar knappt 90 minuter.
| Asus Vivobook 15 K513EQ i7-1165G7, GeForce MX350, 42 Wh | Asus VivoBook 15 Pro M3500QC-L1062 R5 5600H, GeForce RTX 3050 4GB Laptop GPU, 63 Wh | Asus VivoBook S15 S533EQ-BQ002T i7-1165G7, GeForce MX350, 50 Wh | Lenovo IdeaPad 5 15ALC05 R5 5500U, Vega 7, 70 Wh | Dell Inspiron 15 3501 i7-1165G7, Iris Xe G7 96EUs, 42 Wh | HP Pavilion 15-eg i7-1165G7, GeForce MX450, 41 Wh | |
|---|---|---|---|---|---|---|
| Batteridrifttid | 19% | 40% | 101% | 13% | 5% | |
| Reader / Idle (h) | 13.3 | 15 13% | ||||
| WiFi v1.3 (h) | 6 | 8.3 38% | 8.4 40% | 14 133% | 6.8 13% | 6.6 10% |
| Load (h) | 1.3 | 1.3 0% | 2.2 69% | 1.2 -8% | ||
| H.264 (h) | 12.1 | 15.4 | ||||
| Witcher 3 ultra (h) | 1.2 | 1.8 |
För
Emot
Bedömning - Prisvärd OLED
Ordet "OLED" ger vanligtvis en känsla av lyx eller högre priser. Asus ändrar allt detta genom att introducera nya 1080p OLED-paneler till sin budgetvänliga VivoBook-serie i stället för de dyrare 4K OLED-paneler som vanligtvis återfinns på bärbara datorer i den högre prisklassen. Användare kan nu äga ett system utrustat med den senaste Intel Core i7 U-serien CPU, diskret GeForce MX-grafik och en ljus OLED-skärm som kan återge DCI-P3-färger, allt för drygt 900 USD. Användare som är missnöjda med "bara" ~95 procent sRGB-täckning på de flesta Ultrabooks i mellanklassen, som t.ex Lenovo IdeaPad, MSI Modern, eller Dell Inspiron kommer att tycka att den nya OLED VivoBook är mycket attraktiv av denna anledning.
VivoBook 15 OLED sätter en ny standard för Ultrabooks i budget- och mellanklass när det gäller bildkvalitet och färgprofil. Prestandan är också utmärkt medan det mestadels plastchassiet skulle kunna behöva några uppgraderingar.
Resten av den bärbara datorn är ganska standard på gott och ont. Det är definitivt märkligt att se en så skarp och färgstark OLED-skärm på en annars billig bärbar dator med ett plastunderrede, svampig klickplatta och ett litet internt batteri. Du får lägga ner ett par hundra dollar mer på en smidigare ZenBook för att få den fulla flaggskeppsupplevelsen. När det gäller bärbara datorer i mellanklassen har VivoBook 15 K513 dock en av de bästa skärmarna du kan få i den här prisklassen.
Pris och tillgänglighet
Asus Vivobook 15 K513EQ
- 08/30/2022 v7 (old)
Allen Ngo
Price comparison

