Tester av Intel Core i7-1280P processor
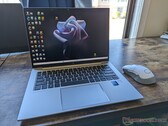
Recension av HP EliteBook 840 G9 - Ett alternativ till Lenovo ThinkPad X1 Carbon
Till skillnad från de flesta andra företagslaptops finns EliteBook 840/845 G9 med Intel vPro- och AMD PRO-alternativ för att tilltala fans på båda sidor av staketet. Efter att nyligen ha granskat AMD:s avancerade Ryzen 9 PRO 6950HS SKU kan vi nu äntligen jämföra den med det avancerade Intel Core i7-1280P-alternativet.
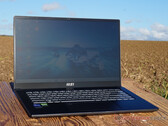
Intel Core i7-1280P, Iris Xe G7 96EUs, 14", 1.5 kgMSI Prestige 15 laptop recension: Bländande 4K-bildkvalitet, solid prestanda
MSI:s bärbara dator Creator kombinerar enastående bildvärden med en effektiv och kraftfull processor samt ett separat grafikkrets med implementerad ray tracing. Kombinationen verkar särskilt lämplig för bildredigering/bearbetning på högre nivå
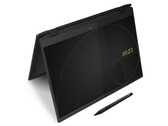
Intel Core i7-1280P, NVIDIA GeForce RTX 3050 Ti Laptop GPU, 15.6", 1.8 kgMSI Summit E16 Flip recension: bärbar 2-i-1-dator med penna, 16:10-skärm och RTX 3050 Ti
Summit E16 Flip har en 16-tums pekskärm i det mer kontorsvänliga formatet 16:10, Thunderbolt 4 och en dedikerad GeForce RTX 3050 Ti Laptop GPU. Pekskärmen kan manövreras med fingrarna eller med den medföljande MSI-inmatningspennan.
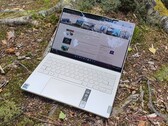
Intel Core i7-1280P, NVIDIA GeForce RTX 3050 Ti Laptop GPU, 16", 1.9 kgRecension av Lenovo Yoga Slim 9i: Den snabbaste Evo-laptopen
Intels Core i7-1280P gör Lenovo Yoga Slim 9i till vad som förmodligen är den för tillfället snabbaste ultrabook-modellen. Tack vare en 3K 90 Hz OLED-skärm, låga utsläpp och fyrdubbla högtalare av hög kvalitet får du en robust och snygg bärbar dator.
Intel Core i7-1280P, Iris Xe G7 96EUs, 14", 1.4 kgRecension av Lenovo ThinkPad X1 Nano Gen 2: Den minsta bärbara X1-datorn någonsin
450 nits, fullständiga sRGB-färger, 16:10-bildförhållande, 5G Sub 6 WAN och 12:e generationens Core P-processor, allt i ett system som väger mindre än 1 kg. Kan man verkligen få plats med alla dessa funktioner i en liten 13-tums formfaktor utan att göra avkall på detaljerna?
Intel Core i7-1280P, Iris Xe G7 96EUs, 13", 958 gDell XPS 13 Plus 9320 i7-1280P OLED: Intel Iris Xe Graphics G7 96EUs, 13.40", 1.3 kg
Test » Recension av alla tre varianter av Dell XPS 13 Plus 9320 - Core i5-1240P, i7-1260P eller i7-1280P OLED?
Getac B360 G2: Intel Iris Xe Graphics G7 96EUs, 13.30", 2.3 kg
Externt test » Getac B360 G2
MSI Prestige 13 Evo A12M: Intel Iris Xe Graphics G7 96EUs, 13.30", 1 kg
Externt test » MSI Prestige 13 Evo A12M
Lenovo ThinkPad P16s G1, i7-1280P: NVIDIA T550 Laptop GPU, 16.00", 1.7 kg
Externt test » Lenovo ThinkPad P16s G1, i7-1280P
HP EliteBook 840 G9: Intel Iris Xe Graphics G7 96EUs, 14.00", 1.5 kg
Externt test » HP EliteBook 840 G9
MSI Summit E13 Flip Evo A12MT-059RU: Intel Iris Xe Graphics G7 96EUs, 13.40", 1.4 kg
Externt test » MSI Summit E13 Flip Evo A12MT-059RU
MSI Prestige 14 Evo A12M-248RU: Intel Iris Xe Graphics G7 96EUs, 14.00", 1.3 kg
Externt test » MSI Prestige 14 Evo A12M-248RU
Lenovo Yoga 9 14IAP7-82LU007FGE: Intel Iris Xe Graphics G7 96EUs, 14.00", 1.4 kg
Externt test » Lenovo Yoga 9 14IAP7-82LU007FGE
Lenovo ThinkPad X1 Nano Gen 2 Core i7-1280P: Intel Iris Xe Graphics G7 96EUs, 13.00", 1 kg
Externt test » Lenovo ThinkPad X1 Nano Gen 2 Core i7-1280P
MSI Summit E16 Flip Evo A12MT: Intel Iris Xe Graphics G7 96EUs, 16.00", 1.9 kg
Externt test » MSI Summit E16 Flip Evo A12MT
Lenovo Yoga Slim 9 14IAP7: Intel Iris Xe Graphics G7 96EUs, 14.00", 1.4 kg
Externt test » Lenovo Yoga Slim 9 14IAP7
MSI Summit E13 Flip Evo A12MT-023: Intel Iris Xe Graphics G7 96EUs, 13.40", 1.4 kg
Externt test » MSI Summit E13 Flip Evo A12MT-023
MSI Prestige 14 A12SC-086CA: NVIDIA GeForce GTX 1650 Mobile, 14.00", 1.6 kg
Externt test » MSI Prestige 14 A12SC-086CA
MSI Stealth 17M A12UE: NVIDIA GeForce RTX 3060 Laptop GPU, 17.30", 2.2 kg
Externt test » MSI Stealth 17M A12UE
MSI Prestige 14 Evo A12M-089: Intel Iris Xe Graphics G7 96EUs, 14.00", 1.3 kg
Externt test » MSI Prestige 14 Evo A12M-089
MSI Summit E16 Flip A12UDT-031: NVIDIA GeForce RTX 3050 Ti Laptop GPU, 16.00", 1.9 kg
Externt test » MSI Summit E16 Flip A12UDT-031
MSI Prestige 15 A12UD-049ES: NVIDIA GeForce RTX 3050 Ti Laptop GPU, 15.60", 1.7 kg
Externt test » MSI Prestige 15 A12UD-049ES
Dell XPS 13 Plus 9320 i7-1280P FHD: Intel Iris Xe Graphics G7 96EUs, 13.40", 1.3 kg
Externt test » Dell XPS 13 Plus 9320 i7-1280P FHD
Dell XPS 13 Plus 9320 i7-1280P OLED: Intel Iris Xe Graphics G7 96EUs, 13.40", 1.3 kg
Externt test » Dell XPS 13 Plus 9320 i7-1280P OLED
MSI Prestige 14 A12UC, i7-1280P: NVIDIA GeForce RTX 3050 4GB Laptop GPU, 14.00", 1.3 kg
Externt test » MSI Prestige 14 A12UC, i7-1280P
MSI Stealth 15M B12UE: NVIDIA GeForce RTX 3060 Laptop GPU, 15.60", 1.9 kg
Externt test » MSI Stealth 15M B12UE
MSI Prestige 15 A12UC: NVIDIA GeForce RTX 3050 4GB Laptop GPU, 15.60", 1.7 kg
Externt test » MSI Prestige 15 A12UC
MSI Prestige 15 A12UD-093: NVIDIA GeForce RTX 3050 Ti Laptop GPU, 15.60", 1.8 kg
Externt test » MSI Prestige 15 A12UD-093
MSI Summit E14 Evo A12M-050: Intel Iris Xe Graphics G7 96EUs, 14.00", 1.6 kg
Externt test » MSI Summit E14 Evo A12M-050