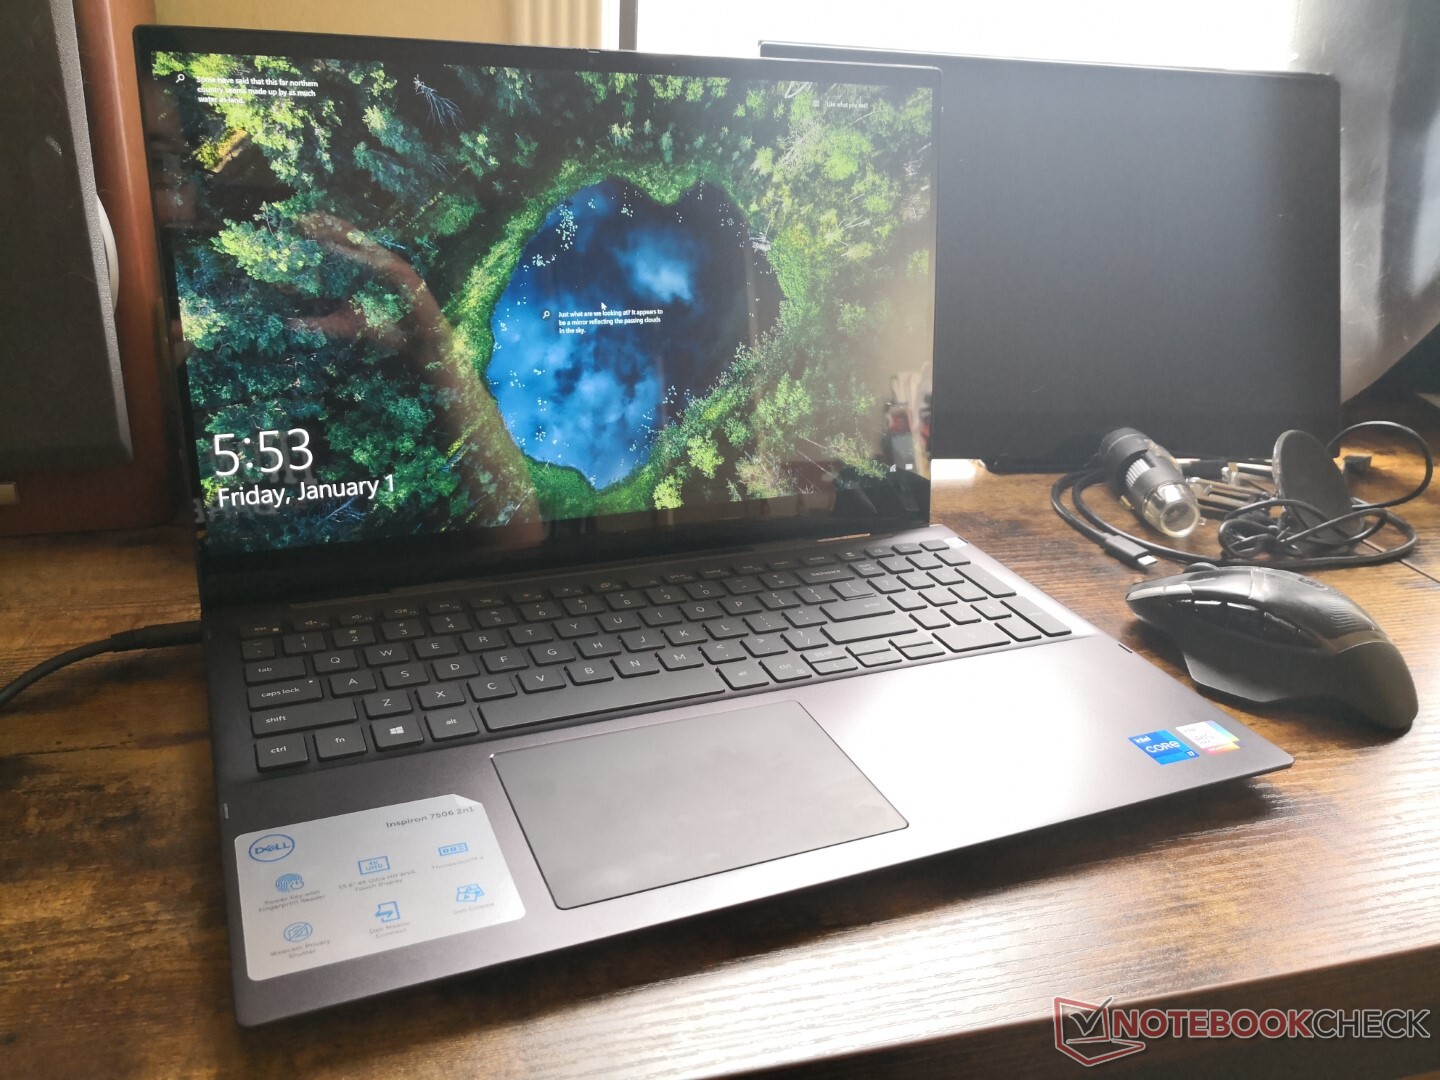
Test: Dell Inspiron 15 7000 7506 2-in-1 Black Edition vs. Silver Edition - Vad är skillnaden? (Sammanfattning)
Testgrupp
Gradering | Datum | Modell | Vikt | Höjd | Storlek | Upplösning | Pris |
|---|---|---|---|---|---|---|---|
| 82.4 % v7 (old) | 01/2021 | Dell Inspiron 15 7000 7506 2-in-1 Black Edition i7-1165G7, Xe MAX | 1.9 kg | 17.94 mm | 15.60" | 3840x2160 | |
| 87.3 % v7 (old) | Samsung Galaxy Book Flex 15-NP950 i7-1065G7, GeForce MX250 | 1.6 kg | 14.9 mm | 15.60" | 1920x1080 | ||
| 82.8 % v7 (old) | 09/2020 | HP Envy x360 15-ee0257ng R5 4500U, Vega 6 | 2 kg | 18.9 mm | 15.60" | 1920x1080 | |
| 88.3 % v7 (old) | 06/2020 | Microsoft Surface Book 3 15 i7-1065G7, GeForce GTX 1660 Ti Max-Q | 1.9 kg | 23 mm | 15.00" | 3240x2160 | |
| 86.5 % v7 (old) | 03/2020 | Asus ZenBook Flip 15 UX563FD-A1027T i7-10510U, GeForce GTX 1050 Max-Q | 1.9 kg | 19.9 mm | 15.60" | 3840x2160 | |
| 84.8 % v7 (old) | 04/2020 | Lenovo Yoga C740-15IML i7-10510U, UHD Graphics 620 | 1.9 kg | 17.25 mm | 15.60" | 1920x1080 | |
| 81.2 % v7 (old) | 12/2020 | Dell Inspiron 15 7506 2-in-1 P97F i5-1135G7, Iris Xe G7 80EUs | 1.8 kg | 17.94 mm | 15.60" | 1920x1080 |
| SD Card Reader | |
| average JPG Copy Test (av. of 3 runs) | |
| Microsoft Surface Book 3 15 (Toshiba Exceria Pro M501 microSDXC 64GB) | |
| Samsung Galaxy Book Flex 15-NP950 (Toshiba Exceria Pro M501 microSDXC 64GB) | |
| HP Envy x360 15-ee0257ng (Toshiba Exceria Pro SDXC 64 GB UHS-II) | |
| Asus ZenBook Flip 15 UX563FD-A1027T (Toshiba Exceria Pro SDXC 64 GB UHS-II) | |
| Dell Inspiron 15 7506 2-in-1 P97F (Toshiba Exceria Pro SDXC 64 GB UHS-II) | |
| Dell Inspiron 15 7000 7506 2-in-1 Black Edition (Toshiba Exceria Pro M501 microSDXC 32GB) | |
| maximum AS SSD Seq Read Test (1GB) | |
| Microsoft Surface Book 3 15 (Toshiba Exceria Pro M501 microSDXC 64GB) | |
| Samsung Galaxy Book Flex 15-NP950 (Toshiba Exceria Pro M501 microSDXC 64GB) | |
| HP Envy x360 15-ee0257ng (Toshiba Exceria Pro SDXC 64 GB UHS-II) | |
| Dell Inspiron 15 7506 2-in-1 P97F (Toshiba Exceria Pro SDXC 64 GB UHS-II) | |
| Dell Inspiron 15 7000 7506 2-in-1 Black Edition (Toshiba Exceria Pro M501 microSDXC 32GB) | |
| Networking | |
| iperf3 transmit AX12 | |
| Lenovo Yoga C740-15IML | |
| Samsung Galaxy Book Flex 15-NP950 | |
| Dell Inspiron 15 7506 2-in-1 P97F | |
| Dell Inspiron 15 7000 7506 2-in-1 Black Edition | |
| Microsoft Surface Book 3 15 | |
| Asus ZenBook Flip 15 UX563FD-A1027T | |
| HP Envy x360 15-ee0257ng | |
| iperf3 receive AX12 | |
| Lenovo Yoga C740-15IML | |
| Dell Inspiron 15 7506 2-in-1 P97F | |
| Samsung Galaxy Book Flex 15-NP950 | |
| Microsoft Surface Book 3 15 | |
| Asus ZenBook Flip 15 UX563FD-A1027T | |
| Dell Inspiron 15 7000 7506 2-in-1 Black Edition | |
| HP Envy x360 15-ee0257ng | |


| |||||||||||||||||||||||||
Distribution av ljusstyrkan: 93 %
Mitt på batteriet: 303.8 cd/m²
Kontrast: 1266:1 (Svärta: 0.24 cd/m²)
ΔE ColorChecker Calman: 4.58 | ∀{0.5-29.43 Ø4.73}
calibrated: 2.17
ΔE Greyscale Calman: 6.4 | ∀{0.09-98 Ø4.97}
99% sRGB (Argyll 1.6.3 3D)
66.7% AdobeRGB 1998 (Argyll 1.6.3 3D)
74.6% AdobeRGB 1998 (Argyll 3D)
99% sRGB (Argyll 3D)
74.3% Display P3 (Argyll 3D)
Gamma: 2.3
CCT: 7414 K
| Dell Inspiron 15 7000 7506 2-in-1 Black Edition AU Optronics B156ZAN, IPS, 15.6", 3840x2160 | HP Envy x360 15-ee0257ng BOE NV156FHM-N4T, IPS, 15.6", 1920x1080 | Microsoft Surface Book 3 15 LG Philips LGD0554, IPS, 15", 3240x2160 | Asus ZenBook Flip 15 UX563FD-A1027T BOE HF NE156QUM-N64, IPS, 15.6", 3840x2160 | Lenovo Yoga C740-15IML B156HAN02.5, IPS LED, 15.6", 1920x1080 | Dell Inspiron 15 7000 7577 4K Name: AU Optronics B156ZAN, IPS, 15.6", 3840x2160 | |
|---|---|---|---|---|---|---|
| Display | -43% | -13% | -7% | -45% | -6% | |
| Display P3 Coverage (%) | 74.3 | 40.43 -46% | 61.5 -17% | 66.2 -11% | 39.04 -47% | 68.4 -8% |
| sRGB Coverage (%) | 99 | 59.6 -40% | 92.7 -6% | 97.2 -2% | 57.9 -42% | 97.1 -2% |
| AdobeRGB 1998 Coverage (%) | 74.6 | 41.77 -44% | 63.6 -15% | 68.3 -8% | 40.33 -46% | 69.6 -7% |
| Response Times | 38% | 29% | -6% | 7% | 26% | |
| Response Time Grey 50% / Grey 80% * (ms) | 55.2 ? | 34 ? 38% | 38 ? 31% | 60 ? -9% | 50.8 ? 8% | 35.2 ? 36% |
| Response Time Black / White * (ms) | 34 ? | 21 ? 38% | 25 ? 26% | 35 ? -3% | 32.4 ? 5% | 28.4 ? 16% |
| PWM Frequency (Hz) | 250 ? | |||||
| Screen | -34% | 24% | 17% | -38% | -5% | |
| Brightness middle (cd/m²) | 303.8 | 314 3% | 428 41% | 351 16% | 286 -6% | 322.9 6% |
| Brightness (cd/m²) | 296 | 280 -5% | 413 40% | 335 13% | 268 -9% | 309 4% |
| Brightness Distribution (%) | 93 | 72 -23% | 89 -4% | 87 -6% | 83 -11% | 90 -3% |
| Black Level * (cd/m²) | 0.24 | 0.275 -15% | 0.23 4% | 0.31 -29% | 0.2 17% | 0.36 -50% |
| Contrast (:1) | 1266 | 1142 -10% | 1861 47% | 1132 -11% | 1430 13% | 897 -29% |
| Colorchecker dE 2000 * | 4.58 | 5.94 -30% | 2.65 42% | 1.74 62% | 7.3 -59% | 3.99 13% |
| Colorchecker dE 2000 max. * | 9.4 | 21.71 -131% | 8.12 14% | 2.76 71% | 21.7 -131% | 8.97 5% |
| Colorchecker dE 2000 calibrated * | 2.17 | 5.15 -137% | 0.92 58% | 5.1 -135% | ||
| Greyscale dE 2000 * | 6.4 | 2.97 54% | 3.99 38% | 2.22 65% | 7 -9% | 5.3 17% |
| Gamma | 2.3 96% | 2.4 92% | 3.12 71% | 2.35 94% | 2.35 94% | 2.041 108% |
| CCT | 7414 88% | 6581 99% | 6309 103% | 6667 97% | 5847 111% | 6941 94% |
| Color Space (Percent of AdobeRGB 1998) (%) | 66.7 | 38.1 -43% | 58 -13% | 62 -7% | 36.9 -45% | 62.9 -6% |
| Color Space (Percent of sRGB) (%) | 99 | 59.1 -40% | 93 -6% | 97 -2% | 57.5 -42% | 96.8 -2% |
| Totalt genomsnitt (program/inställningar) | -13% /
-27% | 13% /
18% | 1% /
9% | -25% /
-34% | 5% /
-1% |
* ... mindre är bättre
Visa svarstider
| ↔ Svarstid svart till vitt | ||
|---|---|---|
| 34 ms ... stiga ↗ och falla ↘ kombinerat | ↗ 19.2 ms stiga | 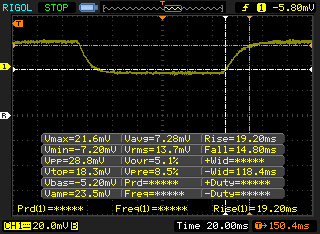 |
| ↘ 14.8 ms hösten | ||
| Skärmen visar långsamma svarsfrekvenser i våra tester och kommer att vara otillfredsställande för spelare. I jämförelse sträcker sig alla testade enheter från 0.1 (minst) till 240 (maximalt) ms. » 91 % av alla enheter är bättre. Detta innebär att den uppmätta svarstiden är sämre än genomsnittet av alla testade enheter (19.9 ms). | ||
| ↔ Svarstid 50 % grått till 80 % grått | ||
| 55.2 ms ... stiga ↗ och falla ↘ kombinerat | ↗ 26.8 ms stiga | 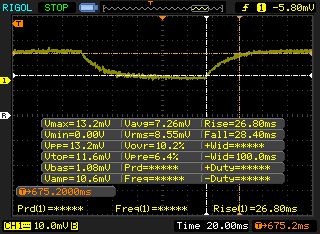 |
| ↘ 28.4 ms hösten | ||
| Skärmen visar långsamma svarsfrekvenser i våra tester och kommer att vara otillfredsställande för spelare. I jämförelse sträcker sig alla testade enheter från 0.165 (minst) till 636 (maximalt) ms. » 92 % av alla enheter är bättre. Detta innebär att den uppmätta svarstiden är sämre än genomsnittet av alla testade enheter (31.1 ms). | ||
Skärmflimmer / PWM (Puls-Width Modulation)
| Skärmflimmer / PWM upptäcktes inte |  | ||
Som jämförelse: 52 % av alla testade enheter använder inte PWM för att dämpa skärmen. Om PWM upptäcktes mättes ett medelvärde av 7794 (minst: 5 - maximum: 343500) Hz. | |||
Cinebench R15: CPU Multi 64Bit | CPU Single 64Bit
Blender: v2.79 BMW27 CPU
7-Zip 18.03: 7z b 4 -mmt1 | 7z b 4
Geekbench 5.5: Single-Core | Multi-Core
HWBOT x265 Benchmark v2.2: 4k Preset
LibreOffice : 20 Documents To PDF
R Benchmark 2.5: Overall mean
| Cinebench R20 / CPU (Multi Core) | |
| Lenovo ThinkPad E15 Gen2-20T9S00K00 | |
| MSI Prestige 15 A10SC | |
| Dell Inspiron 15 7506 2-in-1 P97F | |
| HP Envy x360 15-ee0257ng | |
| Genomsnitt Intel Core i7-1165G7 (1060 - 2657, n=81) | |
| Dell Inspiron 15 7000 7506 2-in-1 Black Edition | |
| Asus ZenBook Flip 15 UX563FD-A1027T | |
| Microsoft Surface Book 3 15 | |
| HP Pavilion x360 15-dq0065cl | |
| Durabook S15ABG2 | |
| Dell Inspiron 15 5000 5502 | |
| Asus Vivobook 15 F512DA-SH31 | |
| Cinebench R20 / CPU (Single Core) | |
| Genomsnitt Intel Core i7-1165G7 (442 - 589, n=81) | |
| Dell Inspiron 15 7506 2-in-1 P97F | |
| Dell Inspiron 15 7000 7506 2-in-1 Black Edition | |
| Dell Inspiron 15 5000 5502 | |
| Asus ZenBook Flip 15 UX563FD-A1027T | |
| Lenovo ThinkPad E15 Gen2-20T9S00K00 | |
| MSI Prestige 15 A10SC | |
| Microsoft Surface Book 3 15 | |
| HP Envy x360 15-ee0257ng | |
| HP Pavilion x360 15-dq0065cl | |
| Durabook S15ABG2 | |
| Asus Vivobook 15 F512DA-SH31 | |
| Cinebench R15 / CPU Multi 64Bit | |
| Lenovo ThinkPad E15 Gen2-20T9S00K00 | |
| MSI Prestige 15 A10SC | |
| HP Envy x360 15-ee0257ng | |
| Genomsnitt Intel Core i7-1165G7 (553 - 1027, n=86) | |
| Asus ZenBook Flip 15 UX563FD-A1027T | |
| Dell Inspiron 15 7506 2-in-1 P97F | |
| Dell Inspiron 15 7000 7506 2-in-1 Black Edition | |
| Microsoft Surface Book 3 15 | |
| HP Pavilion x360 15-dq0065cl | |
| Durabook S15ABG2 | |
| Dell Inspiron 15 5000 5502 | |
| Asus Vivobook 15 F512DA-SH31 | |
| Cinebench R15 / CPU Single 64Bit | |
| Genomsnitt Intel Core i7-1165G7 (115 - 230, n=78) | |
| Dell Inspiron 15 7000 7506 2-in-1 Black Edition | |
| Dell Inspiron 15 7506 2-in-1 P97F | |
| Asus ZenBook Flip 15 UX563FD-A1027T | |
| Dell Inspiron 15 5000 5502 | |
| MSI Prestige 15 A10SC | |
| Lenovo ThinkPad E15 Gen2-20T9S00K00 | |
| Microsoft Surface Book 3 15 | |
| HP Envy x360 15-ee0257ng | |
| HP Pavilion x360 15-dq0065cl | |
| Durabook S15ABG2 | |
| Asus Vivobook 15 F512DA-SH31 | |
| Blender / v2.79 BMW27 CPU | |
| Asus Vivobook 15 F512DA-SH31 | |
| Dell Inspiron 15 5000 5502 | |
| Durabook S15ABG2 | |
| Microsoft Surface Book 3 15 | |
| HP Envy x360 15-ee0257ng | |
| Genomsnitt Intel Core i7-1165G7 (468 - 1138, n=80) | |
| Dell Inspiron 15 7000 7506 2-in-1 Black Edition | |
| Dell Inspiron 15 7506 2-in-1 P97F | |
| Lenovo ThinkPad E15 Gen2-20T9S00K00 | |
| 7-Zip 18.03 / 7z b 4 -mmt1 | |
| Genomsnitt Intel Core i7-1165G7 (4478 - 5507, n=80) | |
| Dell Inspiron 15 7000 7506 2-in-1 Black Edition | |
| Dell Inspiron 15 7506 2-in-1 P97F | |
| Dell Inspiron 15 5000 5502 | |
| Lenovo ThinkPad E15 Gen2-20T9S00K00 | |
| HP Envy x360 15-ee0257ng | |
| Microsoft Surface Book 3 15 | |
| Durabook S15ABG2 | |
| Asus Vivobook 15 F512DA-SH31 | |
| 7-Zip 18.03 / 7z b 4 | |
| Lenovo ThinkPad E15 Gen2-20T9S00K00 | |
| HP Envy x360 15-ee0257ng | |
| Dell Inspiron 15 7506 2-in-1 P97F | |
| Dell Inspiron 15 7000 7506 2-in-1 Black Edition | |
| Genomsnitt Intel Core i7-1165G7 (15347 - 27405, n=80) | |
| Microsoft Surface Book 3 15 | |
| Durabook S15ABG2 | |
| Dell Inspiron 15 5000 5502 | |
| Asus Vivobook 15 F512DA-SH31 | |
| Geekbench 5.5 / Single-Core | |
| Genomsnitt Intel Core i7-1165G7 (1302 - 1595, n=77) | |
| Dell Inspiron 15 7000 7506 2-in-1 Black Edition | |
| Dell Inspiron 15 7506 2-in-1 P97F | |
| Dell Inspiron 15 5000 5502 | |
| Microsoft Surface Book 3 15 | |
| Asus ZenBook Flip 15 UX563FD-A1027T | |
| Lenovo ThinkPad E15 Gen2-20T9S00K00 | |
| HP Envy x360 15-ee0257ng | |
| Durabook S15ABG2 | |
| Asus Vivobook 15 F512DA-SH31 | |
| Geekbench 5.5 / Multi-Core | |
| Lenovo ThinkPad E15 Gen2-20T9S00K00 | |
| Dell Inspiron 15 7000 7506 2-in-1 Black Edition | |
| Genomsnitt Intel Core i7-1165G7 (3078 - 5926, n=77) | |
| HP Envy x360 15-ee0257ng | |
| Dell Inspiron 15 7506 2-in-1 P97F | |
| Microsoft Surface Book 3 15 | |
| Asus ZenBook Flip 15 UX563FD-A1027T | |
| Durabook S15ABG2 | |
| Dell Inspiron 15 5000 5502 | |
| Asus Vivobook 15 F512DA-SH31 | |
| HWBOT x265 Benchmark v2.2 / 4k Preset | |
| Lenovo ThinkPad E15 Gen2-20T9S00K00 | |
| Dell Inspiron 15 7506 2-in-1 P97F | |
| Dell Inspiron 15 7000 7506 2-in-1 Black Edition | |
| Genomsnitt Intel Core i7-1165G7 (1.39 - 8.47, n=80) | |
| HP Envy x360 15-ee0257ng | |
| Microsoft Surface Book 3 15 | |
| Durabook S15ABG2 | |
| Dell Inspiron 15 5000 5502 | |
| Asus Vivobook 15 F512DA-SH31 | |
| LibreOffice / 20 Documents To PDF | |
| Asus Vivobook 15 F512DA-SH31 | |
| HP Envy x360 15-ee0257ng | |
| Durabook S15ABG2 | |
| Microsoft Surface Book 3 15 | |
| Dell Inspiron 15 5000 5502 | |
| Lenovo ThinkPad E15 Gen2-20T9S00K00 | |
| Dell Inspiron 15 7506 2-in-1 P97F | |
| Genomsnitt Intel Core i7-1165G7 (21.5 - 88.1, n=78) | |
| Dell Inspiron 15 7000 7506 2-in-1 Black Edition | |
| R Benchmark 2.5 / Overall mean | |
| Asus Vivobook 15 F512DA-SH31 | |
| Durabook S15ABG2 | |
| Microsoft Surface Book 3 15 | |
| Dell Inspiron 15 5000 5502 | |
| Dell Inspiron 15 7506 2-in-1 P97F | |
| HP Envy x360 15-ee0257ng | |
| Lenovo ThinkPad E15 Gen2-20T9S00K00 | |
| Dell Inspiron 15 7000 7506 2-in-1 Black Edition | |
| Genomsnitt Intel Core i7-1165G7 (0.552 - 1.002, n=80) | |
* ... mindre är bättre
| PCMark 10 | |
| Score | |
| Dell Inspiron 15 7000 7506 2-in-1 Black Edition | |
| HP Envy x360 15-ee0257ng | |
| Samsung Galaxy Book Flex 15-NP950 | |
| Lenovo Yoga C740-15IML | |
| Dell Inspiron 15 7506 2-in-1 P97F | |
| Microsoft Surface Book 3 15 | |
| Asus ZenBook Flip 15 UX563FD-A1027T | |
| Essentials | |
| Lenovo Yoga C740-15IML | |
| Dell Inspiron 15 7000 7506 2-in-1 Black Edition | |
| Dell Inspiron 15 7506 2-in-1 P97F | |
| Asus ZenBook Flip 15 UX563FD-A1027T | |
| Samsung Galaxy Book Flex 15-NP950 | |
| HP Envy x360 15-ee0257ng | |
| Microsoft Surface Book 3 15 | |
| Productivity | |
| Samsung Galaxy Book Flex 15-NP950 | |
| Lenovo Yoga C740-15IML | |
| HP Envy x360 15-ee0257ng | |
| Asus ZenBook Flip 15 UX563FD-A1027T | |
| Microsoft Surface Book 3 15 | |
| Dell Inspiron 15 7000 7506 2-in-1 Black Edition | |
| Dell Inspiron 15 7506 2-in-1 P97F | |
| Digital Content Creation | |
| Dell Inspiron 15 7000 7506 2-in-1 Black Edition | |
| HP Envy x360 15-ee0257ng | |
| Samsung Galaxy Book Flex 15-NP950 | |
| Dell Inspiron 15 7506 2-in-1 P97F | |
| Microsoft Surface Book 3 15 | |
| Lenovo Yoga C740-15IML | |
| Asus ZenBook Flip 15 UX563FD-A1027T | |
| PCMark 8 | |
| Home Score Accelerated v2 | |
| Dell Inspiron 15 7000 7506 2-in-1 Black Edition | |
| HP Envy x360 15-ee0257ng | |
| Dell Inspiron 15 7506 2-in-1 P97F | |
| Samsung Galaxy Book Flex 15-NP950 | |
| Lenovo Yoga C740-15IML | |
| Microsoft Surface Book 3 15 | |
| Asus ZenBook Flip 15 UX563FD-A1027T | |
| Work Score Accelerated v2 | |
| Lenovo Yoga C740-15IML | |
| Samsung Galaxy Book Flex 15-NP950 | |
| HP Envy x360 15-ee0257ng | |
| Microsoft Surface Book 3 15 | |
| Asus ZenBook Flip 15 UX563FD-A1027T | |
| Dell Inspiron 15 7000 7506 2-in-1 Black Edition | |
| Dell Inspiron 15 7506 2-in-1 P97F | |
| PCMark 8 Home Score Accelerated v2 | 4349 poäng | |
| PCMark 8 Work Score Accelerated v2 | 3034 poäng | |
| PCMark 10 Score | 5020 poäng | |
Hjälp | ||
| DPC Latencies / LatencyMon - interrupt to process latency (max), Web, Youtube, Prime95 | |
| Dell Inspiron 15 7506 2-in-1 P97F | |
| Microsoft Surface Book 3 15 | |
| Samsung Galaxy Book Flex 15-NP950 | |
| HP Envy x360 15-ee0257ng | |
| Dell Inspiron 15 7000 7506 2-in-1 Black Edition | |
* ... mindre är bättre
| Dell Inspiron 15 7000 7506 2-in-1 Black Edition Micron 2300 1TB MTFDHBA1T0TDV | HP Envy x360 15-ee0257ng Intel SSD 660p SSDPEKNW512G8 | Microsoft Surface Book 3 15 SK hynix BC501 HFM256GDGTNG | Asus ZenBook Flip 15 UX563FD-A1027T Samsung SSD PM981 MZVLB1T0HALR | Lenovo Yoga C740-15IML Samsung SSD PM981 MZVLB512HAJQ | Dell Inspiron 15 7506 2-in-1 P97F Toshiba KBG40ZNS256G NVMe | |
|---|---|---|---|---|---|---|
| AS SSD | -37% | -39% | -9% | 0% | -70% | |
| Seq Read (MB/s) | 1910 | 1587 -17% | 1625 -15% | 2739 43% | 2732 43% | 1470 -23% |
| Seq Write (MB/s) | 2795 | 864 -69% | 461.3 -83% | 1307 -53% | 1477 -47% | 324.2 -88% |
| 4K Read (MB/s) | 50.5 | 51.6 2% | 37.2 -26% | 47.43 -6% | 57.7 14% | 37.25 -26% |
| 4K Write (MB/s) | 103.8 | 125.1 21% | 100.9 -3% | 126 21% | 136.3 31% | 98 -6% |
| 4K-64 Read (MB/s) | 1485 | 323.1 -78% | 501 -66% | 1013 -32% | 1021 -31% | 796 -46% |
| 4K-64 Write (MB/s) | 1820 | 724 -60% | 311.7 -83% | 1371 -25% | 1651 -9% | 152.6 -92% |
| Access Time Read * (ms) | 0.056 | 0.101 -80% | 0.072 -29% | 0.082 -46% | 0.062 -11% | 0.146 -161% |
| Access Time Write * (ms) | 0.282 | 0.046 84% | 0.036 87% | 0.029 90% | 0.028 90% | 0.577 -105% |
| Score Read (Points) | 1727 | 533 -69% | 701 -59% | 1335 -23% | 1352 -22% | 980 -43% |
| Score Write (Points) | 2203 | 935 -58% | 459 -79% | 1628 -26% | 1935 -12% | 283 -87% |
| Score Total (Points) | 4863 | 1725 -65% | 1470 -70% | 3582 -26% | 3929 -19% | 1714 -65% |
| Copy ISO MB/s (MB/s) | 1892 | 1323 -30% | 1931 2% | 1972 4% | 353.5 -81% | |
| Copy Program MB/s (MB/s) | 649 | 340.8 -47% | 457.9 -29% | 642 -1% | 194.1 -70% | |
| Copy Game MB/s (MB/s) | 1558 | 823 -47% | 1242 -20% | 1090 -30% | 239 -85% | |
| CrystalDiskMark 5.2 / 6 | -39% | -51% | -14% | -7% | -53% | |
| Write 4K (MB/s) | 111.4 | 104.5 -6% | 87.4 -22% | 137.8 24% | 142.3 28% | 99.3 -11% |
| Read 4K (MB/s) | 53.4 | 49.7 -7% | 38.14 -29% | 44.15 -17% | 47.56 -11% | 32.1 -40% |
| Write Seq (MB/s) | 2598 | 981 -62% | 610 -77% | 2073 -20% | 2185 -16% | 353.1 -86% |
| Read Seq (MB/s) | 2308 | 1517 -34% | 1029 -55% | 2165 -6% | 2235 -3% | 1370 -41% |
| Write 4K Q32T1 (MB/s) | 644 | 398.8 -38% | 280.3 -56% | 431.9 -33% | 515 -20% | 171.1 -73% |
| Read 4K Q32T1 (MB/s) | 665 | 338.4 -49% | 259.6 -61% | 427.7 -36% | 413.4 -38% | 350.8 -47% |
| Write Seq Q32T1 (MB/s) | 3147 | 982 -69% | 829 -74% | 2253 -28% | 2981 -5% | 325.9 -90% |
| Read Seq Q32T1 (MB/s) | 3242 | 1650 -49% | 2037 -37% | 3480 7% | 3565 10% | 2197 -32% |
| Totalt genomsnitt (program/inställningar) | -38% /
-38% | -45% /
-44% | -12% /
-11% | -4% /
-3% | -62% /
-64% |
* ... mindre är bättre

DiskSpd Read Loop, Queue Depth 8
| 3DMark 06 Standard Score | 22466 poäng | |
| 3DMark 11 Performance | 7720 poäng | |
| 3DMark Cloud Gate Standard Score | 19254 poäng | |
| 3DMark Fire Strike Score | 5412 poäng | |
| 3DMark Time Spy Score | 1853 poäng | |
Hjälp | ||
| låg | med. | hög | ultra | QHD | 4K | |
|---|---|---|---|---|---|---|
| GTA V (2015) | 65.9 | 60.7 | 24 | |||
| The Witcher 3 (2015) | 54.2 | 53.7 | 33.8 | 17.7 | 11.2 | |
| Dota 2 Reborn (2015) | 59.1 | 40.3 | 38.3 | 38.4 | 20.1 | |
| Final Fantasy XV Benchmark (2018) | 46.1 | 24.2 | 17 | |||
| X-Plane 11.11 (2018) | 33.4 | 34.4 | 29.7 | |||
| Strange Brigade (2018) | 87.4 | 39.1 | 33 | 28.5 | 20.1 | 11 |
| Dell Inspiron 15 7000 7506 2-in-1 Black Edition Xe MAX, i7-1165G7, Micron 2300 1TB MTFDHBA1T0TDV | Samsung Galaxy Book Flex 15-NP950 GeForce MX250, i7-1065G7, Samsung SSD PM981a MZVLB512HBJQ | HP Envy x360 15-ee0257ng Vega 6, R5 4500U, Intel SSD 660p SSDPEKNW512G8 | Microsoft Surface Book 3 15 GeForce GTX 1660 Ti Max-Q, i7-1065G7, SK hynix BC501 HFM256GDGTNG | Asus ZenBook Flip 15 UX563FD-A1027T GeForce GTX 1050 Max-Q, i7-10510U, Samsung SSD PM981 MZVLB1T0HALR | Lenovo Yoga C740-15IML UHD Graphics 620, i7-10510U, Samsung SSD PM981 MZVLB512HAJQ | Dell Inspiron 15 7506 2-in-1 P97F Iris Xe G7 80EUs, i5-1135G7, Toshiba KBG40ZNS256G NVMe | |
|---|---|---|---|---|---|---|---|
| Noise | 13% | 4% | 3% | 3% | 6% | 9% | |
| av / miljö * (dB) | 27.3 | 24.9 9% | 27 1% | 30.2 -11% | 30.3 -11% | 29.3 -7% | 27.1 1% |
| Idle Minimum * (dB) | 27.3 | 24.9 9% | 27 1% | 30.2 -11% | 30.3 -11% | 29.3 -7% | 27.1 1% |
| Idle Average * (dB) | 27.3 | 24.9 9% | 27 1% | 30.2 -11% | 30.3 -11% | 29.3 -7% | 27.1 1% |
| Idle Maximum * (dB) | 27.3 | 24.9 9% | 27 1% | 30.2 -11% | 30.3 -11% | 29.6 -8% | 27.1 1% |
| Load Average * (dB) | 47.4 | 38.4 19% | 43.2 9% | 30.9 35% | 33.7 29% | 32.4 32% | 31.5 34% |
| Witcher 3 ultra * (dB) | 47.4 | 38.4 19% | 45.1 5% | 37.4 21% | 37.4 21% | ||
| Load Maximum * (dB) | 47.5 | 38.5 19% | 43.2 9% | 34.3 28% | 38.9 18% | 33.3 30% | 47.2 1% |
* ... mindre är bättre
Ljudnivå
| Låg belastning |
| 27.3 / 27.3 / 27.3 dB(A) |
| Hög belastning |
| 47.4 / 47.5 dB(A) |
 | ||
30 dB tyst 40 dB(A) hörbar 50 dB(A) högt ljud |
||
min: | ||
(±) Den maximala temperaturen på ovansidan är 43 °C / 109 F, jämfört med genomsnittet av 36.8 °C / 98 F , allt från 21 till 71 °C för klassen Multimedia.
(-) Botten värms upp till maximalt 48.8 °C / 120 F, jämfört med genomsnittet av 39.1 °C / 102 F
(+) Vid tomgångsbruk är medeltemperaturen för ovansidan 25.6 °C / 78 F, jämfört med enhetsgenomsnittet på 31.3 °C / ### class_avg_f### F.
(±) När du spelar The Witcher 3 är medeltemperaturen för ovansidan 32.4 °C / 90 F, jämfört med enhetsgenomsnittet på 31.3 °C / ## #class_avg_f### F.
(+) Handledsstöden och pekplattan är kallare än hudtemperaturen med maximalt 29.2 °C / 84.6 F och är därför svala att ta på.
(±) Medeltemperaturen för handledsstödsområdet på liknande enheter var 28.7 °C / 83.7 F (-0.5 °C / -0.9 F).
Dell Inspiron 15 7000 7506 2-in-1 Black Edition ljudanalys
(±) | högtalarljudstyrkan är genomsnittlig men bra (81.6 dB)
Bas 100 - 315 Hz
(-) | nästan ingen bas - i genomsnitt 22.7% lägre än medianen
(±) | linjäriteten för basen är genomsnittlig (11% delta till föregående frekvens)
Mellan 400 - 2000 Hz
(±) | högre mellan - i genomsnitt 8.4% högre än median
(±) | linjäriteten för mids är genomsnittlig (8.6% delta till föregående frekvens)
Högsta 2 - 16 kHz
(+) | balanserade toppar - endast 3.4% från medianen
(+) | toppar är linjära (6.2% delta till föregående frekvens)
Totalt 100 - 16 000 Hz
(±) | linjäriteten för det totala ljudet är genomsnittlig (21.2% skillnad mot median)
Jämfört med samma klass
» 73% av alla testade enheter i den här klassen var bättre, 7% liknande, 20% sämre
» Den bästa hade ett delta på 5%, genomsnittet var 17%, sämst var 45%
Jämfört med alla testade enheter
» 59% av alla testade enheter var bättre, 7% liknande, 34% sämre
» Den bästa hade ett delta på 4%, genomsnittet var 24%, sämst var 134%
Apple MacBook 12 (Early 2016) 1.1 GHz ljudanalys
(+) | högtalare kan spela relativt högt (83.6 dB)
Bas 100 - 315 Hz
(±) | reducerad bas - i genomsnitt 11.3% lägre än medianen
(±) | linjäriteten för basen är genomsnittlig (14.2% delta till föregående frekvens)
Mellan 400 - 2000 Hz
(+) | balanserad mellan - endast 2.4% från medianen
(+) | mids är linjära (5.5% delta till föregående frekvens)
Högsta 2 - 16 kHz
(+) | balanserade toppar - endast 2% från medianen
(+) | toppar är linjära (4.5% delta till föregående frekvens)
Totalt 100 - 16 000 Hz
(+) | det totala ljudet är linjärt (10.2% skillnad mot median)
Jämfört med samma klass
» 7% av alla testade enheter i den här klassen var bättre, 2% liknande, 91% sämre
» Den bästa hade ett delta på 5%, genomsnittet var 18%, sämst var 53%
Jämfört med alla testade enheter
» 5% av alla testade enheter var bättre, 1% liknande, 94% sämre
» Den bästa hade ett delta på 4%, genomsnittet var 24%, sämst var 134%
| Av/Standby | |
| Låg belastning | |
| Hög belastning |
|
Förklaring:
min: | |
| Dell Inspiron 15 7000 7506 2-in-1 Black Edition i7-1165G7, Xe MAX, Micron 2300 1TB MTFDHBA1T0TDV, IPS, 3840x2160, 15.6" | Samsung Galaxy Book Flex 15-NP950 i7-1065G7, GeForce MX250, Samsung SSD PM981a MZVLB512HBJQ, IPS, QLED, 1920x1080, 15.6" | HP Envy x360 15-ee0257ng R5 4500U, Vega 6, Intel SSD 660p SSDPEKNW512G8, IPS, 1920x1080, 15.6" | Microsoft Surface Book 3 15 i7-1065G7, GeForce GTX 1660 Ti Max-Q, SK hynix BC501 HFM256GDGTNG, IPS, 3240x2160, 15" | Asus ZenBook Flip 15 UX563FD-A1027T i7-10510U, GeForce GTX 1050 Max-Q, Samsung SSD PM981 MZVLB1T0HALR, IPS, 3840x2160, 15.6" | Lenovo Yoga C740-15IML i7-10510U, UHD Graphics 620, Samsung SSD PM981 MZVLB512HAJQ, IPS LED, 1920x1080, 15.6" | Dell Inspiron 15 7506 2-in-1 P97F i5-1135G7, Iris Xe G7 80EUs, Toshiba KBG40ZNS256G NVMe, IPS, 1920x1080, 15.6" | |
|---|---|---|---|---|---|---|---|
| Power Consumption | 16% | 25% | -11% | -1% | 33% | 31% | |
| Idle Minimum * (Watt) | 4 | 4.2 -5% | 3.9 2% | 4.2 -5% | 2.3 43% | 2.97 26% | 3.9 2% |
| Idle Average * (Watt) | 15.5 | 8.7 44% | 7 55% | 7.4 52% | 10.3 34% | 7.2 54% | 6.9 55% |
| Idle Maximum * (Watt) | 16.2 | 11.3 30% | 10.5 35% | 9 44% | 11 32% | 9.9 39% | 8.5 48% |
| Load Average * (Watt) | 49.7 | 58 -17% | 48 3% | 78 -57% | 77 -55% | 40.8 18% | 30.5 39% |
| Witcher 3 ultra * (Watt) | 52.2 | 44.6 15% | 94.2 -80% | 68 -30% | 42.6 18% | ||
| Load Maximum * (Watt) | 92.7 | 67 28% | 65 30% | 108 -17% | 118 -27% | 64.7 30% | 69.7 25% |
* ... mindre är bättre
| Dell Inspiron 15 7000 7506 2-in-1 Black Edition i7-1165G7, Xe MAX, 68 Wh | Samsung Galaxy Book Flex 15-NP950 i7-1065G7, GeForce MX250, 69.7 Wh | HP Envy x360 15-ee0257ng R5 4500U, Vega 6, 51 Wh | Microsoft Surface Book 3 15 i7-1065G7, GeForce GTX 1660 Ti Max-Q, 82 Wh | Asus ZenBook Flip 15 UX563FD-A1027T i7-10510U, GeForce GTX 1050 Max-Q, 71 Wh | Lenovo Yoga C740-15IML i7-10510U, UHD Graphics 620, 60.3 Wh | Dell Inspiron 15 7506 2-in-1 P97F i5-1135G7, Iris Xe G7 80EUs, 53 Wh | |
|---|---|---|---|---|---|---|---|
| Batteridrifttid | 21% | -3% | 14% | 10% | 16% | -19% | |
| Reader / Idle (h) | 25 | 16.2 -35% | 19.5 -22% | 18.8 -25% | |||
| WiFi v1.3 (h) | 9.7 | 11.7 21% | 9.4 -3% | 8.5 -12% | 9.4 -3% | 10.4 7% | 8.3 -14% |
| Load (h) | 1.6 | 3 88% | 2.5 56% | 2 25% | 1.3 -19% |
För
Emot
Läs den fullständiga versionen av den här recensionen på engelska här.
Inspiron 7506 2-in-1 Black Edition kostar för tillfället 15.000 kronor, vilket kan jämföras med Silver Edition som kostar 7-8000 kronor. När till och med Core i5-processorn i Silver Edition presterar bättre än vår Core i7-baserade Black Edition är pris/prestanda-förhållandet definitivt inte det bästa. För det priset går det att argumentera för att Dells egna XPS 15 är ett bättre köp, särskilt för den som vill redigera grafik eller skapa innehåll och kan utnyttja de extra hästkrafterna och de bättre färgerna.
Inspiron Black Edition riktar sig åt en väldigt nischad målgrupp som vill ha både en omvandlingsbar med tryckkänslig skärm samt en diskret Iris Xe Max GPU. Hamnar man inte i den kategorin är det bättre att lägga sina 15.000 kronor på Dell XPS 15 istället.
Är man intresserad av Black Edition är det troligen i huvudsak på grund av Iris Xe Max GPU:n. Om så är fallet, kom ihåg att användningsområdena är färre än för GeForce-serien. Om du överhuvudtaget spelar några spel är GeForce MX-serien fortfarande att rekommendera tack vare överlägsna drivrutiner samt bättre stabilitet och kompatibilitet. Om du gör mycket arbete i Adobe Lightroom som kräver kodning är däremot specialiserade Xe Max ett bättre val. Men tills priserna går ner lär Inspiron Black Edition vara svårsåld när den jämförs med sin Silver Edition-motsvarighet eller med XPS 15-serien.
Dell Inspiron 15 7000 7506 2-in-1 Black Edition
- 01/04/2021 v7 (old)
Allen Ngo
Price comparison
