Test: Razer Book 13 Core i7 - Som en XPS 13, fast snabbare (Sammanfattning)
Testgrupp
Gradering | Datum | Modell | Vikt | Höjd | Storlek | Upplösning | Pris |
|---|---|---|---|---|---|---|---|
| 86.6 % v7 (old) | 12/2020 | Razer Book 13 FHD i7-1165G7, Iris Xe G7 96EUs | 1.4 kg | 15.15 mm | 13.40" | 1920x1200 | |
| 88.1 % v7 (old) | 12/2020 | Dell XPS 13 9310 Core i7 FHD i7-1165G7, Iris Xe G7 96EUs | 1.3 kg | 14.8 mm | 13.40" | 1920x1200 | |
| 85.1 % v7 (old) | Asus Zenbook S UX393JA i7-1065G7, Iris Plus Graphics G7 (Ice Lake 64 EU) | 1.4 kg | 15.7 mm | 13.90" | 3300x2200 | ||
| 87.4 % v7 (old) | 06/2020 | Huawei MateBook X Pro 2020 i7 i7-10510U, GeForce MX250 | 1.3 kg | 14.6 mm | 13.90" | 3000x2000 | |
| 87.3 % v6 (old) | 10/2018 | Lenovo Yoga C930-13IKB i5-8250U, UHD Graphics 620 | 1.4 kg | 14.9 mm | 13.90" | 1920x1080 | |
| 85.5 % v7 (old) | 04/2021 | Razer Blade Stealth i7-1165G7 GTX 1650 Ti Max-Q i7-1165G7, GeForce GTX 1650 Ti Max-Q | 1.4 kg | 15.3 mm | 13.30" | 1920x1080 |
| SD Card Reader | |
| average JPG Copy Test (av. of 3 runs) | |
| Dell XPS 13 9310 Core i7 FHD (Toshiba Exceria Pro M501 64 GB UHS-II) | |
| Razer Book 13 FHD (Toshiba Exceria Pro M501 32 GB UHS-II) | |
| Asus Zenbook S UX393JA (Toshiba Exceria Pro M501 64 GB UHS-II) | |
| maximum AS SSD Seq Read Test (1GB) | |
| Dell XPS 13 9310 Core i7 FHD (Toshiba Exceria Pro M501 64 GB UHS-II) | |
| Razer Book 13 FHD (Toshiba Exceria Pro M501 32 GB UHS-II) | |
| Asus Zenbook S UX393JA (Toshiba Exceria Pro M501 64 GB UHS-II) | |
| Networking | |
| iperf3 transmit AX12 | |
| Huawei MateBook X Pro 2020 i7 | |
| Razer Book 13 FHD | |
| Razer Blade Stealth i7-1165G7 GTX 1650 Ti Max-Q | |
| Dell XPS 13 9310 Core i7 FHD | |
| Asus Zenbook S UX393JA | |
| Lenovo Yoga C930-13IKB | |
| iperf3 receive AX12 | |
| Razer Book 13 FHD | |
| Asus Zenbook S UX393JA | |
| Dell XPS 13 9310 Core i7 FHD | |
| Razer Blade Stealth i7-1165G7 GTX 1650 Ti Max-Q | |
| Huawei MateBook X Pro 2020 i7 | |
| Lenovo Yoga C930-13IKB | |


| |||||||||||||||||||||||||
Distribution av ljusstyrkan: 88 %
Mitt på batteriet: 545.3 cd/m²
Kontrast: 1759:1 (Svärta: 0.31 cd/m²)
ΔE ColorChecker Calman: 1.39 | ∀{0.5-29.43 Ø4.72}
calibrated: 2.72
ΔE Greyscale Calman: 1.3 | ∀{0.09-98 Ø4.97}
99.6% sRGB (Argyll 1.6.3 3D)
65.9% AdobeRGB 1998 (Argyll 1.6.3 3D)
71.6% AdobeRGB 1998 (Argyll 3D)
99.3% sRGB (Argyll 3D)
70.1% Display P3 (Argyll 3D)
Gamma: 2.2
CCT: 6476 K
| Razer Book 13 FHD Sharp LQ134N1JW48, IPS, 13.4", 1920x1200 | Dell XPS 13 9310 Core i7 FHD Sharp LQ134N1, IPS, 13.4", 1920x1200 | Asus Zenbook S UX393JA AU Optronics B139KAN01.0, IPS, 13.9", 3300x2200 | Huawei MateBook X Pro 2020 i7 JDI LPM139M422A, LTPS, 13.9", 3000x2000 | Microsoft Surface Laptop 3 13 Core i5-1035G7 Sharp LQ135P1JX51, IPS, 13.5", 2256x1504 | Razer Blade Stealth i7-1065G7 Iris Plus Sharp LQ133M1JW41, IPS, 13.3", 1920x1080 | |
|---|---|---|---|---|---|---|
| Display | 1% | 21% | -3% | -4% | -5% | |
| Display P3 Coverage (%) | 70.1 | 70.9 1% | 97.7 39% | 66.6 -5% | 65.7 -6% | 66.2 -6% |
| sRGB Coverage (%) | 99.3 | 99.1 0% | 99.8 1% | 99.4 0% | 98.6 -1% | 97.2 -2% |
| AdobeRGB 1998 Coverage (%) | 71.6 | 72.9 2% | 87.9 23% | 68.6 -4% | 67.8 -5% | 67.1 -6% |
| Response Times | 11% | 1% | 17% | -6% | 17% | |
| Response Time Grey 50% / Grey 80% * (ms) | 56.8 ? | 52 ? 8% | 56.4 ? 1% | 49.6 ? 13% | 59.2 ? -4% | 45.2 ? 20% |
| Response Time Black / White * (ms) | 38.8 ? | 33.2 ? 14% | 38.8 ? -0% | 30.8 ? 21% | 41.6 ? -7% | 33.2 ? 14% |
| PWM Frequency (Hz) | 2475 ? | 2475 ? | 29070 ? | 21740 ? | 22730 ? | |
| Screen | -52% | -45% | 1% | 2% | 0% | |
| Brightness middle (cd/m²) | 545.3 | 543.3 0% | 444.1 -19% | 557 2% | 403.4 -26% | 422.6 -23% |
| Brightness (cd/m²) | 507 | 524 3% | 423 -17% | 532 5% | 397 -22% | 404 -20% |
| Brightness Distribution (%) | 88 | 92 5% | 89 1% | 87 -1% | 89 1% | 87 -1% |
| Black Level * (cd/m²) | 0.31 | 0.38 -23% | 0.37 -19% | 0.33 -6% | 0.34 -10% | 0.35 -13% |
| Contrast (:1) | 1759 | 1430 -19% | 1200 -32% | 1688 -4% | 1186 -33% | 1207 -31% |
| Colorchecker dE 2000 * | 1.39 | 3.02 -117% | 2.94 -112% | 1.4 -1% | 0.94 32% | 1.02 27% |
| Colorchecker dE 2000 max. * | 2.61 | 7.61 -192% | 7.37 -182% | 2.5 4% | 2.92 -12% | 3.06 -17% |
| Colorchecker dE 2000 calibrated * | 2.72 | 1.23 55% | 3.05 -12% | 0.7 74% | 0.99 64% | 0.95 65% |
| Greyscale dE 2000 * | 1.3 | 5 -285% | 2.9 -123% | 2 -54% | 0.9 31% | 1 23% |
| Gamma | 2.2 100% | 2.02 109% | 2.1 105% | 2.14 103% | 2.13 103% | 2.21 100% |
| CCT | 6476 100% | 6550 99% | 6766 96% | 6689 97% | 6620 98% | 6502 100% |
| Color Space (Percent of AdobeRGB 1998) (%) | 65.9 | 66.8 1% | 78.2 19% | 62.5 -5% | 62.3 -5% | 62.1 -6% |
| Color Space (Percent of sRGB) (%) | 99.6 | 99.6 0% | 99.8 0% | 99.5 0% | 98.7 -1% | 97.1 -3% |
| Totalt genomsnitt (program/inställningar) | -13% /
-34% | -8% /
-27% | 5% /
2% | -3% /
-0% | 4% /
1% |
* ... mindre är bättre
Visa svarstider
| ↔ Svarstid svart till vitt | ||
|---|---|---|
| 38.8 ms ... stiga ↗ och falla ↘ kombinerat | ↗ 20.4 ms stiga | 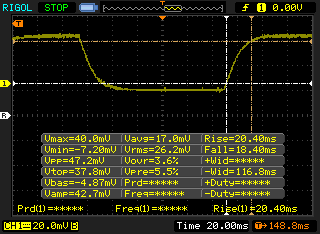 |
| ↘ 18.4 ms hösten | ||
| Skärmen visar långsamma svarsfrekvenser i våra tester och kommer att vara otillfredsställande för spelare. I jämförelse sträcker sig alla testade enheter från 0.1 (minst) till 240 (maximalt) ms. » 96 % av alla enheter är bättre. Detta innebär att den uppmätta svarstiden är sämre än genomsnittet av alla testade enheter (19.9 ms). | ||
| ↔ Svarstid 50 % grått till 80 % grått | ||
| 56.8 ms ... stiga ↗ och falla ↘ kombinerat | ↗ 29.2 ms stiga | 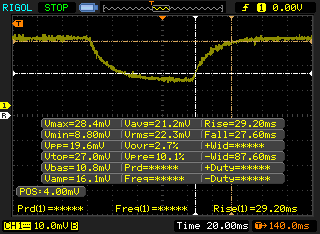 |
| ↘ 27.6 ms hösten | ||
| Skärmen visar långsamma svarsfrekvenser i våra tester och kommer att vara otillfredsställande för spelare. I jämförelse sträcker sig alla testade enheter från 0.165 (minst) till 636 (maximalt) ms. » 94 % av alla enheter är bättre. Detta innebär att den uppmätta svarstiden är sämre än genomsnittet av alla testade enheter (31.1 ms). | ||
Skärmflimmer / PWM (Puls-Width Modulation)
| Skärmflimmer / PWM upptäckt | 2475 Hz | ≤ 25 % ljusstyrka inställning | 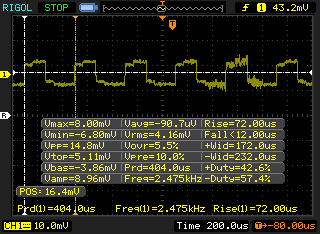 |
Displayens bakgrundsbelysning flimrar vid 2475 Hz (i värsta fall, t.ex. med PWM) Flimrande upptäckt vid en ljusstyrkeinställning på 25 % och lägre. Det ska inte finnas något flimmer eller PWM över denna ljusstyrkeinställning. Frekvensen för 2475 Hz är ganska hög, så de flesta användare som är känsliga för PWM bör inte märka något flimmer. Som jämförelse: 52 % av alla testade enheter använder inte PWM för att dämpa skärmen. Om PWM upptäcktes mättes ett medelvärde av 7784 (minst: 5 - maximum: 343500) Hz. | |||
Cinebench R15: CPU Multi 64Bit | CPU Single 64Bit
Blender: v2.79 BMW27 CPU
7-Zip 18.03: 7z b 4 -mmt1 | 7z b 4
Geekbench 5.5: Single-Core | Multi-Core
HWBOT x265 Benchmark v2.2: 4k Preset
LibreOffice : 20 Documents To PDF
R Benchmark 2.5: Overall mean
| R Benchmark 2.5 / Overall mean | |
| Asus ZenBook 14 UX434FL-DB77 | |
| Apple MacBook Air 2020 M1 Entry | |
| Dell XPS 13 9300 4K UHD | |
| Lenovo ThinkPad L14-20U50003GE | |
| Lenovo Yoga 9i 14ITL5 | |
| Lenovo Yoga Slim 7 14ARE05 82A20008GE | |
| Lenovo Yoga Slim 7-14ARE | |
| Genomsnitt Intel Core i7-1165G7 (0.552 - 1.002, n=80) | |
| Dell XPS 13 9310 Core i7 FHD | |
| Razer Book 13 FHD | |
Cinebench R15: CPU Multi 64Bit | CPU Single 64Bit
Blender: v2.79 BMW27 CPU
7-Zip 18.03: 7z b 4 -mmt1 | 7z b 4
Geekbench 5.5: Single-Core | Multi-Core
HWBOT x265 Benchmark v2.2: 4k Preset
LibreOffice : 20 Documents To PDF
R Benchmark 2.5: Overall mean
* ... mindre är bättre
| PCMark 8 | |
| Home Score Accelerated v2 | |
| Lenovo Yoga Slim 7-14ARE | |
| Genomsnitt Intel Core i7-1165G7, Intel Iris Xe Graphics G7 96EUs (3769 - 5686, n=17) | |
| Razer Book 13 FHD | |
| Dell XPS 13 9310 Core i7 FHD | |
| Razer Blade Stealth i7-1065G7 Iris Plus | |
| Huawei MateBook X Pro 2020 i7 | |
| Asus Zenbook S UX393JA | |
| Work Score Accelerated v2 | |
| Lenovo Yoga Slim 7-14ARE | |
| Razer Blade Stealth i7-1065G7 Iris Plus | |
| Huawei MateBook X Pro 2020 i7 | |
| Razer Book 13 FHD | |
| Dell XPS 13 9310 Core i7 FHD | |
| Genomsnitt Intel Core i7-1165G7, Intel Iris Xe Graphics G7 96EUs (2431 - 3221, n=15) | |
| Asus Zenbook S UX393JA | |
| PCMark 8 Home Score Accelerated v2 | 4437 poäng | |
| PCMark 8 Work Score Accelerated v2 | 3096 poäng | |
| PCMark 10 Score | 5125 poäng | |
Hjälp | ||
| DPC Latencies / LatencyMon - interrupt to process latency (max), Web, Youtube, Prime95 | |
| Razer Blade Stealth Core i7 GTX 1650 Ti Max-Q 4K | |
| Dell XPS 13 9300 4K UHD | |
| Asus Zenbook S UX393JA | |
| Asus ZenBook 14 UX434FL-DB77 | |
| Razer Book 13 FHD | |
| Lenovo ThinkPad L14-20U50003GE | |
| Razer Blade Stealth i7-1165G7 GTX 1650 Ti Max-Q | |
| Asus ZenBook 14 UX425EA | |
| Dell XPS 13 9310 Core i7 FHD | |
| Lenovo Yoga Slim 7 14ARE05 82A20008GE | |
* ... mindre är bättre
| Razer Book 13 FHD Samsung SSD PM981a MZVLB256HBHQ | Dell XPS 13 9310 Core i7 FHD Micron 2300 512GB MTFDHBA512TDV | Asus Zenbook S UX393JA Intel SSD 660p 1TB SSDPEKNW010T8 | Huawei MateBook X Pro 2020 i7 Samsung PM981a MZVLB1T0HBLR | Lenovo Yoga C930-13IKB SK hynix PC401 HFS256GD9TNG | Razer Blade Stealth i7-1065G7 Iris Plus Samsung SSD PM981 MZVLB256HAHQ | |
|---|---|---|---|---|---|---|
| AS SSD | 26% | 22% | 106% | -30% | -20% | |
| Seq Read (MB/s) | 2329 | 2091 -10% | 1405 -40% | 2737 18% | 1850 -21% | 1989 -15% |
| Seq Write (MB/s) | 1011 | 1396 38% | 1062 5% | 2530 150% | 661 -35% | 827 -18% |
| 4K Read (MB/s) | 53 | 49.29 -7% | 50.8 -4% | 54 2% | 38.04 -28% | 40.12 -24% |
| 4K Write (MB/s) | 188.4 | 104.2 -45% | 124.9 -34% | 152.5 -19% | 95 -50% | 135.1 -28% |
| 4K-64 Read (MB/s) | 546 | 827 51% | 590 8% | 2011 268% | 434.3 -20% | 531 -3% |
| 4K-64 Write (MB/s) | 416.4 | 1636 293% | 840 102% | 1260 203% | 266.3 -36% | 309.9 -26% |
| Access Time Read * (ms) | 0.067 | 0.066 1% | 0.041 39% | 0.066 1% | 0.069 -3% | 0.085 -27% |
| Access Time Write * (ms) | 0.058 | 0.365 -529% | 0.118 -103% | 0.024 59% | 0.056 3% | 0.09 -55% |
| Score Read (Points) | 832 | 1086 31% | 781 -6% | 2339 181% | 657 -21% | 770 -7% |
| Score Write (Points) | 706 | 1880 166% | 1071 52% | 1666 136% | 427 -40% | 528 -25% |
| Score Total (Points) | 1914 | 3499 83% | 2251 18% | 5191 171% | 1373 -28% | 1644 -14% |
| Copy ISO MB/s (MB/s) | 1664 | 1544 -7% | 1459 -12% | 539 -68% | 1418 -15% | |
| Copy Program MB/s (MB/s) | 415.2 | 613 48% | 600 45% | 209.7 -49% | 382.7 -8% | |
| Copy Game MB/s (MB/s) | 420.2 | 1451 245% | 1411 236% | 340 -19% | 334.2 -20% | |
| CrystalDiskMark 5.2 / 6 | -4% | -20% | 8% | -38% | -5% | |
| Write 4K (MB/s) | 138.1 | 97.5 -29% | 129.5 -6% | 165.6 20% | 94.5 -32% | 176.8 28% |
| Read 4K (MB/s) | 44.97 | 50.9 13% | 54 20% | 50.2 12% | 39.95 -11% | 48.38 8% |
| Write Seq (MB/s) | 1948 | 1811 -7% | 1265 -35% | 1905 -2% | 531 -73% | 1332 -32% |
| Read Seq (MB/s) | 2225 | 1836 -17% | 1410 -37% | 1669 -25% | 1499 -33% | 1644 -26% |
| Write 4K Q32T1 (MB/s) | 526 | 521 -1% | 420.3 -20% | 474.6 -10% | 315.3 -40% | 440.6 -16% |
| Read 4K Q32T1 (MB/s) | 379.6 | 357.5 -6% | 357.7 -6% | 508 34% | 279.8 -26% | 559 47% |
| Write Seq Q32T1 (MB/s) | 2258 | 2879 28% | 1799 -20% | 3007 33% | 829 -63% | 1104 -51% |
| Read Seq Q32T1 (MB/s) | 3528 | 3204 -9% | 1616 -54% | 3556 1% | 2570 -27% | 3481 -1% |
| Write 4K Q8T8 (MB/s) | 332 | |||||
| Read 4K Q8T8 (MB/s) | 488.6 | |||||
| Totalt genomsnitt (program/inställningar) | 11% /
15% | 1% /
7% | 57% /
65% | -34% /
-33% | -13% /
-15% |
* ... mindre är bättre

DiskSpd Read Loop, Queue Depth 8
| 3DMark 11 Performance | 7309 poäng | |
| 3DMark Cloud Gate Standard Score | 20886 poäng | |
| 3DMark Fire Strike Score | 5169 poäng | |
| 3DMark Time Spy Score | 1779 poäng | |
Hjälp | ||
| låg | med. | hög | ultra | |
|---|---|---|---|---|
| GTA V (2015) | 101 | 83.5 | 26.2 | 12.8 |
| The Witcher 3 (2015) | 103.1 | 60.1 | 34.1 | 15.2 |
| Dota 2 Reborn (2015) | 83.7 | 74.4 | 52 | 48.8 |
| Final Fantasy XV Benchmark (2018) | 46.3 | 25.3 | 18.8 | |
| X-Plane 11.11 (2018) | 31.1 | 40.1 | 41.3 |
| Razer Book 13 FHD Iris Xe G7 96EUs, i7-1165G7, Samsung SSD PM981a MZVLB256HBHQ | Dell XPS 13 9310 Core i7 FHD Iris Xe G7 96EUs, i7-1165G7, Micron 2300 512GB MTFDHBA512TDV | Asus Zenbook S UX393JA Iris Plus Graphics G7 (Ice Lake 64 EU), i7-1065G7, Intel SSD 660p 1TB SSDPEKNW010T8 | Huawei MateBook X Pro 2020 i7 GeForce MX250, i7-10510U, Samsung PM981a MZVLB1T0HBLR | Microsoft Surface Laptop 3 13 Core i5-1035G7 Iris Plus Graphics G7 (Ice Lake 64 EU), i5-1035G7, SK hynix BC501 HFM256GDGTNG | Razer Blade Stealth i7-1065G7 Iris Plus Iris Plus Graphics G7 (Ice Lake 64 EU), i7-1065G7, Samsung SSD PM981 MZVLB256HAHQ | |
|---|---|---|---|---|---|---|
| Noise | 5% | -8% | -10% | -5% | -7% | |
| av / miljö * (dB) | 27 | 25.7 5% | 26.9 -0% | 29.6 -10% | 28.5 -6% | 28.3 -5% |
| Idle Minimum * (dB) | 27 | 25.7 5% | 26.9 -0% | 29.6 -10% | 28.5 -6% | 28.3 -5% |
| Idle Average * (dB) | 27 | 25.7 5% | 29 -7% | 29.6 -10% | 28.5 -6% | 28.3 -5% |
| Idle Maximum * (dB) | 27.1 | 25.9 4% | 31.1 -15% | 30.3 -12% | 28.5 -5% | 28.3 -4% |
| Load Average * (dB) | 29 | 26.2 10% | 37.7 -30% | 38 -31% | 28.5 2% | 33.5 -16% |
| Witcher 3 ultra * (dB) | 33.3 | 36.5 -10% | 40.2 -21% | 38 -14% | 40.4 -21% | 34.5 -4% |
| Load Maximum * (dB) | 44.8 | 36.6 18% | 38.1 15% | 38 15% | 40.4 10% | 49.4 -10% |
* ... mindre är bättre
Ljudnivå
| Låg belastning |
| 27 / 27 / 27.1 dB(A) |
| Hög belastning |
| 29 / 44.8 dB(A) |
 | ||
30 dB tyst 40 dB(A) hörbar 50 dB(A) högt ljud |
||
min: | ||
(+) Den maximala temperaturen på ovansidan är 39.2 °C / 103 F, jämfört med genomsnittet av 34.3 °C / 94 F , allt från 21.2 till 62.5 °C för klassen Office.
(±) Botten värms upp till maximalt 44 °C / 111 F, jämfört med genomsnittet av 36.8 °C / 98 F
(+) Vid tomgångsbruk är medeltemperaturen för ovansidan 21.5 °C / 71 F, jämfört med enhetsgenomsnittet på 29.5 °C / ### class_avg_f### F.
(+) När du spelar The Witcher 3 är medeltemperaturen för ovansidan 28 °C / 82 F, jämfört med enhetsgenomsnittet på 29.5 °C / ## #class_avg_f### F.
(+) Handledsstöden och pekplattan är kallare än hudtemperaturen med maximalt 31 °C / 87.8 F och är därför svala att ta på.
(-) Medeltemperaturen för handledsstödsområdet på liknande enheter var 27.5 °C / 81.5 F (-3.5 °C / -6.3 F).
Razer Book 13 FHD ljudanalys
(±) | högtalarljudstyrkan är genomsnittlig men bra (78.7 dB)
Bas 100 - 315 Hz
(-) | nästan ingen bas - i genomsnitt 15.1% lägre än medianen
(±) | linjäriteten för basen är genomsnittlig (11.1% delta till föregående frekvens)
Mellan 400 - 2000 Hz
(+) | balanserad mellan - endast 2.7% från medianen
(+) | mids är linjära (4.5% delta till föregående frekvens)
Högsta 2 - 16 kHz
(+) | balanserade toppar - endast 4% från medianen
(±) | linjäriteten för toppar är genomsnittlig (8.8% delta till föregående frekvens)
Totalt 100 - 16 000 Hz
(+) | det totala ljudet är linjärt (13.7% skillnad mot median)
Jämfört med samma klass
» 8% av alla testade enheter i den här klassen var bättre, 4% liknande, 88% sämre
» Den bästa hade ett delta på 7%, genomsnittet var 21%, sämst var 53%
Jämfört med alla testade enheter
» 15% av alla testade enheter var bättre, 4% liknande, 81% sämre
» Den bästa hade ett delta på 4%, genomsnittet var 24%, sämst var 134%
Apple MacBook 12 (Early 2016) 1.1 GHz ljudanalys
(+) | högtalare kan spela relativt högt (83.6 dB)
Bas 100 - 315 Hz
(±) | reducerad bas - i genomsnitt 11.3% lägre än medianen
(±) | linjäriteten för basen är genomsnittlig (14.2% delta till föregående frekvens)
Mellan 400 - 2000 Hz
(+) | balanserad mellan - endast 2.4% från medianen
(+) | mids är linjära (5.5% delta till föregående frekvens)
Högsta 2 - 16 kHz
(+) | balanserade toppar - endast 2% från medianen
(+) | toppar är linjära (4.5% delta till föregående frekvens)
Totalt 100 - 16 000 Hz
(+) | det totala ljudet är linjärt (10.2% skillnad mot median)
Jämfört med samma klass
» 7% av alla testade enheter i den här klassen var bättre, 2% liknande, 91% sämre
» Den bästa hade ett delta på 5%, genomsnittet var 18%, sämst var 53%
Jämfört med alla testade enheter
» 5% av alla testade enheter var bättre, 1% liknande, 94% sämre
» Den bästa hade ett delta på 4%, genomsnittet var 24%, sämst var 134%
| Av/Standby | |
| Låg belastning | |
| Hög belastning |
|
Förklaring:
min: | |
| Razer Book 13 FHD i7-1165G7, Iris Xe G7 96EUs, Samsung SSD PM981a MZVLB256HBHQ, IPS, 1920x1200, 13.4" | Dell XPS 13 9310 Core i7 FHD i7-1165G7, Iris Xe G7 96EUs, Micron 2300 512GB MTFDHBA512TDV, IPS, 1920x1200, 13.4" | Asus Zenbook S UX393JA i7-1065G7, Iris Plus Graphics G7 (Ice Lake 64 EU), Intel SSD 660p 1TB SSDPEKNW010T8, IPS, 3300x2200, 13.9" | Huawei MateBook X Pro 2020 i7 i7-10510U, GeForce MX250, Samsung PM981a MZVLB1T0HBLR, LTPS, 3000x2000, 13.9" | Microsoft Surface Laptop 3 13 Core i5-1035G7 i5-1035G7, Iris Plus Graphics G7 (Ice Lake 64 EU), SK hynix BC501 HFM256GDGTNG, IPS, 2256x1504, 13.5" | Razer Blade Stealth i7-1065G7 Iris Plus i7-1065G7, Iris Plus Graphics G7 (Ice Lake 64 EU), Samsung SSD PM981 MZVLB256HAHQ, IPS, 1920x1080, 13.3" | |
|---|---|---|---|---|---|---|
| Power Consumption | 2% | -14% | -38% | -17% | -32% | |
| Idle Minimum * (Watt) | 3.3 | 3.9 -18% | 4.1 -24% | 4.3 -30% | 4.4 -33% | 5.9 -79% |
| Idle Average * (Watt) | 6.4 | 5.9 8% | 7.5 -17% | 8.5 -33% | 7.5 -17% | 8.1 -27% |
| Idle Maximum * (Watt) | 7 | 6.3 10% | 8.5 -21% | 12 -71% | 7.8 -11% | 11.2 -60% |
| Load Average * (Watt) | 37.3 | 39.7 -6% | 36.8 1% | 54.8 -47% | 41.9 -12% | 44.3 -19% |
| Witcher 3 ultra * (Watt) | 36.4 | 34.8 4% | 39.2 -8% | 47.1 -29% | 40.8 -12% | 41.9 -15% |
| Load Maximum * (Watt) | 53.7 | 47.5 12% | 61.6 -15% | 61.5 -15% | 63.9 -19% | 50.2 7% |
* ... mindre är bättre
| Razer Book 13 FHD i7-1165G7, Iris Xe G7 96EUs, 55 Wh | Dell XPS 13 9310 Core i7 FHD i7-1165G7, Iris Xe G7 96EUs, 52 Wh | Asus Zenbook S UX393JA i7-1065G7, Iris Plus Graphics G7 (Ice Lake 64 EU), 67 Wh | Huawei MateBook X Pro 2020 i7 i7-10510U, GeForce MX250, 57.4 Wh | Microsoft Surface Laptop 3 13 Core i5-1035G7 i5-1035G7, Iris Plus Graphics G7 (Ice Lake 64 EU), 45 Wh | Razer Blade Stealth i7-1065G7 Iris Plus i7-1065G7, Iris Plus Graphics G7 (Ice Lake 64 EU), 53.1 Wh | |
|---|---|---|---|---|---|---|
| Batteridrifttid | 3% | -4% | -8% | -20% | -34% | |
| Reader / Idle (h) | 36.8 | 30 -18% | 38.4 4% | 34.4 -7% | ||
| WiFi v1.3 (h) | 14.8 | 11 -26% | 8.3 -44% | 10.4 -30% | 8.3 -44% | 9.7 -34% |
| Load (h) | 2.1 | 3.2 52% | 2.7 29% | 2.4 14% | 1.9 -10% |
För
Emot
Läs den fullständiga versionen av den här recensionen på engelska här.
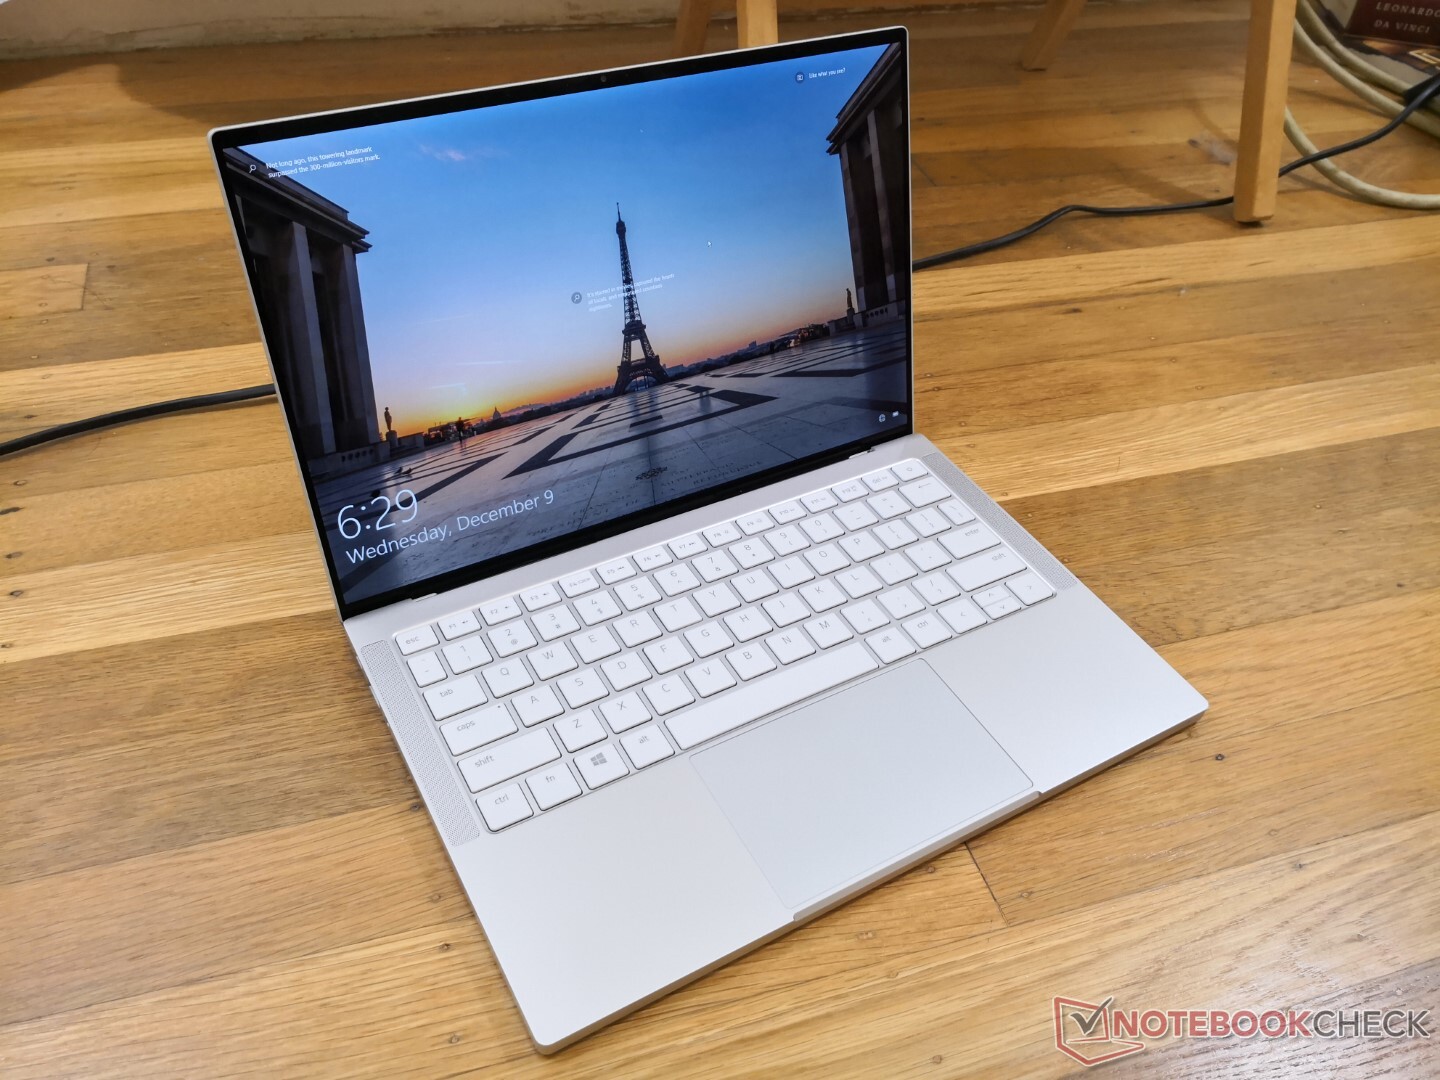
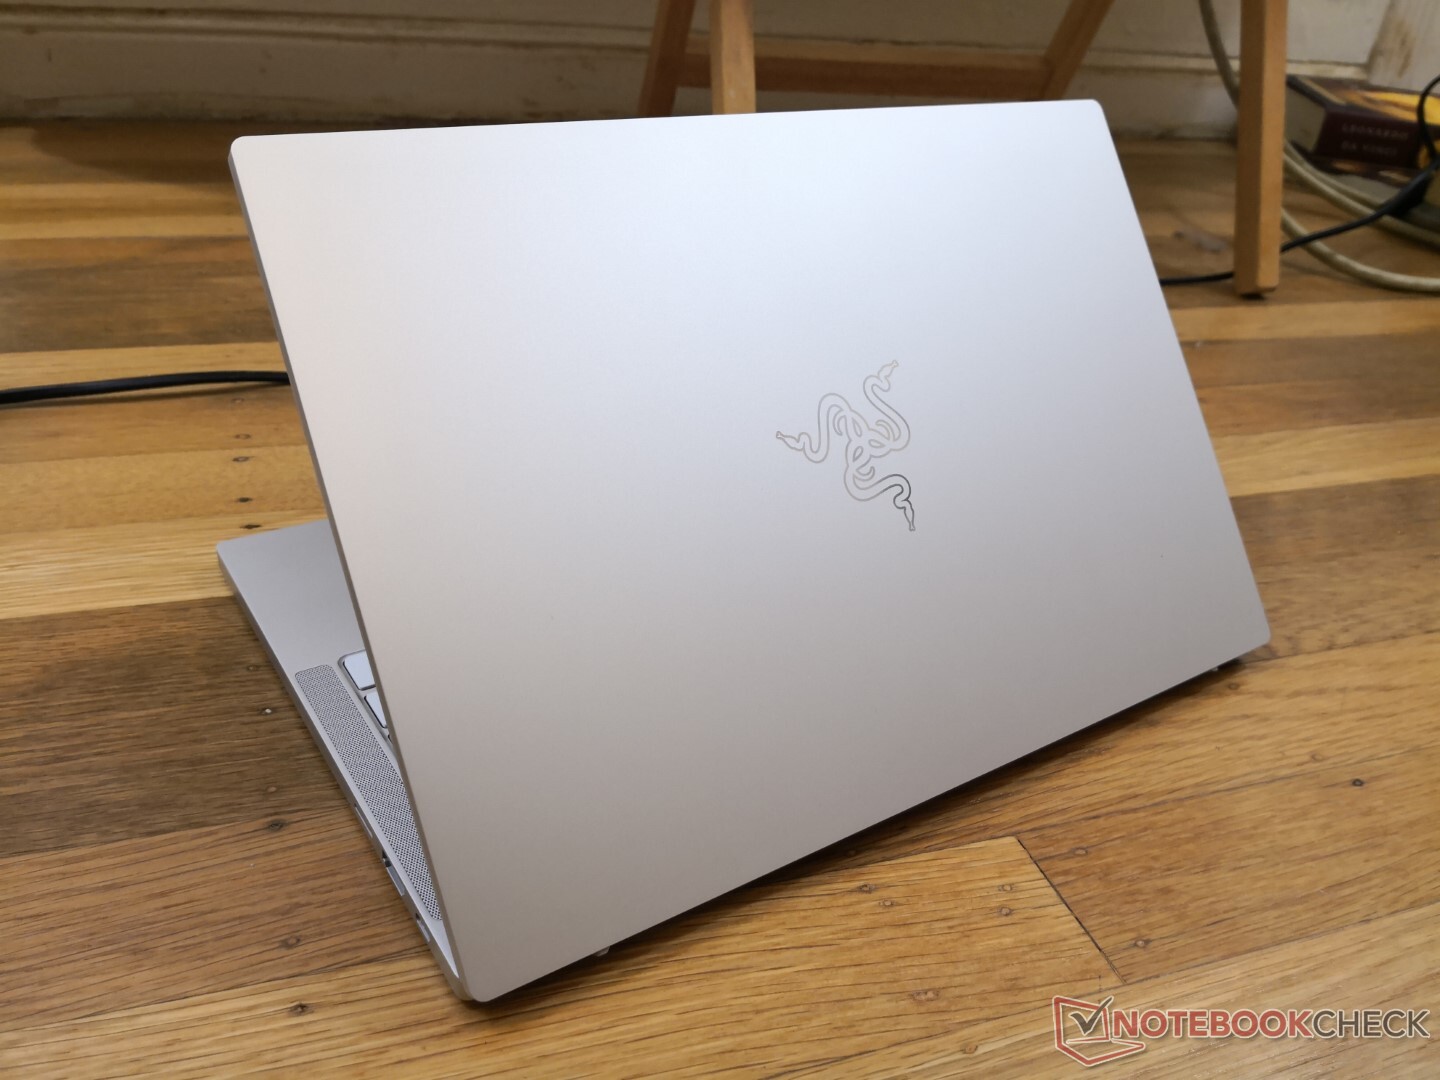
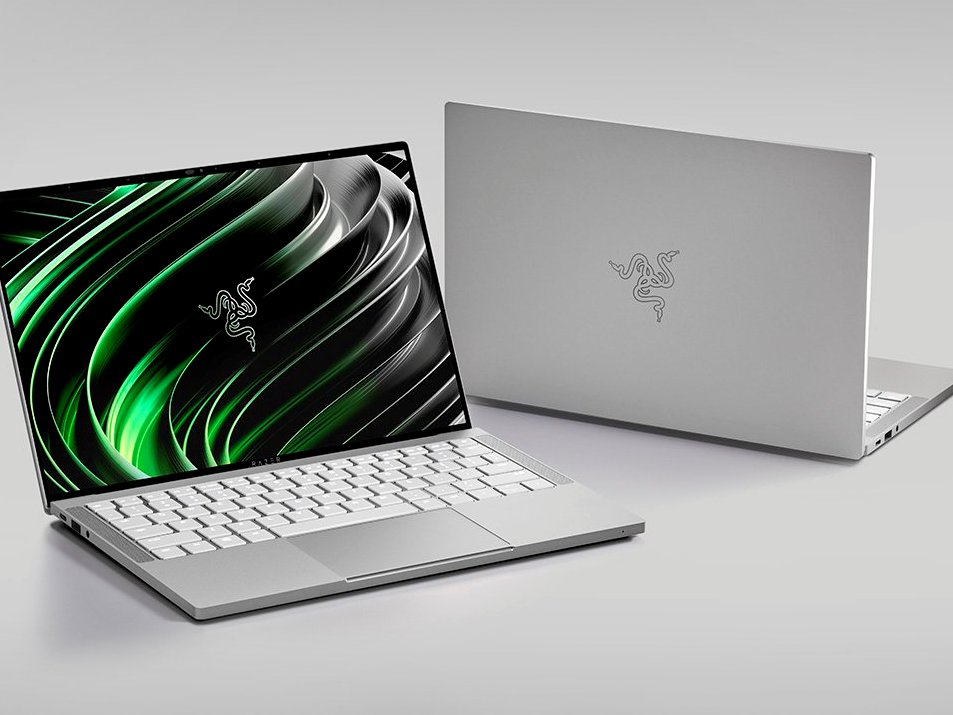
Sätt 16:10-skärmen från Dell XPS 13 i en Razer Blade Stealth och du får i princip en Book 13. Razers nya laptop har det bästa från båda världar och har ett större fokus på prestanda och visuell stil än Dells alternativ. Faktum att den använder samma Core i7-1165G7 processor som XPS 13 men kan köra den 20 till 30 procent snabbare visar hur väl Razer har optimerat chassit för Intels nya 11:e generation. Den är aningen tyngre och tjockare än Dells modell, men de extra hästkrafterna, de extra portarna och den starkare designen kan vara värt det för många.
På den negativa sidan så hoppar Book 13 över en del vanliga säkerhetsfunktioner, exempelvis fingeravtrycksläsare och Kensington-lås. Du hittar heller inte de avancerade vPro-funktionerna eller handsfree-inloggningen som finns på Latitude 7400 eller HP EliteBook x360 1030 G7. De RGB-belysta knapparna, om än visuellt sett tilltalande, har svagare återkoppling än knapparna på de flesta andra kontorsklassade subnotebook-modellerna. Vi kanske är lite gammaldags, men dedikerade musknappar och gångjärn med bredare vinklar, likt på de flesta av Lenovos ThinkPad-modeller, känns i slutändan mer ergonomiskt när man använder datorn i farten. Om du däremot istället prioriterar att ha den snyggaste och snabbaste kontorsdatorn på 13 tum kommer Book 13 stolt att fylla det behovet.
Razer Book 13 är en enastående Intel Evo-laptop vars prestanda och anslutningsmöjligheter backar upp det skarpa utseendet. Den saknar däremot en del säkerhetsfunktioner här och där och det grunda tangentbordet och den svampiga klickplattan är inte lika bra som på de flesta andra bärbara kontorsdatorerna.
Razer Book 13 FHD
- 12/13/2020 v7 (old)
Allen Ngo
Price comparison
