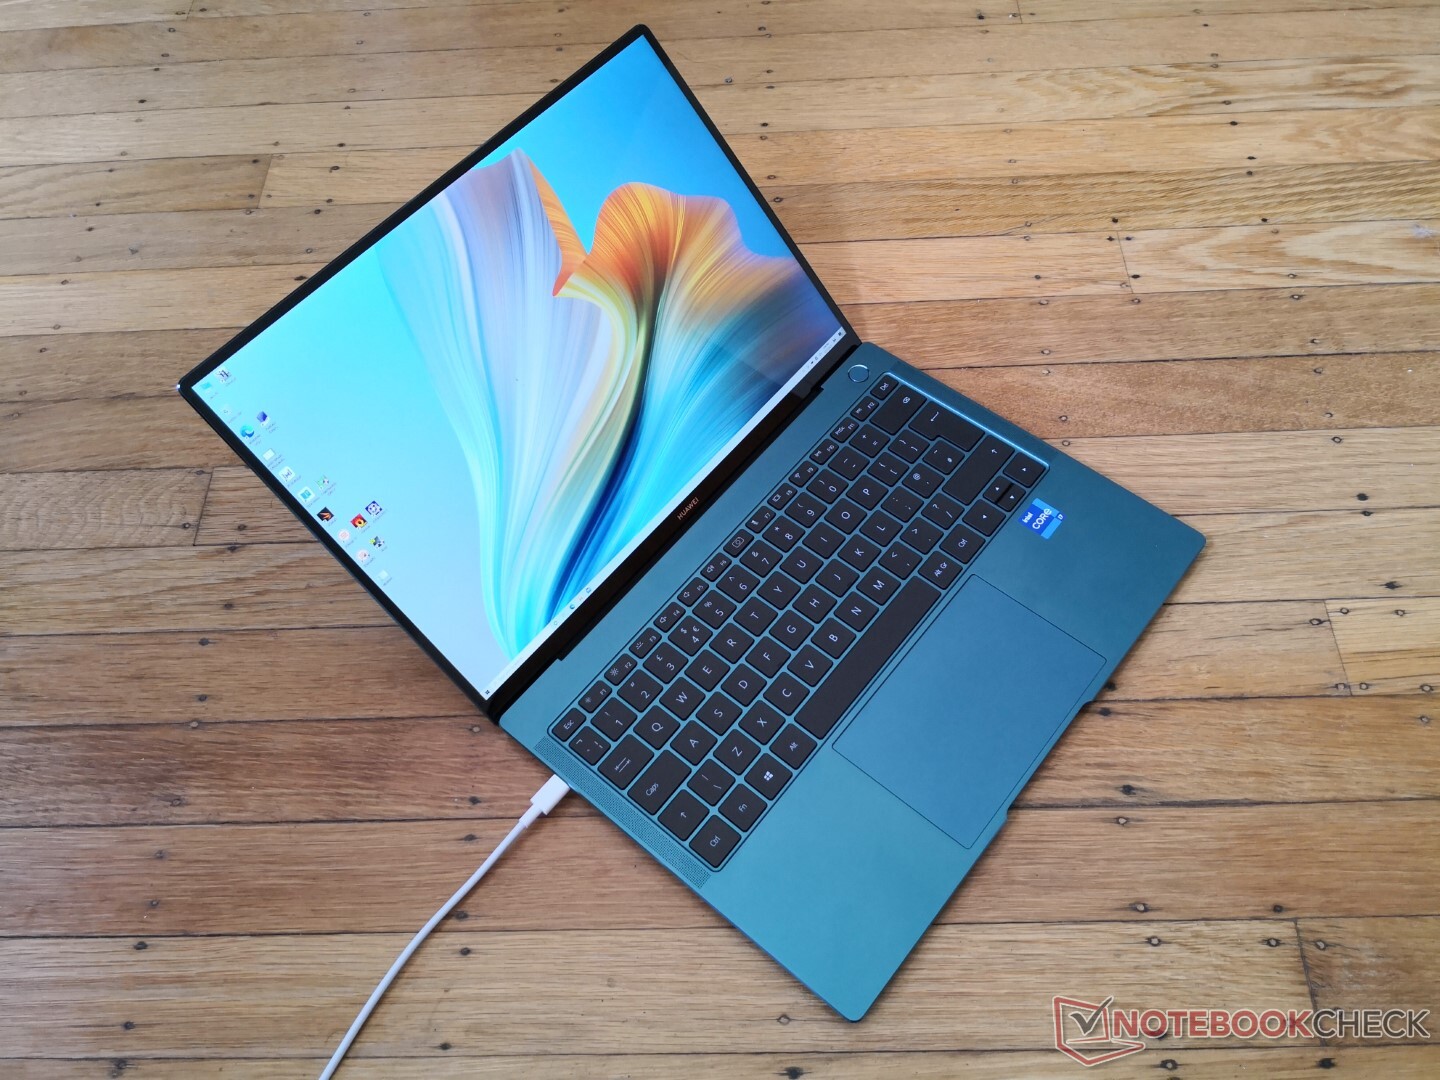
Huawei MateBook X Pro 2021 Tiger Lake Laptop Review: Now Shipping Worldwide ↺
Testgrupp
Gradering | Datum | Modell | Vikt | Höjd | Storlek | Upplösning | Pris |
|---|---|---|---|---|---|---|---|
| 87.8 % v7 (old) | 03/2021 | Huawei MateBook X Pro 2021 i7-1165G7, Iris Xe G7 96EUs | 1.3 kg | 14.6 mm | 13.90" | 3000x2000 | |
| 87.4 % v7 (old) | 06/2020 | Huawei MateBook X Pro 2020 i7 i7-10510U, GeForce MX250 | 1.3 kg | 14.6 mm | 13.90" | 3000x2000 | |
| 87.4 % v7 (old) | 12/2020 | Dell XPS 13 9310 Core i7 4K i7-1185G7, Iris Xe G7 96EUs | 1.3 kg | 14.8 mm | 13.40" | 3840x2400 | |
| 84 % v7 (old) | 02/2020 | Microsoft Surface Laptop 3 13 Core i5-1035G7 i5-1035G7, Iris Plus Graphics G7 (Ice Lake 64 EU) | 1.3 kg | 14.5 mm | 13.50" | 2256x1504 | |
| 85.5 % v7 (old) | 04/2021 | Razer Blade Stealth i7-1165G7 GTX 1650 Ti Max-Q i7-1165G7, GeForce GTX 1650 Ti Max-Q | 1.4 kg | 15.3 mm | 13.30" | 1920x1080 | |
| 85.3 % v7 (old) | 08/2020 | Lenovo Yoga Slim 7-14ARE R7 4800U, Vega 8 | 1.4 kg | 14.9 mm | 14.00" | 1920x1080 |


| |||||||||||||||||||||||||
Distribution av ljusstyrkan: 89 %
Mitt på batteriet: 502 cd/m²
Kontrast: 1521:1 (Svärta: 0.33 cd/m²)
ΔE ColorChecker Calman: 1.35 | ∀{0.5-29.43 Ø4.71}
calibrated: 1.2
ΔE Greyscale Calman: 1.7 | ∀{0.09-98 Ø4.96}
94.3% sRGB (Argyll 1.6.3 3D)
61.1% AdobeRGB 1998 (Argyll 1.6.3 3D)
66.3% AdobeRGB 1998 (Argyll 3D)
94.4% sRGB (Argyll 3D)
64.9% Display P3 (Argyll 3D)
Gamma: 2.24
CCT: 6440 K
| Huawei MateBook X Pro 2021 TIANMA XM, IPS, 13.9", 3000x2000 | Huawei MateBook X Pro 2020 i7 JDI LPM139M422A, LTPS, 13.9", 3000x2000 | Dell XPS 13 9310 Core i7 4K Sharp LQ134R1, IPS, 13.4", 3840x2400 | Microsoft Surface Laptop 3 13 Core i5-1035G7 Sharp LQ135P1JX51, IPS, 13.5", 2256x1504 | Razer Blade Stealth i7-1165G7 GTX 1650 Ti Max-Q Sharp LQ133M1JW46, IPS, 13.3", 1920x1080 | Lenovo Yoga Slim 7-14ARE AU Optronics B140HAN06.8, IPS, 14", 1920x1080 | |
|---|---|---|---|---|---|---|
| Display | 4% | 16% | 2% | 2% | 8% | |
| Display P3 Coverage (%) | 64.9 | 66.6 3% | 80.2 24% | 65.7 1% | 66 2% | 71.7 10% |
| sRGB Coverage (%) | 94.4 | 99.4 5% | 100 6% | 98.6 4% | 97.4 3% | 99.3 5% |
| AdobeRGB 1998 Coverage (%) | 66.3 | 68.6 3% | 78.9 19% | 67.8 2% | 67.1 1% | 72.9 10% |
| Response Times | -25% | -55% | -58% | -48% | -17% | |
| Response Time Grey 50% / Grey 80% * (ms) | 37.6 ? | 49.6 ? -32% | 59.2 ? -57% | 59.2 ? -57% | 57.6 ? -53% | 45.6 ? -21% |
| Response Time Black / White * (ms) | 26.4 ? | 30.8 ? -17% | 40.4 ? -53% | 41.6 ? -58% | 37.6 ? -42% | 29.6 ? -12% |
| PWM Frequency (Hz) | 29070 ? | 2137 ? | 21740 ? | |||
| Screen | 8% | -23% | 5% | -19% | -45% | |
| Brightness middle (cd/m²) | 502 | 557 11% | 508.7 1% | 403.4 -20% | 356.8 -29% | 399.6 -20% |
| Brightness (cd/m²) | 474 | 532 12% | 479 1% | 397 -16% | 336 -29% | 385 -19% |
| Brightness Distribution (%) | 89 | 87 -2% | 84 -6% | 89 0% | 88 -1% | 89 0% |
| Black Level * (cd/m²) | 0.33 | 0.33 -0% | 0.3 9% | 0.34 -3% | 0.34 -3% | 0.37 -12% |
| Contrast (:1) | 1521 | 1688 11% | 1696 12% | 1186 -22% | 1049 -31% | 1080 -29% |
| Colorchecker dE 2000 * | 1.35 | 1.4 -4% | 2.72 -101% | 0.94 30% | 1.63 -21% | 3.2 -137% |
| Colorchecker dE 2000 max. * | 3.67 | 2.5 32% | 4.7 -28% | 2.92 20% | 5.03 -37% | 6.44 -75% |
| Colorchecker dE 2000 calibrated * | 1.2 | 0.7 42% | 1.92 -60% | 0.99 17% | 1.08 10% | 1.73 -44% |
| Greyscale dE 2000 * | 1.7 | 2 -18% | 3.4 -100% | 0.9 47% | 3 -76% | 4.7 -176% |
| Gamma | 2.24 98% | 2.14 103% | 2.11 104% | 2.13 103% | 2.23 99% | 2.21 100% |
| CCT | 6440 101% | 6689 97% | 6245 104% | 6620 98% | 6434 101% | 7184 90% |
| Color Space (Percent of AdobeRGB 1998) (%) | 61.1 | 62.5 2% | 70.7 16% | 62.3 2% | 62 1% | 66.3 9% |
| Color Space (Percent of sRGB) (%) | 94.3 | 99.5 6% | 100 6% | 98.7 5% | 97.6 3% | 99.5 6% |
| Totalt genomsnitt (program/inställningar) | -4% /
3% | -21% /
-19% | -17% /
-3% | -22% /
-19% | -18% /
-32% |
* ... mindre är bättre
Visa svarstider
| ↔ Svarstid svart till vitt | ||
|---|---|---|
| 26.4 ms ... stiga ↗ och falla ↘ kombinerat | ↗ 11.6 ms stiga | 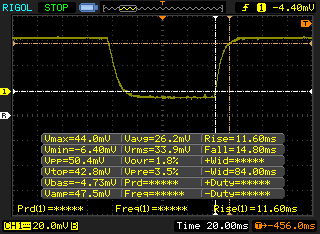 |
| ↘ 14.8 ms hösten | ||
| Skärmen visar relativt långsamma svarsfrekvenser i våra tester och kan vara för långsam för spelare. I jämförelse sträcker sig alla testade enheter från 0.1 (minst) till 240 (maximalt) ms. » 66 % av alla enheter är bättre. Detta innebär att den uppmätta svarstiden är sämre än genomsnittet av alla testade enheter (19.8 ms). | ||
| ↔ Svarstid 50 % grått till 80 % grått | ||
| 37.6 ms ... stiga ↗ och falla ↘ kombinerat | ↗ 17.6 ms stiga | 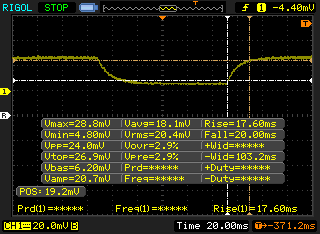 |
| ↘ 20 ms hösten | ||
| Skärmen visar långsamma svarsfrekvenser i våra tester och kommer att vara otillfredsställande för spelare. I jämförelse sträcker sig alla testade enheter från 0.165 (minst) till 636 (maximalt) ms. » 55 % av alla enheter är bättre. Detta innebär att den uppmätta svarstiden är sämre än genomsnittet av alla testade enheter (30.9 ms). | ||
Skärmflimmer / PWM (Puls-Width Modulation)
| Skärmflimmer / PWM upptäcktes inte | 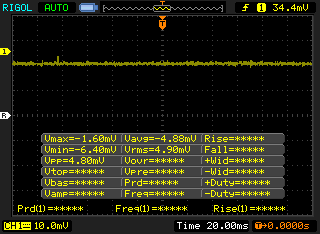 | ||
Som jämförelse: 52 % av alla testade enheter använder inte PWM för att dämpa skärmen. Om PWM upptäcktes mättes ett medelvärde av 7741 (minst: 5 - maximum: 343500) Hz. | |||
Cinebench R15: CPU Multi 64Bit | CPU Single 64Bit
Blender: v2.79 BMW27 CPU
7-Zip 18.03: 7z b 4 -mmt1 | 7z b 4
Geekbench 5.5: Single-Core | Multi-Core
HWBOT x265 Benchmark v2.2: 4k Preset
LibreOffice : 20 Documents To PDF
R Benchmark 2.5: Overall mean
| Cinebench R20 / CPU (Multi Core) | |
| Lenovo Yoga Slim 7-14ARE | |
| Lenovo Yoga Slim 7 14ARE05 82A20008GE | |
| Dell XPS 13 7390 Core i7-10710U | |
| Honor MagicBook 14, Ryzen 5 4500U | |
| HP Envy 14-eb0010nr | |
| Genomsnitt Intel Core i7-1165G7 (1060 - 2657, n=81) | |
| Dell XPS 13 9310 Core i7 4K | |
| Microsoft Surface Laptop 3 13 Core i5-1035G7 | |
| Huawei MateBook X Pro 2021 | |
| Asus Zenbook S UX393JA | |
| Acer Swift 3 SF314-42-R27B | |
| Asus ZenBook 14 UX434FL-DB77 | |
| Huawei MateBook X Pro 2020 i7 | |
| Cinebench R20 / CPU (Single Core) | |
| Dell XPS 13 9310 Core i7 4K | |
| Genomsnitt Intel Core i7-1165G7 (442 - 589, n=81) | |
| Huawei MateBook X Pro 2021 | |
| HP Envy 14-eb0010nr | |
| Lenovo Yoga Slim 7-14ARE | |
| Lenovo Yoga Slim 7 14ARE05 82A20008GE | |
| Dell XPS 13 7390 Core i7-10710U | |
| Asus Zenbook S UX393JA | |
| Asus ZenBook 14 UX434FL-DB77 | |
| Honor MagicBook 14, Ryzen 5 4500U | |
| Microsoft Surface Laptop 3 13 Core i5-1035G7 | |
| Acer Swift 3 SF314-42-R27B | |
| Huawei MateBook X Pro 2020 i7 | |
| Geekbench 5.5 / Single-Core | |
| Dell XPS 13 9310 Core i7 4K | |
| Genomsnitt Intel Core i7-1165G7 (1302 - 1595, n=77) | |
| Huawei MateBook X Pro 2021 | |
| HP Envy 14-eb0010nr | |
| Asus Zenbook S UX393JA | |
| Asus ZenBook 14 UX434FL-DB77 | |
| Lenovo Yoga Slim 7-14ARE | |
| Lenovo Yoga Slim 7-14ARE | |
| Lenovo Yoga Slim 7 14ARE05 82A20008GE | |
| Honor MagicBook 14, Ryzen 5 4500U | |
| Acer Swift 3 SF314-42-R27B | |
| Huawei MateBook X Pro 2020 i7 | |
| Geekbench 5.5 / Multi-Core | |
| Lenovo Yoga Slim 7-14ARE | |
| Lenovo Yoga Slim 7-14ARE | |
| Lenovo Yoga Slim 7 14ARE05 82A20008GE | |
| Dell XPS 13 9310 Core i7 4K | |
| Huawei MateBook X Pro 2021 | |
| Genomsnitt Intel Core i7-1165G7 (3078 - 5926, n=77) | |
| Honor MagicBook 14, Ryzen 5 4500U | |
| HP Envy 14-eb0010nr | |
| Asus Zenbook S UX393JA | |
| Acer Swift 3 SF314-42-R27B | |
| Asus ZenBook 14 UX434FL-DB77 | |
| Huawei MateBook X Pro 2020 i7 | |
| HWBOT x265 Benchmark v2.2 / 4k Preset | |
| Lenovo Yoga Slim 7-14ARE | |
| Lenovo Yoga Slim 7 14ARE05 82A20008GE | |
| HP Envy 14-eb0010nr | |
| Honor MagicBook 14, Ryzen 5 4500U | |
| Genomsnitt Intel Core i7-1165G7 (1.39 - 8.47, n=80) | |
| Dell XPS 13 7390 Core i7-10710U | |
| Dell XPS 13 9310 Core i7 4K | |
| Huawei MateBook X Pro 2021 | |
| Asus ZenBook 14 UX434FL-DB77 | |
| Microsoft Surface Laptop 3 13 Core i5-1035G7 | |
| Asus Zenbook S UX393JA | |
| Acer Swift 3 SF314-42-R27B | |
| Huawei MateBook X Pro 2020 i7 | |
| LibreOffice / 20 Documents To PDF | |
| Asus ZenBook 14 UX434FL-DB77 | |
| Lenovo Yoga Slim 7 14ARE05 82A20008GE | |
| Acer Swift 3 SF314-42-R27B | |
| Honor MagicBook 14, Ryzen 5 4500U | |
| Lenovo Yoga Slim 7-14ARE | |
| Huawei MateBook X Pro 2020 i7 | |
| HP Envy 14-eb0010nr | |
| Genomsnitt Intel Core i7-1165G7 (21.5 - 88.1, n=78) | |
| Asus Zenbook S UX393JA | |
| Dell XPS 13 9310 Core i7 4K | |
| Huawei MateBook X Pro 2021 | |
| R Benchmark 2.5 / Overall mean | |
| Asus ZenBook 14 UX434FL-DB77 | |
| Acer Swift 3 SF314-42-R27B | |
| Asus Zenbook S UX393JA | |
| Honor MagicBook 14, Ryzen 5 4500U | |
| Huawei MateBook X Pro 2020 i7 | |
| HP Envy 14-eb0010nr | |
| Lenovo Yoga Slim 7 14ARE05 82A20008GE | |
| Lenovo Yoga Slim 7-14ARE | |
| Dell XPS 13 9310 Core i7 4K | |
| Huawei MateBook X Pro 2021 | |
| Genomsnitt Intel Core i7-1165G7 (0.552 - 1.002, n=80) | |
Cinebench R15: CPU Multi 64Bit | CPU Single 64Bit
Blender: v2.79 BMW27 CPU
7-Zip 18.03: 7z b 4 -mmt1 | 7z b 4
Geekbench 5.5: Single-Core | Multi-Core
HWBOT x265 Benchmark v2.2: 4k Preset
LibreOffice : 20 Documents To PDF
R Benchmark 2.5: Overall mean
* ... mindre är bättre
| PCMark 10 Score | 4870 poäng | |
Hjälp | ||
| DPC Latencies / LatencyMon - interrupt to process latency (max), Web, Youtube, Prime95 | |
| Lenovo Yoga Slim 7-14ARE | |
| Dell XPS 13 9310 Core i7 4K | |
| Huawei MateBook X Pro 2021 | |
| Razer Blade Stealth i7-1165G7 GTX 1650 Ti Max-Q | |
* ... mindre är bättre
| Huawei MateBook X Pro 2021 Samsung PM981a MZVLB1T0HBLR | Huawei MateBook X Pro 2020 i7 Samsung PM981a MZVLB1T0HBLR | Dell XPS 13 9310 Core i7 4K Micron 2300 512GB MTFDHBA512TDV | Microsoft Surface Laptop 3 13 Core i5-1035G7 SK hynix BC501 HFM256GDGTNG | Razer Blade Stealth i7-1165G7 GTX 1650 Ti Max-Q Samsung SSD PM981a MZVLB512HBJQ | Lenovo Yoga Slim 7-14ARE Samsung SSD PM981a MZVLB512HBJQ | |
|---|---|---|---|---|---|---|
| AS SSD | -6% | -41% | -60% | -12% | -14% | |
| Seq Read (MB/s) | 2794 | 2737 -2% | 2144 -23% | 1387 -50% | 2353 -16% | 1658 -41% |
| Seq Write (MB/s) | 2385 | 2530 6% | 1389 -42% | 504 -79% | 1625 -32% | 2464 3% |
| 4K Read (MB/s) | 60.7 | 54 -11% | 49.77 -18% | 42.35 -30% | 57.5 -5% | 59.5 -2% |
| 4K Write (MB/s) | 180.8 | 152.5 -16% | 105 -42% | 120 -34% | 189.3 5% | 128.6 -29% |
| 4K-64 Read (MB/s) | 1768 | 2011 14% | 855 -52% | 497.4 -72% | 1169 -34% | 1576 -11% |
| 4K-64 Write (MB/s) | 1800 | 1260 -30% | 1660 -8% | 354.9 -80% | 1778 -1% | 1986 10% |
| Access Time Read * (ms) | 0.037 | 0.066 -78% | 0.058 -57% | 0.055 -49% | 0.05 -35% | 0.049 -32% |
| Access Time Write * (ms) | 0.073 | 0.024 67% | 0.272 -273% | 0.093 -27% | 0.058 21% | 0.087 -19% |
| Score Read (Points) | 2108 | 2339 11% | 1119 -47% | 678 -68% | 1462 -31% | 1802 -15% |
| Score Write (Points) | 2219 | 1666 -25% | 1904 -14% | 525 -76% | 2130 -4% | 2361 6% |
| Score Total (Points) | 5392 | 5191 -4% | 3570 -34% | 1520 -72% | 4316 -20% | 5133 -5% |
| Copy ISO MB/s (MB/s) | 2065 | 1929 -7% | 764 -63% | 2073 0% | 1588 -23% | |
| Copy Program MB/s (MB/s) | 734 | 1012 38% | 256.1 -65% | 673 -8% | 550 -25% | |
| Copy Game MB/s (MB/s) | 1629 | 1737 7% | 368.4 -77% | 1568 -4% | 1329 -18% | |
| CrystalDiskMark 5.2 / 6 | -14% | -27% | -49% | -13% | -5% | |
| Write 4K (MB/s) | 197.5 | 165.6 -16% | 86 -56% | 112.3 -43% | 151.1 -23% | 146.1 -26% |
| Read 4K (MB/s) | 52.9 | 50.2 -5% | 40.11 -24% | 42.13 -20% | 35.78 -32% | 47.18 -11% |
| Write Seq (MB/s) | 2174 | 1905 -12% | 1738 -20% | 630 -71% | 2122 -2% | 2896 33% |
| Read Seq (MB/s) | 2156 | 1669 -23% | 1553 -28% | 1023 -53% | 2403 11% | 2754 28% |
| Write 4K Q32T1 (MB/s) | 632 | 474.6 -25% | 454.9 -28% | 336.6 -47% | 528 -16% | 425.8 -33% |
| Read 4K Q32T1 (MB/s) | 694 | 508 -27% | 385.4 -44% | 399.6 -42% | 430.2 -38% | 514 -26% |
| Write Seq Q32T1 (MB/s) | 3017 | 3007 0% | 2784 -8% | 821 -73% | 2986 -1% | 2989 -1% |
| Read Seq Q32T1 (MB/s) | 3561 | 3556 0% | 3217 -10% | 2030 -43% | 3540 -1% | 3568 0% |
| Totalt genomsnitt (program/inställningar) | -10% /
-9% | -34% /
-36% | -55% /
-56% | -13% /
-12% | -10% /
-11% |
* ... mindre är bättre

DiskSpd Read Loop, Queue Depth 8
| 3DMark 11 Performance | 6234 poäng | |
| 3DMark Cloud Gate Standard Score | 15620 poäng | |
| 3DMark Fire Strike Score | 4401 poäng | |
| 3DMark Time Spy Score | 1572 poäng | |
Hjälp | ||
| låg | med. | hög | ultra | |
|---|---|---|---|---|
| GTA V (2015) | 70.6 | 61.4 | 22.8 | 10 |
| The Witcher 3 (2015) | 69.5 | 46.6 | 27.1 | 12.8 |
| Dota 2 Reborn (2015) | 77.3 | 47.6 | 38.2 | 37.7 |
| Final Fantasy XV Benchmark (2018) | 31.4 | 18.1 | 13.8 | |
| X-Plane 11.11 (2018) | 23.2 | 31.8 | 29.2 | |
| Far Cry 5 (2018) | 39 | 21 | 20 | 18 |
| Strange Brigade (2018) | 79.5 | 34.6 | 27.4 | 22.5 |
| Huawei MateBook X Pro 2021 Iris Xe G7 96EUs, i7-1165G7, Samsung PM981a MZVLB1T0HBLR | Huawei MateBook X Pro 2020 i7 GeForce MX250, i7-10510U, Samsung PM981a MZVLB1T0HBLR | Dell XPS 13 9310 Core i7 4K Iris Xe G7 96EUs, i7-1185G7, Micron 2300 512GB MTFDHBA512TDV | Microsoft Surface Laptop 3 13 Core i5-1035G7 Iris Plus Graphics G7 (Ice Lake 64 EU), i5-1035G7, SK hynix BC501 HFM256GDGTNG | Razer Blade Stealth i7-1165G7 GTX 1650 Ti Max-Q GeForce GTX 1650 Ti Max-Q, i7-1165G7, Samsung SSD PM981a MZVLB512HBJQ | Lenovo Yoga Slim 7-14ARE Vega 8, R7 4800U, Samsung SSD PM981a MZVLB512HBJQ | |
|---|---|---|---|---|---|---|
| Noise | -17% | -5% | -11% | -16% | -5% | |
| av / miljö * (dB) | 25.4 | 29.6 -17% | 27.7 -9% | 28.5 -12% | 25.3 -0% | 26.3 -4% |
| Idle Minimum * (dB) | 25.6 | 29.6 -16% | 27.8 -9% | 28.5 -11% | 25.3 1% | 26.5 -4% |
| Idle Average * (dB) | 25.6 | 29.6 -16% | 27.8 -9% | 28.5 -11% | 25.3 1% | 26.5 -4% |
| Idle Maximum * (dB) | 25.6 | 30.3 -18% | 27.8 -9% | 28.5 -11% | 27 -5% | 26.5 -4% |
| Load Average * (dB) | 28.7 | 38 -32% | 27.9 3% | 28.5 1% | 47.9 -67% | 31.8 -11% |
| Witcher 3 ultra * (dB) | 32 | 38 -19% | 32.8 -2% | 40.4 -26% | 38.4 -20% | 35.9 -12% |
| Load Maximum * (dB) | 38.2 | 38 1% | 37 3% | 40.4 -6% | 45.9 -20% | 35.9 6% |
* ... mindre är bättre
Ljudnivå
| Låg belastning |
| 25.6 / 25.6 / 25.6 dB(A) |
| Hög belastning |
| 28.7 / 38.2 dB(A) |
 | ||
30 dB tyst 40 dB(A) hörbar 50 dB(A) högt ljud |
||
min: | ||
(±) Den maximala temperaturen på ovansidan är 42.2 °C / 108 F, jämfört med genomsnittet av 35.9 °C / 97 F , allt från 21.4 till 59 °C för klassen Subnotebook.
(±) Botten värms upp till maximalt 40.4 °C / 105 F, jämfört med genomsnittet av 39.2 °C / 103 F
(+) Vid tomgångsbruk är medeltemperaturen för ovansidan 29.2 °C / 85 F, jämfört med enhetsgenomsnittet på 30.8 °C / ### class_avg_f### F.
(+) Handledsstöden och pekplattan når maximal hudtemperatur (35.8 °C / 96.4 F) och är därför inte varma.
(-) Medeltemperaturen för handledsstödsområdet på liknande enheter var 28.2 °C / 82.8 F (-7.6 °C / -13.6 F).
Huawei MateBook X Pro 2021 ljudanalys
(+) | högtalare kan spela relativt högt (82.7 dB)
Bas 100 - 315 Hz
(±) | reducerad bas - i genomsnitt 13.6% lägre än medianen
(±) | linjäriteten för basen är genomsnittlig (10.1% delta till föregående frekvens)
Mellan 400 - 2000 Hz
(+) | balanserad mellan - endast 2.9% från medianen
(+) | mids är linjära (3.3% delta till föregående frekvens)
Högsta 2 - 16 kHz
(+) | balanserade toppar - endast 4.6% från medianen
(±) | linjäriteten för toppar är genomsnittlig (8.2% delta till föregående frekvens)
Totalt 100 - 16 000 Hz
(+) | det totala ljudet är linjärt (11.8% skillnad mot median)
Jämfört med samma klass
» 13% av alla testade enheter i den här klassen var bättre, 4% liknande, 83% sämre
» Den bästa hade ett delta på 5%, genomsnittet var 18%, sämst var 53%
Jämfört med alla testade enheter
» 9% av alla testade enheter var bättre, 3% liknande, 89% sämre
» Den bästa hade ett delta på 4%, genomsnittet var 23%, sämst var 134%
Apple MacBook 12 (Early 2016) 1.1 GHz ljudanalys
(+) | högtalare kan spela relativt högt (83.6 dB)
Bas 100 - 315 Hz
(±) | reducerad bas - i genomsnitt 11.3% lägre än medianen
(±) | linjäriteten för basen är genomsnittlig (14.2% delta till föregående frekvens)
Mellan 400 - 2000 Hz
(+) | balanserad mellan - endast 2.4% från medianen
(+) | mids är linjära (5.5% delta till föregående frekvens)
Högsta 2 - 16 kHz
(+) | balanserade toppar - endast 2% från medianen
(+) | toppar är linjära (4.5% delta till föregående frekvens)
Totalt 100 - 16 000 Hz
(+) | det totala ljudet är linjärt (10.2% skillnad mot median)
Jämfört med samma klass
» 7% av alla testade enheter i den här klassen var bättre, 2% liknande, 90% sämre
» Den bästa hade ett delta på 5%, genomsnittet var 18%, sämst var 53%
Jämfört med alla testade enheter
» 5% av alla testade enheter var bättre, 1% liknande, 94% sämre
» Den bästa hade ett delta på 4%, genomsnittet var 23%, sämst var 134%
| Av/Standby | |
| Låg belastning | |
| Hög belastning |
|
Förklaring:
min: | |
| Huawei MateBook X Pro 2021 i7-1165G7, Iris Xe G7 96EUs, Samsung PM981a MZVLB1T0HBLR, IPS, 3000x2000, 13.9" | Huawei MateBook X Pro 2020 i7 i7-10510U, GeForce MX250, Samsung PM981a MZVLB1T0HBLR, LTPS, 3000x2000, 13.9" | Dell XPS 13 9310 Core i7 4K i7-1185G7, Iris Xe G7 96EUs, Micron 2300 512GB MTFDHBA512TDV, IPS, 3840x2400, 13.4" | Microsoft Surface Laptop 3 13 Core i5-1035G7 i5-1035G7, Iris Plus Graphics G7 (Ice Lake 64 EU), SK hynix BC501 HFM256GDGTNG, IPS, 2256x1504, 13.5" | Razer Blade Stealth i7-1165G7 GTX 1650 Ti Max-Q i7-1165G7, GeForce GTX 1650 Ti Max-Q, Samsung SSD PM981a MZVLB512HBJQ, IPS, 1920x1080, 13.3" | Lenovo Yoga Slim 7-14ARE R7 4800U, Vega 8, Samsung SSD PM981a MZVLB512HBJQ, IPS, 1920x1080, 14" | |
|---|---|---|---|---|---|---|
| Power Consumption | -9% | 7% | 8% | -40% | 5% | |
| Idle Minimum * (Watt) | 6.7 | 4.3 36% | 4.3 36% | 4.4 34% | 4 40% | 4 40% |
| Idle Average * (Watt) | 10 | 8.5 15% | 8.3 17% | 7.5 25% | 6.3 37% | 6.3 37% |
| Idle Maximum * (Watt) | 10.3 | 12 -17% | 8.8 15% | 7.8 24% | 14.5 -41% | 7.7 25% |
| Load Average * (Watt) | 35.7 | 54.8 -54% | 46.2 -29% | 41.9 -17% | 79.2 -122% | 48.3 -35% |
| Witcher 3 ultra * (Watt) | 32.7 | 47.1 -44% | 42.2 -29% | 40.8 -25% | 68.2 -109% | 49 -50% |
| Load Maximum * (Watt) | 67.6 | 61.5 9% | 47.3 30% | 63.9 5% | 99.4 -47% | 57.6 15% |
* ... mindre är bättre
| Huawei MateBook X Pro 2021 i7-1165G7, Iris Xe G7 96EUs, 56 Wh | Huawei MateBook X Pro 2020 i7 i7-10510U, GeForce MX250, 57.4 Wh | Dell XPS 13 9310 Core i7 4K i7-1185G7, Iris Xe G7 96EUs, 52 Wh | Microsoft Surface Laptop 3 13 Core i5-1035G7 i5-1035G7, Iris Plus Graphics G7 (Ice Lake 64 EU), 45 Wh | Razer Blade Stealth i7-1165G7 GTX 1650 Ti Max-Q i7-1165G7, GeForce GTX 1650 Ti Max-Q, 53.1 Wh | Lenovo Yoga Slim 7-14ARE R7 4800U, Vega 8, 61 Wh | |
|---|---|---|---|---|---|---|
| Batteridrifttid | -11% | -31% | 6% | -4% | -7% | |
| Reader / Idle (h) | 19.5 | 34.4 76% | 20.6 6% | 27.1 39% | ||
| WiFi v1.3 (h) | 10.5 | 10.4 -1% | 7.2 -31% | 8.3 -21% | 9 -14% | 10.3 -2% |
| Load (h) | 3 | 2.4 -20% | 1.9 -37% | 1.3 -57% |
För
Emot
Läs den fullständiga versionen av den här recensionen på engelska här.
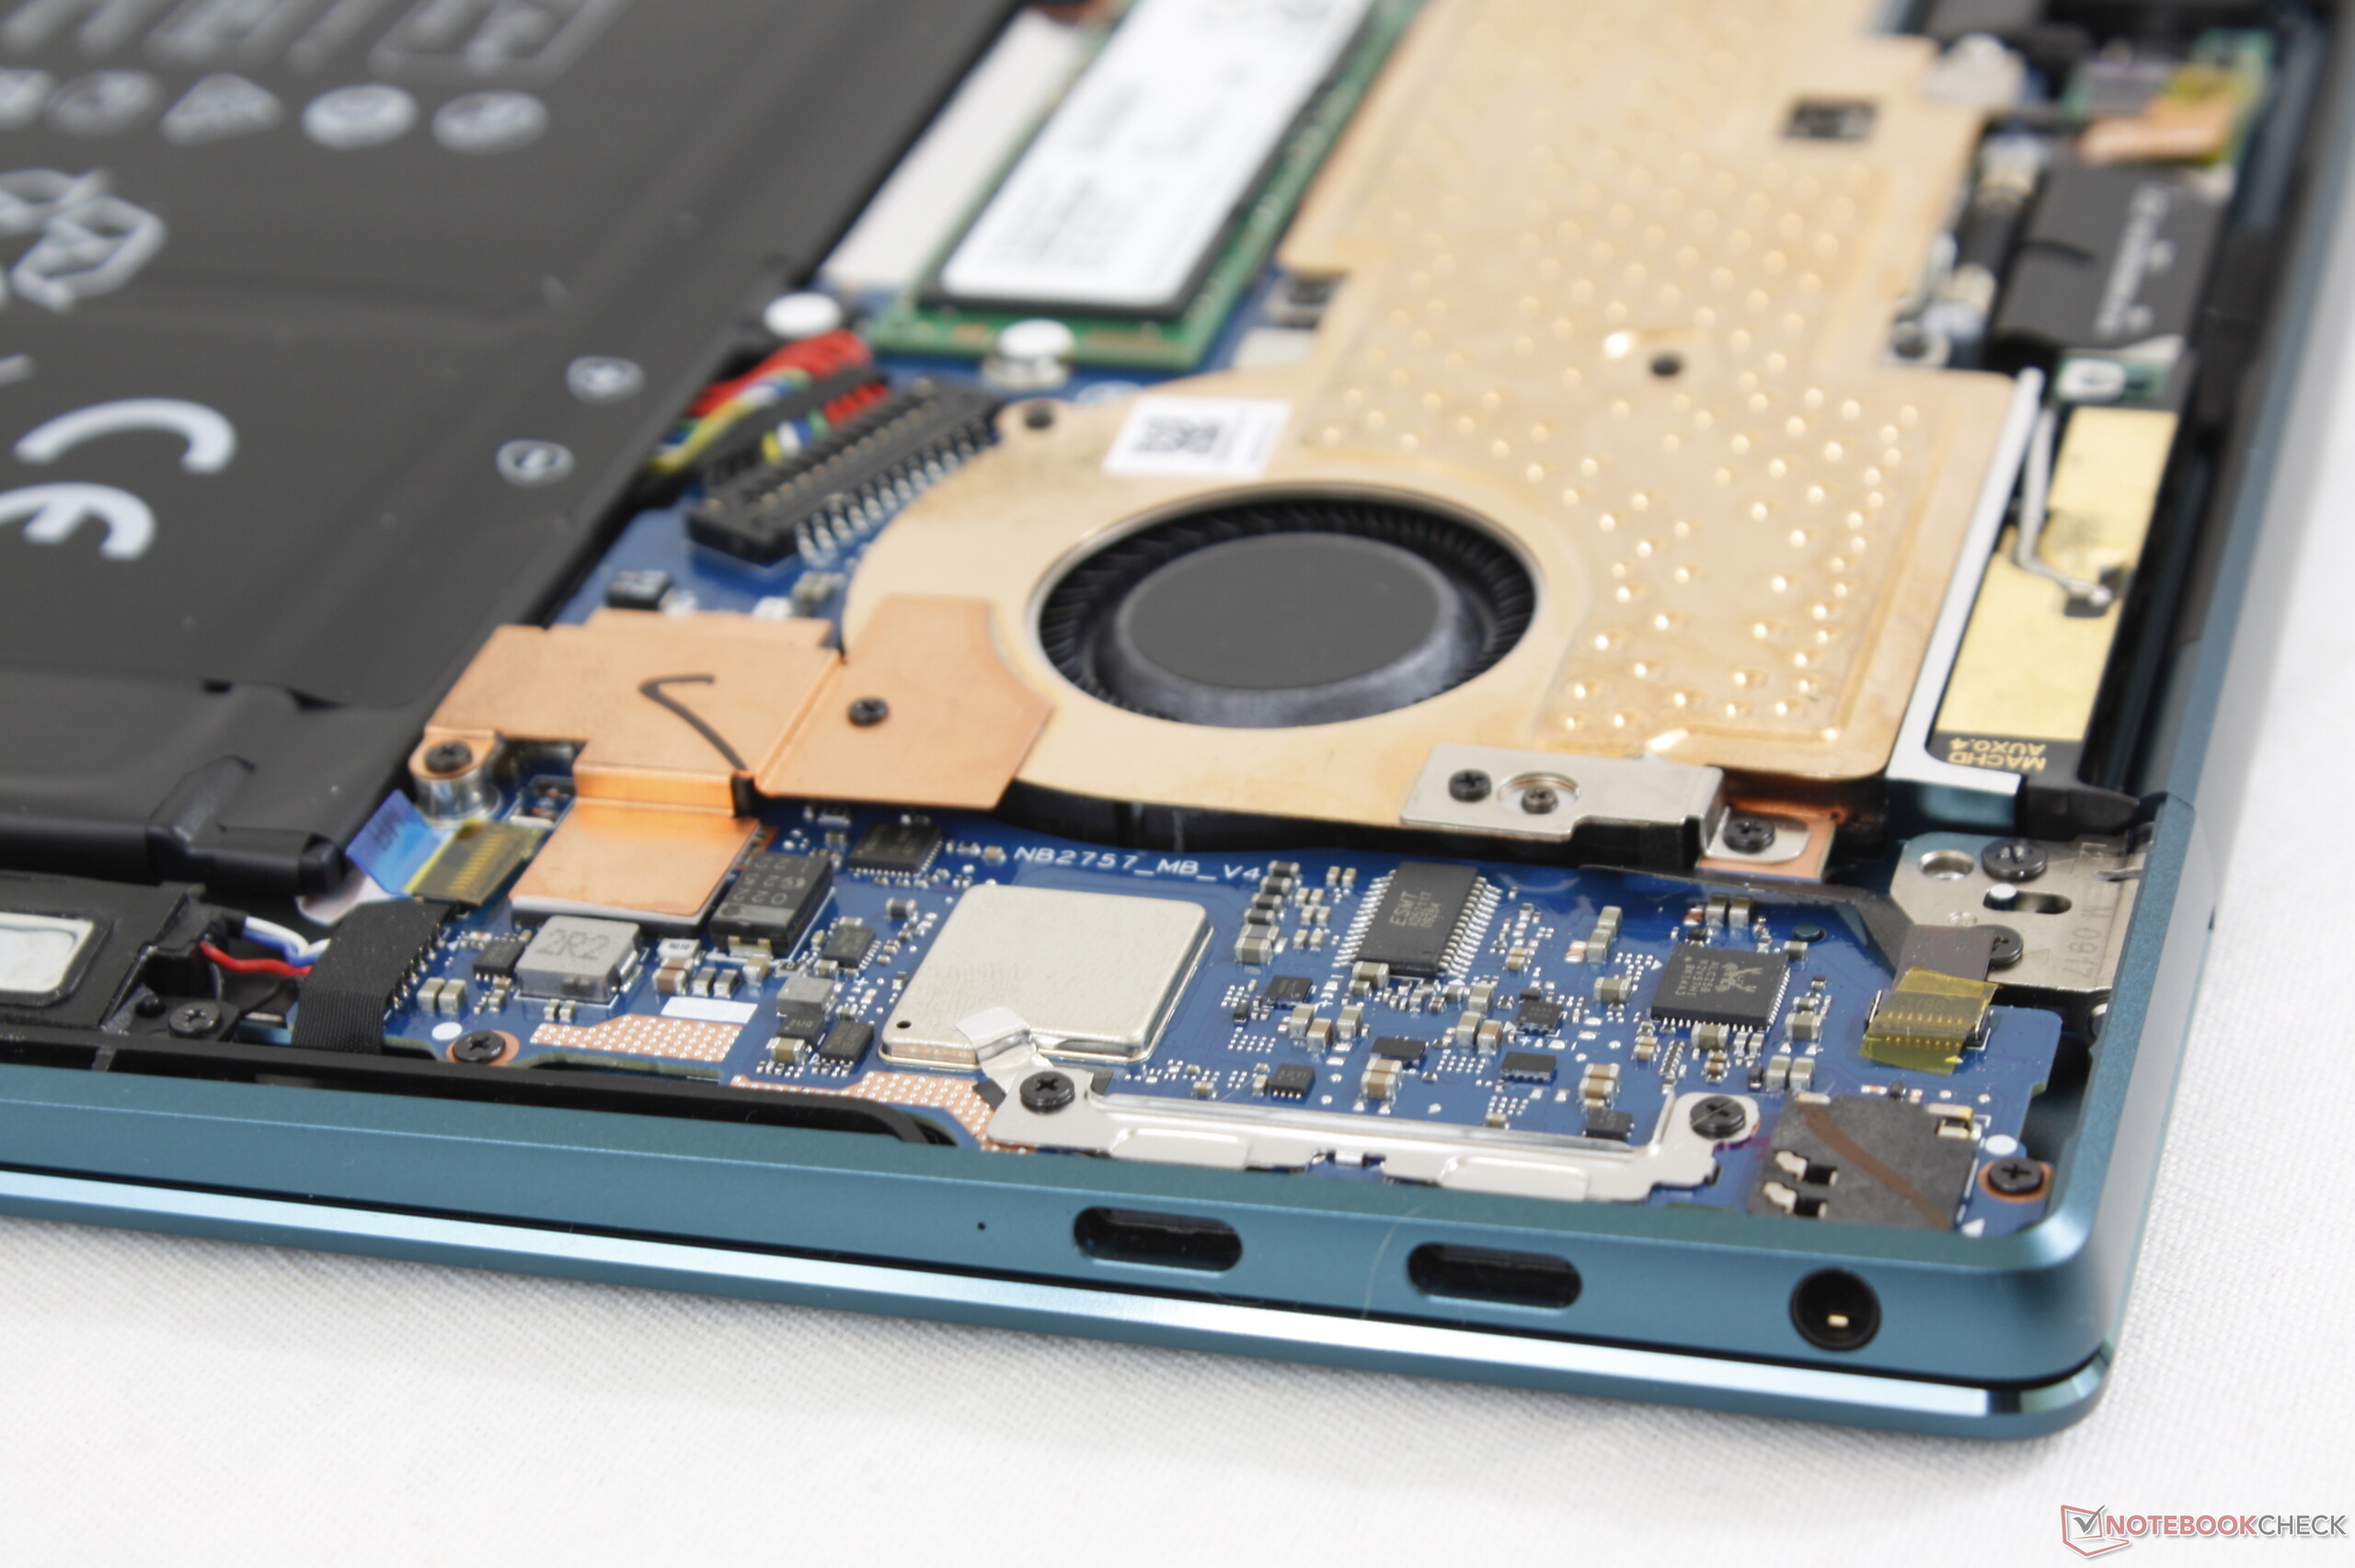
Vi hade hoppats på att ångkammaren skulle ge högre CPU-prestanda, men så verkar inte vara fallet; Core i7-1165G7 körs ungefär 20% långsammare i Huaweis laptop jämfört med de flesta andra modeller med exakt samma CPU. Vi noterade liknande resultat på 2018, 2019 och 2020 års modeller av MateBook X Pro. Detta kommer inte vara ett problem om man helt enkelt vill ha en ultratunn laptop för att surfa, strömma eller syssla med lättare redigering, men vill man ha det bästa som Intel Tiger Lake kan erbjuda får man titta någon annanstans.
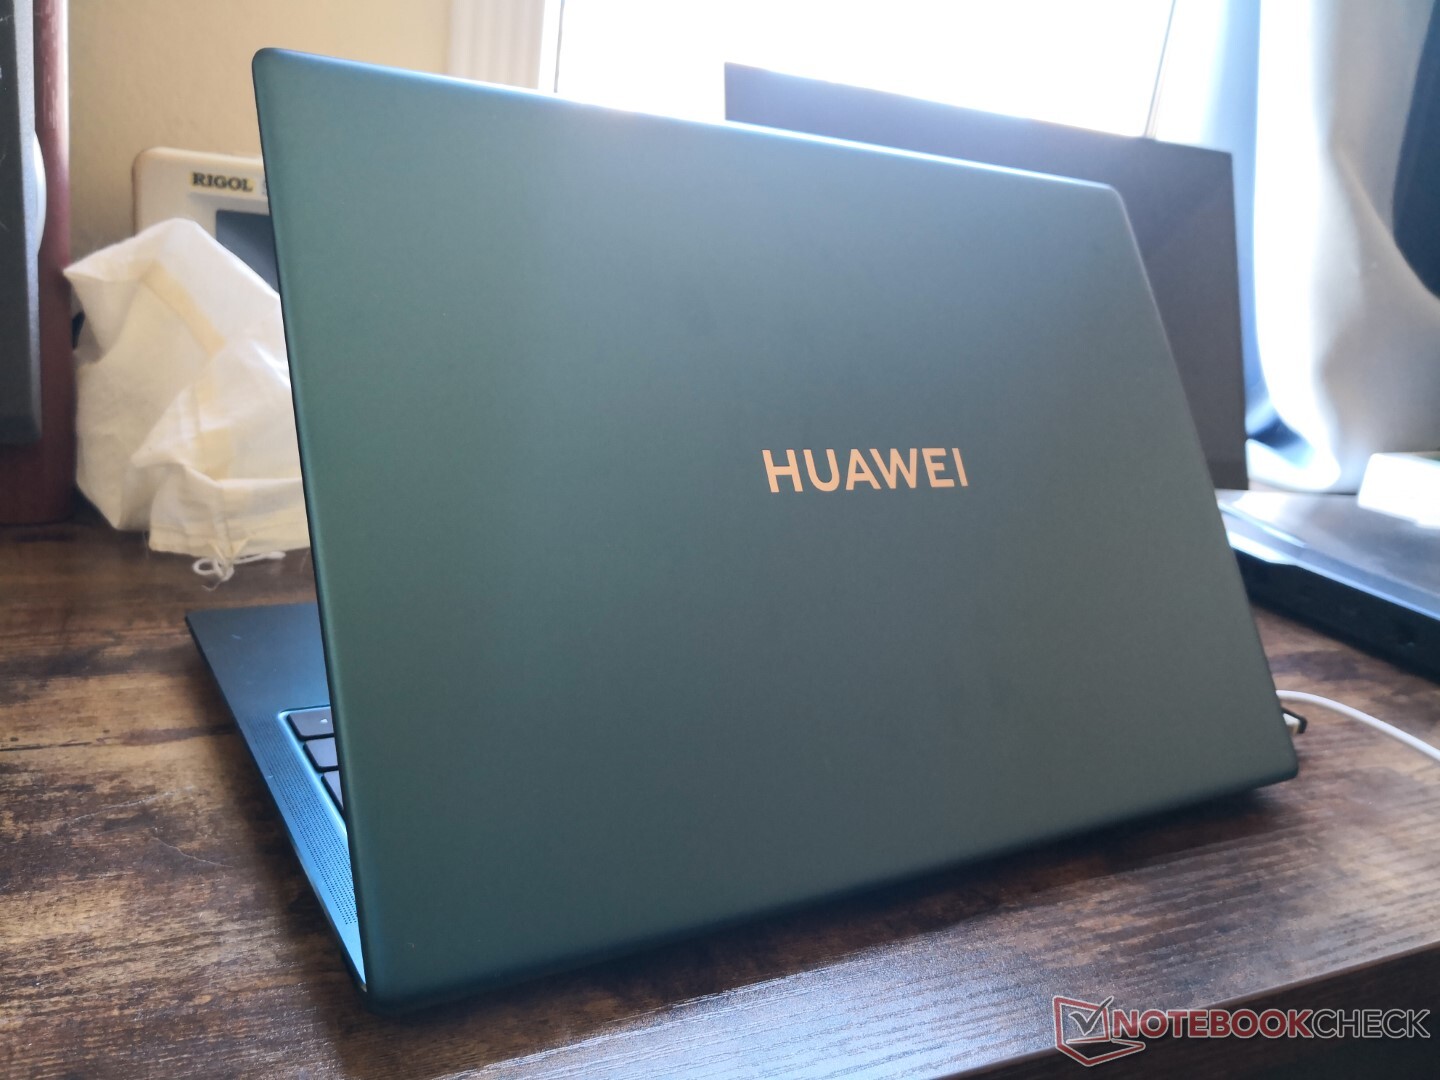
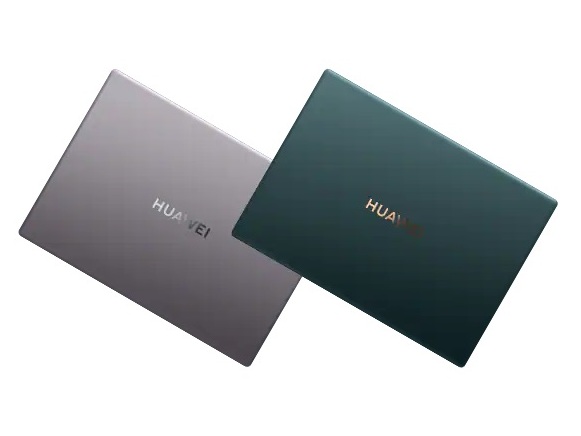
Utmärkt visuell design som hålls tillbaka av en processor som är långsammare än genomsnittet, suboptimal placering av webbkameran samt en mjuk klickplatta.
Åsikterna går isär om klickplattan. Även om den är stor är de integrerade musknapparna svampiga och grunda och gör det svårt att klicka exakt. En extern mus rekommenderas varmt.
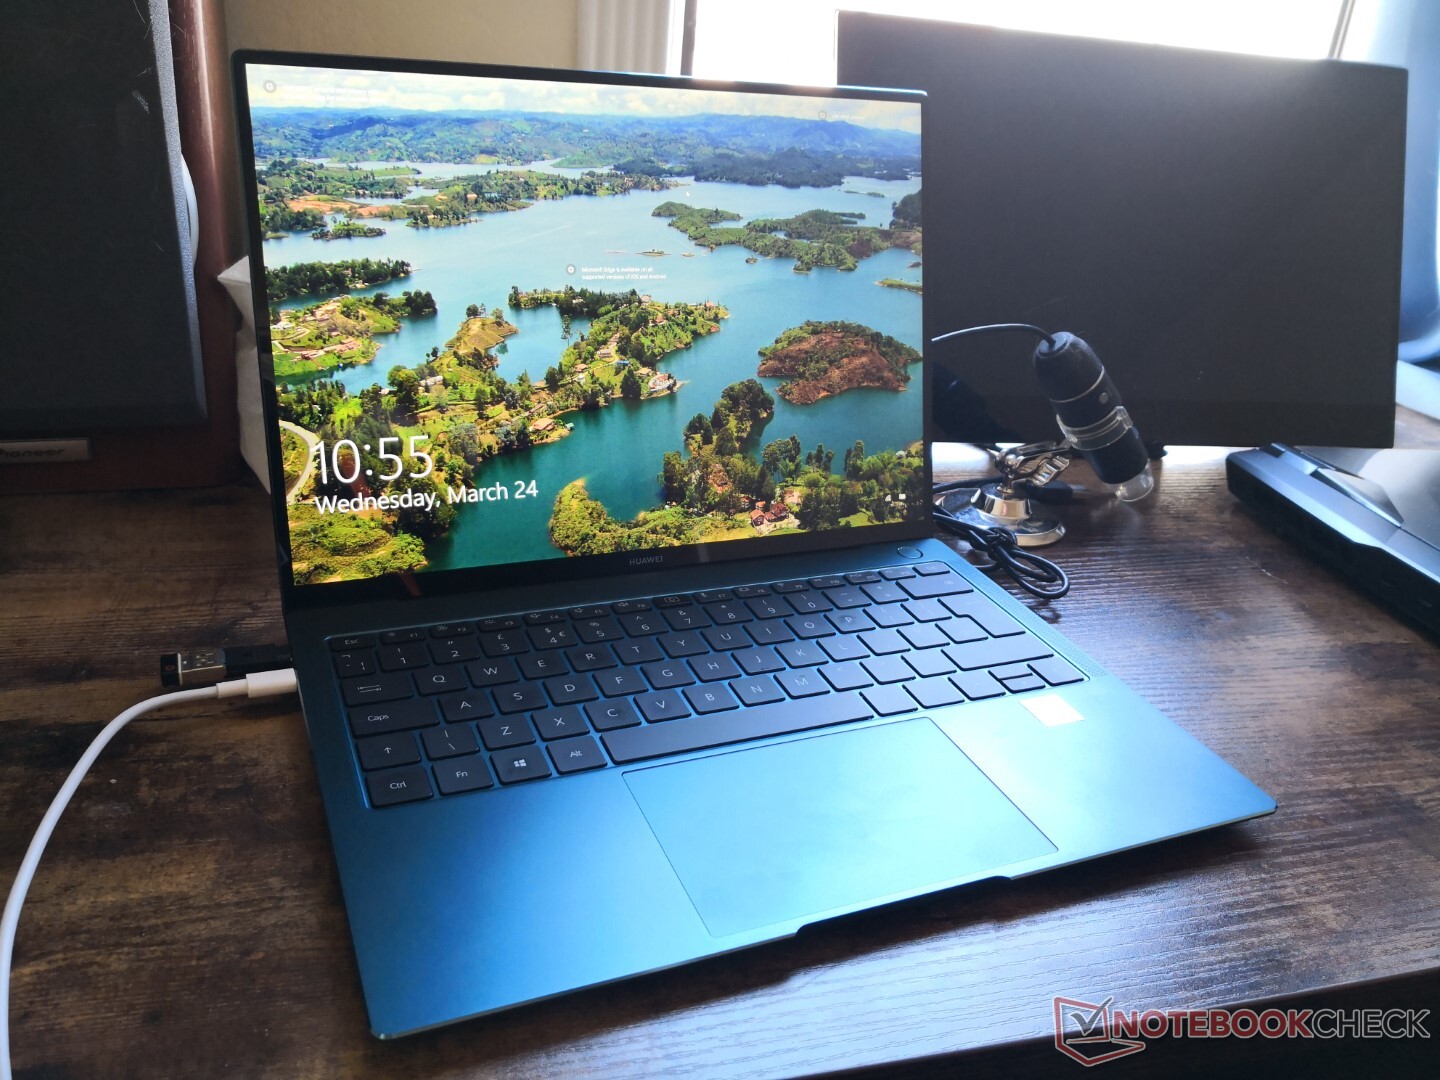
Slutligen måste Huawei göra sig av med den utfällbara webbkameran. Konceptet kändes logiskt 2018 när det inte gick att få plats med webbkameror i ultratunn infattning, men kamerorna i senaste Dell XPS och HP Spectre har gjort Huaweis webbkamera förlegad.
I princip allt annat med den här datorn är bra eller utmärkt för sin kategori, vilket inkluderar en fläkt med låg ljudnivå, en polerad visuell design, relativt svala temperaturer, respektabel batteritid samt en utmärkt 3:2-skärm. Det är synd att den undermåliga processorn, den mjuka klickplattan och den utdaterade webbkameran håller den tillbaka.
Huawei MateBook X Pro 2021
- 03/27/2021 v7 (old)
Allen Ngo
Price comparison
