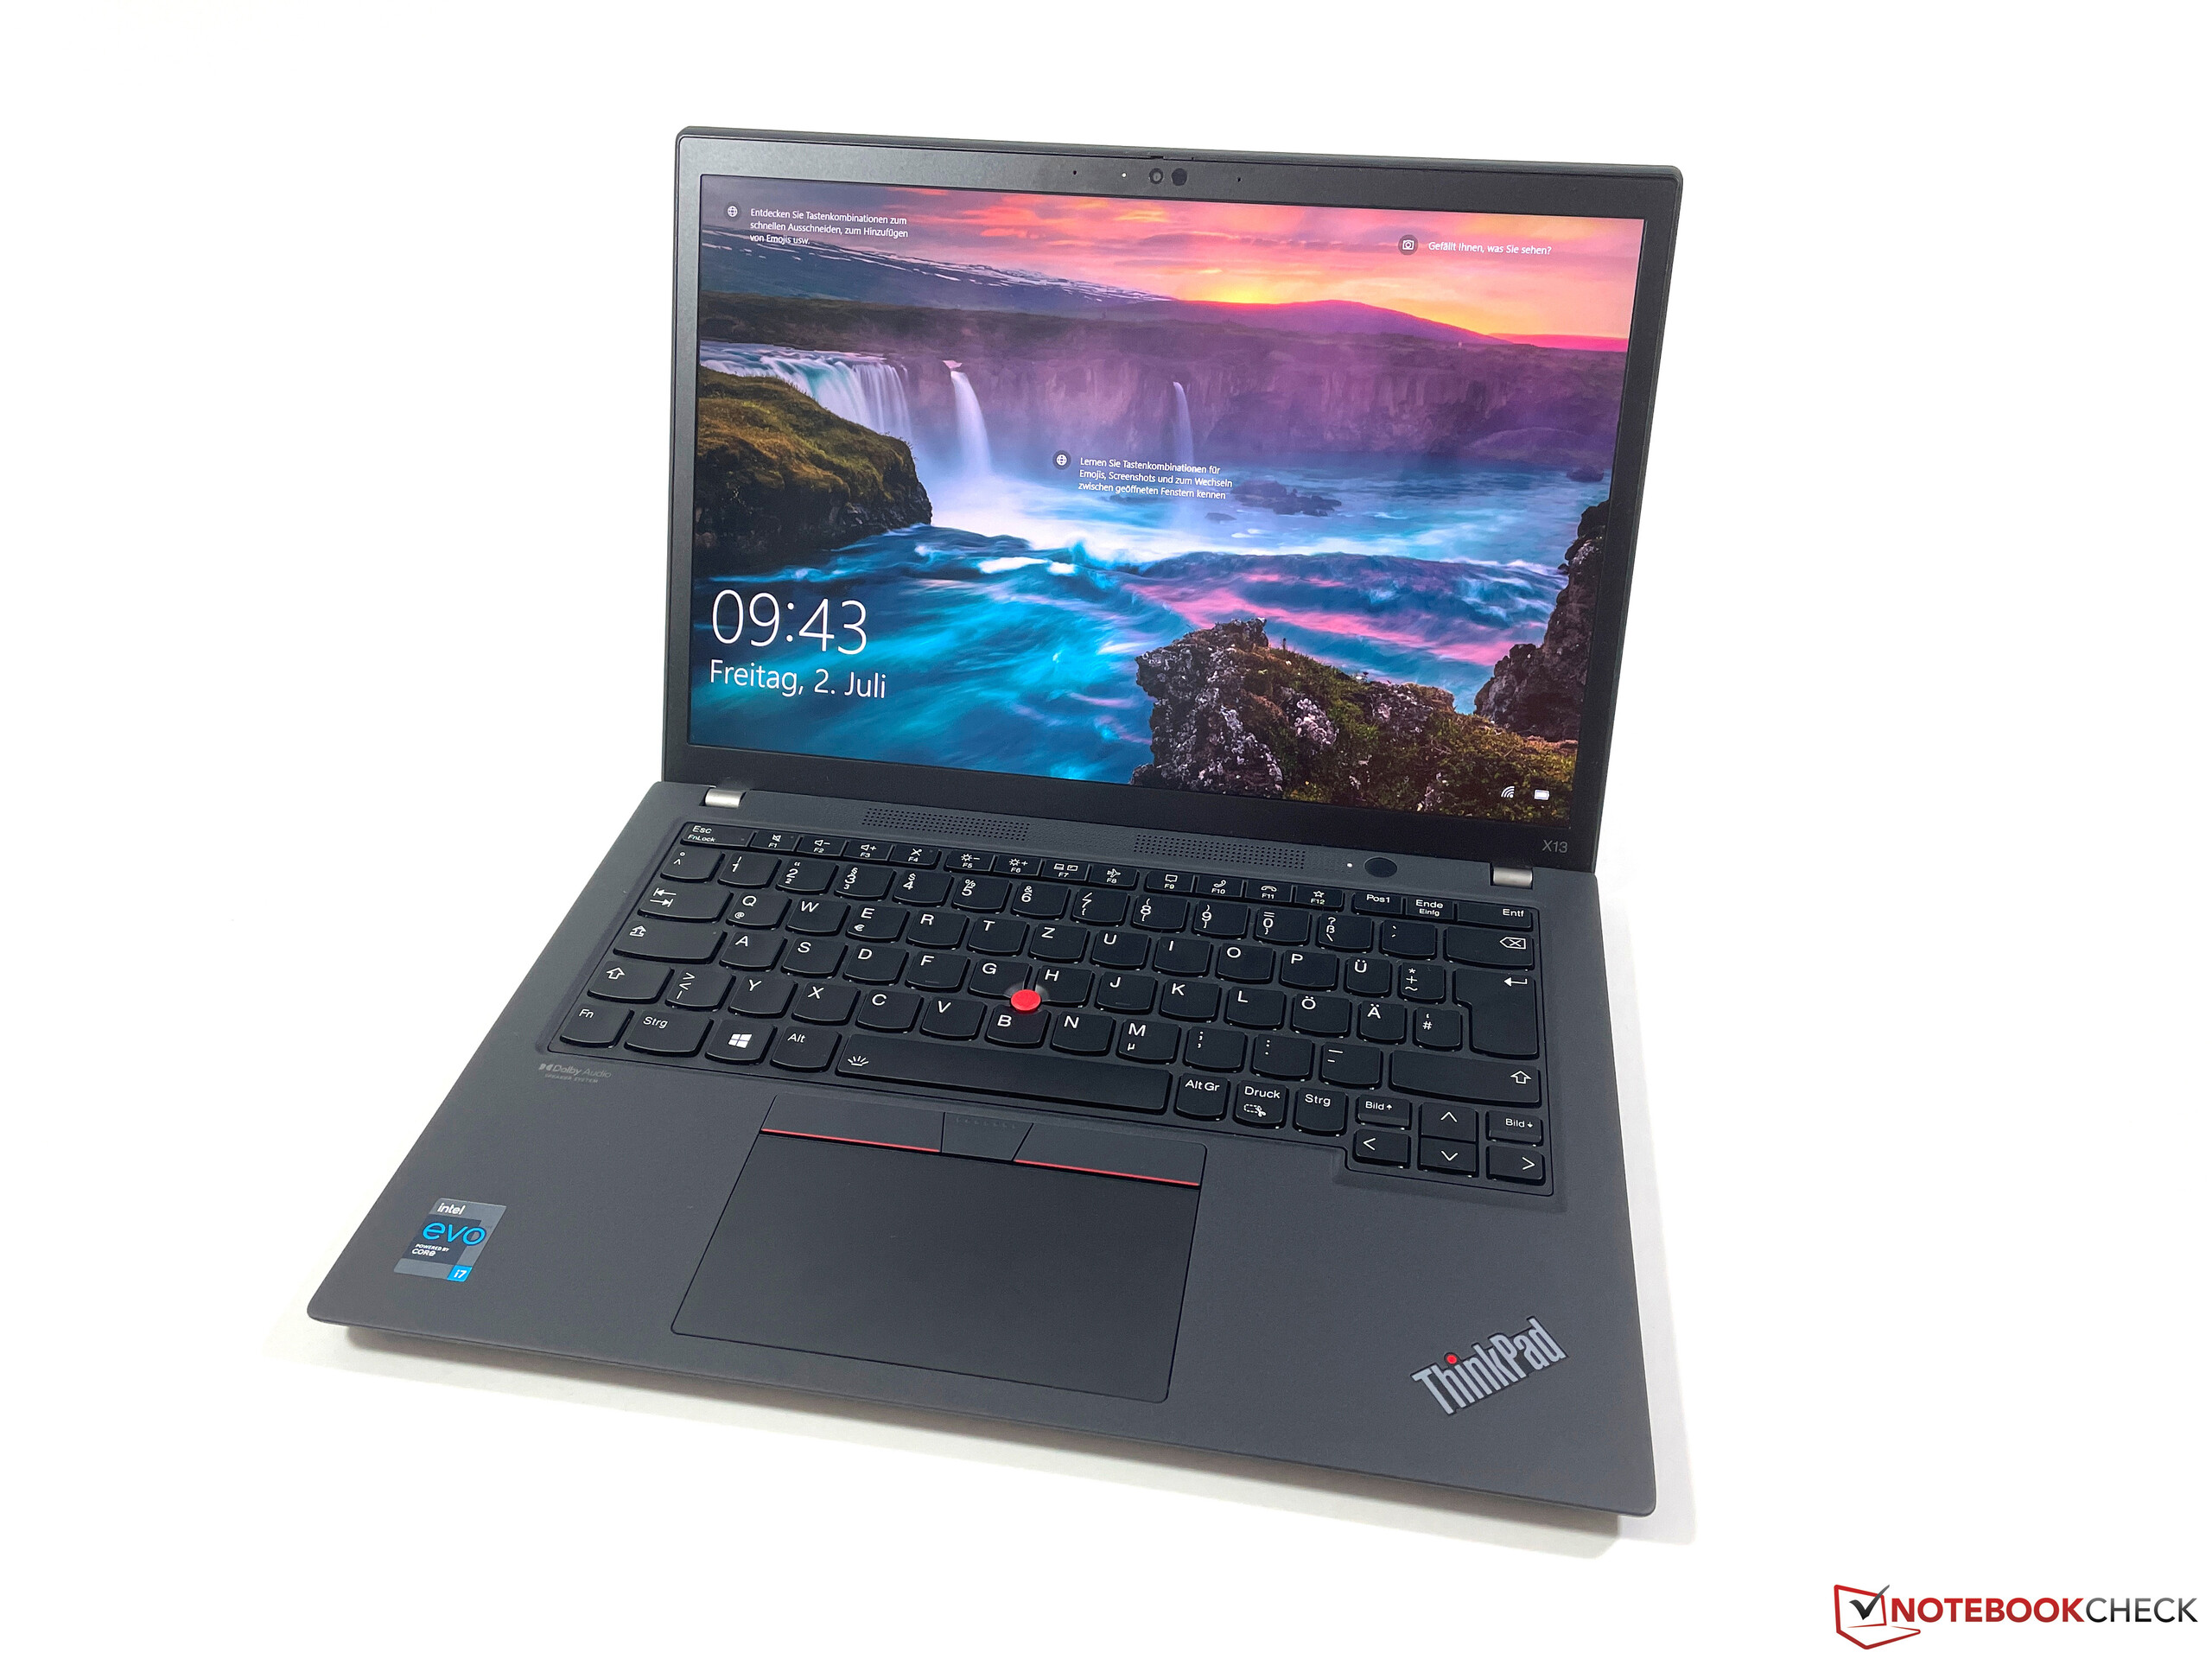
Test: Lenovo ThinkPad X13 G2 - Den perfekta mobila kollegan? (Sammanfattning)
Testgrupp
Gradering | Datum | Modell | Vikt | Höjd | Storlek | Upplösning | Pris |
|---|---|---|---|---|---|---|---|
| 89.3 % v7 (old) | 07/2021 | Lenovo ThinkPad X13 G2 20WK0024GE i7-1165G7, Iris Xe G7 96EUs | 1.3 kg | 18.2 mm | 13.30" | 1920x1200 | |
| 88.1 % v7 (old) | 12/2020 | Dell XPS 13 9310 Core i7 FHD i7-1165G7, Iris Xe G7 96EUs | 1.3 kg | 14.8 mm | 13.40" | 1920x1200 | |
| 91.1 % v7 (old) | 12/2020 | Apple MacBook Pro 13 Late 2020 M1 Entry (8 / 256 GB) M1, M1 8-Core GPU | 1.4 kg | 15.6 mm | 13.30" | 2560x1600 | |
| 88.7 % v7 (old) | 09/2020 | HP EliteBook 830 G7 i7-10810U, UHD Graphics 620 | 1.3 kg | 18.1 mm | 13.30" | 1920x1080 | |
| 87.8 % v7 (old) | 03/2021 | Huawei MateBook X Pro 2021 i7-1165G7, Iris Xe G7 96EUs | 1.3 kg | 14.6 mm | 13.90" | 3000x2000 |
| Networking | |
| iperf3 transmit AX12 | |
| Lenovo ThinkPad X13 G2 20WK0024GE | |
| Genomsnitt Intel Wi-Fi 6E AX210 (675 - 1602, n=27) | |
| Huawei MateBook X Pro 2021 | |
| HP EliteBook 830 G7 | |
| Dell XPS 13 9310 Core i7 FHD | |
| Lenovo ThinkPad X13-20UGS00800 | |
| Apple MacBook Pro 13 Late 2020 M1 Entry (8 / 256 GB) | |
| iperf3 receive AX12 | |
| Lenovo ThinkPad X13 G2 20WK0024GE | |
| Dell XPS 13 9310 Core i7 FHD | |
| Huawei MateBook X Pro 2021 | |
| HP EliteBook 830 G7 | |
| Lenovo ThinkPad X13-20UGS00800 | |
| Genomsnitt Intel Wi-Fi 6E AX210 (914 - 1716, n=27) | |
| Apple MacBook Pro 13 Late 2020 M1 Entry (8 / 256 GB) | |


| |||||||||||||||||||||||||
Distribution av ljusstyrkan: 89 %
Mitt på batteriet: 319 cd/m²
Kontrast: 1333:1 (Svärta: 0.24 cd/m²)
ΔE ColorChecker Calman: 2.7 | ∀{0.5-29.43 Ø4.71}
calibrated: 0.9
ΔE Greyscale Calman: 4.1 | ∀{0.09-98 Ø4.96}
71.1% AdobeRGB 1998 (Argyll 3D)
99.7% sRGB (Argyll 3D)
71.1% Display P3 (Argyll 3D)
Gamma: 2.24
CCT: 6429 K
| Lenovo ThinkPad X13 G2 20WK0024GE NV133WUM-N61, IPS, 1920x1200, 13.3" | Dell XPS 13 9310 Core i7 FHD Sharp LQ134N1, IPS, 1920x1200, 13.4" | Apple MacBook Pro 13 Late 2020 M1 Entry (8 / 256 GB) IPS, 2560x1600, 13.3" | HP EliteBook 830 G7 Chi Mei CMN13A9, IPS, 1920x1080, 13.3" | Huawei MateBook X Pro 2021 TIANMA XM, IPS, 3000x2000, 13.9" | Lenovo ThinkPad X13-20UGS00800 B133HAK01.1, IPS LED, 1920x1080, 13.3" | Lenovo ThinkPad X13 Yoga G2 LP133WQ1-SPF2, IPS LED, 2560x1600, 13.3" | |
|---|---|---|---|---|---|---|---|
| Display | 1% | -5% | -7% | -7% | -2% | ||
| Display P3 Coverage (%) | 71.1 | 70.9 0% | 65.7 -8% | 64.9 -9% | 64.8 -9% | 68.3 -4% | |
| sRGB Coverage (%) | 99.7 | 99.1 -1% | 97.4 -2% | 94.4 -5% | 95.6 -4% | 99.1 -1% | |
| AdobeRGB 1998 Coverage (%) | 71.1 | 72.9 3% | 67.4 -5% | 66.3 -7% | 65.7 -8% | 70.3 -1% | |
| Response Times | -81% | -52% | -69% | -38% | -79% | -78% | |
| Response Time Grey 50% / Grey 80% * (ms) | 30.8 ? | 52 ? -69% | 48 ? -56% | 46.8 ? -52% | 37.6 ? -22% | 56.8 ? -84% | 52 ? -69% |
| Response Time Black / White * (ms) | 17.2 ? | 33.2 ? -93% | 25.2 ? -47% | 32 ? -86% | 26.4 ? -53% | 30 ? -74% | 32 ? -86% |
| PWM Frequency (Hz) | 2475 ? | 122000 ? | 26600 ? | ||||
| Screen | 2% | 37% | 2% | 24% | -23% | 30% | |
| Brightness middle (cd/m²) | 320 | 543.3 70% | 510 59% | 454.5 42% | 502 57% | 331 3% | 460 44% |
| Brightness (cd/m²) | 310 | 524 69% | 491 58% | 435 40% | 474 53% | 315 2% | 423 36% |
| Brightness Distribution (%) | 89 | 92 3% | 94 6% | 91 2% | 89 0% | 90 1% | 85 -4% |
| Black Level * (cd/m²) | 0.24 | 0.38 -58% | 0.29 -21% | 0.27 -13% | 0.33 -38% | 0.21 12% | 0.33 -38% |
| Contrast (:1) | 1333 | 1430 7% | 1759 32% | 1683 26% | 1521 14% | 1576 18% | 1394 5% |
| Colorchecker dE 2000 * | 2.7 | 3.02 -12% | 1.3 52% | 3.12 -16% | 1.35 50% | 6.1 -126% | 1 63% |
| Colorchecker dE 2000 max. * | 7.6 | 7.61 -0% | 3 61% | 4.85 36% | 3.67 52% | 10 -32% | 1.5 80% |
| Colorchecker dE 2000 calibrated * | 0.9 | 1.23 -37% | 1.97 -119% | 1.2 -33% | 1.2 -33% | 0.8 11% | |
| Greyscale dE 2000 * | 4.1 | 5 -22% | 2 51% | 3.1 24% | 1.7 59% | 6.3 -54% | 1.2 71% |
| Gamma | 2.24 98% | 2.02 109% | 2.23 99% | 2.01 109% | 2.24 98% | 2.77 79% | 2.26 97% |
| CCT | 6429 101% | 6550 99% | 6933 94% | 6902 94% | 6440 101% | 6938 94% | 6652 98% |
| Color Space (Percent of AdobeRGB 1998) (%) | 66.8 | 88.3 | 61.5 | 61.1 | 60.7 | 64.4 | |
| Color Space (Percent of sRGB) (%) | 99.6 | 100 | 97 | 94.3 | 95.4 | 99.12 | |
| Totalt genomsnitt (program/inställningar) | -26% /
-10% | -8% /
20% | -24% /
-9% | -7% /
8% | -36% /
-28% | -17% /
8% |
* ... mindre är bättre
Visa svarstider
| ↔ Svarstid svart till vitt | ||
|---|---|---|
| 17.2 ms ... stiga ↗ och falla ↘ kombinerat | ↗ 8.4 ms stiga | 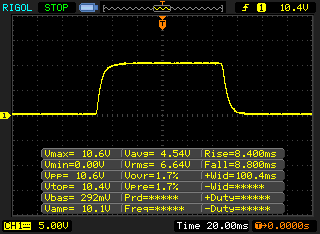 |
| ↘ 8.8 ms hösten | ||
| Skärmen visar bra svarsfrekvens i våra tester, men kan vara för långsam för konkurrenskraftiga spelare. I jämförelse sträcker sig alla testade enheter från 0.1 (minst) till 240 (maximalt) ms. » 39 % av alla enheter är bättre. Det betyder att den uppmätta svarstiden är bättre än genomsnittet av alla testade enheter (19.8 ms). | ||
| ↔ Svarstid 50 % grått till 80 % grått | ||
| 30.8 ms ... stiga ↗ och falla ↘ kombinerat | ↗ 14.8 ms stiga | 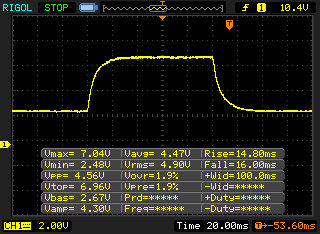 |
| ↘ 16 ms hösten | ||
| Skärmen visar långsamma svarsfrekvenser i våra tester och kommer att vara otillfredsställande för spelare. I jämförelse sträcker sig alla testade enheter från 0.165 (minst) till 636 (maximalt) ms. » 41 % av alla enheter är bättre. Det betyder att den uppmätta svarstiden liknar genomsnittet av alla testade enheter (30.9 ms). | ||
Skärmflimmer / PWM (Puls-Width Modulation)
| Skärmflimmer / PWM upptäcktes inte |  | ||
Som jämförelse: 52 % av alla testade enheter använder inte PWM för att dämpa skärmen. Om PWM upptäcktes mättes ett medelvärde av 7744 (minst: 5 - maximum: 343500) Hz. | |||
Cinebench R15 Multi Loop
Cinebench R20: CPU (Single Core) | CPU (Multi Core)
Cinebench R15: CPU Single 64Bit | CPU Multi 64Bit
Blender: v2.79 BMW27 CPU
7-Zip 18.03: 7z b 4 -mmt1 | 7z b 4
Geekbench 5.5: Single-Core | Multi-Core
HWBOT x265 Benchmark v2.2: 4k Preset
LibreOffice : 20 Documents To PDF
R Benchmark 2.5: Overall mean
| Cinebench R23 / Single Core | |
| Genomsnitt av klass Subnotebook (358 - 2213, n=60, senaste 2 åren) | |
| Lenovo ThinkPad X13 G2 20WK0024GE | |
| Apple MacBook Pro 13 Late 2020 M1 Entry (8 / 256 GB) | |
| Genomsnitt Intel Core i7-1165G7 (1110 - 1539, n=59) | |
| Huawei MateBook X Pro 2021 | |
| Cinebench R23 / Multi Core | |
| Genomsnitt av klass Subnotebook (1555 - 21812, n=59, senaste 2 åren) | |
| Apple MacBook Pro 13 Late 2020 M1 Entry (8 / 256 GB) | |
| Lenovo ThinkPad X13 G2 20WK0024GE | |
| Genomsnitt Intel Core i7-1165G7 (2525 - 6862, n=64) | |
| Huawei MateBook X Pro 2021 | |
| Cinebench R20 / CPU (Single Core) | |
| Genomsnitt av klass Subnotebook (128 - 832, n=56, senaste 2 åren) | |
| Lenovo ThinkPad X13 G2 20WK0024GE | |
| Dell XPS 13 9310 Core i7 FHD | |
| Genomsnitt Intel Core i7-1165G7 (442 - 589, n=81) | |
| Huawei MateBook X Pro 2021 | |
| Lenovo ThinkPad X13-20UGS00800 | |
| HP EliteBook 830 G7 | |
| Apple MacBook Pro 13 Late 2020 M1 Entry (8 / 256 GB) | |
| Lenovo ThinkPad X13-20T20033GE | |
| Cinebench R20 / CPU (Multi Core) | |
| Genomsnitt av klass Subnotebook (579 - 8541, n=56, senaste 2 åren) | |
| Lenovo ThinkPad X13-20UGS00800 | |
| Lenovo ThinkPad X13 G2 20WK0024GE | |
| Apple MacBook Pro 13 Late 2020 M1 Entry (8 / 256 GB) | |
| Genomsnitt Intel Core i7-1165G7 (1060 - 2657, n=81) | |
| Dell XPS 13 9310 Core i7 FHD | |
| Huawei MateBook X Pro 2021 | |
| HP EliteBook 830 G7 | |
| Lenovo ThinkPad X13-20T20033GE | |
| Cinebench R15 / CPU Single 64Bit | |
| Genomsnitt av klass Subnotebook (72.4 - 322, n=56, senaste 2 åren) | |
| Lenovo ThinkPad X13 G2 20WK0024GE | |
| Dell XPS 13 9310 Core i7 FHD | |
| Genomsnitt Intel Core i7-1165G7 (115 - 230, n=78) | |
| Huawei MateBook X Pro 2021 | |
| Apple MacBook Pro 13 Late 2020 M1 Entry (8 / 256 GB) | |
| Lenovo ThinkPad X13-20UGS00800 | |
| HP EliteBook 830 G7 | |
| Lenovo ThinkPad X13-20T20033GE | |
| Cinebench R15 / CPU Multi 64Bit | |
| Genomsnitt av klass Subnotebook (327 - 3345, n=56, senaste 2 åren) | |
| Lenovo ThinkPad X13-20UGS00800 | |
| Apple MacBook Pro 13 Late 2020 M1 Entry (8 / 256 GB) | |
| Lenovo ThinkPad X13 G2 20WK0024GE | |
| Dell XPS 13 9310 Core i7 FHD | |
| Genomsnitt Intel Core i7-1165G7 (553 - 1027, n=86) | |
| Lenovo ThinkPad X13-20T20033GE | |
| Huawei MateBook X Pro 2021 | |
| Blender / v2.79 BMW27 CPU | |
| Lenovo ThinkPad X13-20T20033GE | |
| Huawei MateBook X Pro 2021 | |
| HP EliteBook 830 G7 | |
| Dell XPS 13 9310 Core i7 FHD | |
| Genomsnitt Intel Core i7-1165G7 (468 - 1138, n=80) | |
| Lenovo ThinkPad X13 G2 20WK0024GE | |
| Lenovo ThinkPad X13-20UGS00800 | |
| Genomsnitt av klass Subnotebook (159 - 2271, n=57, senaste 2 åren) | |
| 7-Zip 18.03 / 7z b 4 -mmt1 | |
| Genomsnitt av klass Subnotebook (2643 - 6699, n=58, senaste 2 åren) | |
| Dell XPS 13 9310 Core i7 FHD | |
| Lenovo ThinkPad X13 G2 20WK0024GE | |
| Genomsnitt Intel Core i7-1165G7 (4478 - 5507, n=80) | |
| Huawei MateBook X Pro 2021 | |
| HP EliteBook 830 G7 | |
| Lenovo ThinkPad X13-20UGS00800 | |
| Lenovo ThinkPad X13-20T20033GE | |
| 7-Zip 18.03 / 7z b 4 | |
| Genomsnitt av klass Subnotebook (11668 - 77867, n=56, senaste 2 åren) | |
| Lenovo ThinkPad X13-20UGS00800 | |
| Lenovo ThinkPad X13 G2 20WK0024GE | |
| Genomsnitt Intel Core i7-1165G7 (15347 - 27405, n=80) | |
| HP EliteBook 830 G7 | |
| Dell XPS 13 9310 Core i7 FHD | |
| Huawei MateBook X Pro 2021 | |
| Lenovo ThinkPad X13-20T20033GE | |
| Geekbench 5.5 / Single-Core | |
| Genomsnitt av klass Subnotebook (726 - 2224, n=49, senaste 2 åren) | |
| Apple MacBook Pro 13 Late 2020 M1 Entry (8 / 256 GB) | |
| Dell XPS 13 9310 Core i7 FHD | |
| Lenovo ThinkPad X13 G2 20WK0024GE | |
| Genomsnitt Intel Core i7-1165G7 (1302 - 1595, n=77) | |
| Huawei MateBook X Pro 2021 | |
| HP EliteBook 830 G7 | |
| Lenovo ThinkPad X13-20UGS00800 | |
| Lenovo ThinkPad X13-20T20033GE | |
| Geekbench 5.5 / Multi-Core | |
| Genomsnitt av klass Subnotebook (2557 - 17218, n=49, senaste 2 åren) | |
| Apple MacBook Pro 13 Late 2020 M1 Entry (8 / 256 GB) | |
| Dell XPS 13 9310 Core i7 FHD | |
| Lenovo ThinkPad X13 G2 20WK0024GE | |
| Lenovo ThinkPad X13-20UGS00800 | |
| Huawei MateBook X Pro 2021 | |
| Genomsnitt Intel Core i7-1165G7 (3078 - 5926, n=77) | |
| Lenovo ThinkPad X13-20T20033GE | |
| HP EliteBook 830 G7 | |
| HWBOT x265 Benchmark v2.2 / 4k Preset | |
| Genomsnitt av klass Subnotebook (0.97 - 25.1, n=56, senaste 2 åren) | |
| Lenovo ThinkPad X13-20UGS00800 | |
| Lenovo ThinkPad X13 G2 20WK0024GE | |
| Genomsnitt Intel Core i7-1165G7 (1.39 - 8.47, n=80) | |
| Dell XPS 13 9310 Core i7 FHD | |
| Huawei MateBook X Pro 2021 | |
| HP EliteBook 830 G7 | |
| Lenovo ThinkPad X13-20T20033GE | |
| LibreOffice / 20 Documents To PDF | |
| HP EliteBook 830 G7 | |
| Lenovo ThinkPad X13-20UGS00800 | |
| Genomsnitt av klass Subnotebook (39.9 - 220, n=55, senaste 2 åren) | |
| Lenovo ThinkPad X13-20T20033GE | |
| Genomsnitt Intel Core i7-1165G7 (21.5 - 88.1, n=78) | |
| Dell XPS 13 9310 Core i7 FHD | |
| Lenovo ThinkPad X13 G2 20WK0024GE | |
| Huawei MateBook X Pro 2021 | |
| R Benchmark 2.5 / Overall mean | |
| Lenovo ThinkPad X13-20T20033GE | |
| HP EliteBook 830 G7 | |
| Lenovo ThinkPad X13-20UGS00800 | |
| Huawei MateBook X Pro 2021 | |
| Genomsnitt Intel Core i7-1165G7 (0.552 - 1.002, n=80) | |
| Dell XPS 13 9310 Core i7 FHD | |
| Lenovo ThinkPad X13 G2 20WK0024GE | |
| Genomsnitt av klass Subnotebook (0.4024 - 1.456, n=57, senaste 2 åren) | |
* ... mindre är bättre
| PCMark 10 / Score | |
| Genomsnitt av klass Subnotebook (4920 - 9939, n=46, senaste 2 åren) | |
| Lenovo ThinkPad X13 G2 20WK0024GE | |
| Genomsnitt Intel Core i7-1165G7, Intel Iris Xe Graphics G7 96EUs (4531 - 5454, n=50) | |
| Lenovo ThinkPad X13-20UGS00800 | |
| Dell XPS 13 9310 Core i7 FHD | |
| Huawei MateBook X Pro 2021 | |
| HP EliteBook 830 G7 | |
| Lenovo ThinkPad X13-20T20033GE | |
| PCMark 10 / Essentials | |
| Genomsnitt av klass Subnotebook (8552 - 11646, n=46, senaste 2 åren) | |
| Huawei MateBook X Pro 2021 | |
| Lenovo ThinkPad X13 G2 20WK0024GE | |
| Genomsnitt Intel Core i7-1165G7, Intel Iris Xe Graphics G7 96EUs (8997 - 11505, n=50) | |
| Dell XPS 13 9310 Core i7 FHD | |
| Lenovo ThinkPad X13-20UGS00800 | |
| Lenovo ThinkPad X13-20T20033GE | |
| HP EliteBook 830 G7 | |
| PCMark 10 / Productivity | |
| Genomsnitt av klass Subnotebook (5435 - 16606, n=46, senaste 2 åren) | |
| Lenovo ThinkPad X13-20UGS00800 | |
| HP EliteBook 830 G7 | |
| Lenovo ThinkPad X13 G2 20WK0024GE | |
| Dell XPS 13 9310 Core i7 FHD | |
| Lenovo ThinkPad X13-20T20033GE | |
| Huawei MateBook X Pro 2021 | |
| Genomsnitt Intel Core i7-1165G7, Intel Iris Xe Graphics G7 96EUs (5570 - 7136, n=50) | |
| PCMark 10 / Digital Content Creation | |
| Genomsnitt av klass Subnotebook (5722 - 13779, n=46, senaste 2 åren) | |
| Lenovo ThinkPad X13 G2 20WK0024GE | |
| Genomsnitt Intel Core i7-1165G7, Intel Iris Xe Graphics G7 96EUs (4083 - 5550, n=50) | |
| Lenovo ThinkPad X13-20UGS00800 | |
| Dell XPS 13 9310 Core i7 FHD | |
| Huawei MateBook X Pro 2021 | |
| HP EliteBook 830 G7 | |
| Lenovo ThinkPad X13-20T20033GE | |
| PCMark 10 Score | 5105 poäng | |
Hjälp | ||
| DPC Latencies / LatencyMon - interrupt to process latency (max), Web, Youtube, Prime95 | |
| Lenovo ThinkPad X13-20UGS00800 | |
| Huawei MateBook X Pro 2021 | |
| Dell XPS 13 9310 Core i7 FHD | |
| Lenovo ThinkPad X13-20T20033GE | |
| HP EliteBook 830 G7 | |
| Lenovo ThinkPad X13 G2 20WK0024GE | |
* ... mindre är bättre
| Lenovo ThinkPad X13 G2 20WK0024GE SK Hynix HFS512 GDE9X081N | Dell XPS 13 9310 Core i7 FHD Micron 2300 512GB MTFDHBA512TDV | HP EliteBook 830 G7 Samsung SSD PM981a MZVLB512HBJQ | Huawei MateBook X Pro 2021 Samsung PM981a MZVLB1T0HBLR | Genomsnitt SK Hynix HFS512 GDE9X081N | |
|---|---|---|---|---|---|
| CrystalDiskMark 5.2 / 6 | -12% | -7% | 14% | -5% | |
| Write 4K (MB/s) | 171.4 | 97.5 -43% | 118.3 -31% | 197.5 15% | 137.4 ? -20% |
| Read 4K (MB/s) | 70.8 | 50.9 -28% | 60.4 -15% | 52.9 -25% | 61.7 ? -13% |
| Write Seq (MB/s) | 1771 | 1811 2% | 2067 17% | 2174 23% | 2043 ? 15% |
| Read Seq (MB/s) | 1755 | 1836 5% | 2394 36% | 2156 23% | 1800 ? 3% |
| Write 4K Q32T1 (MB/s) | 525 | 521 -1% | 325.5 -38% | 632 20% | 463 ? -12% |
| Read 4K Q32T1 (MB/s) | 479.5 | 357.5 -25% | 332.2 -31% | 694 45% | 408 ? -15% |
| Write Seq Q32T1 (MB/s) | 2818 | 2879 2% | 2978 6% | 3017 7% | 2893 ? 3% |
| Read Seq Q32T1 (MB/s) | 3548 | 3204 -10% | 3552 0% | 3561 0% | 3585 ? 1% |
| AS SSD | -155% | -57% | -9% | -15% | |
| Seq Read (MB/s) | 2776 | 2091 -25% | 2081 -25% | 2794 1% | 2727 ? -2% |
| Seq Write (MB/s) | 1461 | 1396 -4% | 1433 -2% | 2385 63% | 1664 ? 14% |
| 4K Read (MB/s) | 63.8 | 49.29 -23% | 49.92 -22% | 60.7 -5% | 53.6 ? -16% |
| 4K Write (MB/s) | 209.4 | 104.2 -50% | 119.1 -43% | 180.8 -14% | 152.5 ? -27% |
| 4K-64 Read (MB/s) | 1148 | 827 -28% | 585 -49% | 1768 54% | 1025 ? -11% |
| 4K-64 Write (MB/s) | 1623 | 1636 1% | 1630 0% | 1800 11% | 1731 ? 7% |
| Access Time Read * (ms) | 0.032 | 0.066 -106% | 0.043 -34% | 0.037 -16% | 0.05417 ? -69% |
| Access Time Write * (ms) | 0.019 | 0.365 -1821% | 0.097 -411% | 0.073 -284% | 0.026 ? -37% |
| Score Read (Points) | 1489 | 1086 -27% | 843 -43% | 2108 42% | 1351 ? -9% |
| Score Write (Points) | 1978 | 1880 -5% | 1892 -4% | 2219 12% | 2051 ? 4% |
| Score Total (Points) | 4178 | 3499 -16% | 3149 -25% | 5392 29% | 4051 ? -3% |
| Copy ISO MB/s (MB/s) | 1833 | 1544 -16% | 2452 34% | 2065 13% | 2050 ? 12% |
| Copy Program MB/s (MB/s) | 993 | 613 -38% | 72.2 -93% | 734 -26% | 542 ? -45% |
| Copy Game MB/s (MB/s) | 1607 | 1451 -10% | 404 -75% | 1629 1% | 1228 ? -24% |
| Totalt genomsnitt (program/inställningar) | -84% /
-103% | -32% /
-39% | 3% /
-1% | -10% /
-11% |
* ... mindre är bättre

DiskSpd Read Loop, Queue Depth 8
| 3DMark 11 - 1280x720 Performance GPU | |
| Genomsnitt av klass Subnotebook (995 - 18489, n=54, senaste 2 åren) | |
| Lenovo ThinkPad X13 G2 20WK0024GE | |
| Dell XPS 13 9310 Core i7 FHD | |
| Genomsnitt Intel Iris Xe Graphics G7 96EUs (2867 - 7676, n=209) | |
| Huawei MateBook X Pro 2021 | |
| Lenovo ThinkPad X13-20UGS00800 | |
| HP EliteBook 830 G7 | |
| Lenovo ThinkPad X13-20T20033GE | |
| 3DMark | |
| 1280x720 Cloud Gate Standard Graphics | |
| Genomsnitt av klass Subnotebook (5577 - 61591, n=28, senaste 2 åren) | |
| Lenovo ThinkPad X13 G2 20WK0024GE | |
| Huawei MateBook X Pro 2021 | |
| Genomsnitt Intel Iris Xe Graphics G7 96EUs (13162 - 39880, n=187) | |
| Dell XPS 13 9310 Core i7 FHD | |
| Lenovo ThinkPad X13-20UGS00800 | |
| HP EliteBook 830 G7 | |
| 1920x1080 Fire Strike Graphics | |
| Genomsnitt av klass Subnotebook (832 - 32931, n=56, senaste 2 åren) | |
| Lenovo ThinkPad X13 G2 20WK0024GE | |
| Huawei MateBook X Pro 2021 | |
| Genomsnitt Intel Iris Xe Graphics G7 96EUs (2286 - 6624, n=222) | |
| Dell XPS 13 9310 Core i7 FHD | |
| Lenovo ThinkPad X13-20UGS00800 | |
| HP EliteBook 830 G7 | |
| Lenovo ThinkPad X13-20T20033GE | |
| 2560x1440 Time Spy Graphics | |
| Genomsnitt av klass Subnotebook (804 - 14477, n=55, senaste 2 åren) | |
| Lenovo ThinkPad X13 G2 20WK0024GE | |
| Genomsnitt Intel Iris Xe Graphics G7 96EUs (707 - 1890, n=218) | |
| Huawei MateBook X Pro 2021 | |
| Dell XPS 13 9310 Core i7 FHD | |
| Lenovo ThinkPad X13-20UGS00800 | |
| HP EliteBook 830 G7 | |
| Lenovo ThinkPad X13-20T20033GE | |
| 3DMark 11 Performance | 7169 poäng | |
| 3DMark Ice Storm Standard Score | 95856 poäng | |
| 3DMark Cloud Gate Standard Score | 20532 poäng | |
| 3DMark Fire Strike Score | 4795 poäng | |
| 3DMark Time Spy Score | 1746 poäng | |
Hjälp | ||
| F1 2020 | |
| 1920x1080 Ultra High Preset AA:T AF:16x | |
| Lenovo ThinkPad X13 G2 20WK0024GE | |
| Genomsnitt Intel Iris Xe Graphics G7 96EUs (15 - 28, n=31) | |
| 1920x1080 High Preset AA:T AF:16x | |
| Lenovo ThinkPad X13 G2 20WK0024GE | |
| Genomsnitt Intel Iris Xe Graphics G7 96EUs (22 - 44.4, n=32) | |
| 1920x1080 Medium Preset AF:16x | |
| Lenovo ThinkPad X13 G2 20WK0024GE | |
| Genomsnitt Intel Iris Xe Graphics G7 96EUs (23.1 - 57.5, n=34) | |
| 1280x720 Ultra Low Preset | |
| Lenovo ThinkPad X13 G2 20WK0024GE | |
| Genomsnitt Intel Iris Xe Graphics G7 96EUs (49 - 109.6, n=34) | |
| X-Plane 11.11 | |
| 1920x1080 high (fps_test=3) | |
| Genomsnitt av klass Subnotebook (20.7 - 50.5, n=54, senaste 2 åren) | |
| Dell XPS 13 9310 Core i7 FHD | |
| Lenovo ThinkPad X13 G2 20WK0024GE | |
| Genomsnitt Intel Iris Xe Graphics G7 96EUs (11.1 - 59.8, n=213) | |
| Huawei MateBook X Pro 2021 | |
| Lenovo ThinkPad X13-20UGS00800 | |
| Lenovo ThinkPad X13-20T20033GE | |
| HP EliteBook 830 G7 | |
| 1920x1080 med (fps_test=2) | |
| Genomsnitt av klass Subnotebook (25.1 - 65.9, n=54, senaste 2 åren) | |
| Dell XPS 13 9310 Core i7 FHD | |
| Lenovo ThinkPad X13 G2 20WK0024GE | |
| Genomsnitt Intel Iris Xe Graphics G7 96EUs (11.6 - 69.5, n=214) | |
| Huawei MateBook X Pro 2021 | |
| Lenovo ThinkPad X13-20UGS00800 | |
| Lenovo ThinkPad X13-20T20033GE | |
| HP EliteBook 830 G7 | |
| 1280x720 low (fps_test=1) | |
| Genomsnitt av klass Subnotebook (33.3 - 82.5, n=58, senaste 2 åren) | |
| Dell XPS 13 9310 Core i7 FHD | |
| Lenovo ThinkPad X13 G2 20WK0024GE | |
| Genomsnitt Intel Iris Xe Graphics G7 96EUs (13.4 - 88.4, n=213) | |
| Lenovo ThinkPad X13-20UGS00800 | |
| Huawei MateBook X Pro 2021 | |
| Lenovo ThinkPad X13-20T20033GE | |
| HP EliteBook 830 G7 | |
Witcher 3 FPS Diagram
| låg | med. | hög | ultra | |
|---|---|---|---|---|
| GTA V (2015) | 89.2 | 27.4 | 10.8 | |
| The Witcher 3 (2015) | 97 | 58 | 31 | 12.7 |
| Dota 2 Reborn (2015) | 83 | 72.1 | 46.9 | 44.4 |
| Final Fantasy XV Benchmark (2018) | 39.3 | 21.3 | 15.8 | |
| X-Plane 11.11 (2018) | 43.2 | 36.1 | 32.4 | |
| Far Cry 5 (2018) | 55 | 26 | 24 | 21 |
| Strange Brigade (2018) | 91.2 | 38.9 | 30.9 | 25 |
| F1 2020 (2020) | 88 | 46 | 34 | 23 |
Ljudnivå
| Låg belastning |
| 25.5 / 25.5 / 29 dB(A) |
| Hög belastning |
| 37.4 / 37.4 dB(A) |
 | ||
30 dB tyst 40 dB(A) hörbar 50 dB(A) högt ljud |
||
min: | ||
| Lenovo ThinkPad X13 G2 20WK0024GE Iris Xe G7 96EUs, i7-1165G7, SK Hynix HFS512 GDE9X081N | Dell XPS 13 9310 Core i7 FHD Iris Xe G7 96EUs, i7-1165G7, Micron 2300 512GB MTFDHBA512TDV | Apple MacBook Pro 13 Late 2020 M1 Entry (8 / 256 GB) M1 8-Core GPU, M1, Apple SSD AP0256 | HP EliteBook 830 G7 UHD Graphics 620, i7-10810U, Samsung SSD PM981a MZVLB512HBJQ | Huawei MateBook X Pro 2021 Iris Xe G7 96EUs, i7-1165G7, Samsung PM981a MZVLB1T0HBLR | Lenovo ThinkPad X13-20UGS00800 Vega 7, R7 PRO 4750U, Samsung SSD PM981a MZVLB512HBJQ | |
|---|---|---|---|---|---|---|
| Noise | 6% | -7% | 0% | 7% | -2% | |
| av / miljö * (dB) | 25.5 | 25.7 -1% | 29.2 -15% | 26.8 -5% | 25.4 -0% | 29.1 -14% |
| Idle Minimum * (dB) | 25.5 | 25.7 -1% | 29.2 -15% | 27.1 -6% | 25.6 -0% | 29.1 -14% |
| Idle Average * (dB) | 25.5 | 25.7 -1% | 29.2 -15% | 27.1 -6% | 25.6 -0% | 29.1 -14% |
| Idle Maximum * (dB) | 29 | 25.9 11% | 29.2 -1% | 27.1 7% | 25.6 12% | 29.1 -0% |
| Load Average * (dB) | 37.4 | 26.2 30% | 32.1 14% | 31.4 16% | 28.7 23% | 31.1 17% |
| Witcher 3 ultra * (dB) | 37.4 | 36.5 2% | 32 14% | |||
| Load Maximum * (dB) | 37.4 | 36.6 2% | 41.9 -12% | 39 -4% | 38.2 -2% | 31.8 15% |
* ... mindre är bättre
(-) Den maximala temperaturen på ovansidan är 53.9 °C / 129 F, jämfört med genomsnittet av 35.9 °C / 97 F , allt från 21.4 till 59 °C för klassen Subnotebook.
(-) Botten värms upp till maximalt 49.1 °C / 120 F, jämfört med genomsnittet av 39.2 °C / 103 F
(+) Vid tomgångsbruk är medeltemperaturen för ovansidan 24 °C / 75 F, jämfört med enhetsgenomsnittet på 30.8 °C / ### class_avg_f### F.
(-) När du spelar The Witcher 3 är medeltemperaturen för ovansidan 39.4 °C / 103 F, jämfört med enhetsgenomsnittet på 30.8 °C / ## #class_avg_f### F.
(±) Handledsstöden och pekplattan kan bli väldigt varma vid beröring med maximalt 37 °C / 98.6 F.
(-) Medeltemperaturen för handledsstödsområdet på liknande enheter var 28.2 °C / 82.8 F (-8.8 °C / -15.8 F).
Lenovo ThinkPad X13 G2 20WK0024GE ljudanalys
(±) | högtalarljudstyrkan är genomsnittlig men bra (77.4 dB)
Bas 100 - 315 Hz
(-) | nästan ingen bas - i genomsnitt 21.2% lägre än medianen
(±) | linjäriteten för basen är genomsnittlig (7.8% delta till föregående frekvens)
Mellan 400 - 2000 Hz
(+) | balanserad mellan - endast 3.5% från medianen
(±) | linjäriteten för mids är genomsnittlig (7.6% delta till föregående frekvens)
Högsta 2 - 16 kHz
(+) | balanserade toppar - endast 1.5% från medianen
(+) | toppar är linjära (2.8% delta till föregående frekvens)
Totalt 100 - 16 000 Hz
(±) | linjäriteten för det totala ljudet är genomsnittlig (18% skillnad mot median)
Jämfört med samma klass
» 51% av alla testade enheter i den här klassen var bättre, 8% liknande, 41% sämre
» Den bästa hade ett delta på 5%, genomsnittet var 18%, sämst var 53%
Jämfört med alla testade enheter
» 38% av alla testade enheter var bättre, 8% liknande, 54% sämre
» Den bästa hade ett delta på 4%, genomsnittet var 23%, sämst var 134%
Apple MacBook Pro 13 Late 2020 M1 Entry (8 / 256 GB) ljudanalys
(±) | högtalarljudstyrkan är genomsnittlig men bra (77.5 dB)
Bas 100 - 315 Hz
(±) | reducerad bas - i genomsnitt 8.7% lägre än medianen
(±) | linjäriteten för basen är genomsnittlig (8.6% delta till föregående frekvens)
Mellan 400 - 2000 Hz
(+) | balanserad mellan - endast 4.2% från medianen
(+) | mids är linjära (4.2% delta till föregående frekvens)
Högsta 2 - 16 kHz
(+) | balanserade toppar - endast 1.2% från medianen
(+) | toppar är linjära (4% delta till föregående frekvens)
Totalt 100 - 16 000 Hz
(+) | det totala ljudet är linjärt (12.9% skillnad mot median)
Jämfört med samma klass
» 20% av alla testade enheter i den här klassen var bättre, 5% liknande, 75% sämre
» Den bästa hade ett delta på 5%, genomsnittet var 18%, sämst var 53%
Jämfört med alla testade enheter
» 12% av alla testade enheter var bättre, 3% liknande, 85% sämre
» Den bästa hade ett delta på 4%, genomsnittet var 23%, sämst var 134%
Huawei MateBook X Pro 2021 ljudanalys
(+) | högtalare kan spela relativt högt (82.7 dB)
Bas 100 - 315 Hz
(±) | reducerad bas - i genomsnitt 13.6% lägre än medianen
(±) | linjäriteten för basen är genomsnittlig (10.1% delta till föregående frekvens)
Mellan 400 - 2000 Hz
(+) | balanserad mellan - endast 2.9% från medianen
(+) | mids är linjära (3.3% delta till föregående frekvens)
Högsta 2 - 16 kHz
(+) | balanserade toppar - endast 4.6% från medianen
(±) | linjäriteten för toppar är genomsnittlig (8.2% delta till föregående frekvens)
Totalt 100 - 16 000 Hz
(+) | det totala ljudet är linjärt (11.8% skillnad mot median)
Jämfört med samma klass
» 13% av alla testade enheter i den här klassen var bättre, 4% liknande, 83% sämre
» Den bästa hade ett delta på 5%, genomsnittet var 18%, sämst var 53%
Jämfört med alla testade enheter
» 9% av alla testade enheter var bättre, 3% liknande, 89% sämre
» Den bästa hade ett delta på 4%, genomsnittet var 23%, sämst var 134%
| Av/Standby | |
| Låg belastning | |
| Hög belastning |
|
Förklaring:
min: | |
| Lenovo ThinkPad X13 G2 20WK0024GE i7-1165G7, Iris Xe G7 96EUs, SK Hynix HFS512 GDE9X081N, IPS, 1920x1200, 13.3" | Dell XPS 13 9310 Core i7 FHD i7-1165G7, Iris Xe G7 96EUs, Micron 2300 512GB MTFDHBA512TDV, IPS, 1920x1200, 13.4" | Apple MacBook Pro 13 Late 2020 M1 Entry (8 / 256 GB) M1, M1 8-Core GPU, Apple SSD AP0256, IPS, 2560x1600, 13.3" | HP EliteBook 830 G7 i7-10810U, UHD Graphics 620, Samsung SSD PM981a MZVLB512HBJQ, IPS, 1920x1080, 13.3" | Huawei MateBook X Pro 2021 i7-1165G7, Iris Xe G7 96EUs, Samsung PM981a MZVLB1T0HBLR, IPS, 3000x2000, 13.9" | Lenovo ThinkPad X13-20UGS00800 R7 PRO 4750U, Vega 7, Samsung SSD PM981a MZVLB512HBJQ, IPS LED, 1920x1080, 13.3" | Genomsnitt Intel Iris Xe Graphics G7 96EUs | Genomsnitt av klass Subnotebook | |
|---|---|---|---|---|---|---|---|---|
| Power Consumption | 0% | 16% | 7% | -40% | -34% | -43% | -11% | |
| Idle Minimum * (Watt) | 2.8 | 3.9 -39% | 1.67 40% | 3.6 -29% | 6.7 -139% | 6 -114% | 5.51 ? -97% | 3.73 ? -33% |
| Idle Average * (Watt) | 5.9 | 5.9 -0% | 6.7 -14% | 4.7 20% | 10 -69% | 8.9 -51% | 8.66 ? -47% | 6.57 ? -11% |
| Idle Maximum * (Watt) | 6.8 | 6.3 7% | 7.4 -9% | 5.1 25% | 10.3 -51% | 11.3 -66% | 10.9 ? -60% | 7.93 ? -17% |
| Load Average * (Watt) | 41.5 | 39.7 4% | 28 33% | 33.3 20% | 35.7 14% | 34.2 18% | 45.6 ? -10% | 42.1 ? -1% |
| Witcher 3 ultra * (Watt) | 34.2 | 34.8 -2% | 32.7 4% | |||||
| Load Maximum * (Watt) | 68.2 | 47.5 30% | 47.5 30% | 70 -3% | 67.6 1% | 37.2 45% | 67.8 ? 1% | 65.1 ? 5% |
* ... mindre är bättre
Energiförbrukning - Witcher 3
| Lenovo ThinkPad X13 G2 20WK0024GE i7-1165G7, Iris Xe G7 96EUs, 54.7 Wh | Dell XPS 13 9310 Core i7 FHD i7-1165G7, Iris Xe G7 96EUs, 52 Wh | Apple MacBook Pro 13 Late 2020 M1 Entry (8 / 256 GB) M1, M1 8-Core GPU, 58.2 Wh | HP EliteBook 830 G7 i7-10810U, UHD Graphics 620, 53 Wh | Huawei MateBook X Pro 2021 i7-1165G7, Iris Xe G7 96EUs, 56 Wh | Lenovo ThinkPad X13-20UGS00800 R7 PRO 4750U, Vega 7, 48 Wh | Lenovo ThinkPad X13-20T20033GE i5-10210U, UHD Graphics 620, 48 Wh | Genomsnitt av klass Subnotebook | |
|---|---|---|---|---|---|---|---|---|
| Batteridrifttid | 70% | 66% | 90% | 60% | -17% | 21% | 29% | |
| H.264 (h) | 15 | 19.2 28% | 8.3 -45% | 11.7 -22% | 15.3 ? 2% | |||
| WiFi v1.3 (h) | 10 | 11 10% | 20.4 104% | 11.5 15% | 10.5 5% | 8.7 -13% | 9.3 -7% | 13.9 ? 39% |
| Load (h) | 1.4 | 3.2 129% | 3.7 164% | 3 114% | 1.5 7% | 2.7 93% | 2.04 ? 46% |
För
Emot
Omdöme - ThinkPad X13 G2 har outnyttjad potential
Läs den fullständiga versionen av den här recensionen på engelska här.
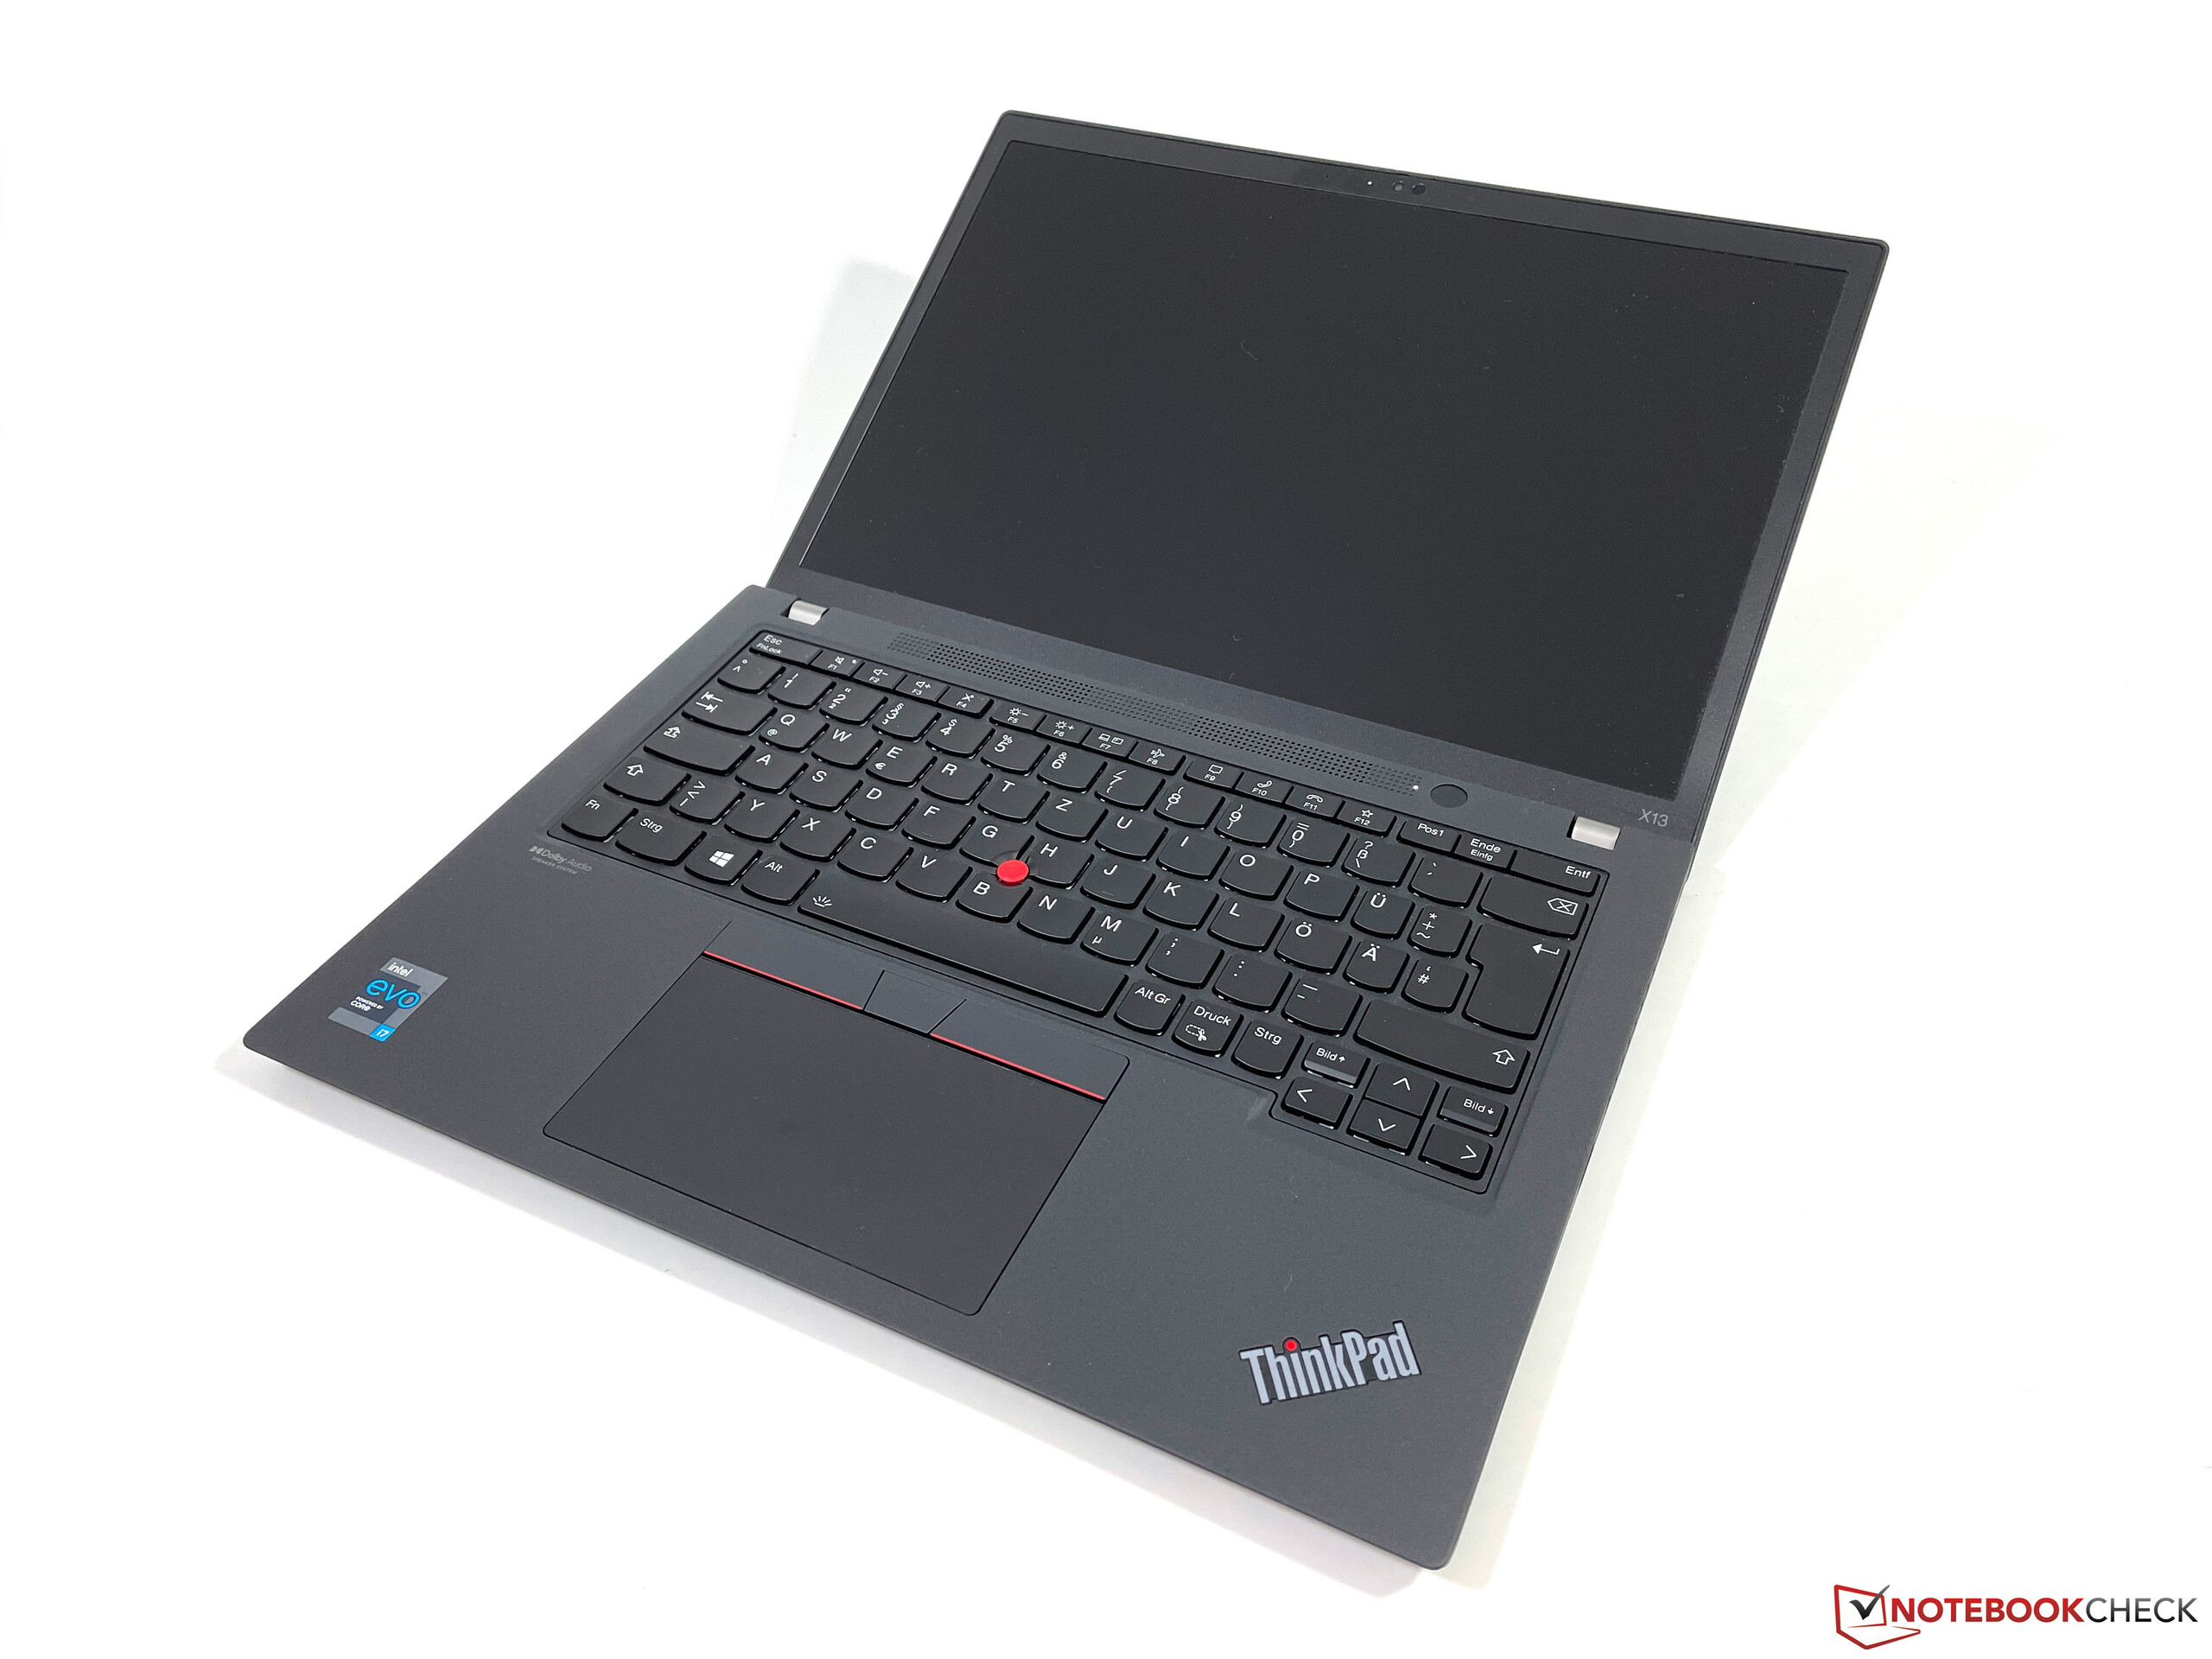
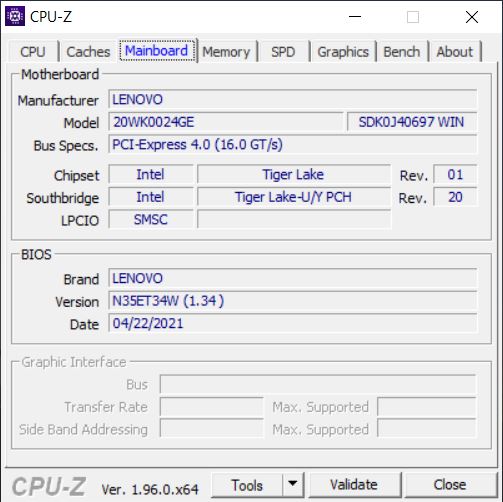
Nya ThinkPad X13 G2 är en bra uppdatering. Den är lite kompaktare, du får 16:10-skärmar, Tiger Lake-processorerna presterar bra och Lenovo har till och med lyckats öka batteriets kapacitet.
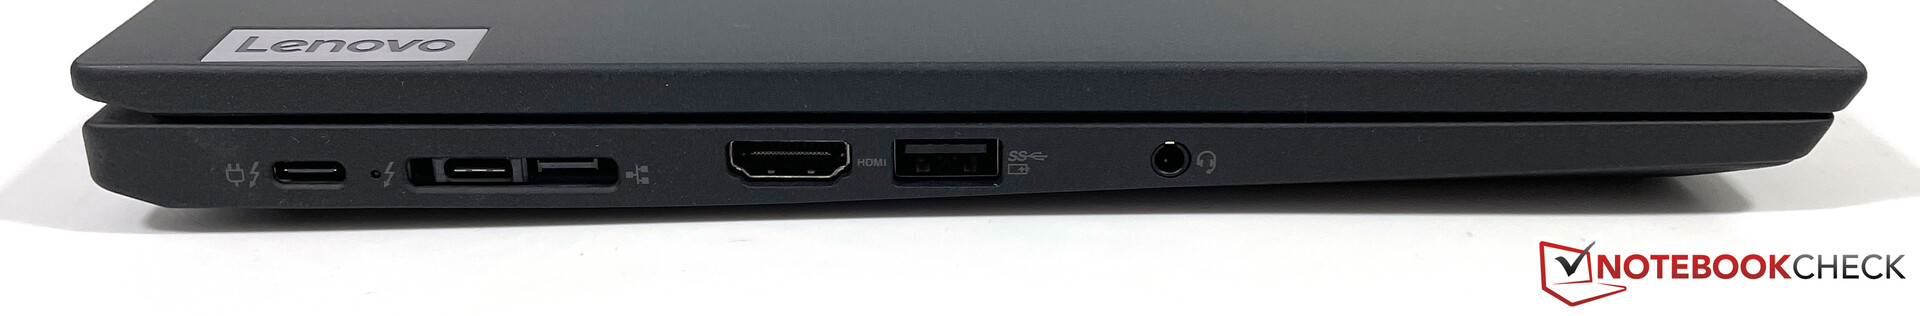
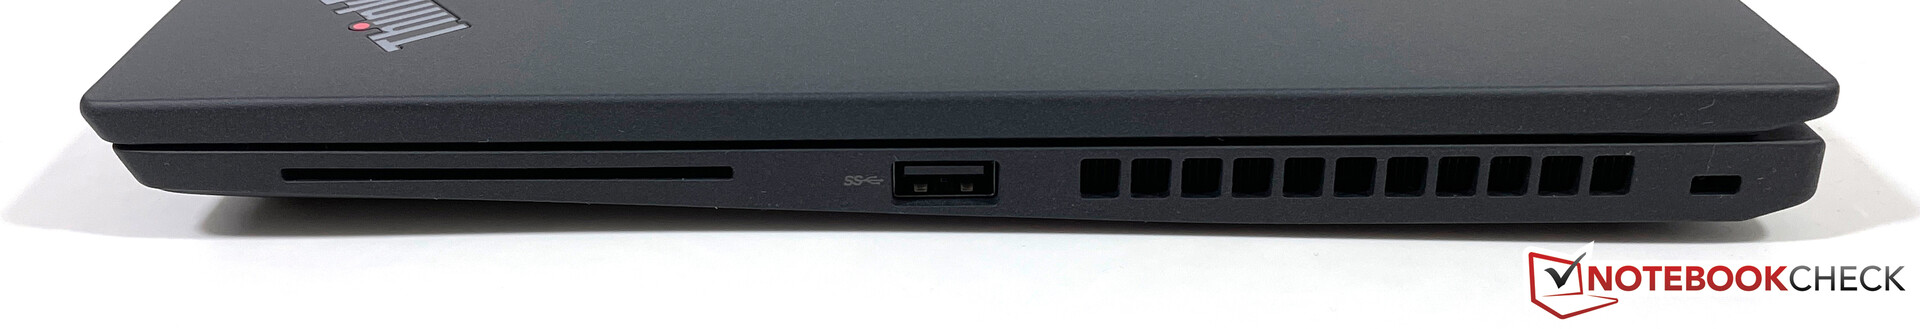
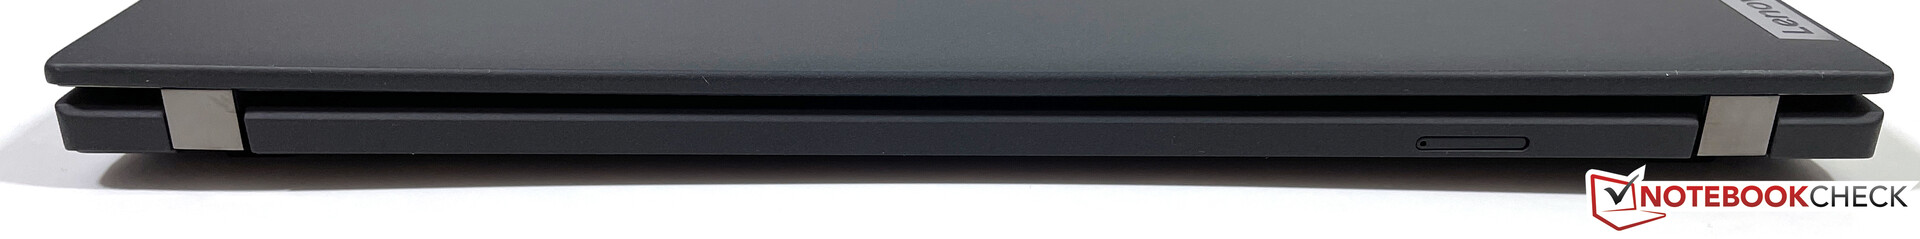
Den största fördelen gentemot konsumentenheter som Dell XPS 13, Apple MacBook Pro 13 och Huawei MateBook X Pro är den utförliga mängden portar som inkluderar SmartCard-läsare och WWAN-moduler för LTE och till och med 5G som tillval. Kontorsenheter har också en fördel i fråga om garanti.
Lenovo följer också trenden med tangentbord som har kortare färdväg och grundare knappar för att spara utrymme. Man gör fortfarande reklam för beprövad ThinkPad-kvalitet och tangentbordet är inte på något sätt dåligt, men om man till exempel jämför tangentbordet i nya ThinkPad E14 G3 (som kostar hälften så mycket) så ser man snabbt hur mycket bättre det kunde varit.
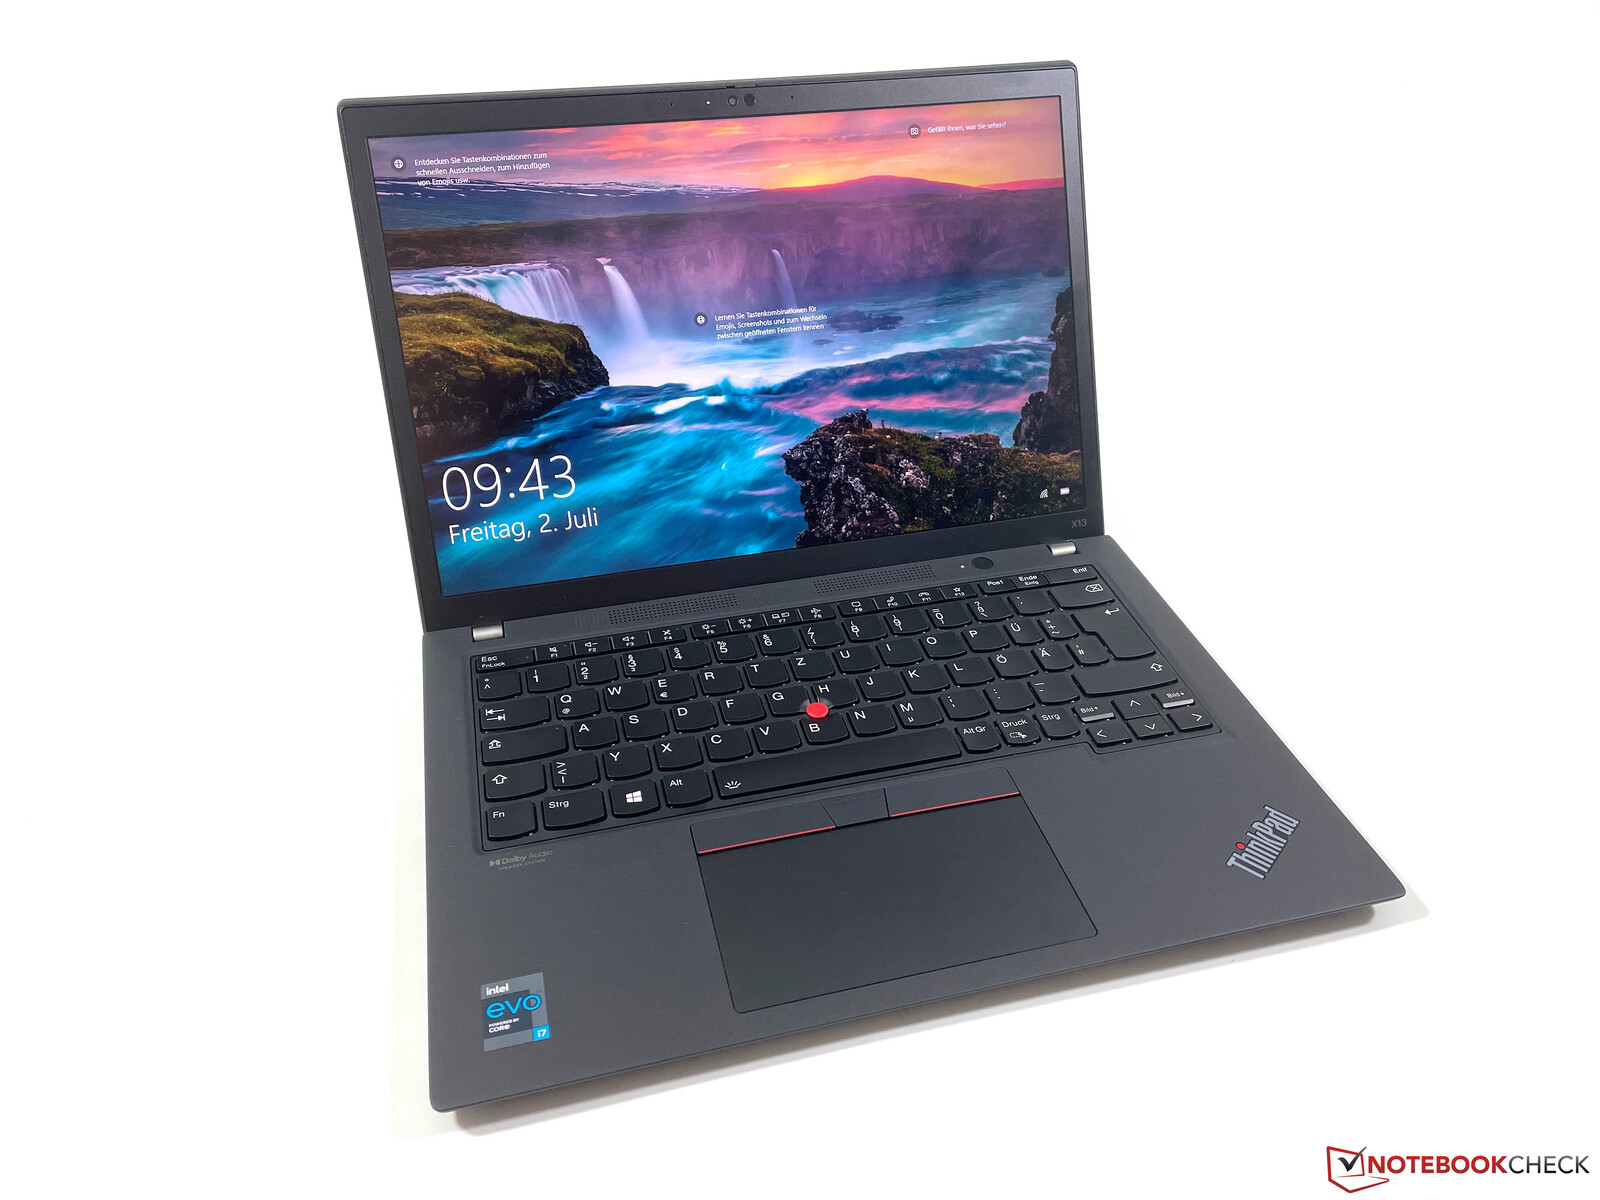
Bra anslutbarhet med 5G, 16:10-skärm och lång batteritid: ThinkPad X13 G2 är fortfarande en riktigt bra mobil kollega, även om tangentbordet inte är så bra som det en gång var.
Även skärmen gjorde oss en aning besvikna. Den matta IPS-skärmen har bra bildkvalitet, men vi hade gärna sett mer ljusstarka paneler. Vi rekommenderar definitivt WQXGA-panelen med upplösning på 2560 x 1600 pixlar som finns som tillval, för den är mer ljusstark, har ännu bättre bildkvalitet och påverkar inte batteritiden på samma sätt som i vår recension av X13 Yoga G2. Vi kommer också att recensera nya EliteBook 830 G8 samt (så fort den finns tillgänglig) AMD-versionen av ThinkPad X13 G2.
Lenovo ThinkPad X13 G2 20WK0024GE
- 07/06/2021 v7 (old)
Andreas Osthoff
Price comparison
