Denna Ryzen har en standard TDP på 15 W (även känd som Power Limit 1).
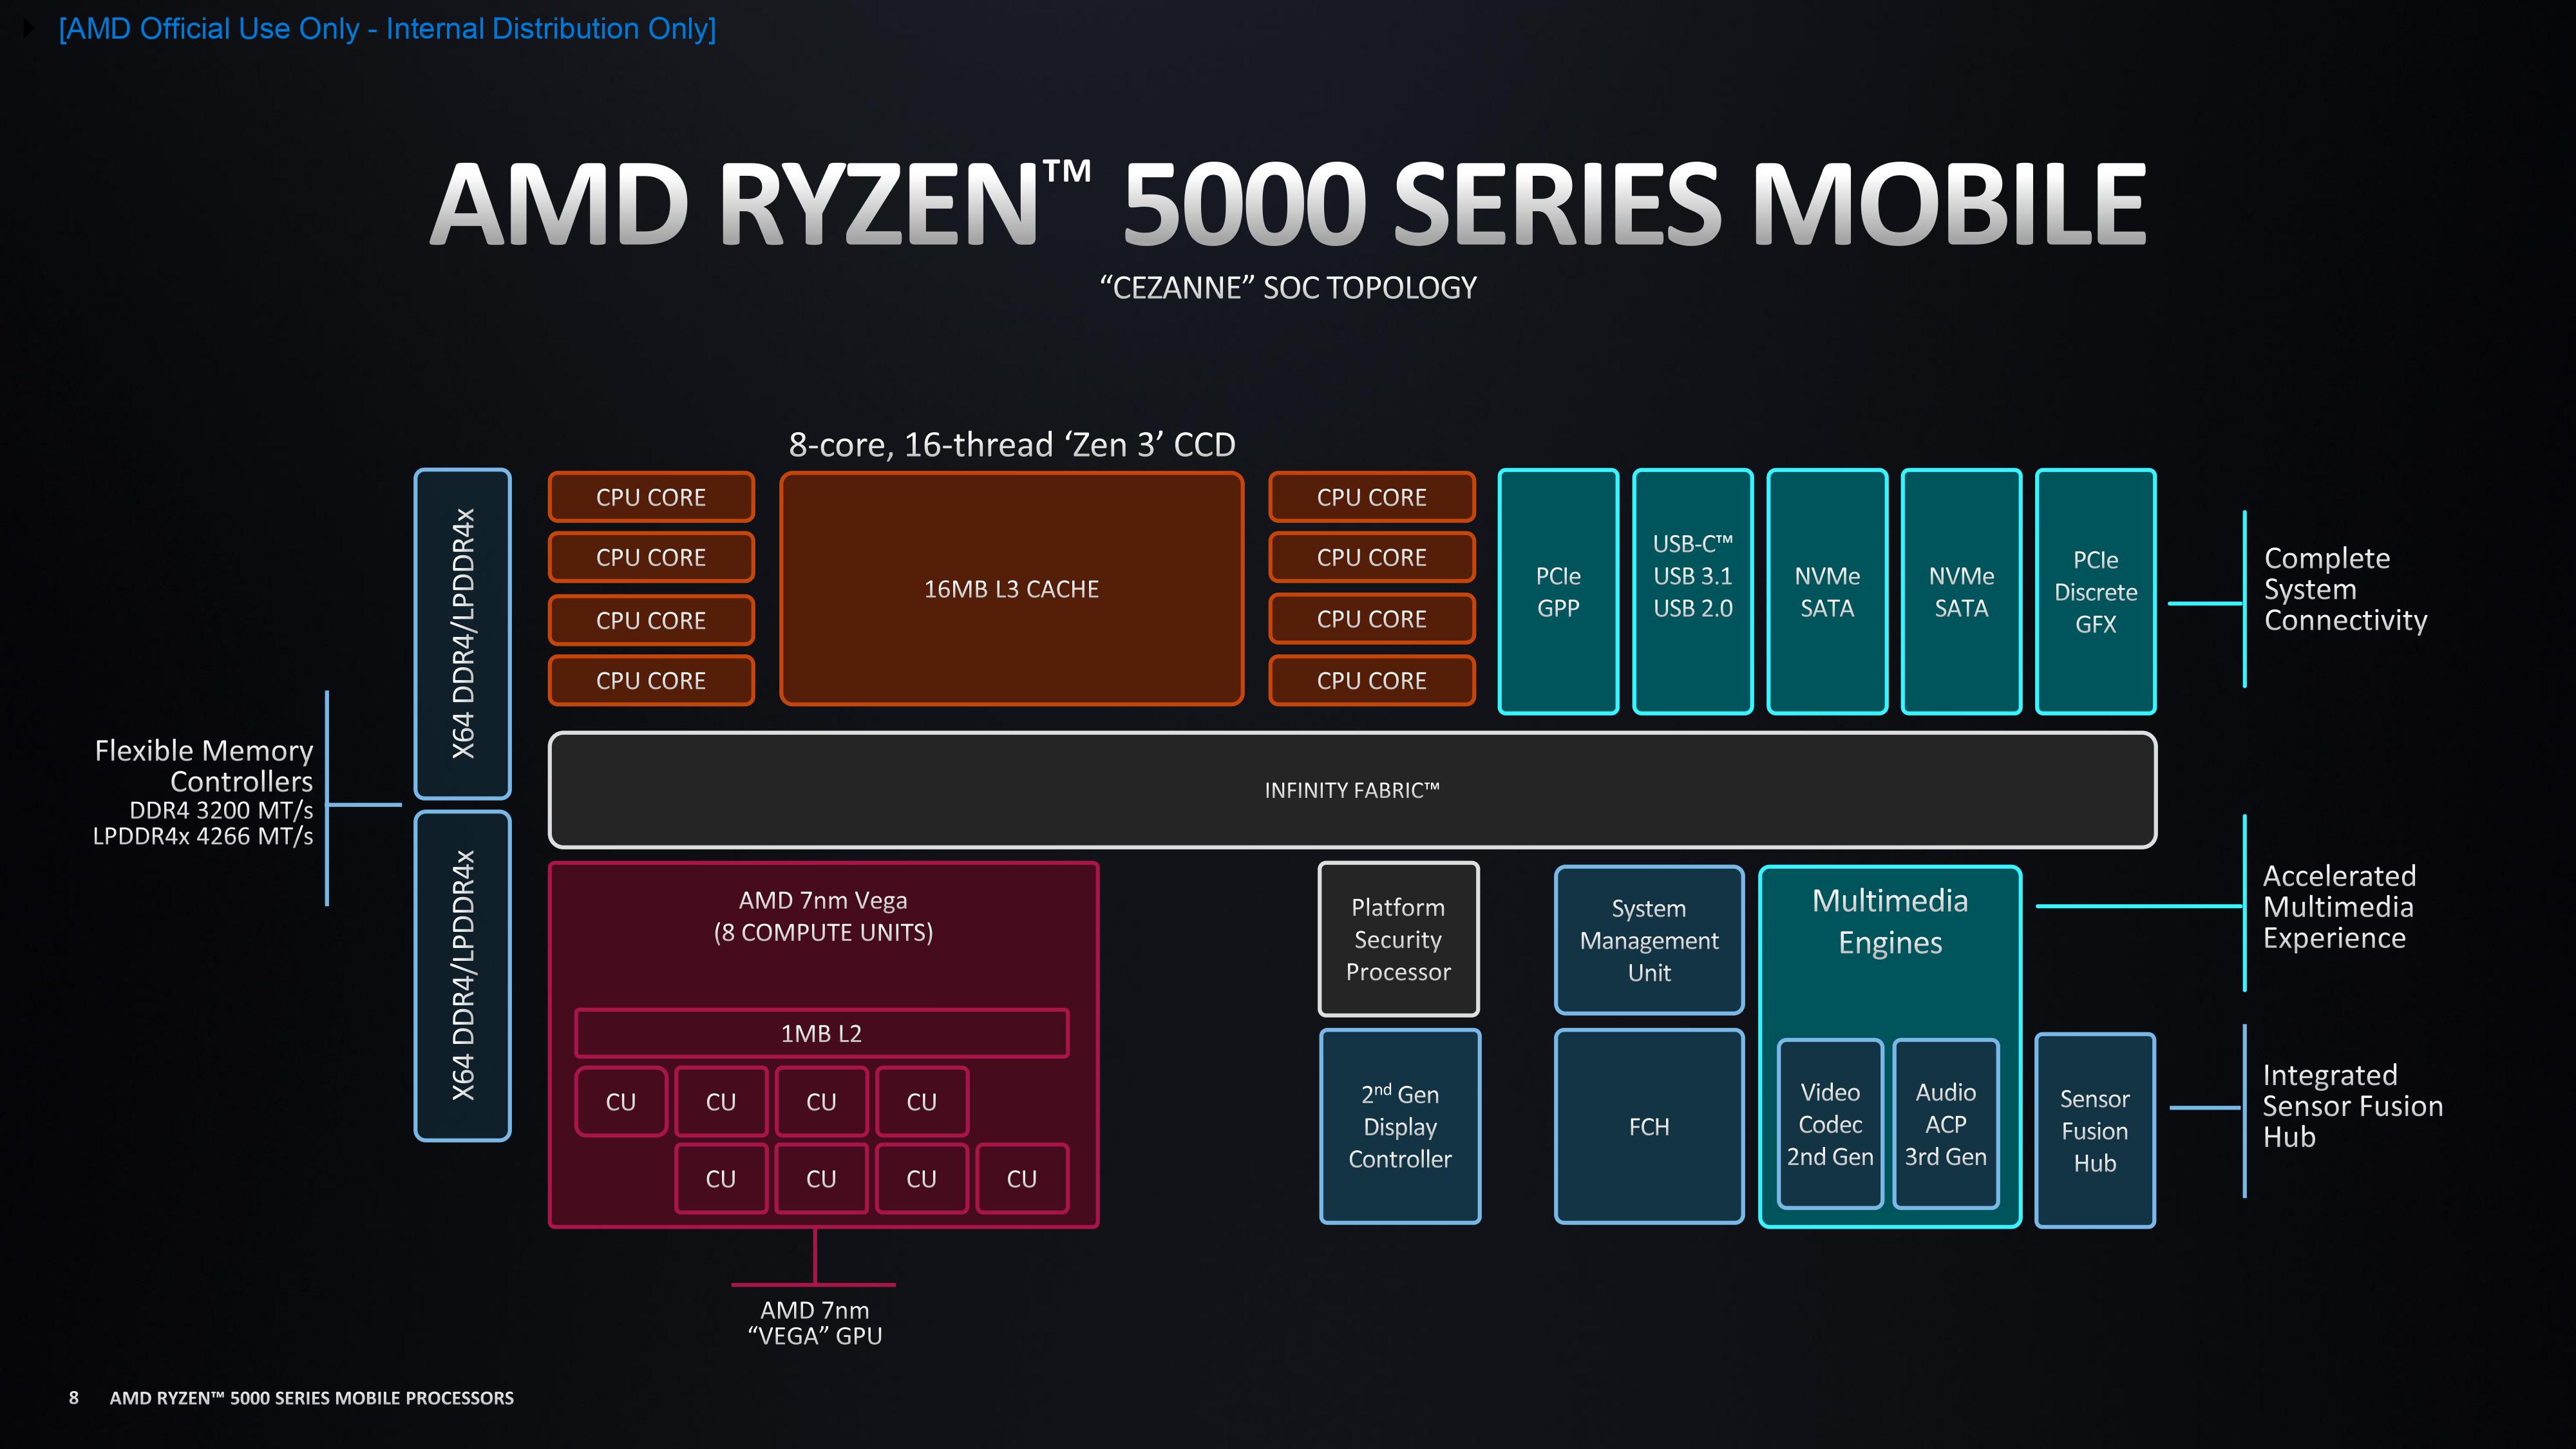
Kodnamn Barcelo-U Refresh Serie AMD Cezanne (Zen 3, Ryzen 5000) Serie: Cezanne (Zen 3, Ryzen 5000) Barcelo-U Refresh Klockfrekvens 2000 - 4500 MHz Level 1-cache 384 KB Level 2-cache 3 MB Level 3-cache 16 MB Antal kärnor / trådar 6 / 12 Strömförbrukning (TDP = Thermal Design Power) 15 Watt Tillverkningsprocess 7 nm Max. temperatur 95 °C Sockel FP6 Funktioner DDR4-3200/LPDDR4x-4266 RAM (incl. ECC), PCIe 3, MMX, SSE, SSE2, SSE3, SSSE3, SSE4A, SSE4.1, SSE4.2, AVX, AVX2, BMI2, ABM, FMA, ADX, SMEP, SMAP, SMT, CPB, AES-NI, RDRAND, RDSEED, SHA, SME GPU AMD Radeon RX Vega 7 ( - 2000 MHz)64-bit 64-bitsstöd Architecture x86 Lanseringsdatum 01/05/2023 Produktlänk www.amd.com
Performance Rating - CB R15 + R20 + 7-Zip + X265 + Blender + 3DM11 CPU
AMD E1-2100
...
Intel Core i5-11500B
Intel Core i7-11390H
...
AMD Ryzen 9 9955HX
max:
Cinebench 2026 - Cinebench 2026 CPU Single Thread
Intel Core i7-7Y75
Intel Core i9-9980HK
Intel Core Ultra 5 115U
...
Apple M5 Pro 18-Core
Cinebench 2026 - Cinebench 2026 CPU Multi
Intel Core i7-7Y75
Intel Core Ultra 5 115U
Apple M1
Intel Core i9-9980HK
...
Apple M5 Pro 18-Core
max:
Intel Core Ultra 7 270K Plus
Cinebench 2024 - Cinebench 2024 CPU Single Core
min: 83 genomsnitt: 84 median: 84 (42%) max: 85 Points
...
Intel Core i5-11500B
...
Apple M5 Pro 18-Core
Cinebench 2024 - Cinebench 2024 CPU Multi Core
min: 398 genomsnitt: 426.5 median: 426.5 (8%) max: 455 Points
...
Apple M1
Intel Core i5-11500B
...
Apple M5 Pro 18-Core
max:
Cinebench R23 - Cinebench R23 Multi Core
min: 6931 genomsnitt: 8313 median: 8361 (8%) max: 9347 Points
CPU TDP ? TDP 15 W TDP 20 W TDP 23 W TDP 25 W TDP 28 W TDP 37 W TDP 38 W 100% 74% 91% 89% 84% 89% 99% 100%
AMD E1-2100
...
Intel Core i5-1245U
Intel Core i5-11500B
Intel Core i9-9980HK
...
AMD Ryzen 9 9955HX3D
max:
Cinebench R23 - Cinebench R23 Single Core
min: 1371 genomsnitt: 1437 median: 1441 (59%) max: 1470 Points
CPU TDP ? TDP 15 W TDP 20 W TDP 23 W TDP 25 W TDP 28 W TDP 37 W TDP 38 W 98% 95% 97% 98% 99% 98% 100% 100%
AMD A10-5745M
...
...
Apple M5 10-Core
Cinebench R20 - Cinebench R20 CPU (Single Core)
min: 528 genomsnitt: 561 median: 564 (61%) max: 574 Points
CPU TDP ? TDP 15 W TDP 20 W TDP 23 W TDP 25 W TDP 28 W TDP 37 W TDP 38 W 99% 95% 97% 98% 99% 98% 100% 99%
AMD E1-2100
...
Intel Core i5-11500B
...
max:
Intel Core Ultra 7 270K Plus
Cinebench R20 - Cinebench R20 CPU (Multi Core)
min: 2780 genomsnitt: 3246 median: 3281 (8%) max: 3655 Points
CPU TDP ? TDP 15 W TDP 20 W TDP 23 W TDP 25 W TDP 28 W TDP 37 W TDP 38 W 99% 77% 84% 90% 83% 90% 99% 100%
AMD E1-2100
...
Intel Core i5-11500B
Intel Core i9-9880H
...
AMD Ryzen 9 9955HX3D
max:
Cinebench R15 - Cinebench R15 CPU Multi 64 Bit
min: 1101 genomsnitt: 1408 median: 1415 (9%) max: 1599 Points
CPU TDP ? TDP 15 W TDP 20 W TDP 23 W TDP 25 W TDP 28 W TDP 37 W TDP 38 W 100% 75% 81% 94% 83% 88% 96% 100%
AMD A4-1250
...
Intel Core i5-11500B
AMD Ryzen 5 PRO 5675U
...
AMD Ryzen 9 9955HX3D
max:
0 35 70 105 140 175 210 245 280 315 350 385 420 455 490 525 560 595 630 665 700 735 770 805 840 875 910 945 980 1015 1050 1085 1120 1155 1190 1225 1260 1295 1330 1365 1400 1435 1470 1505 1540 1575 Tooltip Geekom A5 Pro: Ø1095 (1078.55-1234.53)
Lenovo ThinkPad L13 Yoga G4 21FSS00100: Ø1082 (1000.35-1289.24)
Dell Inspiron 14 7435 2-in-1: Ø1242 (1217.69-1302.59)
HP ProBook 445 G10: Ø1302 (1245.87-1328.42)
Dell Inspiron 16 7635 2-in-1: Ø1360 (1321.57-1414.73)
Lenovo ThinkPad L14 G4 21H6S00900: Ø1246 (1194.78-1499.93)
Asus VivoBook 15X OLED M3504YA: Ø1457 (1395.38-1541.07)
Lenovo IdeaPad Flex 5 14ABR G8: Ø1381 (1296.43-1597.38)
Lenovo ThinkBook 16 G6 ABP: Ø1519 (1483.51-1598.53)
Cinebench R15 - Cinebench R15 CPU Single 64 Bit
min: 213 genomsnitt: 229.7 median: 231 (64%) max: 237 Points
CPU TDP ? TDP 15 W TDP 20 W TDP 23 W TDP 25 W TDP 28 W TDP 37 W TDP 38 W 96% 94% 97% 97% 99% 97% 100% 99%
AMD A4-1200
...
Intel Core i7-11390H
Intel Core i7-1265U
AMD Ryzen 9 5900HS
...
max:
Intel Core Ultra 9 285K
Cinebench R11.5 - Cinebench R11.5 CPU Multi 64 Bit
Intel Atom N450
...
Intel Core i7-8850H
AMD Ryzen 5 PRO 4650U
Intel Core i7-9750H
Intel Core i9-8950HK
Intel Core i5-11500B
...
AMD Ryzen 9 9955HX3D
max:
Intel Core Ultra 7 270K Plus
Cinebench R11.5 - Cinebench R11.5 CPU Single 64 Bit
AMD C-60
...
Intel Core Ultra 5 115U
Intel Core i7-11390H
...
max:
Intel Core Ultra 9 285K
Cinebench R10 - Cinebench R10 Rend. Single (32bit)
AMD Geode LX 800
...
Intel Core i5-8305G
Intel Core i7-4940MX
Intel Core i7-7700HQ
Intel Core i5-4310U
Intel Core i3-8145U
Intel Core i7-7820HQ
Intel Core i5-8265U
Intel Core i7-7600U
...
max:
Cinebench R10 - Cinebench R10 Rend. Multi (32bit)
Intel Atom 230
...
Intel Core i7-8705G
Intel Core i5-8279U
Intel Core i7-8706G
Intel Core i7-7920HQ
Intel Core i7-8809G
...
max:
Cinebench R10 - Cinebench R10 Rend. Multi (64bit)
AMD C-50
...
Intel Core i9-8950HK
Intel Core i7-9850H
AMD Ryzen 5 PRO 4650U
Intel Core i5-11500B
Intel Core i9-9980HK
...
max:
Intel Core Ultra 7 270K Plus
Cinebench R10 - Cinebench R10 Rend. Single (64bit)
AMD C-50
...
Intel Core i5-11500B
AMD Ryzen 9 5900HS
...
max:
Intel Core Ultra 7 270K Plus
wPrime 2.10 - wPrime 2.0 1024m *
...
Intel Core i5-11500B
Intel Core i7-9750H
Intel Xeon E-2176M
AMD Ryzen 9 9955HX3D
Intel Core i7-10710U
Intel Core i7-8809G
...
VIA C3-M C3-M-1200
wPrime 2.10 - wPrime 2.0 32m *
...
Intel Core i7-10710U
Intel Core i7-1265U
Intel Xeon E-2176M
Intel Core i9-9880H
Intel Core i5-1245U
...
Transmeta Crusoe TM-5800
WinRAR - WinRAR 4.0
AMD Athlon Neo MV-40
...
Intel Core i7-11390H
Intel Core i7-9750H
Intel Core i9-8950HK
Intel Core i7-8559U
Intel Core i9-9880H
...
max:
7-Zip 18.03 - 7-Zip 18.03 Multi Thread 4 runs
min: 32204 genomsnitt: 37701 median: 37554.5 (22%) max: 42364 MIPS
CPU TDP 15 W TDP 20 W TDP 23 W TDP 25 W TDP 28 W TDP 37 W TDP 38 W 80% 87% 88% 90% 91% 97% 100%
AMD E1-2100
...
Intel Core i5-1245U
Intel Core i5-11500B
AMD Ryzen 5 5560U
...
AMD Ryzen 9 9955HX3D
max:
7-Zip 18.03 - 7-Zip 18.03 Single Thread 4 runs
min: 5113 genomsnitt: 5336 median: 5345.5 (61%) max: 5544 MIPS
CPU TDP 15 W TDP 20 W TDP 23 W TDP 25 W TDP 28 W TDP 37 W TDP 38 W 95% 94% 96% 98% 95% 100% 97%
AMD E1-2100
...
...
max:
AMD Ryzen 7 9850X3D
X264 HD Benchmark 4.0 - x264 Pass 2
AMD Athlon Neo MV-40
...
Intel Core i7-10710U
Intel Core Ultra 5 115U
Intel Xeon E-2176M
Intel Core i7-9850H
Intel Core i5-11500B
Intel Core i7-9750H
Intel Core i7-8850H
...
X264 HD Benchmark 4.0 - x264 Pass 1
Intel Atom N2600
...
Intel Core Ultra 5 115U
Intel Core i9-8950HK
Intel Core i7-11390H
Intel Core i5-11500B
...
HWBOT x265 Benchmark v2.2 - HWBOT x265 4k Preset
min: 8.17 genomsnitt: 10.2 median: 10.4 (18%) max: 11.6 fps
CPU TDP 15 W TDP 20 W TDP 23 W TDP 25 W TDP 28 W TDP 37 W TDP 38 W 74% 94% 86% 86% 92% 93% 100%
AMD E1-2100
...
Intel Xeon E-2276M
AMD Ryzen 5 5560U
Intel Core i5-11500B
...
AMD Ryzen 9 9955HX3D
max:
0 1 2 3 4 5 6 7 8 9 10 11 12 13 14 15 16 17 18 Tooltip Lenovo ThinkPad L13 Yoga G4 21FSS00100: Ø8.45 (0.46-12.3)
Geekom A5 Pro: Ø9.91 (1.18-17.8)
HP ProBook 445 G10: Ø10.1 (0.48-14.2)
Lenovo ThinkPad L14 G4 21H6S00900: Ø10.5 (0.82-15.1)
Dell Inspiron 16 7635 2-in-1: Ø11.1 (1.03-17.9)
Asus VivoBook 15X OLED M3504YA: Ø11.2 (1.04-17.9)
Dell Inspiron 14 7435 2-in-1: Ø11.4 (0.95-18.1)
Lenovo ThinkBook 16 G6 ABP: Ø11.9 (0.59-16.4)
TrueCrypt - TrueCrypt Serpent
...
Intel Core i7-9750H
Intel Core i7-8850H
Intel Core i9-8950HK
Intel Core i7-9850H
AMD Ryzen 5 PRO 4650U
...
AMD Ryzen 9 9955HX3D
max:
TrueCrypt - TrueCrypt Twofish
...
Intel Core Ultra 5 115U
Intel Xeon E-2176M
Intel Core i7-10710U
...
max:
TrueCrypt - TrueCrypt AES
Intel Atom N2800
...
Intel Core i9-8950HK
Intel Core i7-9750H
Intel Core i7-8850H
Intel Core i7-9850H
...
max:
Blender - Blender 3.3 Classroom CPU *
min: 583 genomsnitt: 706 median: 713 (9%) max: 820 Seconds
CPU TDP 15 W TDP 20 W TDP 23 W TDP 25 W TDP 28 W TDP 37 W TDP 38 W 100% 101% 101% 102% 102% 103% 103%
AMD Ryzen 9 9955HX3D
...
Intel Core i5-11500B
AMD Ryzen 5 5560U
Intel Core i5-1245U
AMD Ryzen 5 PRO 5675U
...
Intel Celeron J4125
Blender - Blender 2.79 BMW27 CPU *
min: 330 genomsnitt: 386.1 median: 373 (3%) max: 469 Seconds
CPU TDP 15 W TDP 20 W TDP 23 W TDP 25 W TDP 28 W TDP 37 W TDP 38 W 100% 101% 101% 101% 101% 101% 101%
Intel Core i5-1038NG7
...
Intel Core i5-11500B
Intel Xeon E-2276M
Intel Core i5-1245U
AMD Ryzen 5 PRO 5675U
AMD Ryzen 5 5560U
Intel Core i9-9980HK
...
AMD E1-2100
R Benchmark 2.5 - R Benchmark 2.5 *
min: 0.515 genomsnitt: 0.5 median: 0.5 (11%) max: 0.567 sec
CPU TDP 15 W TDP 20 W TDP 23 W TDP 25 W TDP 28 W TDP 37 W TDP 38 W 100% 100% 100% 100% 100% 101% 100%
AMD Ryzen 9 9955HX3D
...
Intel Core i5-1240U
Intel Core i9-9980HK
...
AMD E1-2100
Super Pi mod 1.5 XS 1M - Super Pi mod 1.5 XS 1M *
...
Intel Core i7-8650U
Intel Xeon E-2176M
Intel Core i7-8850H
Intel Xeon E3-1535M v6
Intel Core i5-10210U
Intel Core i5-8400H
...
VIA C3-M C3-M-1200
Super Pi mod 1.5 XS 2M - Super Pi mod 1.5 XS 2M *
...
Intel Core i5-1245U
Intel Core i7-9750H
Intel Core i9-9880H
Intel Core i7-8665U
Intel Xeon E-2176M
...
Intel Celeron Dual-Core T1400
3DMark Vantage - 3DM Vant. Perf. CPU no Physx
Intel Atom N450
...
Intel Core i7-9850H
Intel Core i7-1265U
Intel Xeon E-2176M
Intel Core i9-8950HK
Intel Core i7-9750H
...
max:
Intel Core Ultra 7 270K Plus
3DMark 11 - 3DM11 Performance Physics
min: 10189 genomsnitt: 11829 median: 11963 (29%) max: 12926 Points
CPU TDP ? TDP 15 W TDP 20 W TDP 23 W TDP 25 W TDP 28 W TDP 37 W TDP 38 W 99% 86% 97% 79% 88% 100% 97% 93%
AMD E-240
...
Intel Xeon E-2176M
Intel Core i7-8850H
Intel Core i7-1265U
...
AMD Ryzen 9 9955HX3D
max:
AMD Ryzen 9 9950X3D
3DMark - 3DMark Ice Storm Physics
min: 66657 genomsnitt: 74790 median: 75967 (62%) max: 81747 Points
3DMark - 3DMark Ice Storm Extreme Physics
min: 66251 genomsnitt: 75172 median: 75171.5 (61%) max: 84092 Points
CPU TDP 15 W TDP 37 W 79% 100%
AMD A6-9220e
...
AMD Ryzen 9 5900HS
...
max:
3DMark - 3DMark Ice Storm Unlimited Physics
min: 80961 genomsnitt: 84186 median: 84185.5 (68%) max: 87410 Points
CPU TDP 15 W TDP 37 W 93% 100%
AMD A6-9220e
...
AMD Ryzen 9 9955HX
...
max:
Intel Core Ultra 5 250K Plus
3DMark - 3DMark Cloud Gate Physics
min: 9155 genomsnitt: 11072 median: 10986 (28%) max: 12903 Points
CPU TDP 15 W TDP 20 W TDP 23 W TDP 25 W TDP 37 W 75% 95% 83% 87% 100%
...
Intel Core i7-9750H
AMD Ryzen 5 5560U
...
max:
Intel Core Ultra 7 270K Plus
3DMark - 3DMark Fire Strike Standard Physics
min: 14264 genomsnitt: 18030 median: 18996 (34%) max: 20296 Points
CPU TDP ? TDP 15 W TDP 20 W TDP 23 W TDP 25 W TDP 28 W TDP 37 W TDP 38 W 98% 73% 96% 81% 88% 94% 98% 100%
AMD A6-9220e
...
Intel Core i9-9880H
...
max:
Intel Core Ultra 7 270K Plus
3DMark - 3DMark Time Spy CPU
min: 4384 genomsnitt: 5331 median: 5561 (23%) max: 5891 Points
CPU TDP ? TDP 15 W TDP 20 W TDP 23 W TDP 28 W TDP 37 W TDP 38 W 100% 78% 95% 79% 100% 100% 93%
AMD PRO A12-9800B
...
Intel Core i7-1265U
AMD Ryzen 5 5560U
...
max:
Intel Core Ultra 7 270K Plus
Geekbench 6.7 - Geekbench 6.7.1 Single-Core
min: 1913 genomsnitt: 1958 median: 1969 (45%) max: 1991 poäng
Intel Celeron N4120
...
Intel Core i5-1230U
AMD Ryzen 9 5980HX
...
Apple M5 Pro 15-Core
Geekbench 6.7 - Geekbench 6.7.1 Multi-Core
min: 6099 genomsnitt: 6689 median: 6901 (23%) max: 7067 poäng
AMD A4-9120C
...
Intel Core i9-9880H
AMD Ryzen 5 5560U
...
Apple M5 Max
Geekbench 6.0 - Geekbench 6.0 Single-Core
min: 1805 genomsnitt: 1860 median: 1857 (58%) max: 1919 poäng
CPU TDP 15 W TDP 23 W TDP 37 W 99% 97% 100%
Intel Celeron N2820
...
Intel Core i7-1265U
Intel Core Ultra 5 115U
...
AMD Ryzen 9 9955HX
max:
Intel Core Ultra 7 270K Plus
Geekbench 6.0 - Geekbench 6.0 Multi-Core
min: 5411 genomsnitt: 6202 median: 6298 (26%) max: 6800 poäng
CPU TDP 15 W TDP 23 W TDP 37 W 97% 82% 100%
Intel Celeron N2820
...
Intel Core i7-11390H
Intel Core Ultra 5 115U
...
AMD Ryzen 9 9955HX3D
max:
Geekbench 5.5 - Geekbench 5.1 - 5.5 64 Bit Single-Core
min: 1393 genomsnitt: 1470 median: 1482.5 (50%) max: 1512 poäng
CPU TDP 15 W TDP 20 W TDP 23 W TDP 25 W TDP 28 W TDP 37 W TDP 38 W 97% 99% 96% 98% 99% 100% 100%
AMD E1-2100
...
AMD Ryzen 9 5900HS
...
Apple M5 10-Core
Geekbench 5.5 - Geekbench 5.1 - 5.5 64 Bit Multi-Core
min: 5475 genomsnitt: 6141 median: 6332.5 (11%) max: 6648 poäng
CPU TDP 15 W TDP 20 W TDP 23 W TDP 25 W TDP 28 W TDP 37 W TDP 38 W 90% 97% 82% 84% 100% 96% 98%
AMD E1-2100
...
Intel Core i5-1230U
Intel Core Ultra 5 115U
...
max:
Geekbench 5.0 - Geekbench 5.0 64 Bit Single-Core
min: 1312 genomsnitt: 1397 median: 1437 (6%) max: 1441 poäng
AMD E1-2100
...
AMD Ryzen 5 PRO 5675U
...
AMD Ryzen 9 9955HX3D
max:
AMD Ryzen 7 9850X3D
Geekbench 5.0 - Geekbench 5.0 64 Bit Multi-Core
min: 6158 genomsnitt: 6317 median: 6233 (20%) max: 6560 poäng
AMD E1-2100
...
Intel Core Ultra 5 115U
Intel Core i5-11500B
Intel Core i5-1240U
Intel Core i9-9880H
...
AMD Ryzen 9 9955HX3D
max:
AMD Ryzen Threadripper PRO 3995WX
Geekbench 4.4 - Geekbench 4.1 - 4.4 64 Bit Single-Core
AMD E1-2100
...
Intel Core Ultra 5 115U
AMD Ryzen 9 5980HS
...
AMD Ryzen 9 9955HX3D
max:
Samsung Exynos 2600
Geekbench 4.4 - Geekbench 4.1 - 4.4 64 Bit Multi-Core
AMD E1-2100
...
Intel Core i9-8950HK
Intel Xeon E-2276M
Intel Core Ultra 5 115U
AMD Ryzen 7 4800H
...
AMD Ryzen 9 9955HX3D
max:
Intel Core Ultra 7 270K Plus
Mozilla Kraken 1.1 - Kraken 1.1 Total Score *
min: 614 genomsnitt: 647 median: 630 (1%) max: 770 ms
Apple M5 Pro 18-Core
...
Intel Core i5-1230U
Intel Core i5-11500B
Intel Core i5-1240U
...
AMD A4-1250
max:
Apple S7
Octane V2 - Octane V2 Total Score
unknown
...
Apple M2
...
Apple M5 Pro 18-Core
WebXPRT 4 - WebXPRT 4 Score
min: 183.4 genomsnitt: 206.5 median: 209 (52%) max: 214 Points
Intel Celeron N2820
...
Intel Core i7-11390H
Intel Core i5-1230U
...
Apple M5 Pro 18-Core
WebXPRT 3 - WebXPRT 3 Score
min: 244 genomsnitt: 260 median: 261 (44%) max: 272 Points
AMD E1-2100
...
...
Apple M5 Pro 18-Core
CrossMark - CrossMark Overall
min: 1029 genomsnitt: 1228 median: 1230 (43%) max: 1336 Points
CPU TDP 15 W TDP 20 W TDP 23 W TDP 28 W TDP 37 W TDP 38 W 92% 91% 77% 92% 100% 99%
Intel Pentium B970
...
Intel Core i5-8400H
AMD Ryzen 5 PRO 5675U
AMD Ryzen 5 5560U
Intel Core i5-1230U
...
Apple M5 Max
Power Consumption - Prime95 Power Consumption - external Monitor *
min: 27.5 genomsnitt: 40.1 median: 39.4 (7%) max: 52.5 Watt
CPU TDP 15 W TDP 20 W TDP 23 W TDP 25 W TDP 28 W TDP 37 W TDP 38 W 104% 103% 102% 103% 102% 100% 100%
...
AMD Ryzen 5 5560U
Intel Core i7-7660U
AMD Ryzen 5 3580U
...
AMD Ryzen 9 9955HX3D
max:
AMD Ryzen Threadripper PRO 3975WX
0 5 10 15 20 25 30 35 40 45 50 55 60 Tooltip Lenovo ThinkPad L13 Yoga G4 21FSS00100: Ø27.5 (27.1-28.4)
Geekom A5 Pro: Ø30.6 (24.9-43.4)
HP ProBook 445 G10: Ø35.3 (34.6-43.8)
Dell Inspiron 14 7435 2-in-1: Ø37 (36.3-46.6)
Lenovo ThinkPad L14 G4 21H6S00900: Ø41.8 (35.5-59.1)
Dell Inspiron 16 7635 2-in-1: Ø44.2 (42.8-53.7)
Asus VivoBook 15X OLED M3504YA: Ø51.6 (41.7-60.5)
Lenovo ThinkBook 16 G6 ABP: Ø52.5 (48.9-62.8)
Power Consumption - Cinebench R15 Multi Power Consumption - external Monitor *
min: 32.2 genomsnitt: 44.2 median: 42.8 (8%) max: 59.9 Watt
CPU TDP 15 W TDP 20 W TDP 28 W TDP 37 W TDP 38 W 106% 106% 104% 101% 100%
...
Intel Core i5-8260U
Intel Core i5-8259U
Intel Core i5-1240U
...
AMD Ryzen 9 9955HX3D
max:
0 5 10 15 20 25 30 35 40 45 50 55 60 Tooltip Dell Inspiron 14 7435 2-in-1: Ø32.2 (31.5-45.5)
Geekom A5 Pro: Ø32.6 (31-37.5)
Dell Inspiron 16 7635 2-in-1: Ø42.8 (37.6-50.8)
Asus VivoBook 15X OLED M3504YA: Ø53.6 (52-57.3)
Lenovo ThinkBook 16 G6 ABP: Ø59.9 (55.5-62.3)
Power Consumption - Idle Power Consumption - external Monitor *
min: 3.43 genomsnitt: 5.4 median: 5.5 (4%) max: 7.3 Watt
CPU TDP 15 W TDP 20 W TDP 23 W TDP 25 W TDP 28 W TDP 37 W TDP 38 W 101% 101% 100% 100% 102% 103% 102%
...
Intel Core i5-1230U
...
max:
0 1 2 3 4 5 6 7 8 9 10 11 Tooltip Asus VivoBook 15X OLED M3504YA: Ø3.43 (3.12-4.26)
Lenovo ThinkBook 16 G6 ABP: Ø4.06 (3.77-5.78)
Geekom A5 Pro: Ø4.27 (4-5.07)
Dell Inspiron 16 7635 2-in-1: Ø4.96 (3.99-10.8)
Lenovo ThinkPad L13 Yoga G4 21FSS00100: Ø6.03 (5.28-7.27)
Dell Inspiron 14 7435 2-in-1: Ø6.05 (5.4-9.44)
Lenovo ThinkPad L14 G4 21H6S00900: Ø6.94 (6.2-8.15)
HP ProBook 445 G10: Ø7.3 (3.44-11.3)
Power Consumption - Idle Power Consumption 150cd 1min *
min: 5.25 genomsnitt: 6.5 median: 6.4 (5%) max: 7.64 Watt
CPU TDP 15 W TDP 20 W TDP 23 W TDP 25 W TDP 28 W TDP 38 W 101% 101% 102% 100% 101% 101%
...
Intel Core i9-9880H
Intel Core i3-1005G1
Intel Core Ultra 5 115U
...
max:
0 1 2 3 4 5 6 7 8 9 10 Tooltip Lenovo ThinkPad L14 G4 21H6S00900: Ø5.25 (4.9-6.87)
Lenovo ThinkPad L13 Yoga G4 21FSS00100: Ø6.21 (5.67-10.1)
Dell Inspiron 16 7635 2-in-1: Ø6.24 (5.7-9.37)
Lenovo ThinkBook 16 G6 ABP: Ø6.55 (6.24-7.39)
Dell Inspiron 14 7435 2-in-1: Ø6.87 (6.3-8.7)
HP ProBook 445 G10: Ø7.64 (7.13-9.12)
Power Consumption - Power Efficiency - Cinebench R15 Multi external Monitor
min: 26.7 genomsnitt: 32.5 median: 31.3 (23%) max: 40.5 Points per Watt
CPU TDP 15 W TDP 20 W TDP 37 W TDP 38 W 83% 100% 71% 66%
- Bredd på benchmark-värden för det här grafikkortet
- Genomsnittliga benchmark-värden för det här grafikkortet
* Mindre antal betyder högre prestanda
log 30. 20:04:00
#0 ran 0s before starting gpusingle class +0s ... 0s
#1 no ids found in url (should be separated by "_") +0s ... 0s
#2 not redirecting to Ajax server +0s ... 0s
#3 did not recreate cache, as it is less than 5 days old! Created at Sun, 28 Jun 2026 05:27:26 +0200 +0.004s ... 0.004s
#4 no comparison url found in template nbc.compare_page_2 needed +0.028s ... 0.032s
#5 no comparison url found in template nbc.compare_page_2 needed +0s ... 0.032s
#6 no comparison url found in template nbc.compare_page_2 needed +0s ... 0.032s
#7 composed specs +0s ... 0.032s
#8 did output specs +0s ... 0.032s
#9 getting avg benchmarks for device 14958 +0.05s ... 0.082s
#10 got single benchmarks 14958 +0.026s ... 0.109s
#11 got avg benchmarks for devices +0s ... 0.109s
#12 min, max, avg, median took s +2.937s ... 3.046s
#13 no comparison url found in template nbc.compare_page_2 needed +0.576s ... 3.622s
#14 return log +0s ... 3.622s