Test: Schenker Vision 15 (Intel NUC M15) : Intels svar på XPS 15 och MacBook Pro? (Sammanfattning)
Testgrupp
Gradering | Datum | Modell | Vikt | Höjd | Storlek | Upplösning | Pris |
|---|---|---|---|---|---|---|---|
| 87.7 % v7 (old) | 12/2020 | Schenker Vision 15 i7-1165G7, Iris Xe G7 96EUs | 1.7 kg | 15 mm | 15.60" | 1920x1080 | |
| 89.7 % v7 (old) | 12/2019 | Apple MacBook Pro 16 2019 i9 5500M i9-9880H, Radeon Pro 5500M | 2 kg | 16.2 mm | 16.00" | 3072x1920 | |
| 86.8 % v7 (old) | 06/2020 | Dell XPS 15 9500 Core i5 i5-10300H, UHD Graphics 630 | 1.8 kg | 18 mm | 15.60" | 1920x1200 | |
| 84.5 % v7 (old) | 09/2020 | Honor MagicBook Pro (AMD) R5 4600H, Vega 6 | 1.7 kg | 16.9 mm | 16.10" | 1920x1080 | |
| 84.8 % v7 (old) | LG Gram 15Z90N i5-1035G7, Iris Plus Graphics G7 (Ice Lake 64 EU) | 1.1 kg | 16.8 mm | 15.60" | 1920x1080 |
| Networking | |
| iperf3 transmit AX12 | |
| Schenker Vision 15 | |
| Genomsnitt Intel Wi-Fi 6 AX201 (49.8 - 1775, n=324) | |
| Dell XPS 15 9500 Core i5 | |
| Honor MagicBook Pro (AMD) | |
| LG Gram 15Z90N | |
| Apple MacBook Pro 16 2019 i9 5500M | |
| iperf3 receive AX12 | |
| Schenker Vision 15 | |
| Dell XPS 15 9500 Core i5 | |
| Genomsnitt Intel Wi-Fi 6 AX201 (136 - 1743, n=324) | |
| LG Gram 15Z90N | |
| Apple MacBook Pro 16 2019 i9 5500M | |
| Honor MagicBook Pro (AMD) | |


| |||||||||||||||||||||||||
Distribution av ljusstyrkan: 94 %
Mitt på batteriet: 478 cd/m²
Kontrast: 1770:1 (Svärta: 0.27 cd/m²)
ΔE ColorChecker Calman: 3.2 | ∀{0.5-29.43 Ø4.73}
calibrated: 2
ΔE Greyscale Calman: 4.5 | ∀{0.09-98 Ø4.97}
93.6% sRGB (Argyll 1.6.3 3D)
63.1% AdobeRGB 1998 (Argyll 1.6.3 3D)
70.8% AdobeRGB 1998 (Argyll 3D)
94% sRGB (Argyll 3D)
69.3% Display P3 (Argyll 3D)
Gamma: 2.16
CCT: 6788 K
| Schenker Vision 15 BOE08F5, IPS, 1920x1080, 15.6" | Apple MacBook Pro 16 2019 i9 5500M APPA044, IPS, 3072x1920, 16" | Dell XPS 15 9500 Core i5 Sharp LQ156N1, IPS, 1920x1200, 15.6" | Honor MagicBook Pro (AMD) N161HCA-EA3, IPS, 1920x1080, 16.1" | LG Gram 15Z90N LP156WF9-SPN1, .2 IPS LED, 1920x1080, 15.6" | |
|---|---|---|---|---|---|
| Display | 12% | -10% | -3% | ||
| Display P3 Coverage (%) | 69.3 | 81.5 18% | 67.5 -3% | 66 -5% | |
| sRGB Coverage (%) | 94 | 100 6% | 69.7 -26% | 96.4 3% | |
| AdobeRGB 1998 Coverage (%) | 70.8 | 79.6 12% | 69.7 -2% | 66.8 -6% | |
| Response Times | 12% | 28% | 36% | 42% | |
| Response Time Grey 50% / Grey 80% * (ms) | 60 ? | 52.4 ? 13% | 42 ? 30% | 37.6 ? 37% | 36 ? 40% |
| Response Time Black / White * (ms) | 39 ? | 34.9 ? 11% | 28.8 ? 26% | 25.6 ? 34% | 22 ? 44% |
| PWM Frequency (Hz) | 131700 | 25250 ? | |||
| Screen | 15% | 1% | 24% | 6% | |
| Brightness middle (cd/m²) | 478 | 519 9% | 592 24% | 337 -29% | 366 -23% |
| Brightness (cd/m²) | 462 | 477 3% | 565 22% | 312 -32% | 342 -26% |
| Brightness Distribution (%) | 94 | 86 -9% | 85 -10% | 89 -5% | 88 -6% |
| Black Level * (cd/m²) | 0.27 | 0.39 -44% | 0.46 -70% | 0.2 26% | 0.28 -4% |
| Contrast (:1) | 1770 | 1331 -25% | 1287 -27% | 1685 -5% | 1307 -26% |
| Colorchecker dE 2000 * | 3.2 | 2.28 29% | 3.19 -0% | 0.8 75% | 2.68 16% |
| Colorchecker dE 2000 max. * | 8.4 | 6.54 22% | 5.45 35% | 1.1 87% | 5.25 37% |
| Colorchecker dE 2000 calibrated * | 2 | 0.86 57% | 2.03 -1% | 0.7 65% | 1.08 46% |
| Greyscale dE 2000 * | 4.5 | 0.9 80% | 3.9 13% | 1 78% | 2.4 47% |
| Gamma | 2.16 102% | 2145 0% | 2.25 98% | 2.2 100% | 2.25 98% |
| CCT | 6788 96% | 6572 99% | 6522 100% | 6538 99% | 6474 100% |
| Color Space (Percent of AdobeRGB 1998) (%) | 63.1 | 78 24% | 71.6 13% | 63.8 1% | 61 -3% |
| Color Space (Percent of sRGB) (%) | 93.6 | 100 7% | 99.5 6% | 96 3% | |
| Totalt genomsnitt (program/inställningar) | 14% /
14% | 14% /
6% | 17% /
19% | 15% /
9% |
* ... mindre är bättre
Visa svarstider
| ↔ Svarstid svart till vitt | ||
|---|---|---|
| 39 ms ... stiga ↗ och falla ↘ kombinerat | ↗ 19.2 ms stiga | 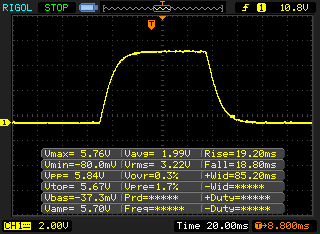 |
| ↘ 18.8 ms hösten | ||
| Skärmen visar långsamma svarsfrekvenser i våra tester och kommer att vara otillfredsställande för spelare. I jämförelse sträcker sig alla testade enheter från 0.1 (minst) till 240 (maximalt) ms. » 97 % av alla enheter är bättre. Detta innebär att den uppmätta svarstiden är sämre än genomsnittet av alla testade enheter (19.9 ms). | ||
| ↔ Svarstid 50 % grått till 80 % grått | ||
| 60 ms ... stiga ↗ och falla ↘ kombinerat | ↗ 29.2 ms stiga | 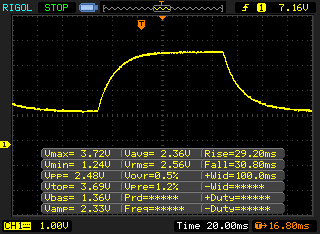 |
| ↘ 30.8 ms hösten | ||
| Skärmen visar långsamma svarsfrekvenser i våra tester och kommer att vara otillfredsställande för spelare. I jämförelse sträcker sig alla testade enheter från 0.165 (minst) till 636 (maximalt) ms. » 96 % av alla enheter är bättre. Detta innebär att den uppmätta svarstiden är sämre än genomsnittet av alla testade enheter (31.1 ms). | ||
Skärmflimmer / PWM (Puls-Width Modulation)
| Skärmflimmer / PWM upptäcktes inte |  | ||
Som jämförelse: 52 % av alla testade enheter använder inte PWM för att dämpa skärmen. Om PWM upptäcktes mättes ett medelvärde av 7798 (minst: 5 - maximum: 343500) Hz. | |||
Cinebench R15: CPU Single 64Bit | CPU Multi 64Bit
Blender: v2.79 BMW27 CPU
7-Zip 18.03: 7z b 4 -mmt1 | 7z b 4
Geekbench 5.5: Single-Core | Multi-Core
HWBOT x265 Benchmark v2.2: 4k Preset
LibreOffice : 20 Documents To PDF
R Benchmark 2.5: Overall mean
| Cinebench R20 / CPU (Single Core) | |
| Genomsnitt av klass Multimedia (425 - 853, n=64, senaste 2 åren) | |
| Genomsnitt Intel Core i7-1165G7 (442 - 589, n=81) | |
| Schenker Vision 15 | |
| HP EliteBook 845 G7 Ryzen 7 Pro 4750U | |
| Apple MacBook Pro 16 2019 i9 5500M | |
| Apple MacBook Pro 16 2019 i9 5500M | |
| Honor MagicBook Pro (AMD) | |
| Dell XPS 15 9500 Core i5 | |
| LG Gram 15Z90N | |
| Cinebench R20 / CPU (Multi Core) | |
| Genomsnitt av klass Multimedia (1887 - 12912, n=64, senaste 2 åren) | |
| Apple MacBook Pro 16 2019 i9 5500M | |
| Apple MacBook Pro 16 2019 i9 5500M | |
| HP EliteBook 845 G7 Ryzen 7 Pro 4750U | |
| Honor MagicBook Pro (AMD) | |
| Dell XPS 15 9500 Core i5 | |
| Schenker Vision 15 | |
| Genomsnitt Intel Core i7-1165G7 (1060 - 2657, n=81) | |
| LG Gram 15Z90N | |
| Cinebench R15 / CPU Single 64Bit | |
| Genomsnitt av klass Multimedia (184.8 - 326, n=66, senaste 2 åren) | |
| Schenker Vision 15 | |
| Genomsnitt Intel Core i7-1165G7 (115 - 230, n=78) | |
| Dell XPS 15 9500 Core i5 | |
| Apple MacBook Pro 16 2019 i9 5500M | |
| Apple MacBook Pro 16 2019 i9 5500M | |
| HP EliteBook 845 G7 Ryzen 7 Pro 4750U | |
| Honor MagicBook Pro (AMD) | |
| LG Gram 15Z90N | |
| Cinebench R15 / CPU Multi 64Bit | |
| Genomsnitt av klass Multimedia (856 - 5224, n=68, senaste 2 åren) | |
| Apple MacBook Pro 16 2019 i9 5500M | |
| Apple MacBook Pro 16 2019 i9 5500M | |
| Honor MagicBook Pro (AMD) | |
| HP EliteBook 845 G7 Ryzen 7 Pro 4750U | |
| Schenker Vision 15 | |
| Dell XPS 15 9500 Core i5 | |
| Genomsnitt Intel Core i7-1165G7 (553 - 1027, n=86) | |
| LG Gram 15Z90N | |
| Blender / v2.79 BMW27 CPU | |
| LG Gram 15Z90N | |
| Genomsnitt Intel Core i7-1165G7 (468 - 1138, n=80) | |
| Schenker Vision 15 | |
| Dell XPS 15 9500 Core i5 | |
| Honor MagicBook Pro (AMD) | |
| Apple MacBook Pro 16 2019 i9 5500M | |
| HP EliteBook 845 G7 Ryzen 7 Pro 4750U | |
| Genomsnitt av klass Multimedia (100 - 557, n=65, senaste 2 åren) | |
| 7-Zip 18.03 / 7z b 4 -mmt1 | |
| Genomsnitt av klass Multimedia (3666 - 7545, n=63, senaste 2 åren) | |
| Genomsnitt Intel Core i7-1165G7 (4478 - 5507, n=80) | |
| Schenker Vision 15 | |
| Dell XPS 15 9500 Core i5 | |
| Apple MacBook Pro 16 2019 i9 5500M | |
| HP EliteBook 845 G7 Ryzen 7 Pro 4750U | |
| Honor MagicBook Pro (AMD) | |
| LG Gram 15Z90N | |
| 7-Zip 18.03 / 7z b 4 | |
| Genomsnitt av klass Multimedia (29095 - 130368, n=62, senaste 2 åren) | |
| HP EliteBook 845 G7 Ryzen 7 Pro 4750U | |
| Apple MacBook Pro 16 2019 i9 5500M | |
| Honor MagicBook Pro (AMD) | |
| Schenker Vision 15 | |
| Dell XPS 15 9500 Core i5 | |
| Genomsnitt Intel Core i7-1165G7 (15347 - 27405, n=80) | |
| LG Gram 15Z90N | |
| Geekbench 5.5 / Single-Core | |
| Genomsnitt av klass Multimedia (805 - 2974, n=62, senaste 2 åren) | |
| Schenker Vision 15 | |
| Genomsnitt Intel Core i7-1165G7 (1302 - 1595, n=77) | |
| Dell XPS 15 9500 Core i5 | |
| LG Gram 15Z90N | |
| HP EliteBook 845 G7 Ryzen 7 Pro 4750U | |
| Honor MagicBook Pro (AMD) | |
| Apple MacBook Pro 16 2019 i9 5500M | |
| Geekbench 5.5 / Multi-Core | |
| Genomsnitt av klass Multimedia (4652 - 20422, n=62, senaste 2 åren) | |
| Apple MacBook Pro 16 2019 i9 5500M | |
| HP EliteBook 845 G7 Ryzen 7 Pro 4750U | |
| Honor MagicBook Pro (AMD) | |
| Schenker Vision 15 | |
| Genomsnitt Intel Core i7-1165G7 (3078 - 5926, n=77) | |
| Dell XPS 15 9500 Core i5 | |
| LG Gram 15Z90N | |
| HWBOT x265 Benchmark v2.2 / 4k Preset | |
| Genomsnitt av klass Multimedia (5.26 - 36.1, n=63, senaste 2 åren) | |
| Apple MacBook Pro 16 2019 i9 5500M | |
| HP EliteBook 845 G7 Ryzen 7 Pro 4750U | |
| Honor MagicBook Pro (AMD) | |
| Schenker Vision 15 | |
| Dell XPS 15 9500 Core i5 | |
| Genomsnitt Intel Core i7-1165G7 (1.39 - 8.47, n=80) | |
| LibreOffice / 20 Documents To PDF | |
| HP EliteBook 845 G7 Ryzen 7 Pro 4750U | |
| Dell XPS 15 9500 Core i5 | |
| Honor MagicBook Pro (AMD) | |
| Apple MacBook Pro 16 2019 i9 5500M | |
| Apple MacBook Pro 16 2019 i9 5500M | |
| Genomsnitt av klass Multimedia (23.9 - 146.7, n=64, senaste 2 åren) | |
| Genomsnitt Intel Core i7-1165G7 (21.5 - 88.1, n=78) | |
| Schenker Vision 15 | |
| LG Gram 15Z90N | |
| R Benchmark 2.5 / Overall mean | |
| LG Gram 15Z90N | |
| Apple MacBook Pro 16 2019 i9 5500M | |
| Apple MacBook Pro 16 2019 i9 5500M | |
| Dell XPS 15 9500 Core i5 | |
| Honor MagicBook Pro (AMD) | |
| HP EliteBook 845 G7 Ryzen 7 Pro 4750U | |
| Genomsnitt Intel Core i7-1165G7 (0.552 - 1.002, n=80) | |
| Schenker Vision 15 | |
| Genomsnitt av klass Multimedia (0.3604 - 0.947, n=63, senaste 2 åren) | |
* ... mindre är bättre
| PCMark 8 | |
| Home Score Accelerated v2 | |
| Genomsnitt av klass Multimedia (n=1senaste 2 åren) | |
| Schenker Vision 15 | |
| Apple MacBook Pro 16 2019 i9 5500M | |
| Honor MagicBook Pro (AMD) | |
| Genomsnitt Intel Core i7-1165G7, Intel Iris Xe Graphics G7 96EUs (3769 - 5686, n=17) | |
| Dell XPS 15 9500 Core i5 | |
| LG Gram 15Z90N | |
| Work Score Accelerated v2 | |
| Dell XPS 15 9500 Core i5 | |
| Honor MagicBook Pro (AMD) | |
| Apple MacBook Pro 16 2019 i9 5500M | |
| LG Gram 15Z90N | |
| Schenker Vision 15 | |
| Genomsnitt Intel Core i7-1165G7, Intel Iris Xe Graphics G7 96EUs (2431 - 3221, n=15) | |
| Creative Score Accelerated v2 | |
| Schenker Vision 15 | |
| Apple MacBook Pro 16 2019 i9 5500M | |
| Genomsnitt Intel Core i7-1165G7, Intel Iris Xe Graphics G7 96EUs (3171 - 7783, n=7) | |
| Honor MagicBook Pro (AMD) | |
| LG Gram 15Z90N | |
| PCMark 8 Home Score Accelerated v2 | 5364 poäng | |
| PCMark 8 Creative Score Accelerated v2 | 7573 poäng | |
| PCMark 8 Work Score Accelerated v2 | 3169 poäng | |
| PCMark 10 Score | 5158 poäng | |
Hjälp | ||
| DPC Latencies / LatencyMon - interrupt to process latency (max), Web, Youtube, Prime95 | |
| Schenker Vision 15 | |
| LG Gram 15Z90N | |
| Dell XPS 15 9500 Core i5 | |
| Honor MagicBook Pro (AMD) | |
* ... mindre är bättre
| Schenker Vision 15 Samsung SSD 980 Pro 1TB MZ-V8P1T0BW | Apple MacBook Pro 16 2019 i9 5500M Apple SSD AP1024 7171 | Dell XPS 15 9500 Core i5 Toshiba KBG40ZNS256G NVMe | Honor MagicBook Pro (AMD) WDC PC SN730 SDBPNTY-512G | LG Gram 15Z90N SK Hynix PC401 512GB M.2 (HFS512GD9TNG) | Genomsnitt Samsung SSD 980 Pro 1TB MZ-V8P1T0BW | |
|---|---|---|---|---|---|---|
| CrystalDiskMark 5.2 / 6 | -53% | -62% | -49% | -44% | -1% | |
| Write 4K (MB/s) | 238.1 | 55.5 -77% | 93.3 -61% | 156.9 -34% | 177.1 -26% | 220 ? -8% |
| Read 4K (MB/s) | 79.2 | 16.21 -80% | 45.9 -42% | 48.81 -38% | 47.88 -40% | 85.1 ? 7% |
| Write Seq (MB/s) | 4139 | 1959 -53% | 1211 -71% | 1050 -75% | 2182 -47% | 3911 ? -6% |
| Read Seq (MB/s) | 4133 | 1763 -57% | 1633 -60% | 2517 -39% | 1900 -54% | 3999 ? -3% |
| Write 4K Q32T1 (MB/s) | 697 | 398.5 -43% | 273.1 -61% | 408.7 -41% | 448.4 -36% | 551 ? -21% |
| Read 4K Q32T1 (MB/s) | 758 | 648 -15% | 356 -53% | 504 -34% | 470.3 -38% | 977 ? 29% |
| Write Seq Q32T1 (MB/s) | 5187 | 2727 -47% | 1198 -77% | 1087 -79% | 2228 -57% | 4932 ? -5% |
| Read Seq Q32T1 (MB/s) | 7117 | 3242 -54% | 2269 -68% | 3407 -52% | 3454 -51% | 6842 ? -4% |
| Write 4K Q8T8 (MB/s) | 1283 | 1390 ? | ||||
| Read 4K Q8T8 (MB/s) | 1052 | 2134 ? | ||||
| AS SSD | -82% | -265% | -39% | -46% | -9% | |
| Seq Read (MB/s) | 5427 | 2531 -53% | 1423 -74% | 2749 -49% | 2842 -48% | 4838 ? -11% |
| Seq Write (MB/s) | 3886 | 2289 -41% | 766 -80% | 2348 -40% | 974 -75% | 3490 ? -10% |
| 4K Read (MB/s) | 72.9 | 15.85 -78% | 42.21 -42% | 44.22 -39% | 50.5 -31% | 72 ? -1% |
| 4K Write (MB/s) | 219.3 | 39.88 -82% | 74.8 -66% | 140.5 -36% | 147.5 -33% | 188.8 ? -14% |
| 4K-64 Read (MB/s) | 2209 | 1267 -43% | 973 -56% | 1450 -34% | 1191 -46% | 2234 ? 1% |
| 4K-64 Write (MB/s) | 2265 | 1749 -23% | 218.8 -90% | 2346 4% | 1275 -44% | 2622 ? 16% |
| Access Time Read * (ms) | 0.033 | 0.122 -270% | 0.125 -279% | 0.079 -139% | 0.043 -30% | 0.04075 ? -23% |
| Access Time Write * (ms) | 0.02 | 0.095 -375% | 0.552 -2660% | 0.027 -35% | 0.027 -35% | 0.03363 ? -68% |
| Score Read (Points) | 2825 | 1536 -46% | 1157 -59% | 1769 -37% | 1526 -46% | 2811 ? 0% |
| Score Write (Points) | 2873 | 2018 -30% | 370 -87% | 2721 -5% | 1520 -47% | 3159 ? 10% |
| Score Total (Points) | 7069 | 4317 -39% | 2094 -70% | 5376 -24% | 3741 -47% | 7334 ? 4% |
| Copy ISO MB/s (MB/s) | 2775 | 1995 -28% | 1151 -59% | 1135 -59% | 2688 ? -3% | |
| Copy Program MB/s (MB/s) | 662 | 584 -12% | 499.4 -25% | 346 -48% | 568 ? -14% | |
| Copy Game MB/s (MB/s) | 1655 | 1135 -31% | 733 -56% | 665 -60% | 1346 ? -19% | |
| Totalt genomsnitt (program/inställningar) | -68% /
-72% | -164% /
-191% | -44% /
-43% | -45% /
-45% | -5% /
-7% |
* ... mindre är bättre

DiskSpd Read Loop, Queue Depth 8
| 3DMark 11 Performance | 7478 poäng | |
| 3DMark Ice Storm Standard Score | 72171 poäng | |
| 3DMark Fire Strike Score | 5238 poäng | |
| 3DMark Time Spy Score | 1804 poäng | |
Hjälp | ||
| låg | med. | hög | ultra | |
|---|---|---|---|---|
| The Witcher 3 (2015) | 97.8 | 63.1 | 35.4 | 15.5 |
| Dota 2 Reborn (2015) | 76.5 | 76.2 | 53.6 | 49.7 |
| X-Plane 11.11 (2018) | 46.4 | 39.3 | 34.4 | |
| Far Cry 5 (2018) | 63 | 30 | 28 | 26 |
| F1 2020 (2020) | 93 | 50 | 38 | 24 |
Ljudnivå
| Låg belastning |
| 29.8 / 29.8 / 31.1 dB(A) |
| Hög belastning |
| 40.5 / 40.5 dB(A) |
 | ||
30 dB tyst 40 dB(A) hörbar 50 dB(A) högt ljud |
||
min: | ||
| Schenker Vision 15 Iris Xe G7 96EUs, i7-1165G7, Samsung SSD 980 Pro 1TB MZ-V8P1T0BW | Apple MacBook Pro 16 2019 i9 5500M Radeon Pro 5500M, i9-9880H, Apple SSD AP1024 7171 | Dell XPS 15 9500 Core i5 UHD Graphics 630, i5-10300H, Toshiba KBG40ZNS256G NVMe | Honor MagicBook Pro (AMD) Vega 6, R5 4600H, WDC PC SN730 SDBPNTY-512G | LG Gram 15Z90N Iris Plus Graphics G7 (Ice Lake 64 EU), i5-1035G7, SK Hynix PC401 512GB M.2 (HFS512GD9TNG) | |
|---|---|---|---|---|---|
| Noise | -4% | 9% | 8% | 3% | |
| av / miljö * (dB) | 29.8 | 29.8 -0% | 28 6% | 29.7 -0% | 30.7 -3% |
| Idle Minimum * (dB) | 29.8 | 29.9 -0% | 28 6% | 29.7 -0% | 30.7 -3% |
| Idle Average * (dB) | 29.8 | 29.9 -0% | 28 6% | 29.7 -0% | 30.7 -3% |
| Idle Maximum * (dB) | 31.1 | 29.9 4% | 28 10% | 30.5 2% | 31.9 -3% |
| Load Average * (dB) | 40.5 | 43 -6% | 28 31% | 31 23% | 34 16% |
| Witcher 3 ultra * (dB) | 40.5 | 45.4 -12% | 31.3 23% | ||
| Load Maximum * (dB) | 40.5 | 46.1 -14% | 41.9 -3% | 36.7 9% | 34.2 16% |
* ... mindre är bättre
(±) Den maximala temperaturen på ovansidan är 42.4 °C / 108 F, jämfört med genomsnittet av 36.8 °C / 98 F , allt från 21 till 71 °C för klassen Multimedia.
(-) Botten värms upp till maximalt 46.8 °C / 116 F, jämfört med genomsnittet av 39.1 °C / 102 F
(+) Vid tomgångsbruk är medeltemperaturen för ovansidan 23.6 °C / 74 F, jämfört med enhetsgenomsnittet på 31.3 °C / ### class_avg_f### F.
(+) När du spelar The Witcher 3 är medeltemperaturen för ovansidan 29.7 °C / 85 F, jämfört med enhetsgenomsnittet på 31.3 °C / ## #class_avg_f### F.
(+) Handledsstöden och pekplattan är kallare än hudtemperaturen med maximalt 25.9 °C / 78.6 F och är därför svala att ta på.
(+) Medeltemperaturen för handledsstödsområdet på liknande enheter var 28.7 °C / 83.7 F (+2.8 °C / 5.1 F).
Schenker Vision 15 ljudanalys
(±) | högtalarljudstyrkan är genomsnittlig men bra (79.5 dB)
Bas 100 - 315 Hz
(-) | nästan ingen bas - i genomsnitt 17% lägre än medianen
(±) | linjäriteten för basen är genomsnittlig (11.5% delta till föregående frekvens)
Mellan 400 - 2000 Hz
(+) | balanserad mellan - endast 3.2% från medianen
(+) | mids är linjära (4.5% delta till föregående frekvens)
Högsta 2 - 16 kHz
(+) | balanserade toppar - endast 3.3% från medianen
(+) | toppar är linjära (5.4% delta till föregående frekvens)
Totalt 100 - 16 000 Hz
(±) | linjäriteten för det totala ljudet är genomsnittlig (19.5% skillnad mot median)
Jämfört med samma klass
» 64% av alla testade enheter i den här klassen var bättre, 7% liknande, 29% sämre
» Den bästa hade ett delta på 5%, genomsnittet var 17%, sämst var 45%
Jämfört med alla testade enheter
» 48% av alla testade enheter var bättre, 7% liknande, 44% sämre
» Den bästa hade ett delta på 4%, genomsnittet var 24%, sämst var 134%
Dell XPS 15 9500 Core i5 ljudanalys
(+) | högtalare kan spela relativt högt (84.2 dB)
Bas 100 - 315 Hz
(+) | bra bas - bara 4.6% från medianen
(±) | linjäriteten för basen är genomsnittlig (10% delta till föregående frekvens)
Mellan 400 - 2000 Hz
(+) | balanserad mellan - endast 3.3% från medianen
(+) | mids är linjära (4.5% delta till föregående frekvens)
Högsta 2 - 16 kHz
(+) | balanserade toppar - endast 2.4% från medianen
(+) | toppar är linjära (4.3% delta till föregående frekvens)
Totalt 100 - 16 000 Hz
(+) | det totala ljudet är linjärt (7.7% skillnad mot median)
Jämfört med samma klass
» 6% av alla testade enheter i den här klassen var bättre, 2% liknande, 91% sämre
» Den bästa hade ett delta på 5%, genomsnittet var 17%, sämst var 45%
Jämfört med alla testade enheter
» 1% av alla testade enheter var bättre, 0% liknande, 98% sämre
» Den bästa hade ett delta på 4%, genomsnittet var 24%, sämst var 134%
| Av/Standby | |
| Låg belastning | |
| Hög belastning |
|
Förklaring:
min: | |
| Schenker Vision 15 i7-1165G7, Iris Xe G7 96EUs, Samsung SSD 980 Pro 1TB MZ-V8P1T0BW, IPS, 1920x1080, 15.6" | Apple MacBook Pro 16 2019 i9 5500M i9-9880H, Radeon Pro 5500M, Apple SSD AP1024 7171, IPS, 3072x1920, 16" | Dell XPS 15 9500 Core i5 i5-10300H, UHD Graphics 630, Toshiba KBG40ZNS256G NVMe, IPS, 1920x1200, 15.6" | Honor MagicBook Pro (AMD) R5 4600H, Vega 6, WDC PC SN730 SDBPNTY-512G, IPS, 1920x1080, 16.1" | LG Gram 15Z90N i5-1035G7, Iris Plus Graphics G7 (Ice Lake 64 EU), SK Hynix PC401 512GB M.2 (HFS512GD9TNG), .2 IPS LED, 1920x1080, 15.6" | Genomsnitt Intel Iris Xe Graphics G7 96EUs | Genomsnitt av klass Multimedia | |
|---|---|---|---|---|---|---|---|
| Power Consumption | -85% | -12% | -10% | 1% | -32% | -64% | |
| Idle Minimum * (Watt) | 3.5 | 3.7 -6% | 2.9 17% | 4.2 -20% | 2.9 17% | 5.51 ? -57% | 5.71 ? -63% |
| Idle Average * (Watt) | 6.3 | 12.1 -92% | 7.6 -21% | 8.4 -33% | 7.7 -22% | 8.66 ? -37% | 10.1 ? -60% |
| Idle Maximum * (Watt) | 6.8 | 17 -150% | 8 -18% | 9.7 -43% | 11.4 -68% | 10.9 ? -60% | 12.4 ? -82% |
| Load Average * (Watt) | 43.2 | 91.5 -112% | 41.7 3% | 39.5 9% | 31.5 27% | 45.6 ? -6% | 65 ? -50% |
| Witcher 3 ultra * (Watt) | 52 | 103 -98% | 39.1 25% | ||||
| Load Maximum * (Watt) | 67.7 | 102.3 -51% | 94.8 -40% | 67.1 1% | 32 53% | 67.8 ? -0% | 112.2 ? -66% |
* ... mindre är bättre
| Schenker Vision 15 i7-1165G7, Iris Xe G7 96EUs, 73 Wh | Apple MacBook Pro 16 2019 i9 5500M i9-9880H, Radeon Pro 5500M, 99.8 Wh | Dell XPS 15 9500 Core i5 i5-10300H, UHD Graphics 630, 56 Wh | Honor MagicBook Pro (AMD) R5 4600H, Vega 6, 56 Wh | LG Gram 15Z90N i5-1035G7, Iris Plus Graphics G7 (Ice Lake 64 EU), 80 Wh | Genomsnitt av klass Multimedia | |
|---|---|---|---|---|---|---|
| Batteridrifttid | -31% | -8% | -28% | 54% | -1% | |
| H.264 (h) | 18.7 | 9.7 -48% | 10.6 -43% | 11.2 -40% | 16.4 ? -12% | |
| WiFi v1.3 (h) | 15.2 | 12 -21% | 9.3 -39% | 10.3 -32% | 12.1 -20% | 12 ? -21% |
| Load (h) | 1.3 | 1 -23% | 1.6 23% | 1.2 -8% | 4.2 223% | 1.675 ? 29% |
| Witcher 3 ultra (h) | 0.9 | |||||
| Reader / Idle (h) | 26.4 | 25.6 | 25.2 ? |
För
Emot
Omdöme - Övertygande första försök
Läs den fullständiga versionen av den här recensionen på engelska här.
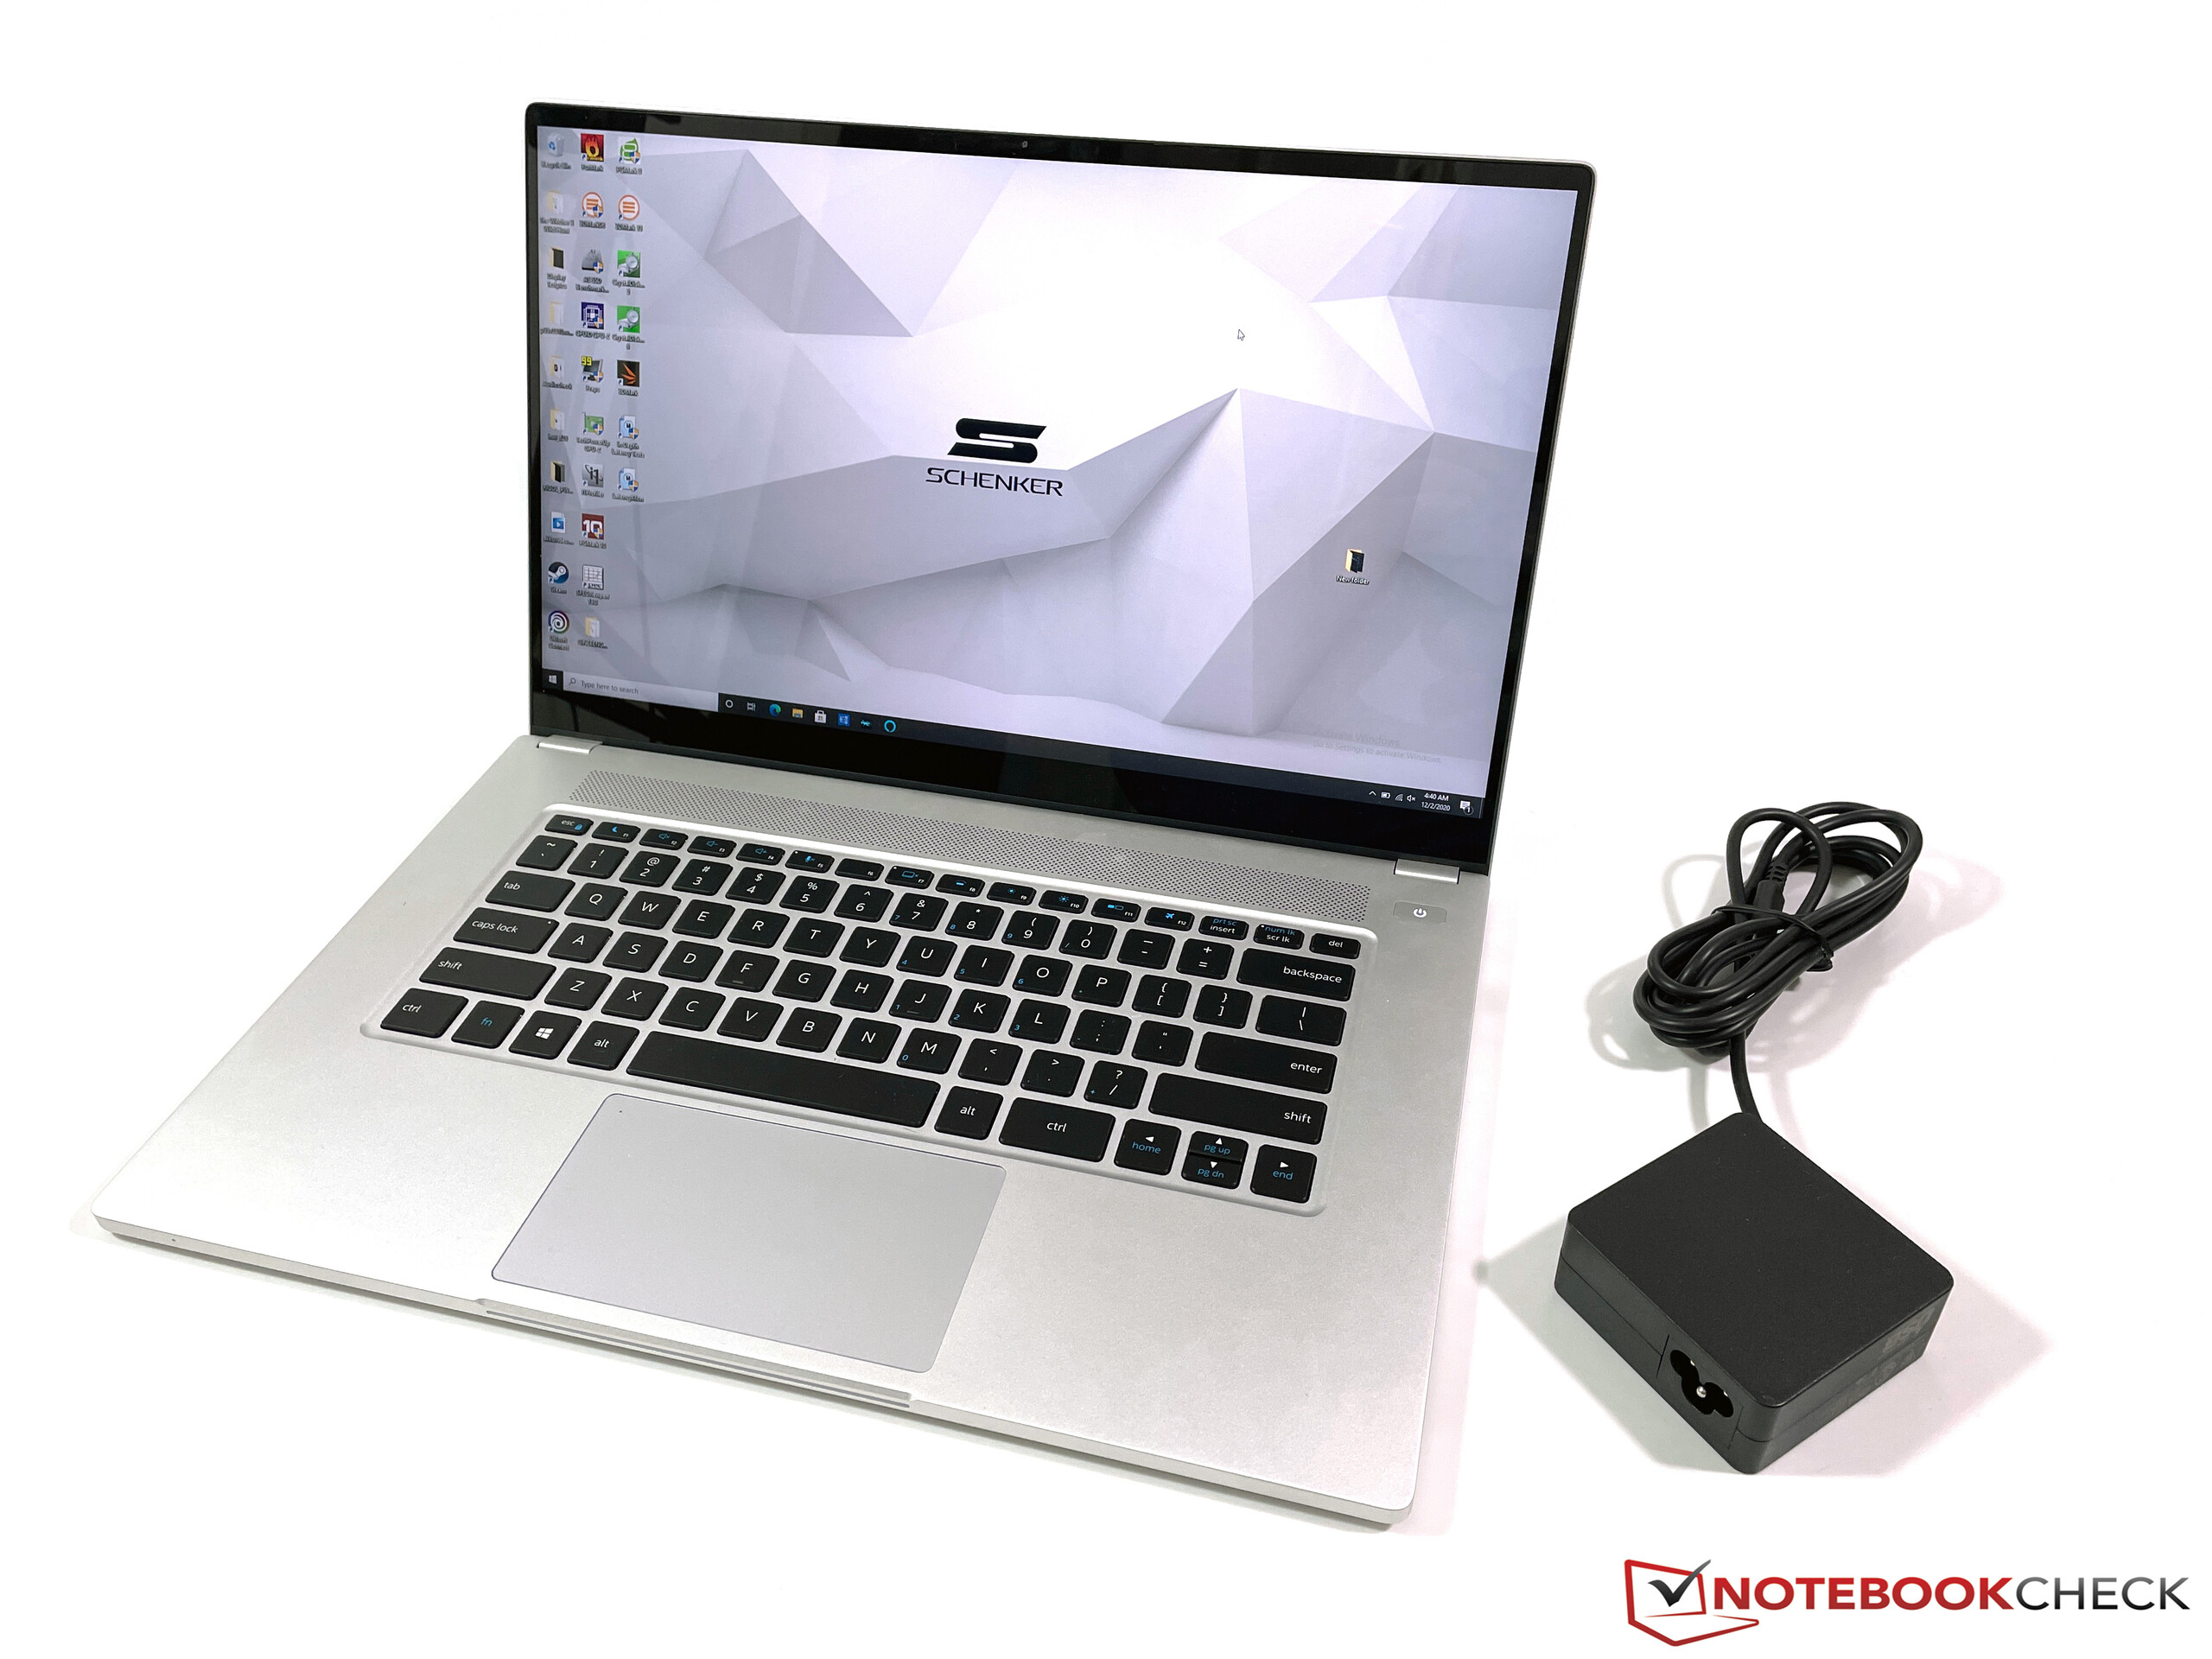
Intels referenslaptop, som utvecklats tillsammans med NUC-teamet, förvånade onekligen många användare. Den verkar lyxig och med ett instegspris på 15.000 kronor positionerar Intel enheten som en konkurrent till andra lyxigare multimedialaptops från exempelvis Dell och Apple. Att den saknar en dedikerad GPU är inte nödvändigtvis ett problem med tanke på den nya iGPU:ns prestanda och långt ifrån alla vill spela spel på sin laptop.
Schenker Vision 15 som vi recenserar är den första konsumentmodellen baserad på NUC M15-designen. Processorn är en aktuell Tiger Lake i7 och prestandan utnyttjas väldigt bra här. Vi uppskattade särskilt att alla prestanda- och fläktkontroller går att styra direkt från Windows power slider, vilket är enkelt och bekvämt. Vi uppskattade också kyllösningen. Yttemperaturerna håller sig väldigt långa även vid belastning. Men med den aktuella BIOS-versionen är fläktarna väldigt känsliga för belastning och börjar snabbt att snurra även när så inte är nödvändigt. Vi tycker att detta borde kunna bli bättre i den färdiga produkten.
Hög prestanda, moderna portar, utmärkt chassi och lång batteritid: Intels referensdesign utgör en bra grund, det är bara skärmen som inte riktigt kan nå upp till förväntningarna det höga priset sätter. Intel borde dessutom justera fläktkontrollen.
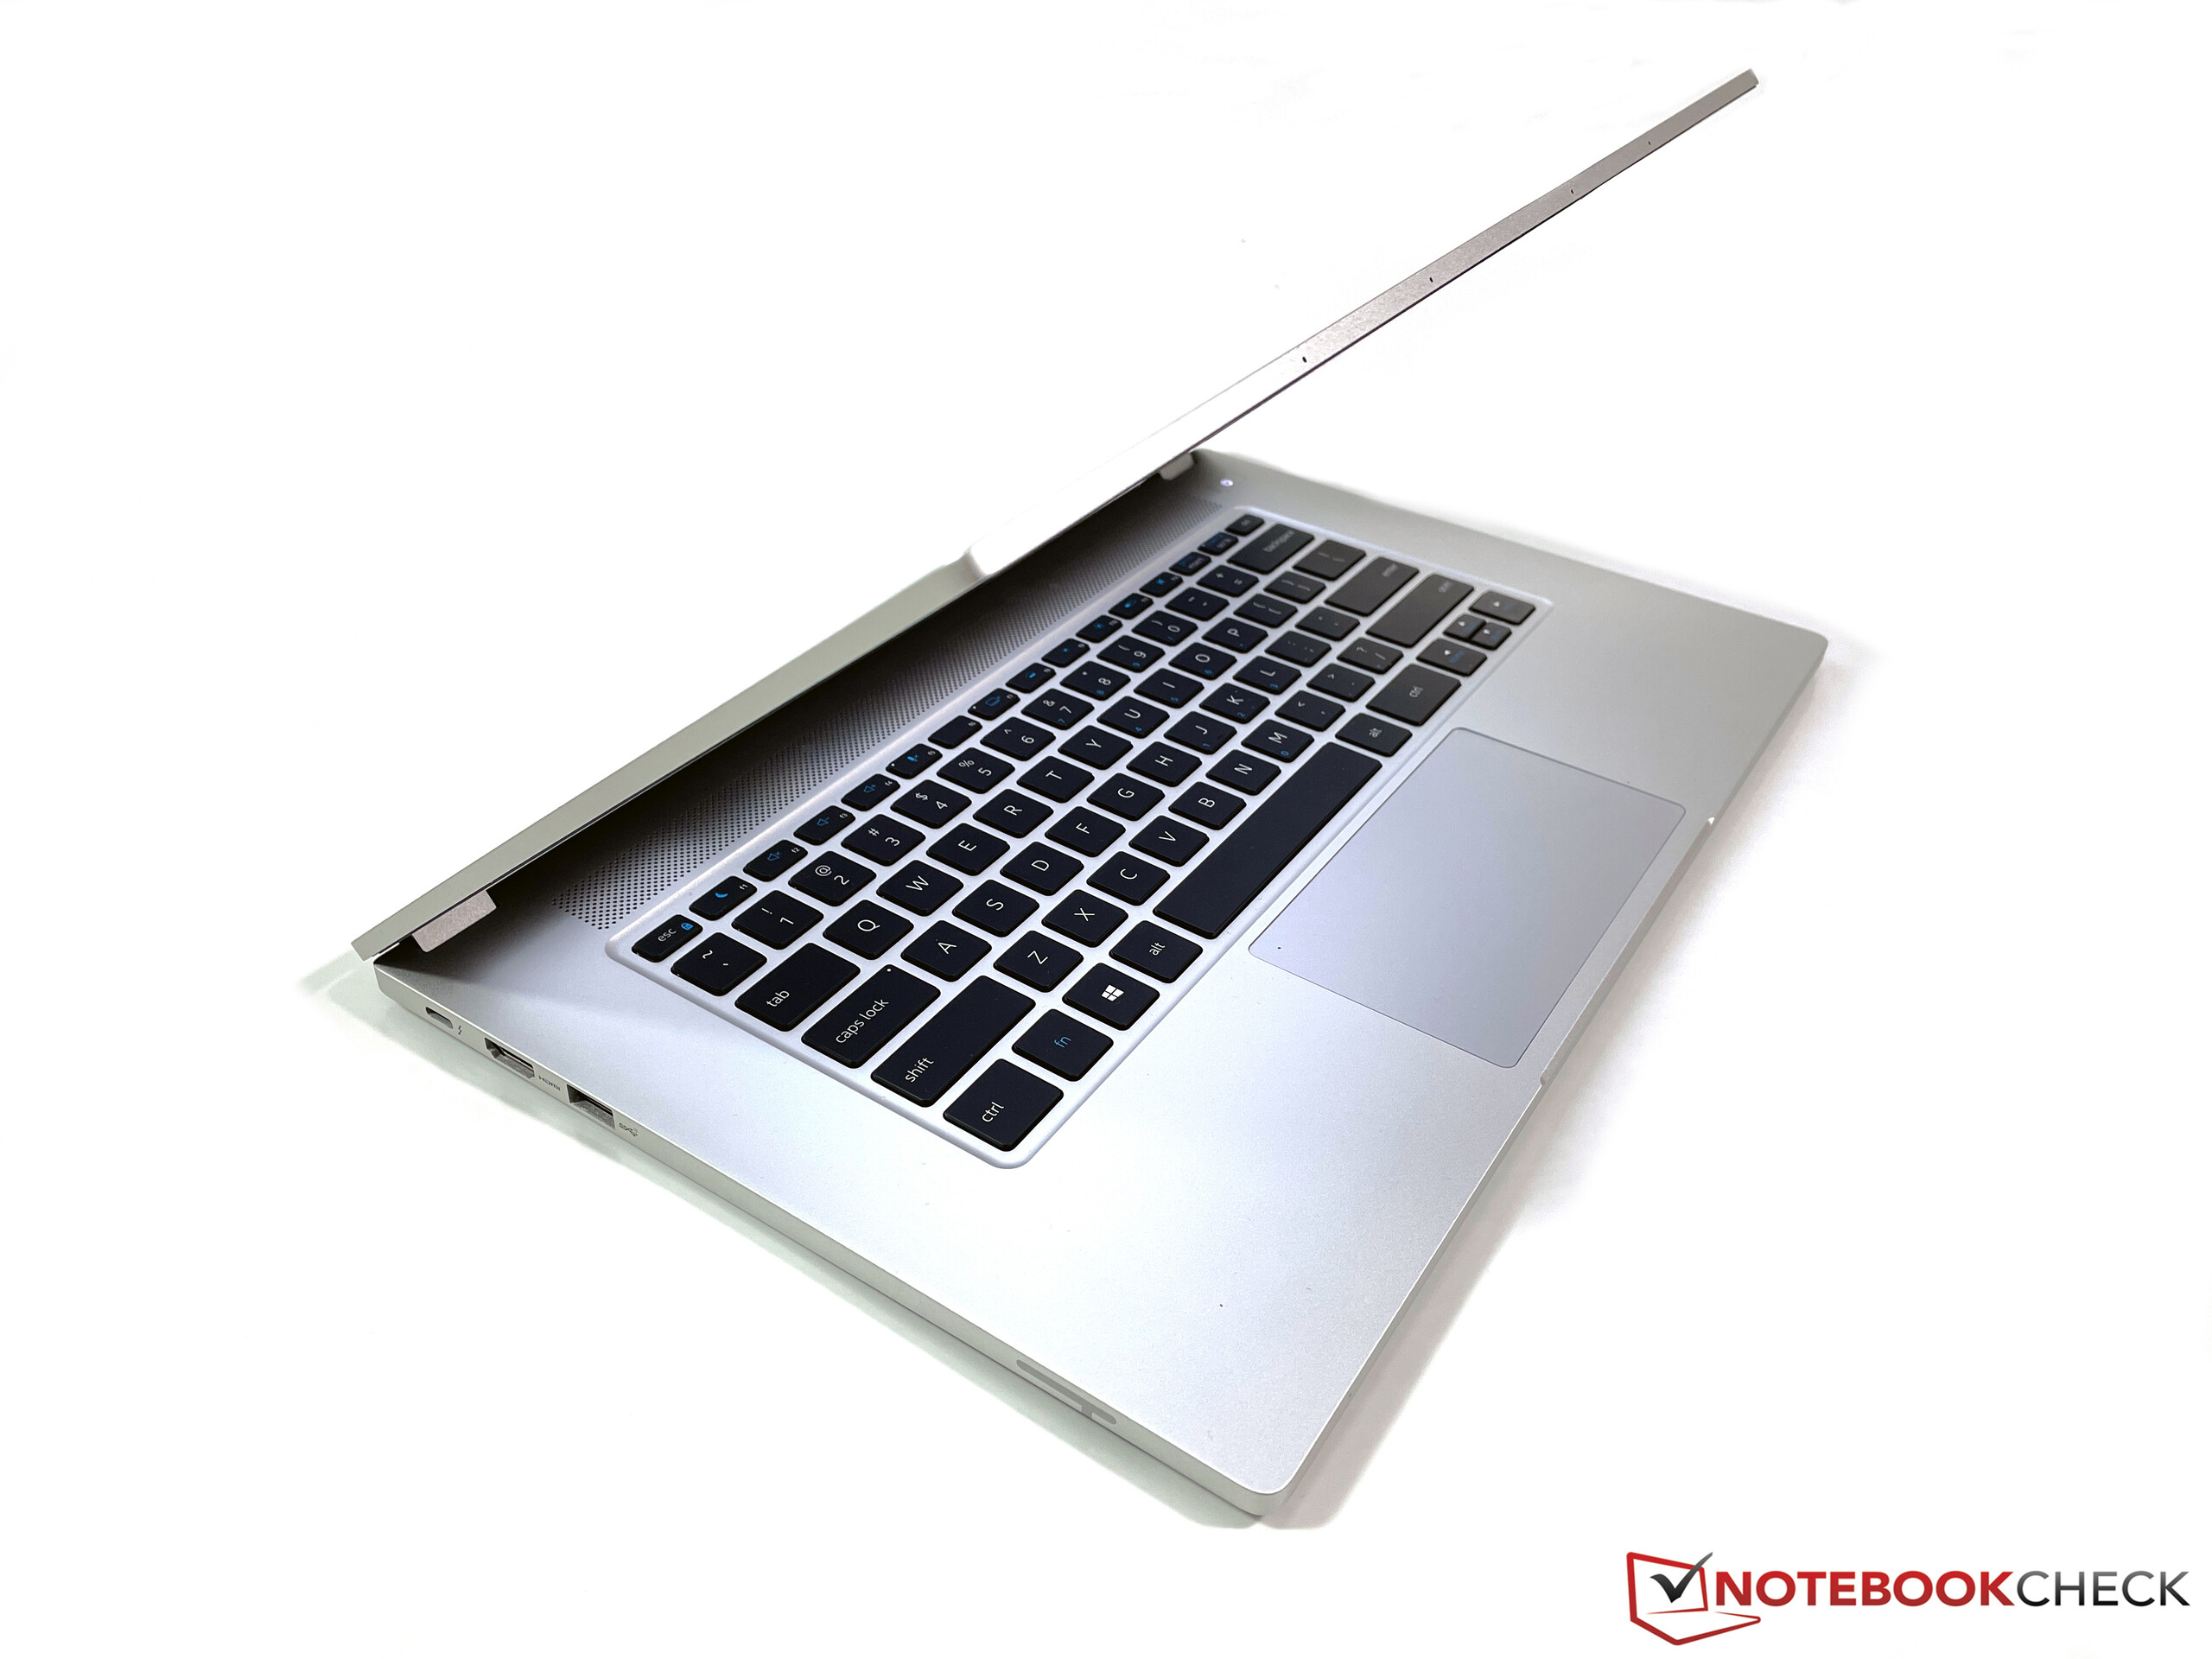
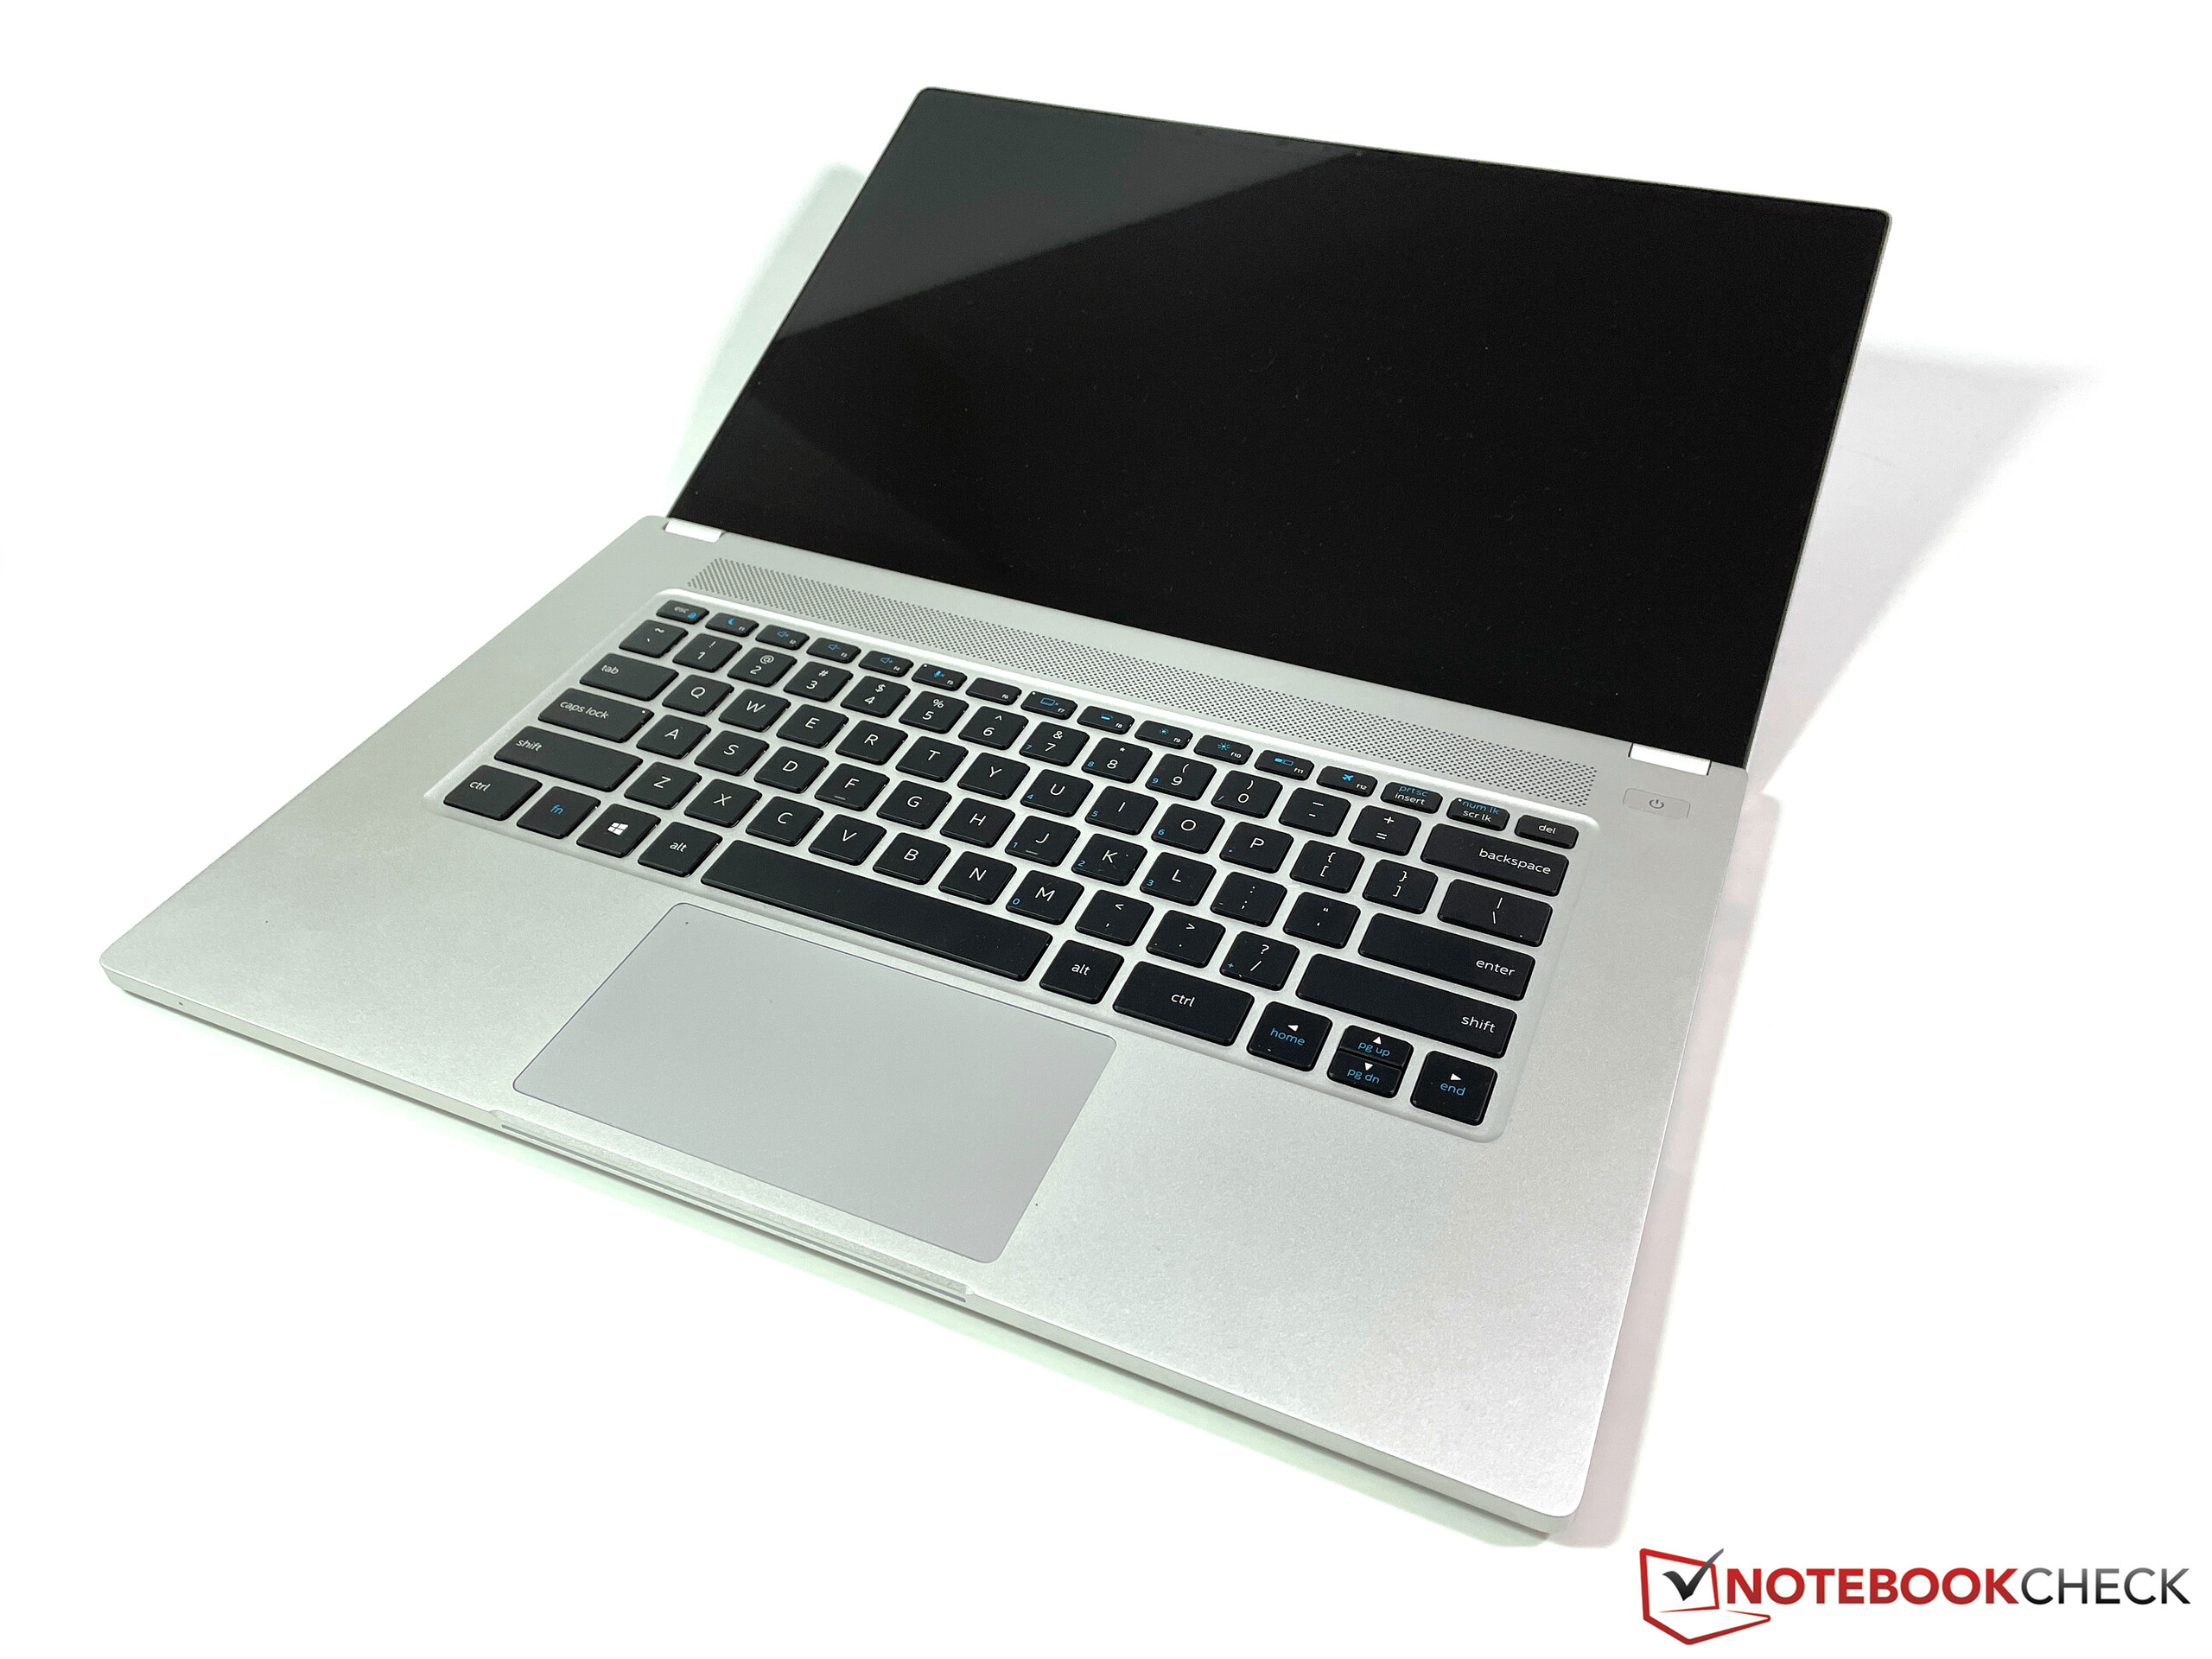
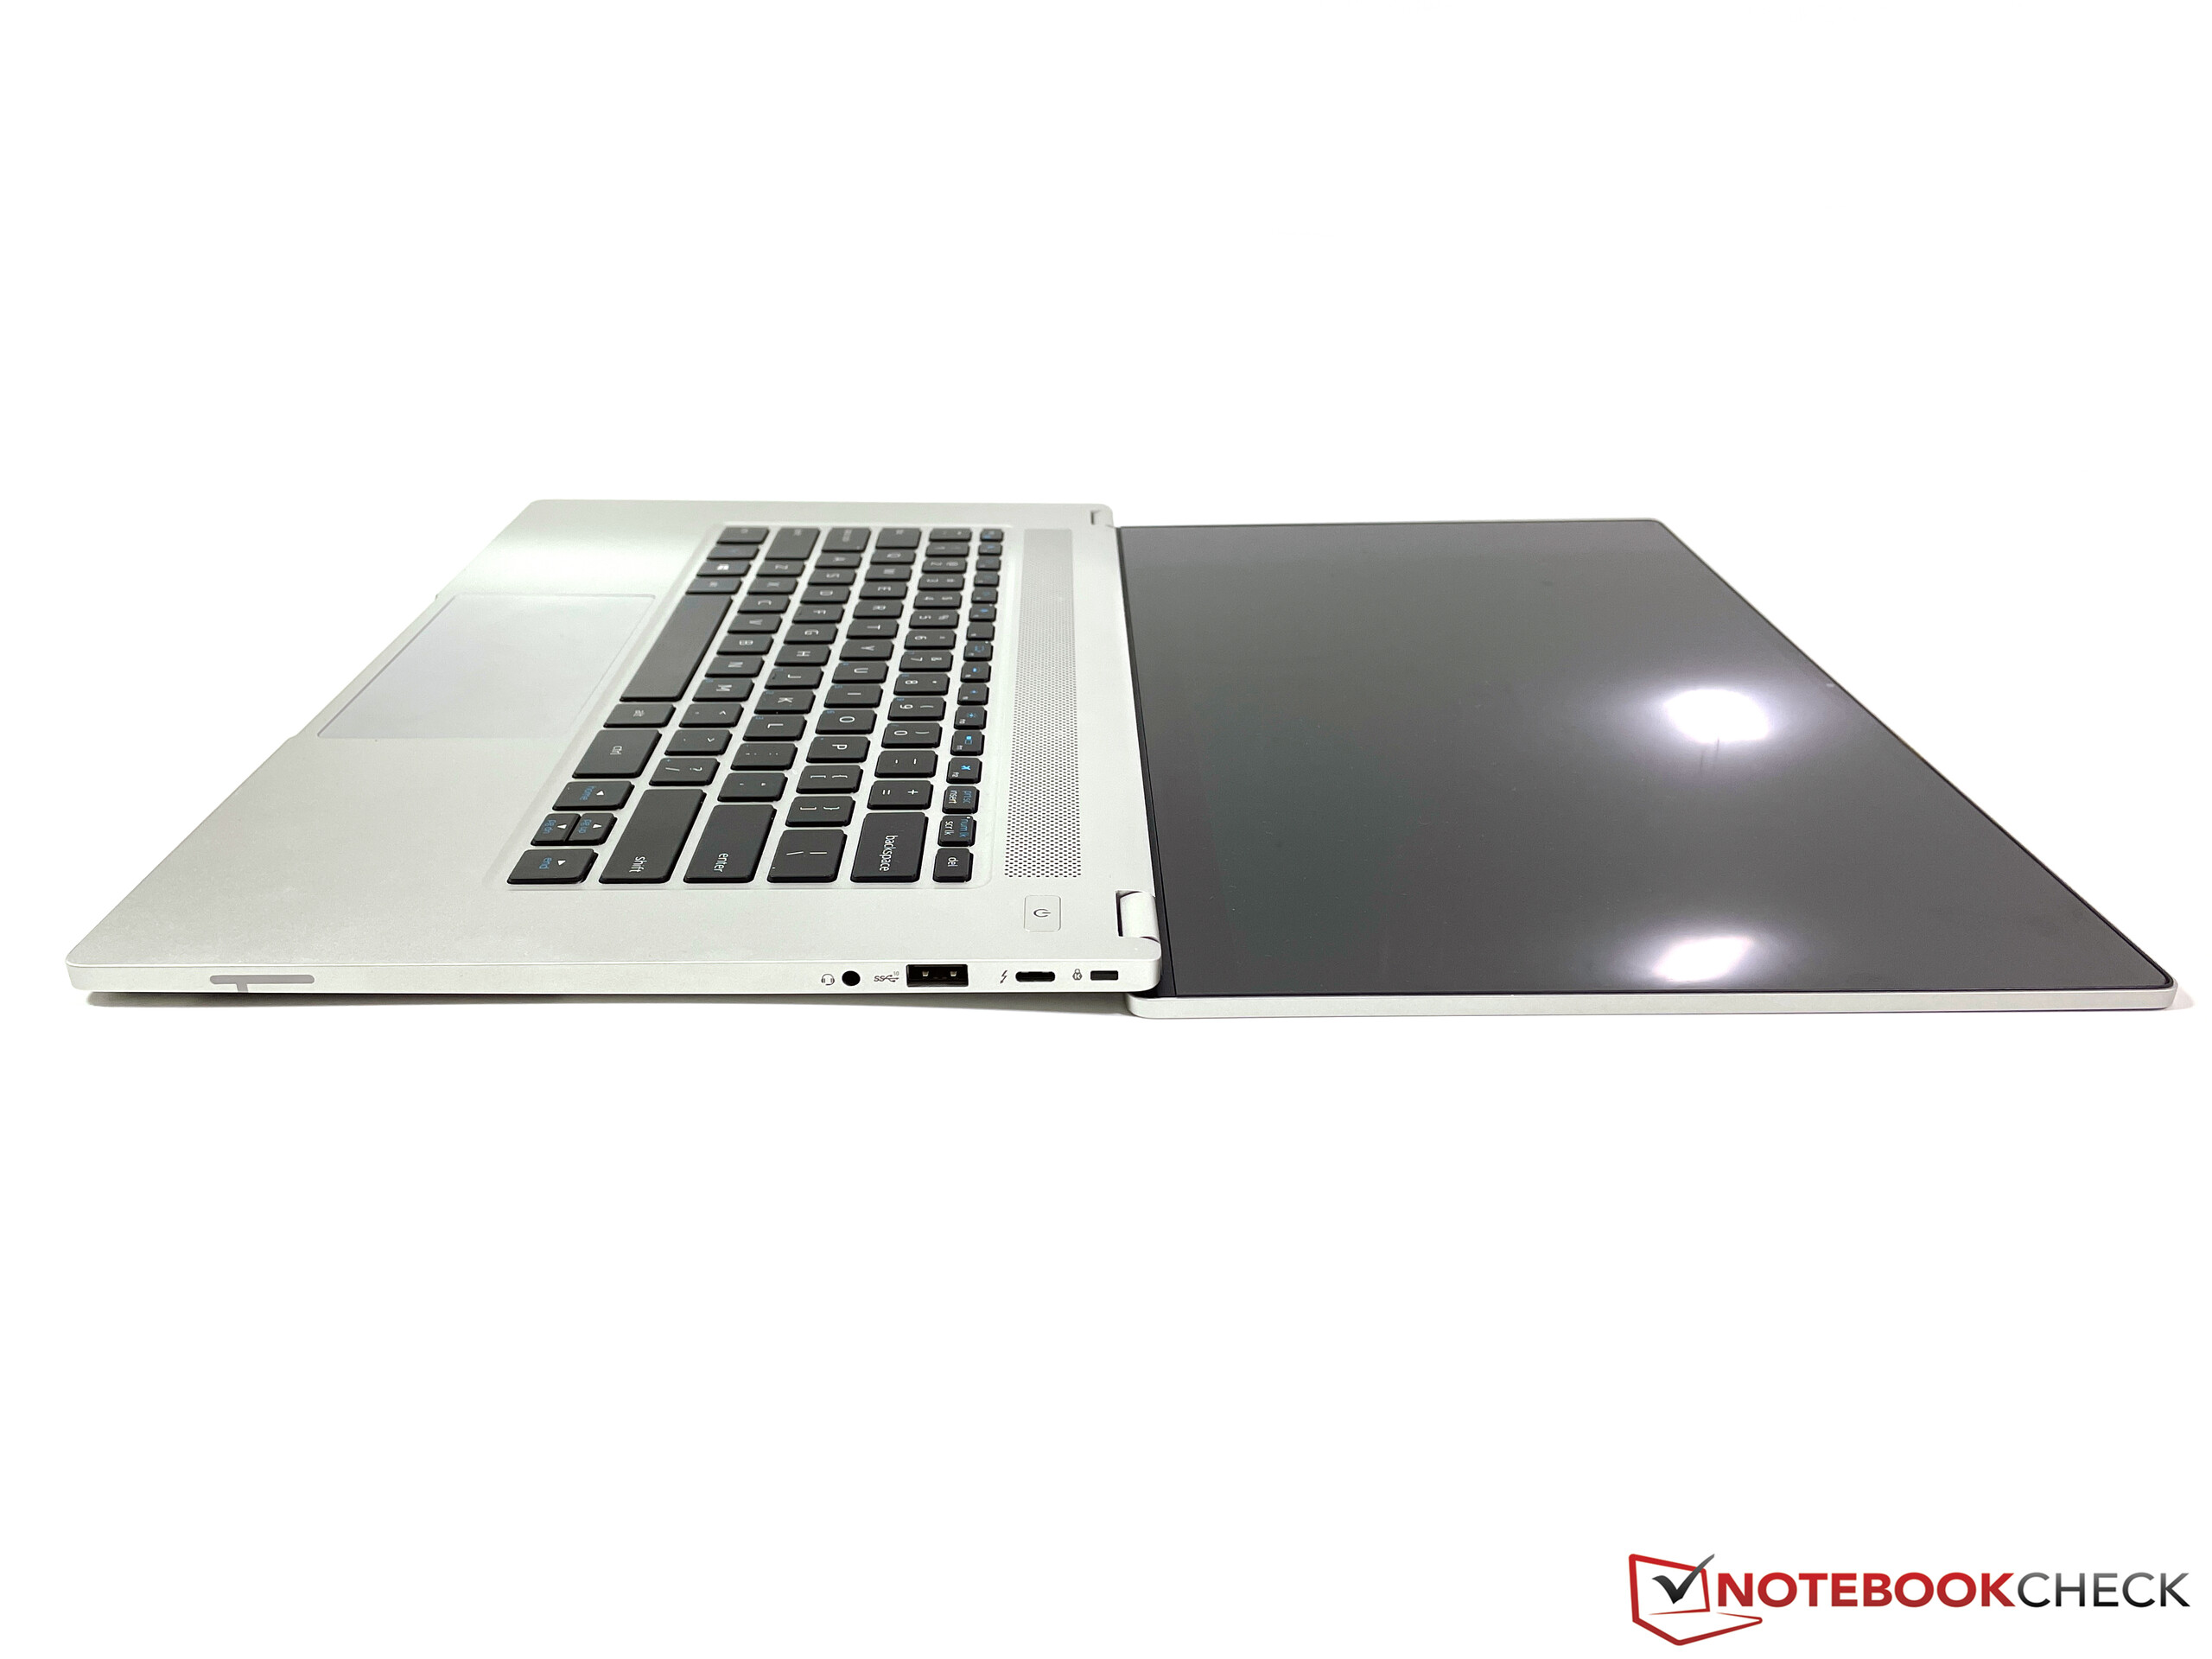
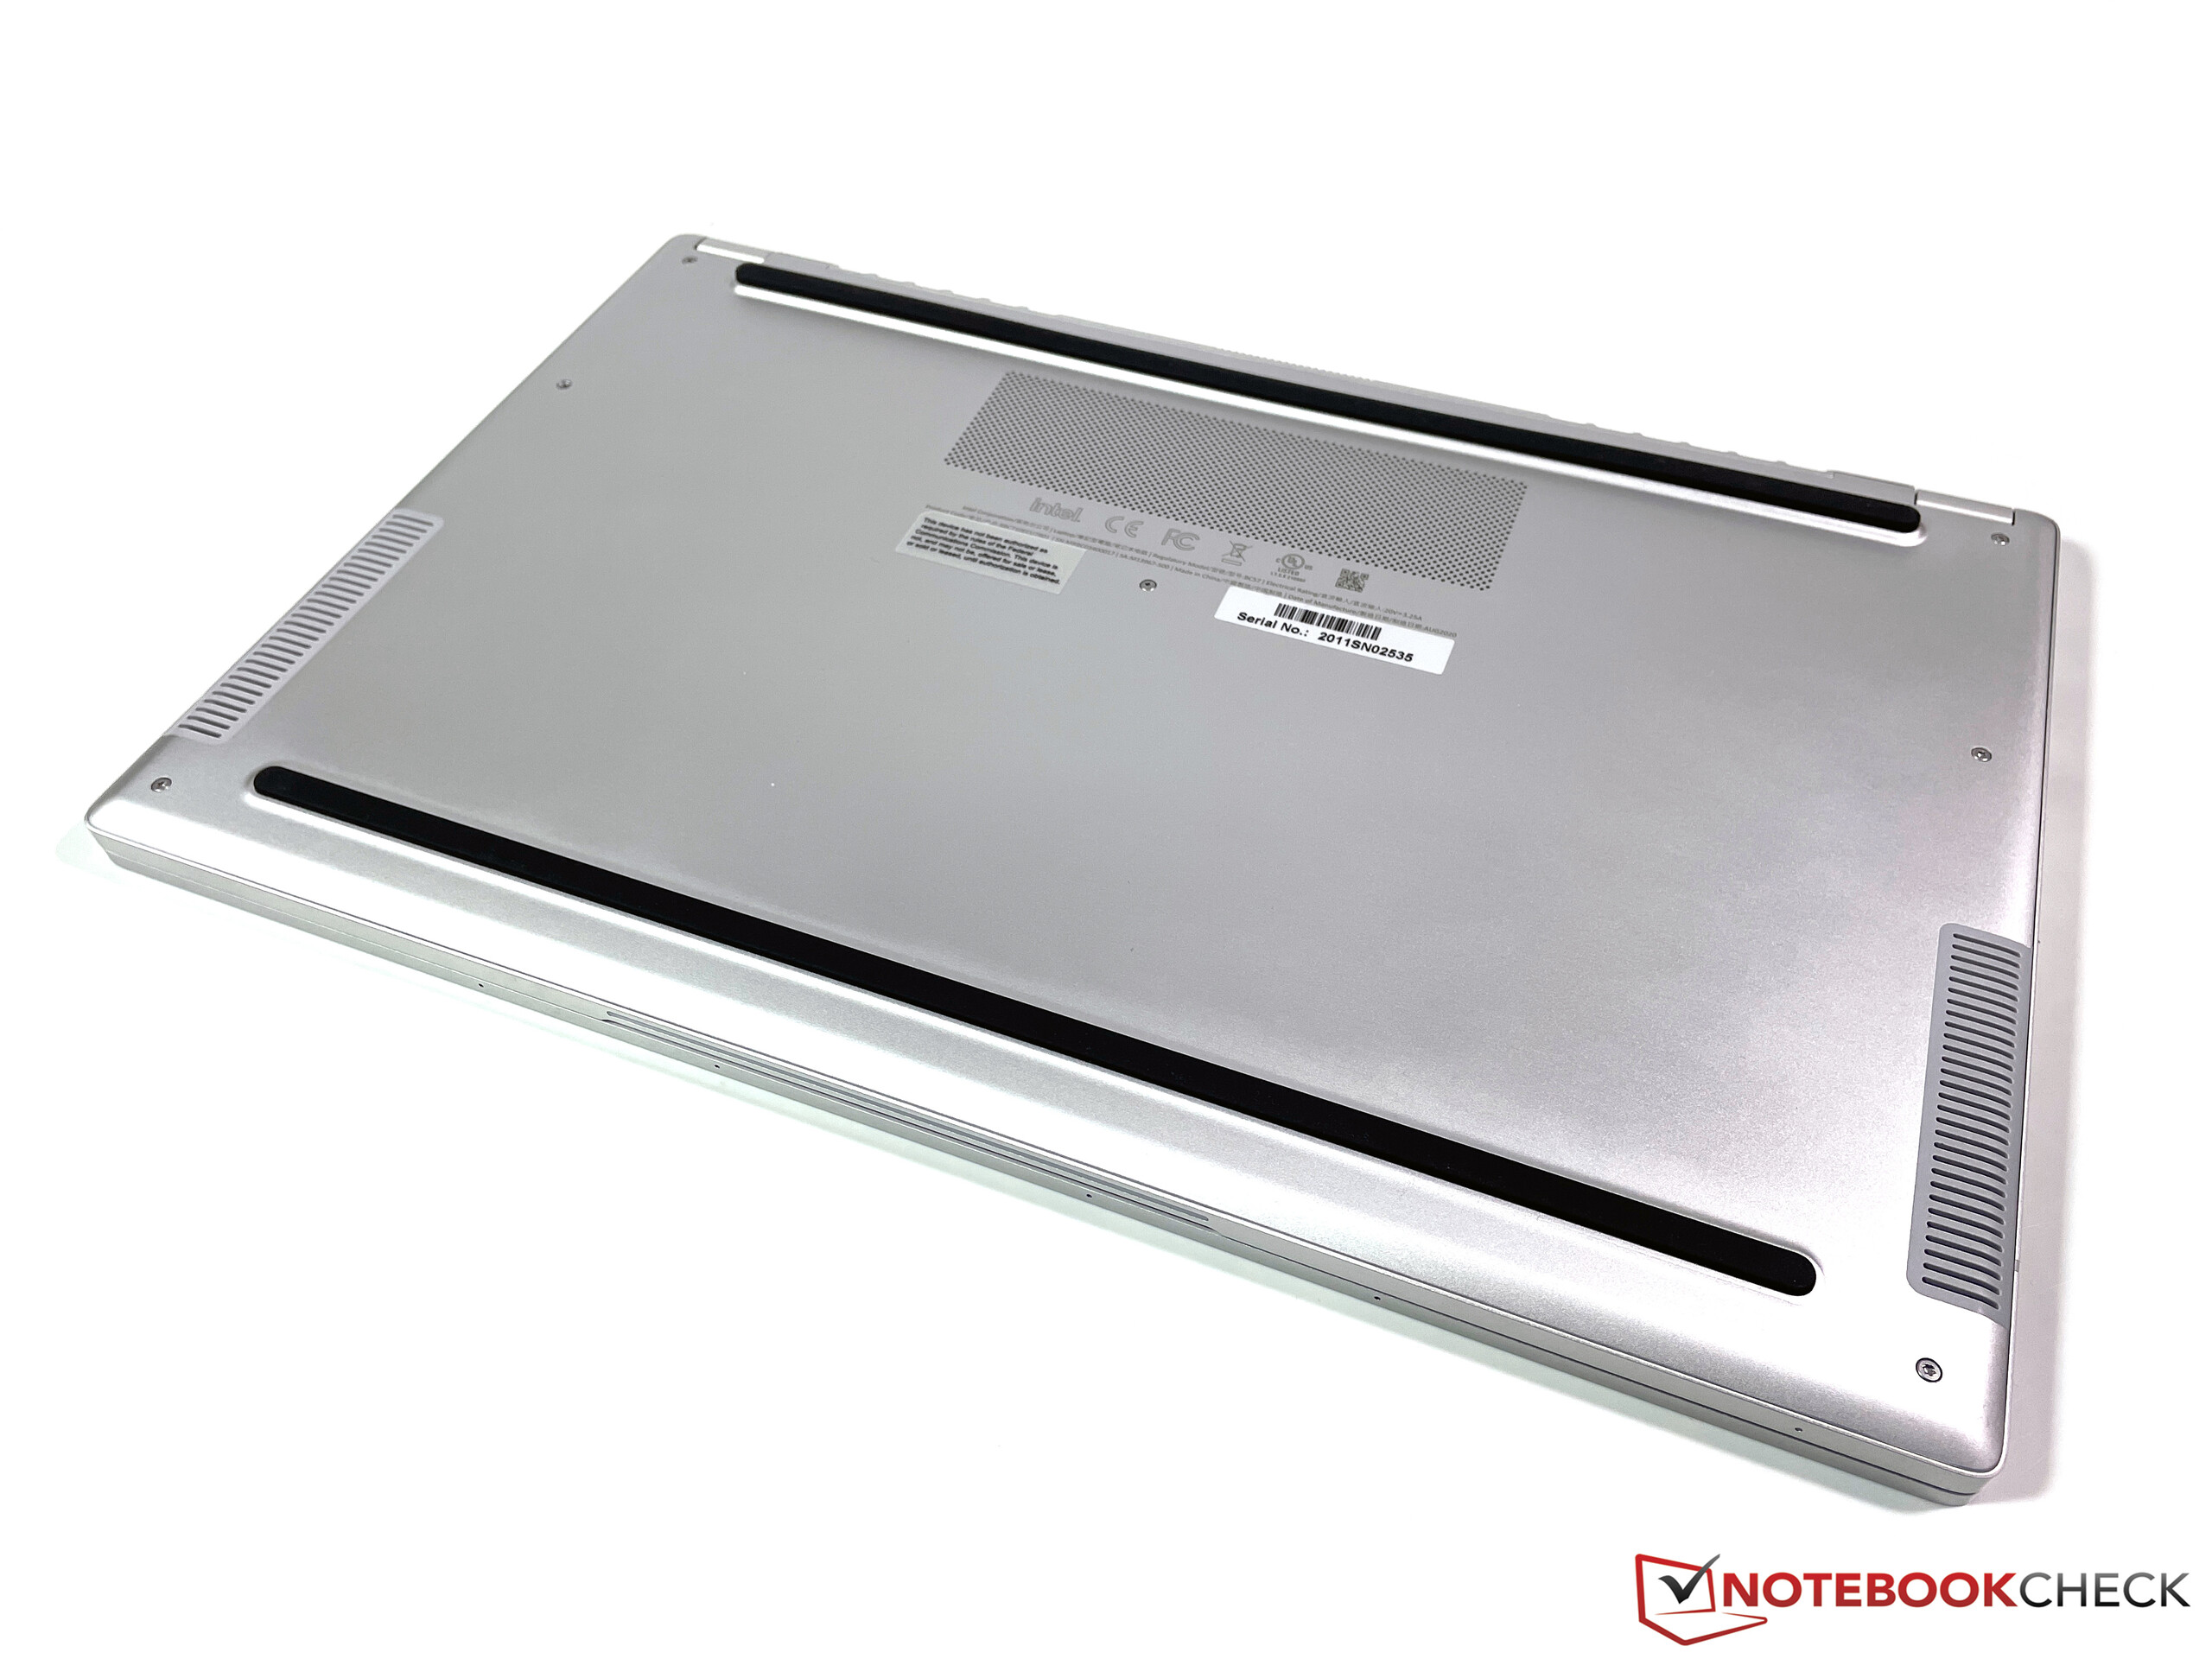
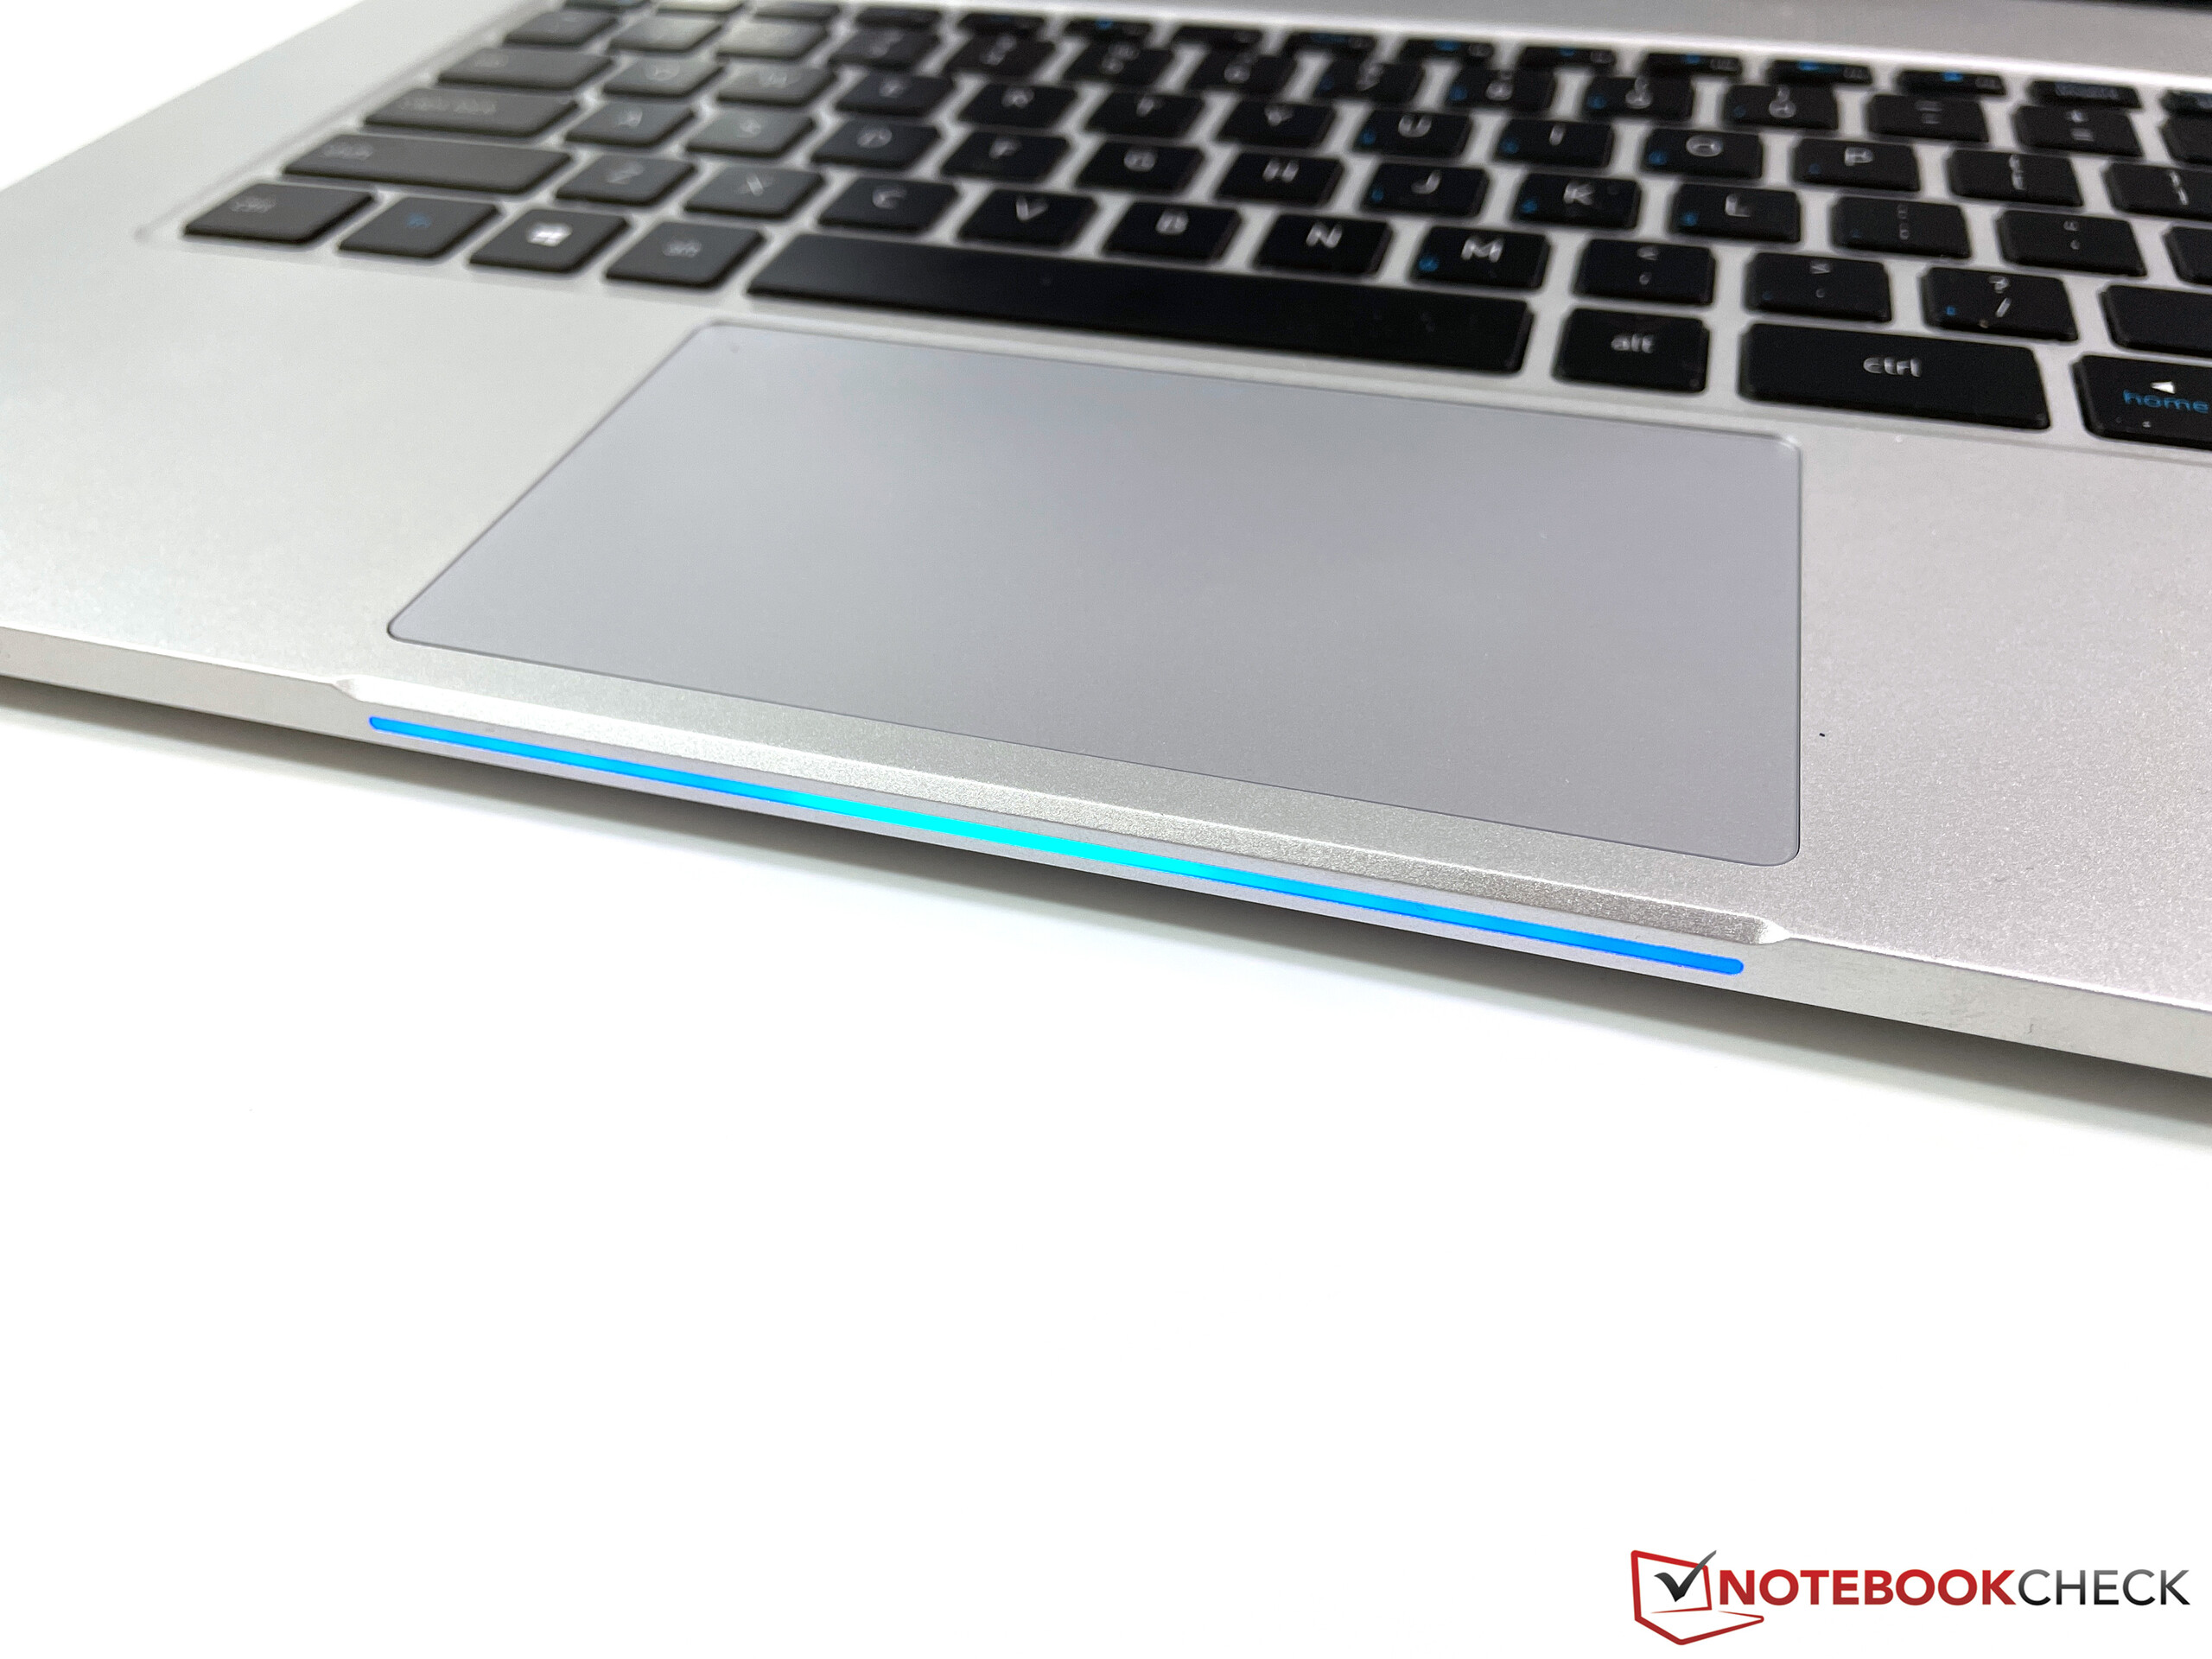
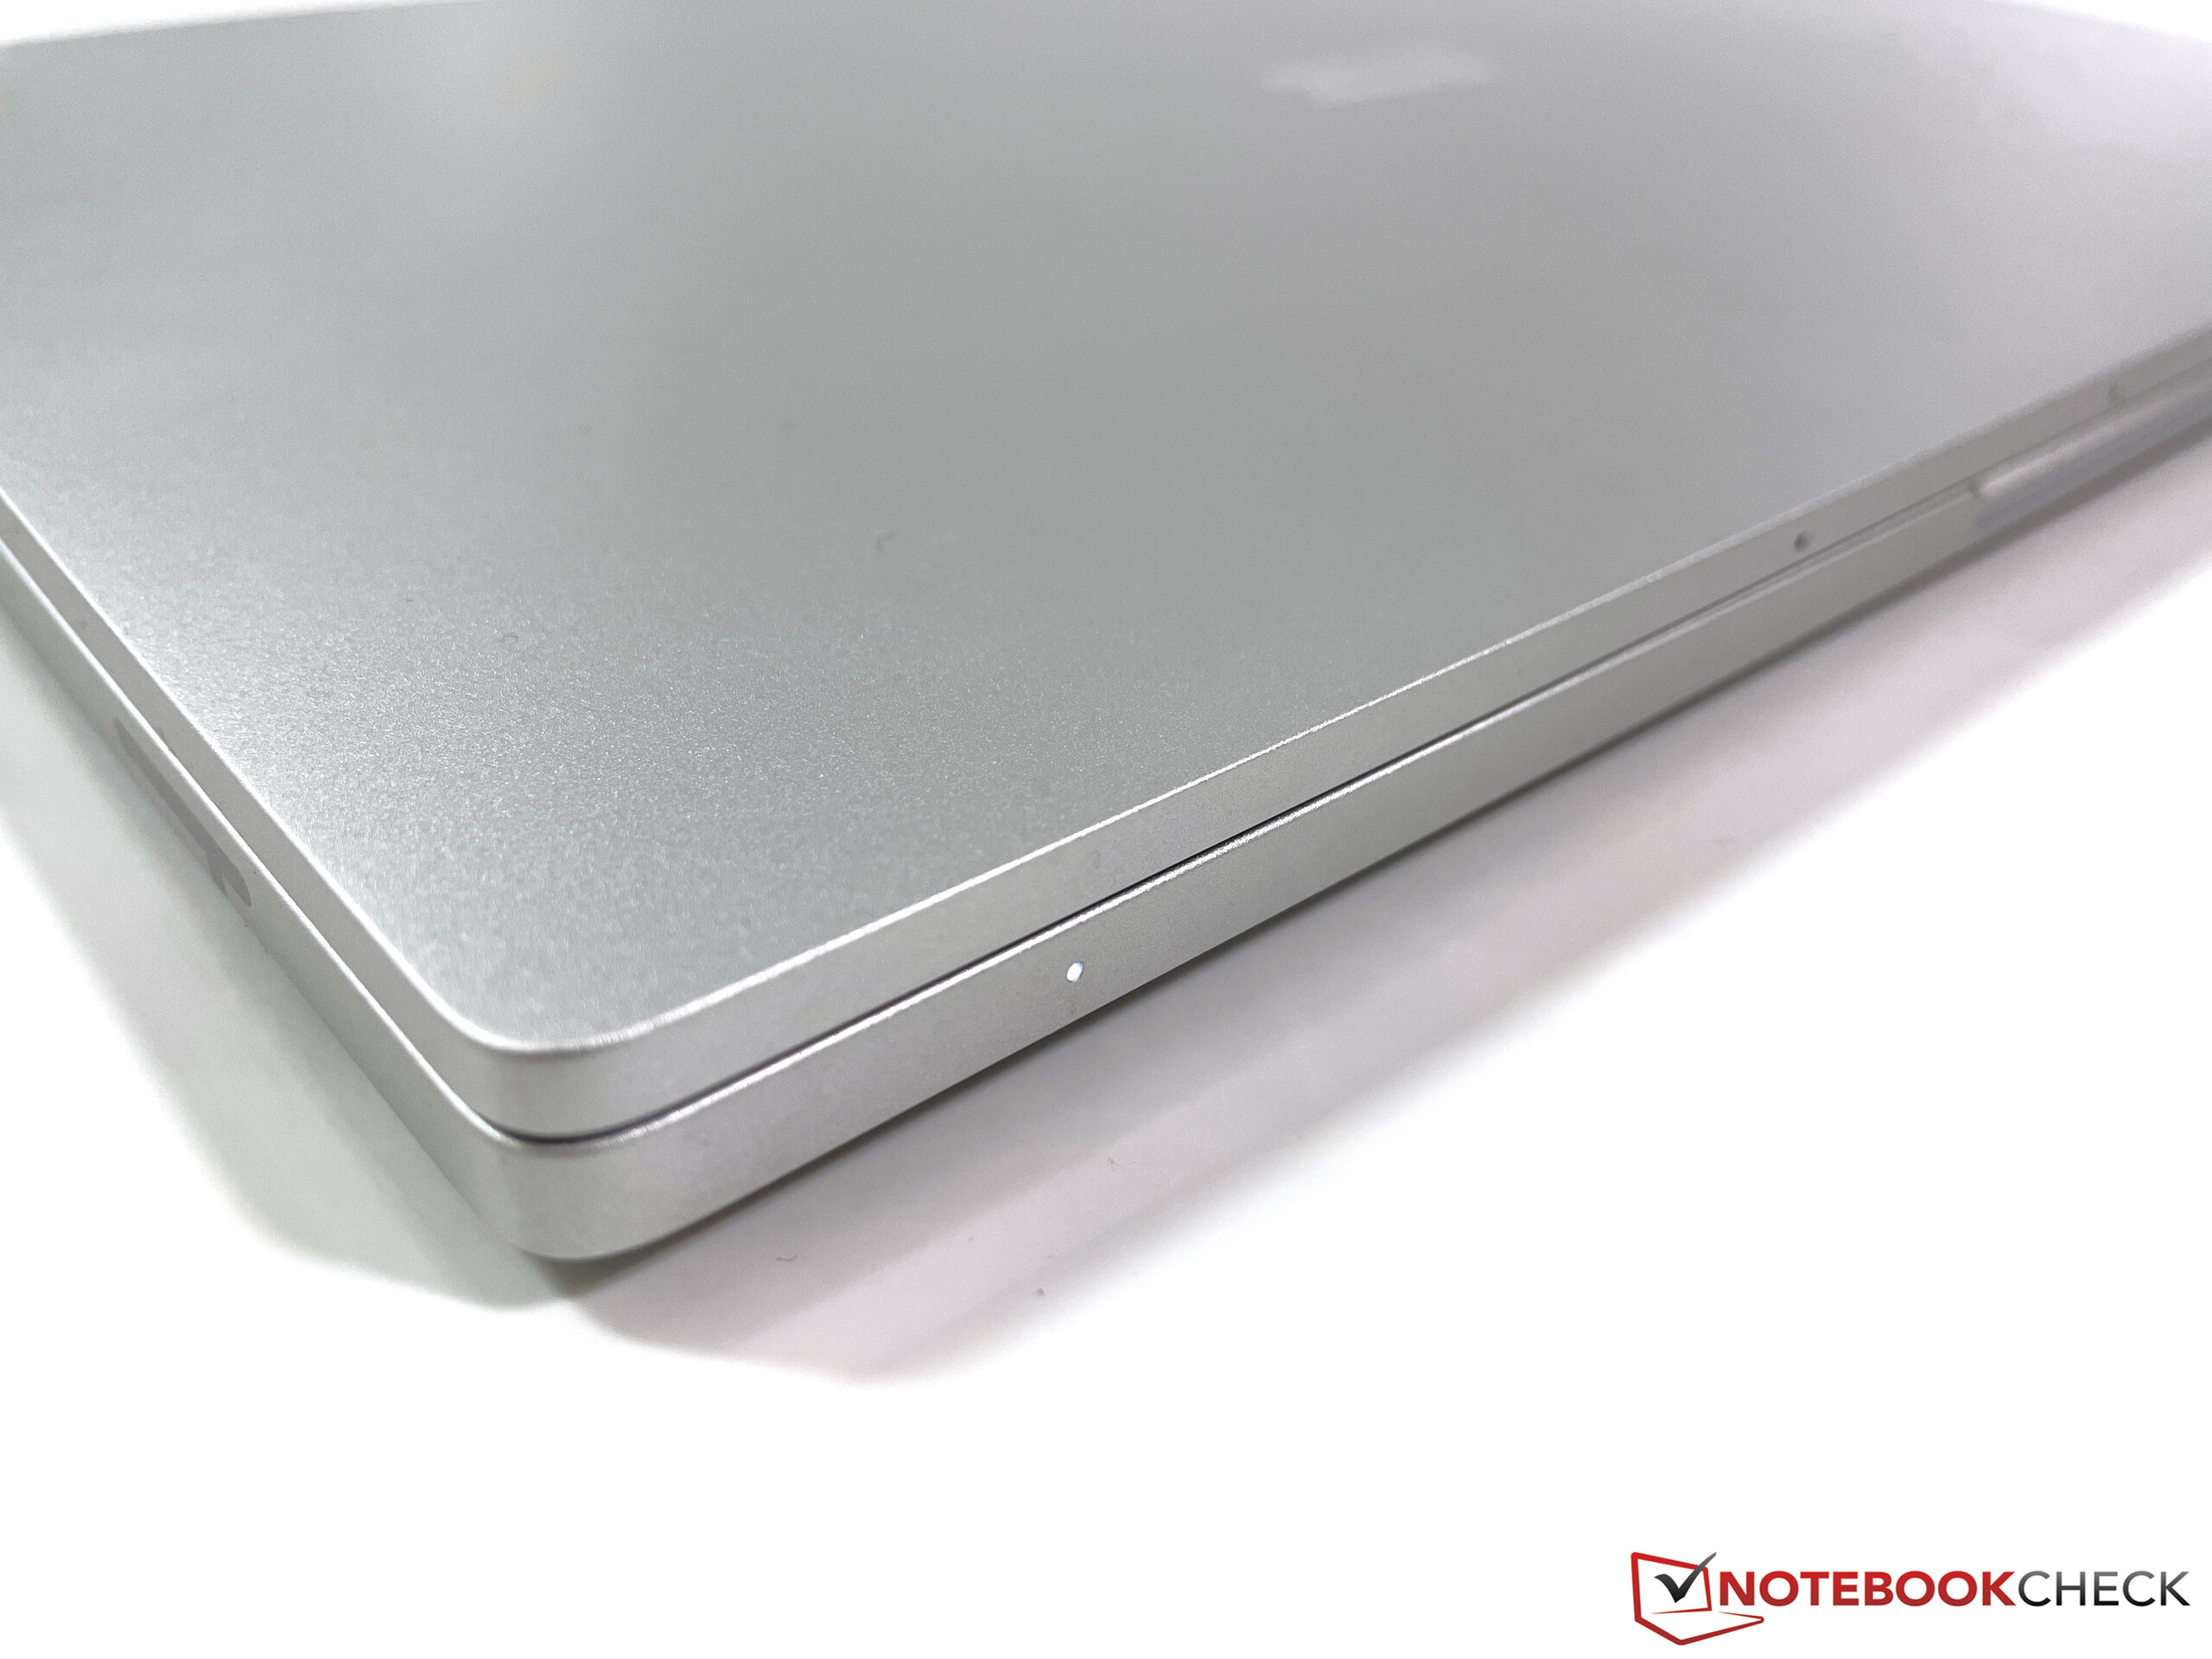
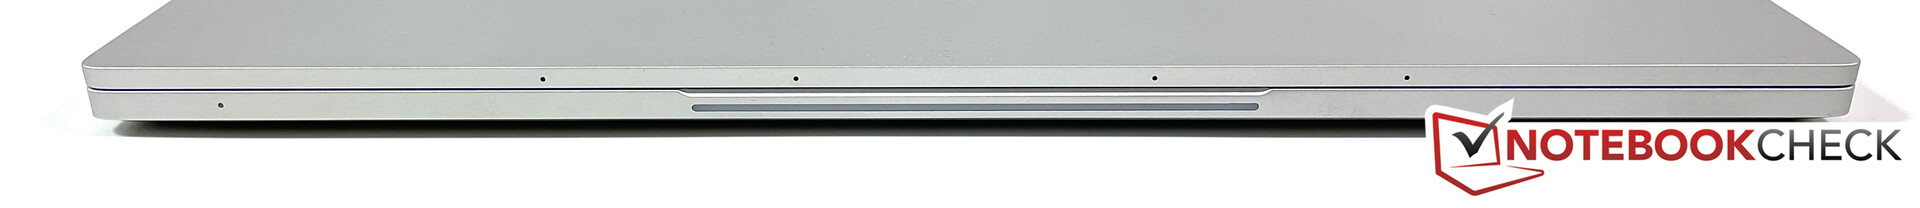
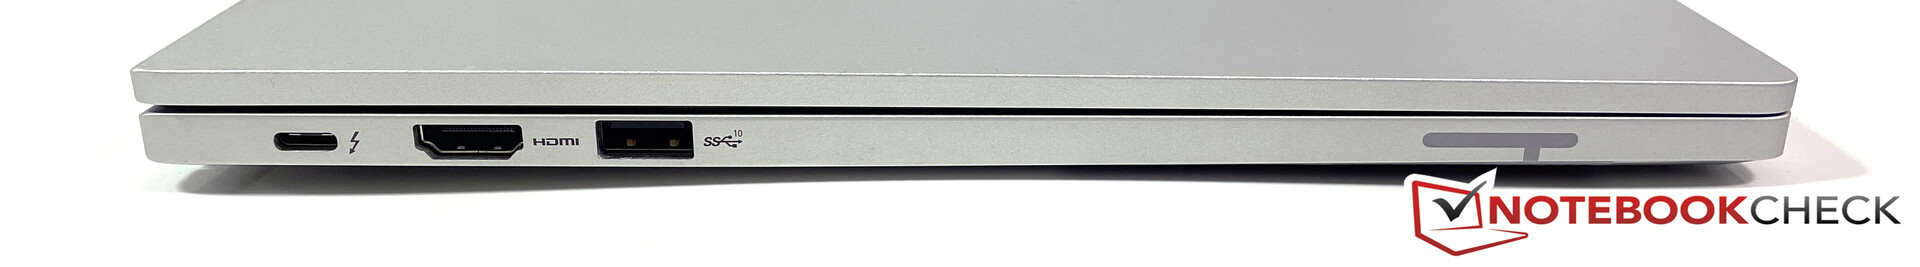
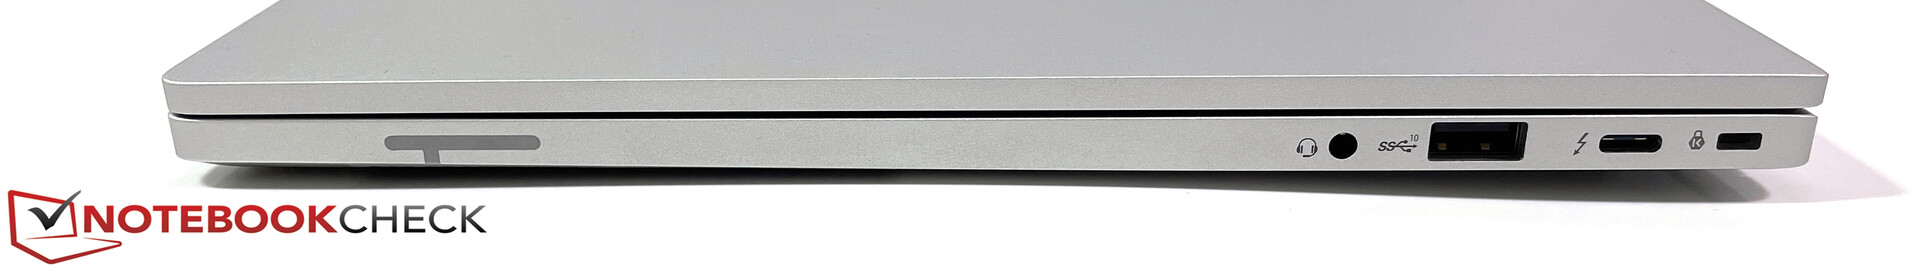
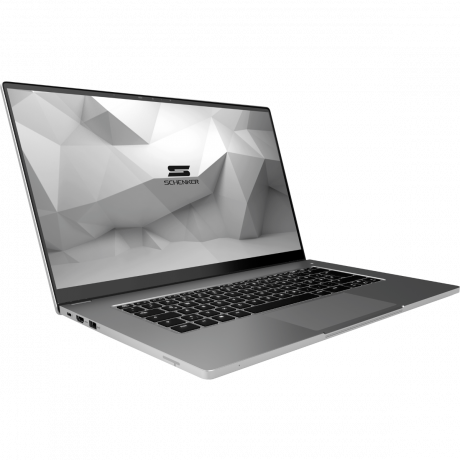
Det helgjutna aluminiumchassit ger ett intryck av väldigt hög kvalitet och är riktigt robust. Du får dessutom moderna portar med Thunderbolt 4 som är praktiskt placerade (det går att ladda från båda sidorna). Däremot finns det tyvärr ingen SD-kortsläsare. Vidare gillade vi inmatningsenheterna och du får riktigt lång batteritid från batteriet på 73 Wh.
Skärmvalet matchar inte riktigt det höga priset. Den tryckkänsliga 1080p-skärmen är inte på något sätt dålig, men den har en del brister. Vi är en aning förvånade över att Intel helt och hållet ignorerar trenden att gå mot 16:10-skärmar. Panelen lider också av långsamma responstider och färgprecisionen är inte perfekt.
Schenker Vision 15 lämnar ändå ett riktigt gott intryck totalt sett och är definitivt ett intressant alternativ om du letar efter en multimedialaptop av hög kvalitet och inte behöver en dedikerad GPU för spel.
Schenker Vision 15
- 12/02/2020 v7 (old)
Andreas Osthoff
Price comparison
