Test: Lenovo ThinkPad X1 Carbon Gen 9 - Stor 16:10-uppgradering med Intel Tiger Lake (Sammanfattning)
Testgrupp
Gradering | Datum | Modell | Vikt | Höjd | Storlek | Upplösning | Pris |
|---|---|---|---|---|---|---|---|
| 90.3 % v7 (old) | 05/2021 | Lenovo ThinkPad X1 Carbon G9-20XWCTO1WW i7-1165G7, Iris Xe G7 96EUs | 1.2 kg | 14.9 mm | 14.00" | 3840x2400 | |
| 90.2 % v7 (old) | 07/2020 | Lenovo ThinkPad X1 Carbon 2020-20UAS04T00 i7-10510U, UHD Graphics 620 | 1.1 kg | 14.9 mm | 14.00" | 1920x1080 | |
| 88.9 % v7 (old) | 07/2020 | Dell Latitude 7410 i7-10610U, UHD Graphics 620 | 1.4 kg | 19.3 mm | 14.00" | 3840x2160 | |
| 90.6 % v7 (old) | 02/2021 | HP EliteBook x360 1040 G7, i7-10810U i7-10810U, UHD Graphics 620 | 1.4 kg | 16.5 mm | 14.00" | 1920x1080 | |
| 91.1 % v7 (old) | 12/2020 | Apple MacBook Pro 13 Late 2020 M1 Entry (8 / 256 GB) M1, M1 8-Core GPU | 1.4 kg | 15.6 mm | 13.30" | 2560x1600 |


Skärmflimmer / PWM (Puls-Width Modulation)
| Skärmflimmer / PWM upptäcktes inte |  | ||
Som jämförelse: 52 % av alla testade enheter använder inte PWM för att dämpa skärmen. Om PWM upptäcktes mättes ett medelvärde av 7763 (minst: 5 - maximum: 343500) Hz. | |||
| |||||||||||||||||||||||||
Distribution av ljusstyrkan: 87 %
Mitt på batteriet: 497 cd/m²
Kontrast: 1420:1 (Svärta: 0.35 cd/m²)
ΔE ColorChecker Calman: 1.2 | ∀{0.5-29.43 Ø4.72}
calibrated: 0.9
ΔE Greyscale Calman: 1.3 | ∀{0.09-98 Ø4.97}
99.78% sRGB (Argyll 1.6.3 3D)
79.37% AdobeRGB 1998 (Argyll 1.6.3 3D)
89.2% AdobeRGB 1998 (Argyll 3D)
99.8% sRGB (Argyll 3D)
95.2% Display P3 (Argyll 3D)
Gamma: 2.16
CCT: 6690 K
| Lenovo ThinkPad X1 Carbon G9-20XWCTO1WW MNE007A1-2, IPS LED, 3840x2400, 14" | Lenovo ThinkPad X1 Carbon 2020-20U9003BGE NV140QUM-N53, , 3840x2160, 14" | Lenovo ThinkPad X1 Carbon 2020-20UAS04T00 BOE NE140FHM-N61, IPS, 1920x1080, 14" | Dell Latitude 7410 AU Optronics B140ZAN, IPS, 3840x2160, 14" | HP EliteBook x360 1040 G7, i7-10810U BOE08A3, IPS, 1920x1080, 14" | Apple MacBook Pro 13 Late 2020 M1 Entry (8 / 256 GB) IPS, 2560x1600, 13.3" | |
|---|---|---|---|---|---|---|
| Display | -7% | -20% | -15% | -20% | ||
| Display P3 Coverage (%) | 95.2 | 82.4 -13% | 68.9 -28% | 71.8 -25% | 66.1 -31% | |
| sRGB Coverage (%) | 99.8 | 99.4 0% | 91.6 -8% | 99.3 -1% | 95.5 -4% | |
| AdobeRGB 1998 Coverage (%) | 89.2 | 82.7 -7% | 67.1 -25% | 72.4 -19% | 68.1 -24% | |
| Response Times | 19% | -21% | 20% | -11% | 6% | |
| Response Time Grey 50% / Grey 80% * (ms) | 46 ? | 47.2 ? -3% | 64.8 ? -41% | 39.2 ? 15% | 52.4 ? -14% | 48 ? -4% |
| Response Time Black / White * (ms) | 30 ? | 17.6 ? 41% | 30.4 ? -1% | 22.4 ? 25% | 32 ? -7% | 25.2 ? 16% |
| PWM Frequency (Hz) | 200 ? | 2404 ? | 122000 ? | |||
| Screen | -99% | -110% | -100% | -74% | -4% | |
| Brightness middle (cd/m²) | 497 | 574 15% | 422 -15% | 388.6 -22% | 406.7 -18% | 510 3% |
| Brightness (cd/m²) | 488 | 540 11% | 395 -19% | 365 -25% | 382 -22% | 491 1% |
| Brightness Distribution (%) | 87 | 86 -1% | 90 3% | 82 -6% | 88 1% | 94 8% |
| Black Level * (cd/m²) | 0.35 | 0.36 -3% | 0.27 23% | 0.35 -0% | 0.28 20% | 0.29 17% |
| Contrast (:1) | 1420 | 1594 12% | 1563 10% | 1110 -22% | 1452 2% | 1759 24% |
| Colorchecker dE 2000 * | 1.2 | 4.7 -292% | 4.7 -292% | 4.04 -237% | 3.74 -212% | 1.3 -8% |
| Colorchecker dE 2000 max. * | 2.1 | 8.8 -319% | 10 -376% | 9.2 -338% | 5.92 -182% | 3 -43% |
| Colorchecker dE 2000 calibrated * | 0.9 | 1.4 -56% | 2 -122% | 1.25 -39% | 2.18 -142% | |
| Greyscale dE 2000 * | 1.3 | 7.2 -454% | 6.4 -392% | 6.4 -392% | 4.3 -231% | 2 -54% |
| Gamma | 2.16 102% | 2.04 108% | 2.12 104% | 2.3 96% | 2.19 100% | 2.23 99% |
| CCT | 6690 97% | 6886 94% | 7106 91% | 6957 93% | 6781 96% | 6933 94% |
| Color Space (Percent of AdobeRGB 1998) (%) | 79.37 | 73.8 -7% | 59.5 -25% | 66.4 -16% | 61.6 -22% | 88.3 11% |
| Color Space (Percent of sRGB) (%) | 99.78 | 99.4 0% | 91.5 -8% | 99.4 0% | 95.1 -5% | 100 0% |
| Totalt genomsnitt (program/inställningar) | -29% /
-67% | -50% /
-82% | -32% /
-69% | -35% /
-56% | 1% /
-2% |
* ... mindre är bättre
Visa svarstider
| ↔ Svarstid svart till vitt | ||
|---|---|---|
| 30 ms ... stiga ↗ och falla ↘ kombinerat | ↗ 15 ms stiga | 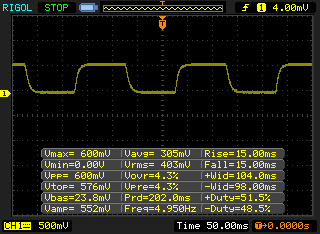 |
| ↘ 15 ms hösten | ||
| Skärmen visar långsamma svarsfrekvenser i våra tester och kommer att vara otillfredsställande för spelare. I jämförelse sträcker sig alla testade enheter från 0.1 (minst) till 240 (maximalt) ms. » 80 % av alla enheter är bättre. Detta innebär att den uppmätta svarstiden är sämre än genomsnittet av alla testade enheter (19.8 ms). | ||
| ↔ Svarstid 50 % grått till 80 % grått | ||
| 46 ms ... stiga ↗ och falla ↘ kombinerat | ↗ 23 ms stiga | 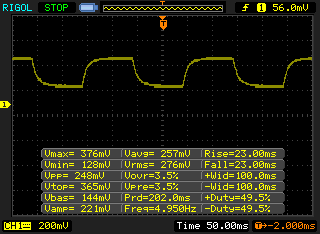 |
| ↘ 23 ms hösten | ||
| Skärmen visar långsamma svarsfrekvenser i våra tester och kommer att vara otillfredsställande för spelare. I jämförelse sträcker sig alla testade enheter från 0.165 (minst) till 636 (maximalt) ms. » 79 % av alla enheter är bättre. Detta innebär att den uppmätta svarstiden är sämre än genomsnittet av alla testade enheter (31 ms). | ||
Cinebench R20: CPU (Single Core) | CPU (Multi Core)
Cinebench R23: Single Core | Multi Core
Blender: v2.79 BMW27 CPU
7-Zip 18.03: 7z b 4 -mmt1 | 7z b 4
Geekbench 5.5: Single-Core | Multi-Core
HWBOT x265 Benchmark v2.2: 4k Preset
LibreOffice : 20 Documents To PDF
R Benchmark 2.5: Overall mean
| Cinebench R15 / CPU Single 64Bit | |
| Genomsnitt av klass Subnotebook (72.4 - 322, n=57, senaste 2 åren) | |
| Lenovo ThinkPad X1 Carbon G9-20XWCTO1WW | |
| Genomsnitt Intel Core i7-1165G7 (115 - 230, n=78) | |
| Apple MacBook Pro 13 Late 2020 M1 Entry (8 / 256 GB) | |
| Lenovo ThinkPad X1 Carbon 2020-20UAS04T00 | |
| HP EliteBook x360 1040 G7, i7-10810U | |
| Lenovo ThinkPad T14s-20UJS00K00 | |
| Dell Latitude 7410 | |
| Cinebench R15 / CPU Multi 64Bit | |
| Genomsnitt av klass Subnotebook (327 - 3345, n=57, senaste 2 åren) | |
| Lenovo ThinkPad T14s-20UJS00K00 | |
| Apple MacBook Pro 13 Late 2020 M1 Entry (8 / 256 GB) | |
| Lenovo ThinkPad X1 Carbon G9-20XWCTO1WW | |
| Genomsnitt Intel Core i7-1165G7 (553 - 1027, n=86) | |
| HP EliteBook x360 1040 G7, i7-10810U | |
| Lenovo ThinkPad X1 Carbon 2020-20UAS04T00 | |
| Dell Latitude 7410 | |
| Cinebench R20 / CPU (Single Core) | |
| Genomsnitt av klass Subnotebook (128 - 832, n=57, senaste 2 åren) | |
| Lenovo ThinkPad X1 Carbon G9-20XWCTO1WW | |
| Genomsnitt Intel Core i7-1165G7 (442 - 589, n=81) | |
| Lenovo ThinkPad T14s-20UJS00K00 | |
| Lenovo ThinkPad X1 Carbon 2020-20UAS04T00 | |
| HP EliteBook x360 1040 G7, i7-10810U | |
| Apple MacBook Pro 13 Late 2020 M1 Entry (8 / 256 GB) | |
| Dell Latitude 7410 | |
| Cinebench R20 / CPU (Multi Core) | |
| Genomsnitt av klass Subnotebook (579 - 8541, n=57, senaste 2 åren) | |
| Lenovo ThinkPad T14s-20UJS00K00 | |
| Apple MacBook Pro 13 Late 2020 M1 Entry (8 / 256 GB) | |
| Lenovo ThinkPad X1 Carbon G9-20XWCTO1WW | |
| Genomsnitt Intel Core i7-1165G7 (1060 - 2657, n=81) | |
| HP EliteBook x360 1040 G7, i7-10810U | |
| Lenovo ThinkPad X1 Carbon 2020-20UAS04T00 | |
| Dell Latitude 7410 | |
| Cinebench R23 / Single Core | |
| Genomsnitt av klass Subnotebook (358 - 2213, n=61, senaste 2 åren) | |
| Apple MacBook Pro 13 Late 2020 M1 Entry (8 / 256 GB) | |
| Lenovo ThinkPad X1 Carbon G9-20XWCTO1WW | |
| Genomsnitt Intel Core i7-1165G7 (1110 - 1539, n=59) | |
| HP EliteBook x360 1040 G7, i7-10810U | |
| Cinebench R23 / Multi Core | |
| Genomsnitt av klass Subnotebook (1555 - 21812, n=60, senaste 2 åren) | |
| Apple MacBook Pro 13 Late 2020 M1 Entry (8 / 256 GB) | |
| Lenovo ThinkPad X1 Carbon G9-20XWCTO1WW | |
| Genomsnitt Intel Core i7-1165G7 (2525 - 6862, n=64) | |
| HP EliteBook x360 1040 G7, i7-10810U | |
| Blender / v2.79 BMW27 CPU | |
| Dell Latitude 7410 | |
| Lenovo ThinkPad X1 Carbon 2020-20UAS04T00 | |
| Genomsnitt Intel Core i7-1165G7 (468 - 1138, n=80) | |
| Lenovo ThinkPad X1 Carbon G9-20XWCTO1WW | |
| HP EliteBook x360 1040 G7, i7-10810U | |
| Genomsnitt av klass Subnotebook (159 - 2271, n=58, senaste 2 åren) | |
| Lenovo ThinkPad T14s-20UJS00K00 | |
| 7-Zip 18.03 / 7z b 4 -mmt1 | |
| Genomsnitt av klass Subnotebook (2643 - 6699, n=59, senaste 2 åren) | |
| Genomsnitt Intel Core i7-1165G7 (4478 - 5507, n=80) | |
| Lenovo ThinkPad X1 Carbon G9-20XWCTO1WW | |
| Dell Latitude 7410 | |
| Lenovo ThinkPad X1 Carbon 2020-20UAS04T00 | |
| HP EliteBook x360 1040 G7, i7-10810U | |
| Lenovo ThinkPad T14s-20UJS00K00 | |
| 7-Zip 18.03 / 7z b 4 | |
| Genomsnitt av klass Subnotebook (11668 - 77867, n=57, senaste 2 åren) | |
| Lenovo ThinkPad T14s-20UJS00K00 | |
| HP EliteBook x360 1040 G7, i7-10810U | |
| Lenovo ThinkPad X1 Carbon G9-20XWCTO1WW | |
| Genomsnitt Intel Core i7-1165G7 (15347 - 27405, n=80) | |
| Lenovo ThinkPad X1 Carbon 2020-20UAS04T00 | |
| Dell Latitude 7410 | |
| Geekbench 5.5 / Single-Core | |
| Genomsnitt av klass Subnotebook (726 - 2224, n=48, senaste 2 åren) | |
| Apple MacBook Pro 13 Late 2020 M1 Entry (8 / 256 GB) | |
| Lenovo ThinkPad X1 Carbon G9-20XWCTO1WW | |
| Genomsnitt Intel Core i7-1165G7 (1302 - 1595, n=77) | |
| Dell Latitude 7410 | |
| HP EliteBook x360 1040 G7, i7-10810U | |
| Lenovo ThinkPad X1 Carbon 2020-20UAS04T00 | |
| Lenovo ThinkPad T14s-20UJS00K00 | |
| Geekbench 5.5 / Multi-Core | |
| Genomsnitt av klass Subnotebook (2557 - 17218, n=48, senaste 2 åren) | |
| Apple MacBook Pro 13 Late 2020 M1 Entry (8 / 256 GB) | |
| Lenovo ThinkPad T14s-20UJS00K00 | |
| Lenovo ThinkPad X1 Carbon G9-20XWCTO1WW | |
| HP EliteBook x360 1040 G7, i7-10810U | |
| Genomsnitt Intel Core i7-1165G7 (3078 - 5926, n=77) | |
| Lenovo ThinkPad X1 Carbon 2020-20UAS04T00 | |
| Dell Latitude 7410 | |
| HWBOT x265 Benchmark v2.2 / 4k Preset | |
| Genomsnitt av klass Subnotebook (0.97 - 25.1, n=57, senaste 2 åren) | |
| Lenovo ThinkPad T14s-20UJS00K00 | |
| HP EliteBook x360 1040 G7, i7-10810U | |
| Genomsnitt Intel Core i7-1165G7 (1.39 - 8.47, n=80) | |
| Lenovo ThinkPad X1 Carbon G9-20XWCTO1WW | |
| Lenovo ThinkPad X1 Carbon 2020-20UAS04T00 | |
| Dell Latitude 7410 | |
| LibreOffice / 20 Documents To PDF | |
| HP EliteBook x360 1040 G7, i7-10810U | |
| Lenovo ThinkPad T14s-20UJS00K00 | |
| Dell Latitude 7410 | |
| Genomsnitt av klass Subnotebook (39.9 - 220, n=56, senaste 2 åren) | |
| Lenovo ThinkPad X1 Carbon 2020-20UAS04T00 | |
| Genomsnitt Intel Core i7-1165G7 (21.5 - 88.1, n=78) | |
| Lenovo ThinkPad X1 Carbon G9-20XWCTO1WW | |
| R Benchmark 2.5 / Overall mean | |
| Lenovo ThinkPad X1 Carbon 2020-20UAS04T00 | |
| HP EliteBook x360 1040 G7, i7-10810U | |
| Dell Latitude 7410 | |
| Lenovo ThinkPad T14s-20UJS00K00 | |
| Lenovo ThinkPad X1 Carbon G9-20XWCTO1WW | |
| Genomsnitt Intel Core i7-1165G7 (0.552 - 1.002, n=80) | |
| Genomsnitt av klass Subnotebook (0.4024 - 1.456, n=58, senaste 2 åren) | |
* ... mindre är bättre
| PCMark 10 Score | 5038 poäng | |
Hjälp | ||
| DPC Latencies / LatencyMon - interrupt to process latency (max), Web, Youtube, Prime95 | |
| Lenovo ThinkPad X1 Carbon 2020-20UAS04T00 | |
| Lenovo ThinkPad X1 Carbon G9-20XWCTO1WW | |
* ... mindre är bättre
| Lenovo ThinkPad X1 Carbon G9-20XWCTO1WW Samsung PM9A1 MZVL21T0HCLR | Lenovo ThinkPad X1 Carbon 2020-20UAS04T00 Samsung SSD PM981a MZVLB512HBJQ | Dell Latitude 7410 Toshiba XG6 KXG60ZNV512G | HP EliteBook x360 1040 G7, i7-10810U Samsung SSD PM981a MZVLB512HBJQ | Genomsnitt Samsung PM9A1 MZVL21T0HCLR | |
|---|---|---|---|---|---|
| CrystalDiskMark 5.2 / 6 | -24% | -34% | -27% | 12% | |
| Write 4K (MB/s) | 171.3 | 185 8% | 133.4 -22% | 133.1 -22% | 194.2 ? 13% |
| Read 4K (MB/s) | 80.5 | 50.6 -37% | 51.3 -36% | 57.7 -28% | 80.6 ? 0% |
| Write Seq (MB/s) | 2700 | 1543 -43% | 1897 -30% | 2159 -20% | 3638 ? 35% |
| Read Seq (MB/s) | 3233 | 1509 -53% | 2202 -32% | 2495 -23% | 3838 ? 19% |
| Write 4K Q32T1 (MB/s) | 513 | 488.8 -5% | 384.9 -25% | 423.3 -17% | 500 ? -3% |
| Read 4K Q32T1 (MB/s) | 478.4 | 579 21% | 318.7 -33% | 369.3 -23% | 605 ? 26% |
| Write Seq Q32T1 (MB/s) | 4524 | 2986 -34% | 2866 -37% | 2984 -34% | 4898 ? 8% |
| Read Seq Q32T1 (MB/s) | 7098 | 3555 -50% | 3122 -56% | 3556 -50% | 6775 ? -5% |

DiskSpd Read Loop, Queue Depth 8
| 3DMark 11 Performance | 7054 poäng | |
| 3DMark Fire Strike Score | 4246 poäng | |
| 3DMark Time Spy Score | 1638 poäng | |
Hjälp | ||
| låg | med. | hög | ultra | 4K | |
|---|---|---|---|---|---|
| Battlefield Hardline (2015) | |||||
| The Witcher 3 (2015) | 71.2 | 47.3 | 25.5 | ||
| Dota 2 Reborn (2015) | 86.3 | 61 | 38.9 | 39.6 | 18 |
| X-Plane 11.11 (2018) | 44.4 | 36.4 | 31.1 | 16.3 | |
| Shadow of the Tomb Raider (2018) | 36.9 | 17.8 | |||
| F1 2020 (2020) | 70.7 | 36.3 | 26.9 |
Ljudnivå
| Låg belastning |
| 23.6 / 23.6 / 23.6 dB(A) |
| Hög belastning |
| 33.5 / 34.3 dB(A) |
 | ||
30 dB tyst 40 dB(A) hörbar 50 dB(A) högt ljud |
||
min: | ||
(-) Den maximala temperaturen på ovansidan är 51.5 °C / 125 F, jämfört med genomsnittet av 35.9 °C / 97 F , allt från 21.4 till 59 °C för klassen Subnotebook.
(-) Botten värms upp till maximalt 45.3 °C / 114 F, jämfört med genomsnittet av 39.2 °C / 103 F
(+) Vid tomgångsbruk är medeltemperaturen för ovansidan 26.6 °C / 80 F, jämfört med enhetsgenomsnittet på 30.8 °C / ### class_avg_f### F.
(+) Handledsstöden och pekplattan är kallare än hudtemperaturen med maximalt 28.1 °C / 82.6 F och är därför svala att ta på.
(±) Medeltemperaturen för handledsstödsområdet på liknande enheter var 28.2 °C / 82.8 F (+0.1 °C / 0.2 F).
Lenovo ThinkPad X1 Carbon G9-20XWCTO1WW ljudanalys
(±) | högtalarljudstyrkan är genomsnittlig men bra (80.4 dB)
Bas 100 - 315 Hz
(±) | reducerad bas - i genomsnitt 14% lägre än medianen
(±) | linjäriteten för basen är genomsnittlig (13.5% delta till föregående frekvens)
Mellan 400 - 2000 Hz
(+) | balanserad mellan - endast 4.2% från medianen
(±) | linjäriteten för mids är genomsnittlig (7% delta till föregående frekvens)
Högsta 2 - 16 kHz
(+) | balanserade toppar - endast 2.1% från medianen
(+) | toppar är linjära (3.9% delta till föregående frekvens)
Totalt 100 - 16 000 Hz
(+) | det totala ljudet är linjärt (13.2% skillnad mot median)
Jämfört med samma klass
» 21% av alla testade enheter i den här klassen var bättre, 5% liknande, 74% sämre
» Den bästa hade ett delta på 5%, genomsnittet var 18%, sämst var 53%
Jämfört med alla testade enheter
» 13% av alla testade enheter var bättre, 3% liknande, 84% sämre
» Den bästa hade ett delta på 4%, genomsnittet var 24%, sämst var 134%
Lenovo ThinkPad X1 Carbon 2019-20QE000VGE ljudanalys
(±) | högtalarljudstyrkan är genomsnittlig men bra (76.8 dB)
Bas 100 - 315 Hz
(±) | reducerad bas - i genomsnitt 11.2% lägre än medianen
(±) | linjäriteten för basen är genomsnittlig (7.1% delta till föregående frekvens)
Mellan 400 - 2000 Hz
(±) | högre mellan - i genomsnitt 5.1% högre än median
(+) | mids är linjära (5.4% delta till föregående frekvens)
Högsta 2 - 16 kHz
(+) | balanserade toppar - endast 2.9% från medianen
(±) | linjäriteten för toppar är genomsnittlig (9.1% delta till föregående frekvens)
Totalt 100 - 16 000 Hz
(±) | linjäriteten för det totala ljudet är genomsnittlig (16.7% skillnad mot median)
Jämfört med samma klass
» 21% av alla testade enheter i den här klassen var bättre, 8% liknande, 71% sämre
» Den bästa hade ett delta på 7%, genomsnittet var 21%, sämst var 53%
Jämfört med alla testade enheter
» 29% av alla testade enheter var bättre, 7% liknande, 64% sämre
» Den bästa hade ett delta på 4%, genomsnittet var 24%, sämst var 134%
| Av/Standby | |
| Låg belastning | |
| Hög belastning |
|
Förklaring:
min: | |
| Lenovo ThinkPad X1 Carbon G9-20XWCTO1WW i7-1165G7, Iris Xe G7 96EUs, Samsung PM9A1 MZVL21T0HCLR, IPS LED, 3840x2400, 14" | Lenovo ThinkPad X1 Carbon 2020-20UAS04T00 i7-10510U, UHD Graphics 620, Samsung SSD PM981a MZVLB512HBJQ, IPS, 1920x1080, 14" | Dell Latitude 7410 i7-10610U, UHD Graphics 620, Toshiba XG6 KXG60ZNV512G, IPS, 3840x2160, 14" | HP EliteBook x360 1040 G7, i7-10810U i7-10810U, UHD Graphics 620, Samsung SSD PM981a MZVLB512HBJQ, IPS, 1920x1080, 14" | Apple MacBook Pro 13 Late 2020 M1 Entry (8 / 256 GB) M1, M1 8-Core GPU, Apple SSD AP0256, IPS, 2560x1600, 13.3" | Genomsnitt Intel Iris Xe Graphics G7 96EUs | Genomsnitt av klass Subnotebook | |
|---|---|---|---|---|---|---|---|
| Power Consumption | 25% | 23% | 38% | 42% | 4% | 21% | |
| Idle Minimum * (Watt) | 5 | 2.96 41% | 3.7 26% | 1.6 68% | 1.67 67% | 5.51 ? -10% | 3.86 ? 23% |
| Idle Average * (Watt) | 10.2 | 5.9 42% | 6.2 39% | 4.5 56% | 6.7 34% | 8.66 ? 15% | 6.61 ? 35% |
| Idle Maximum * (Watt) | 11 | 9.1 17% | 7 36% | 5.2 53% | 7.4 33% | 10.9 ? 1% | 8 ? 27% |
| Load Average * (Watt) | 51.7 | 42.1 19% | 43.2 16% | 41.7 19% | 28 46% | 45.6 ? 12% | 42.2 ? 18% |
| Load Maximum * (Watt) | 67.5 | 65.1 4% | 68.6 -2% | 70.8 -5% | 47.5 30% | 67.8 ? -0% | 64.5 ? 4% |
* ... mindre är bättre
| Lenovo ThinkPad X1 Carbon G9-20XWCTO1WW i7-1165G7, Iris Xe G7 96EUs, 57 Wh | Lenovo ThinkPad X1 Carbon 2020-20U9003BGE i7-10510U, UHD Graphics 620, 51 Wh | Lenovo ThinkPad X1 Carbon 2020-20UAS04T00 i7-10510U, UHD Graphics 620, 51 Wh | Dell Latitude 7410 i7-10610U, UHD Graphics 620, 68 Wh | HP EliteBook x360 1040 G7, i7-10810U i7-10810U, UHD Graphics 620, 78.6 Wh | Apple MacBook Pro 13 Late 2020 M1 Entry (8 / 256 GB) M1, M1 8-Core GPU, 58.2 Wh | Lenovo ThinkPad X1 Nano-20UN002UGE i7-1160G7, Iris Xe G7 96EUs, 48.2 Wh | Genomsnitt av klass Subnotebook | |
|---|---|---|---|---|---|---|---|---|
| Batteridrifttid | -12% | 25% | 65% | 202% | 141% | 33% | 59% | |
| H.264 (h) | 9.3 | 7.5 -19% | 12.8 38% | 19.2 106% | 15.4 66% | 15.4 ? 66% | ||
| WiFi v1.3 (h) | 7.4 | 7 -5% | 10.1 36% | 11 49% | 18.8 154% | 20.4 176% | 9.9 34% | 14 ? 89% |
| Load (h) | 1.6 | 1.6 0% | 2.9 81% | 5.6 250% | 1.6 0% | 1.969 ? 23% |
För
Emot
Omdöme: X1 Carbon Gen 9 är totalt sätt bättre än sin föregångare
Läs den fullständiga versionen av den här recensionen på engelska här.
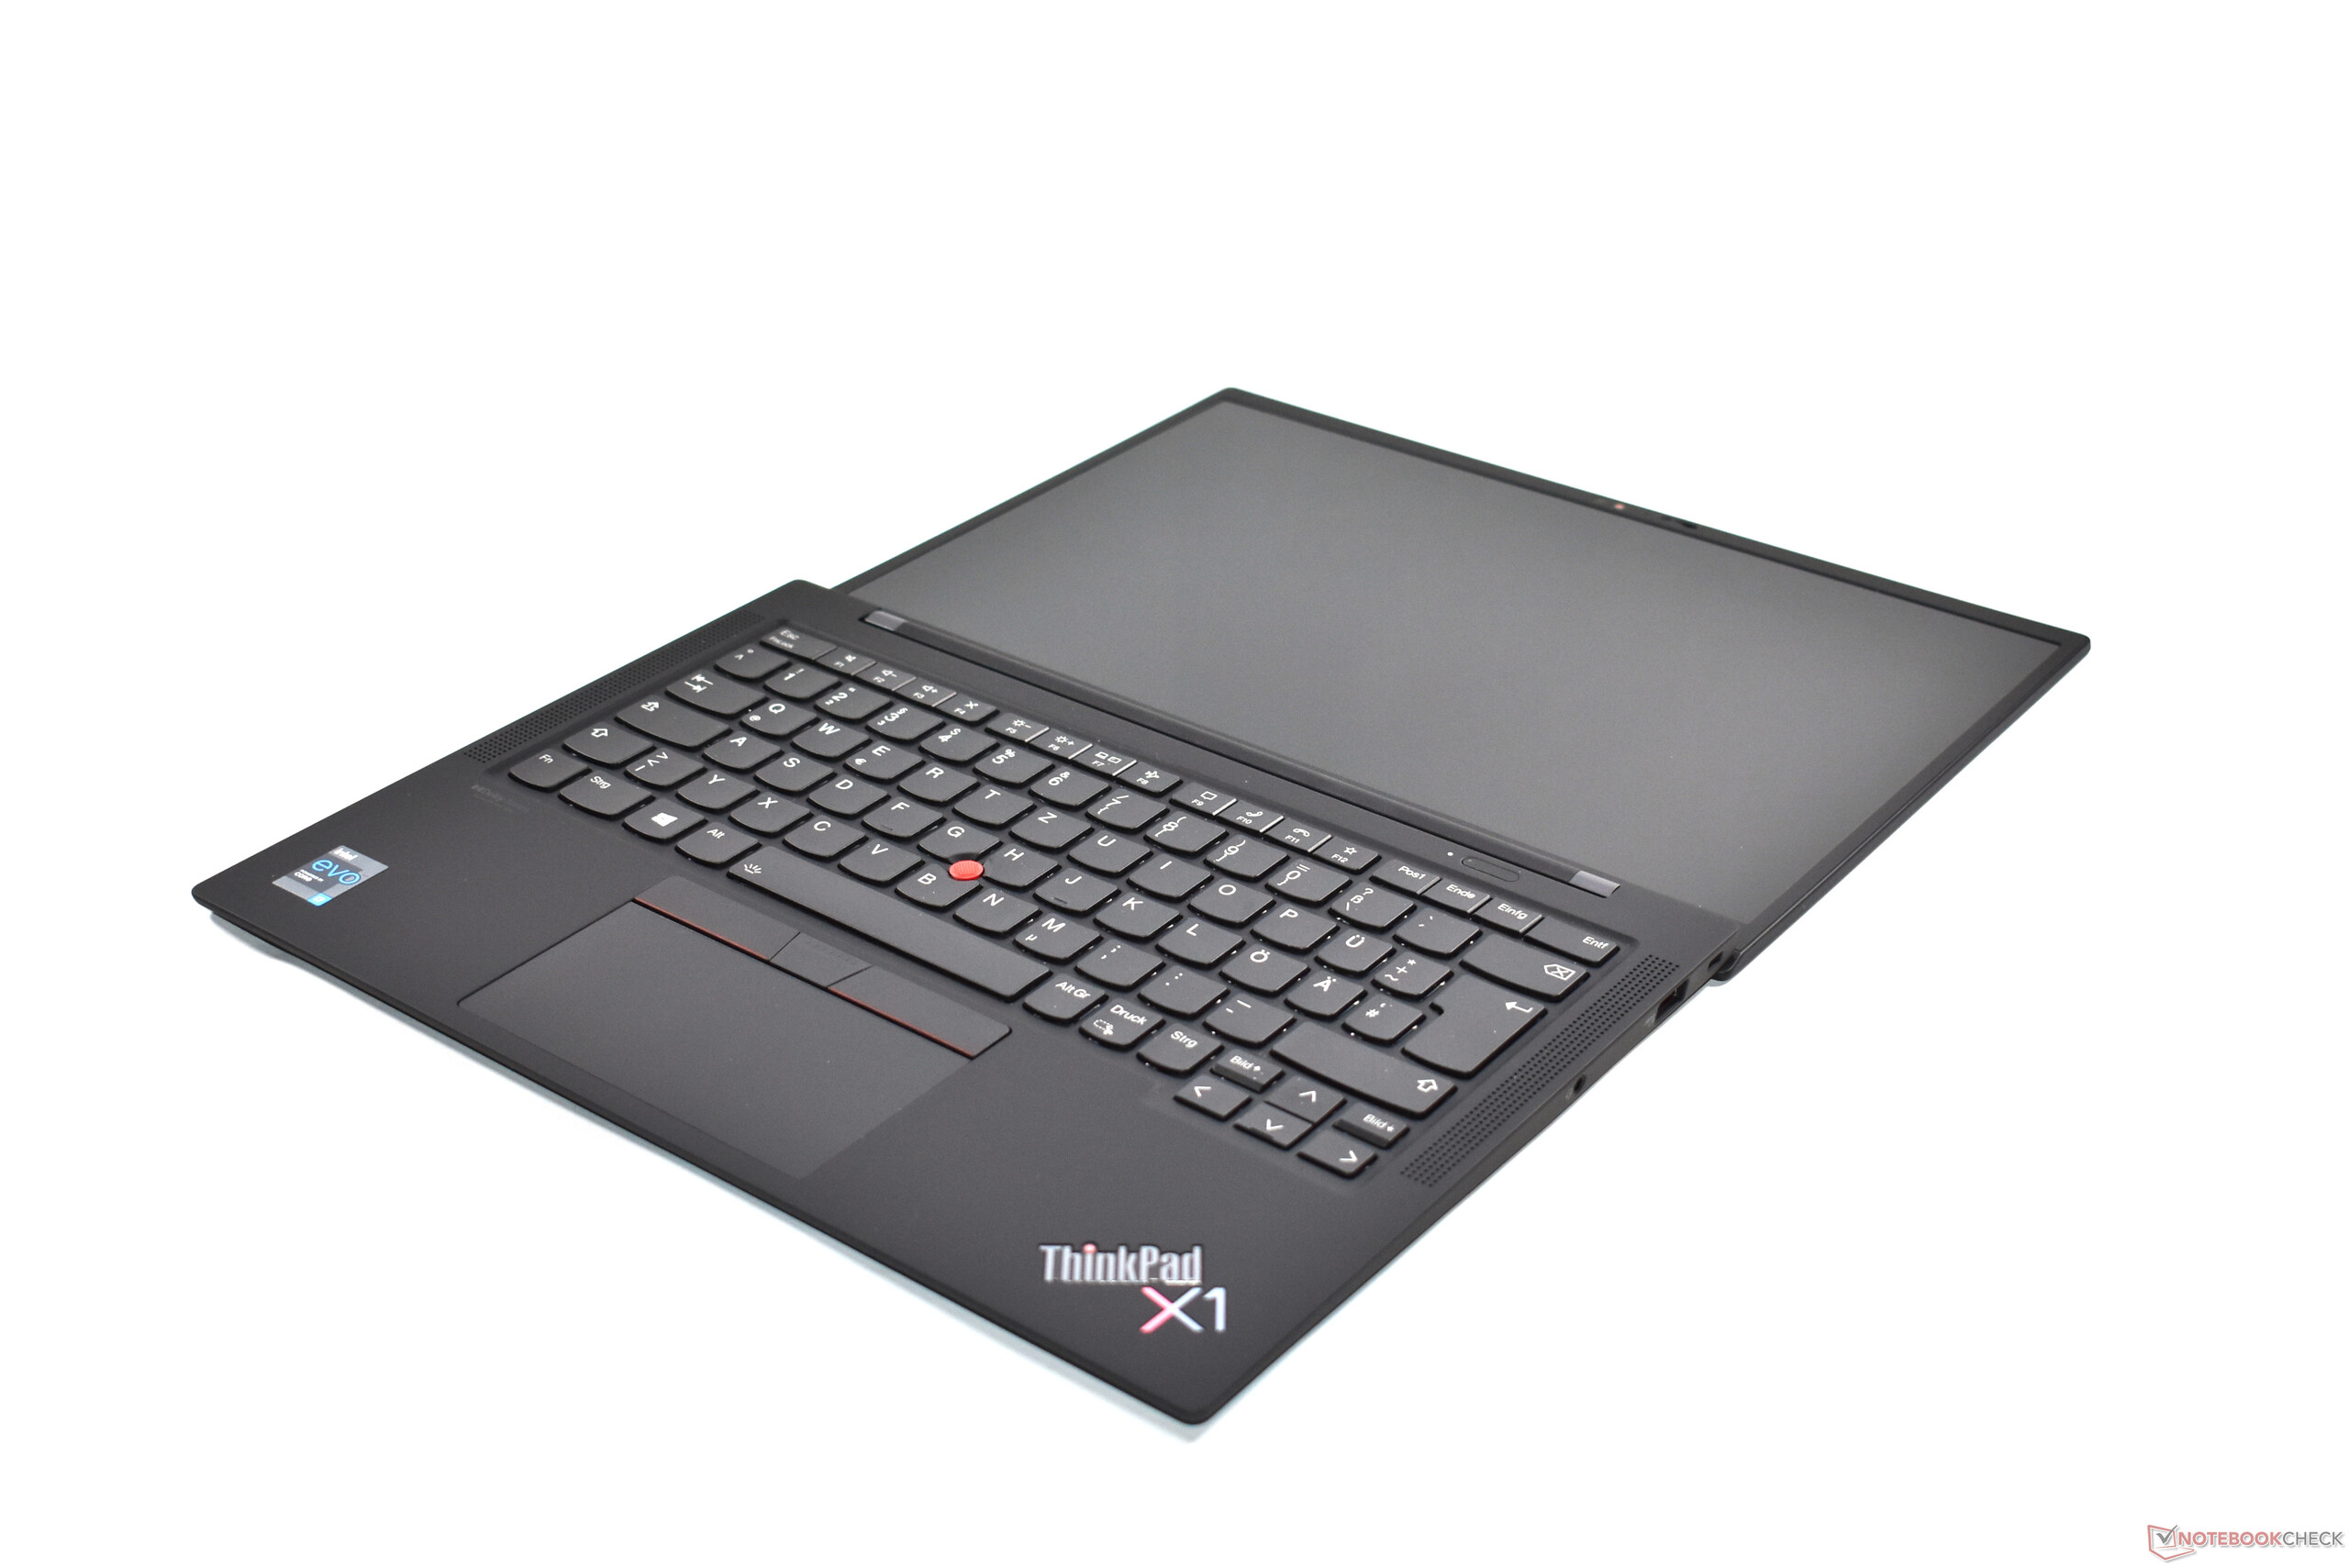
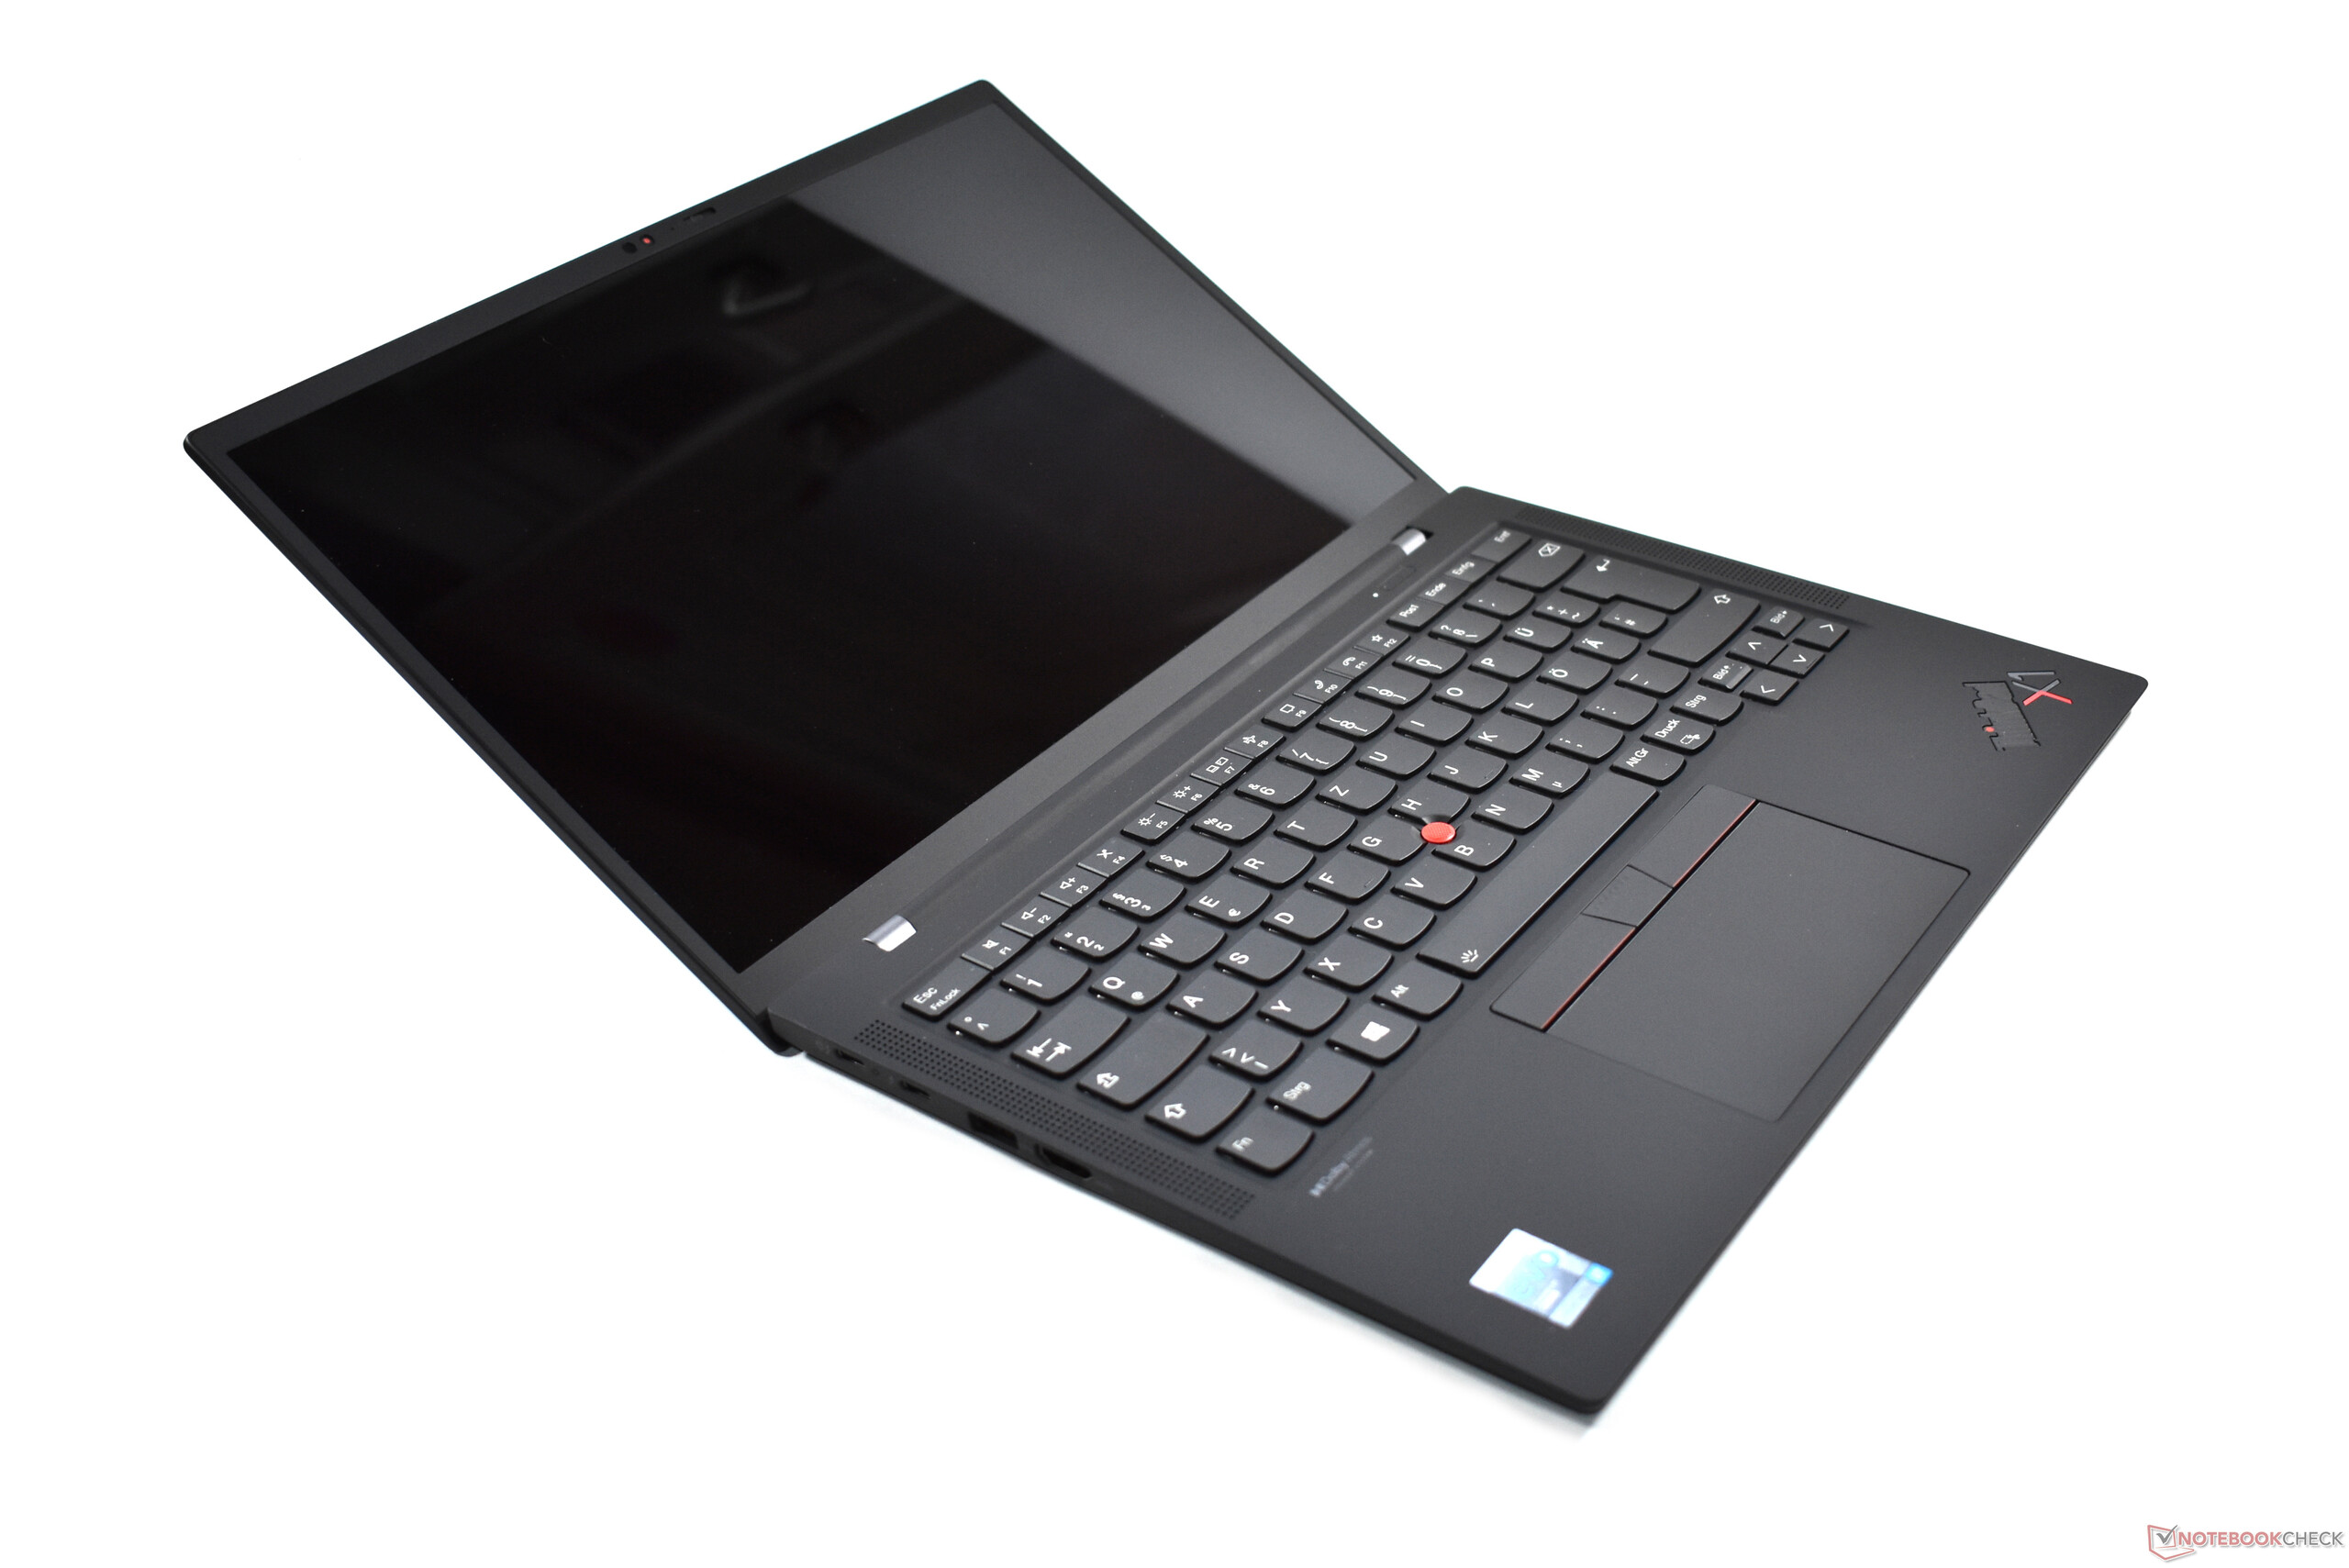
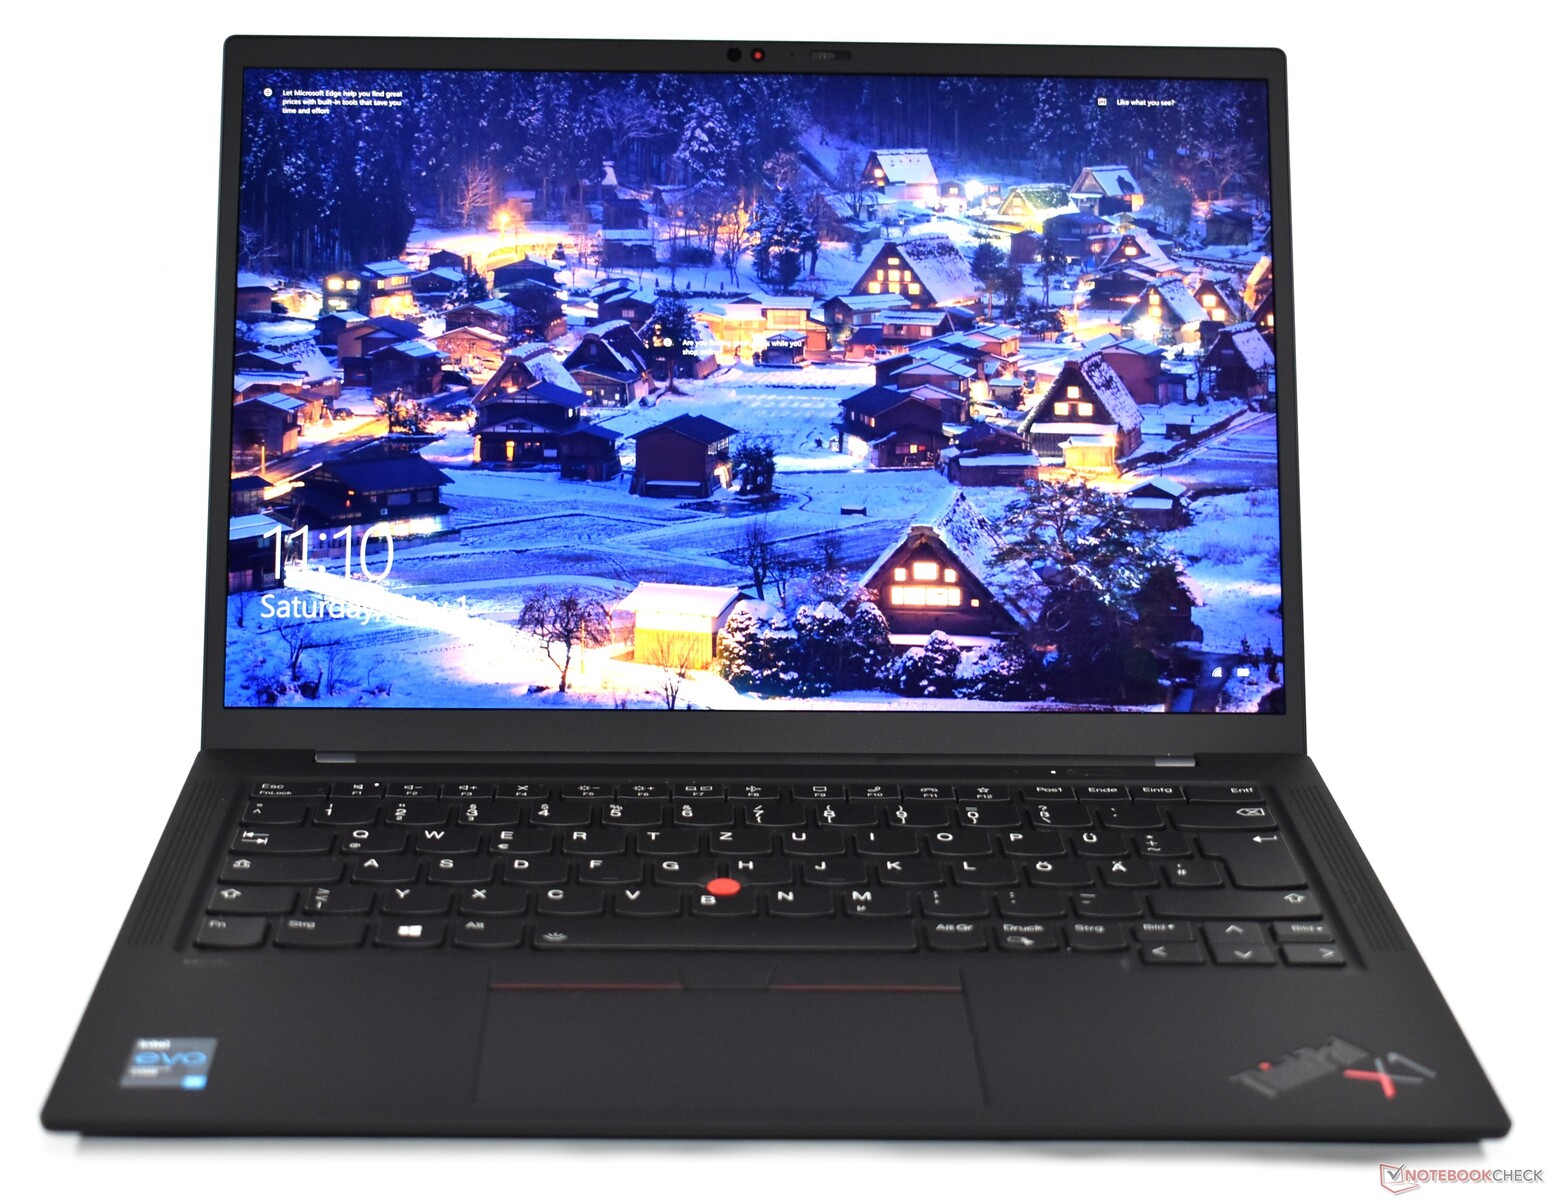
Lenovo ThinkPad X1 Carbon Gen 9 är tänkt att vara ett stort steg framåt. På många sätt är den precis det, i synnerhet när det kommer till 16:10-skärmen. Däremot tar tangentbordet tyvärr ett steg bakåt, vilket är synd med tanke på att tangentborden oftast är ThinkPad-seriens största styrka. Lenovo ThinkPad X1 Carbon G9 har fortfarande ett bra tangentbord, men det är sämre än på föregångaren X1 Carbon Gen 8.
Bortsett från det är det inget annat som har backat. Däremot kan vi se många förbättringar, både små och stora. 4K UHD+/WQUXGA LCD-skärmen har tyvärr fortfarande en blank yta, men den lider inte längre av PWM. Batteritiden blir också lidande av den högupplösta skärmen - så för de flesta är nog den energisparande FHD+/WUXGA-skärmen ett bättre val. En recension av den varianten är planerad.
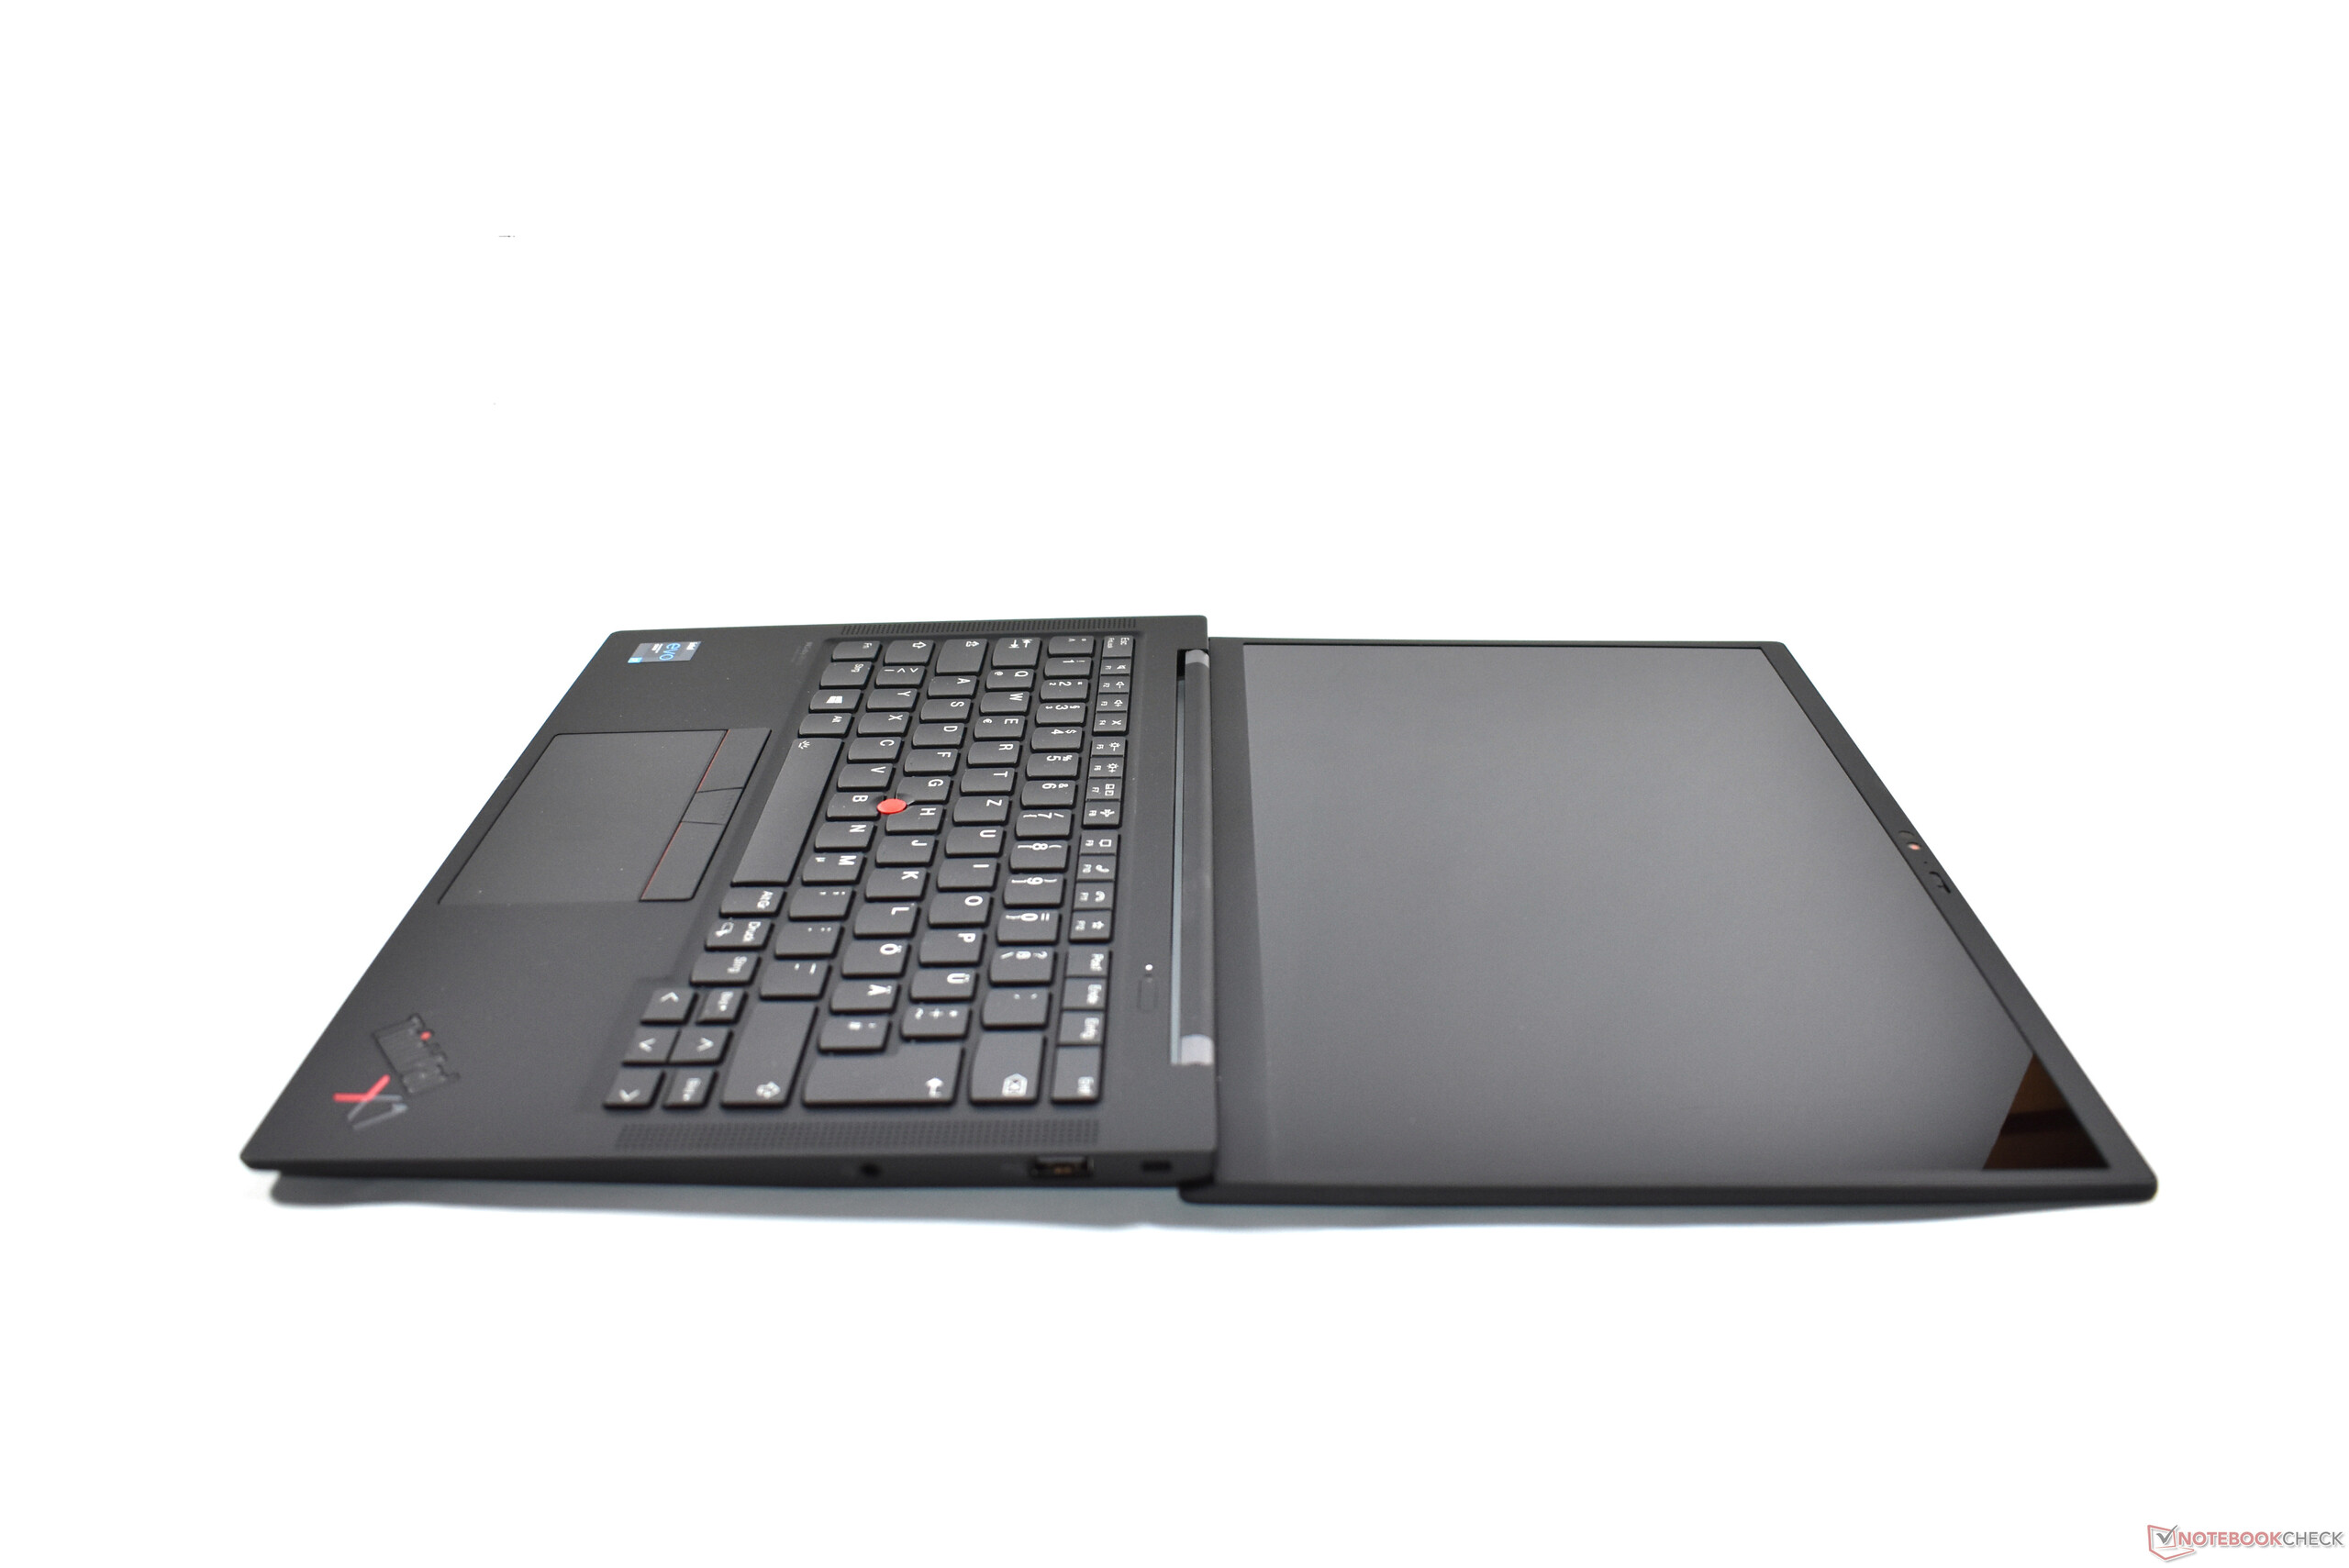
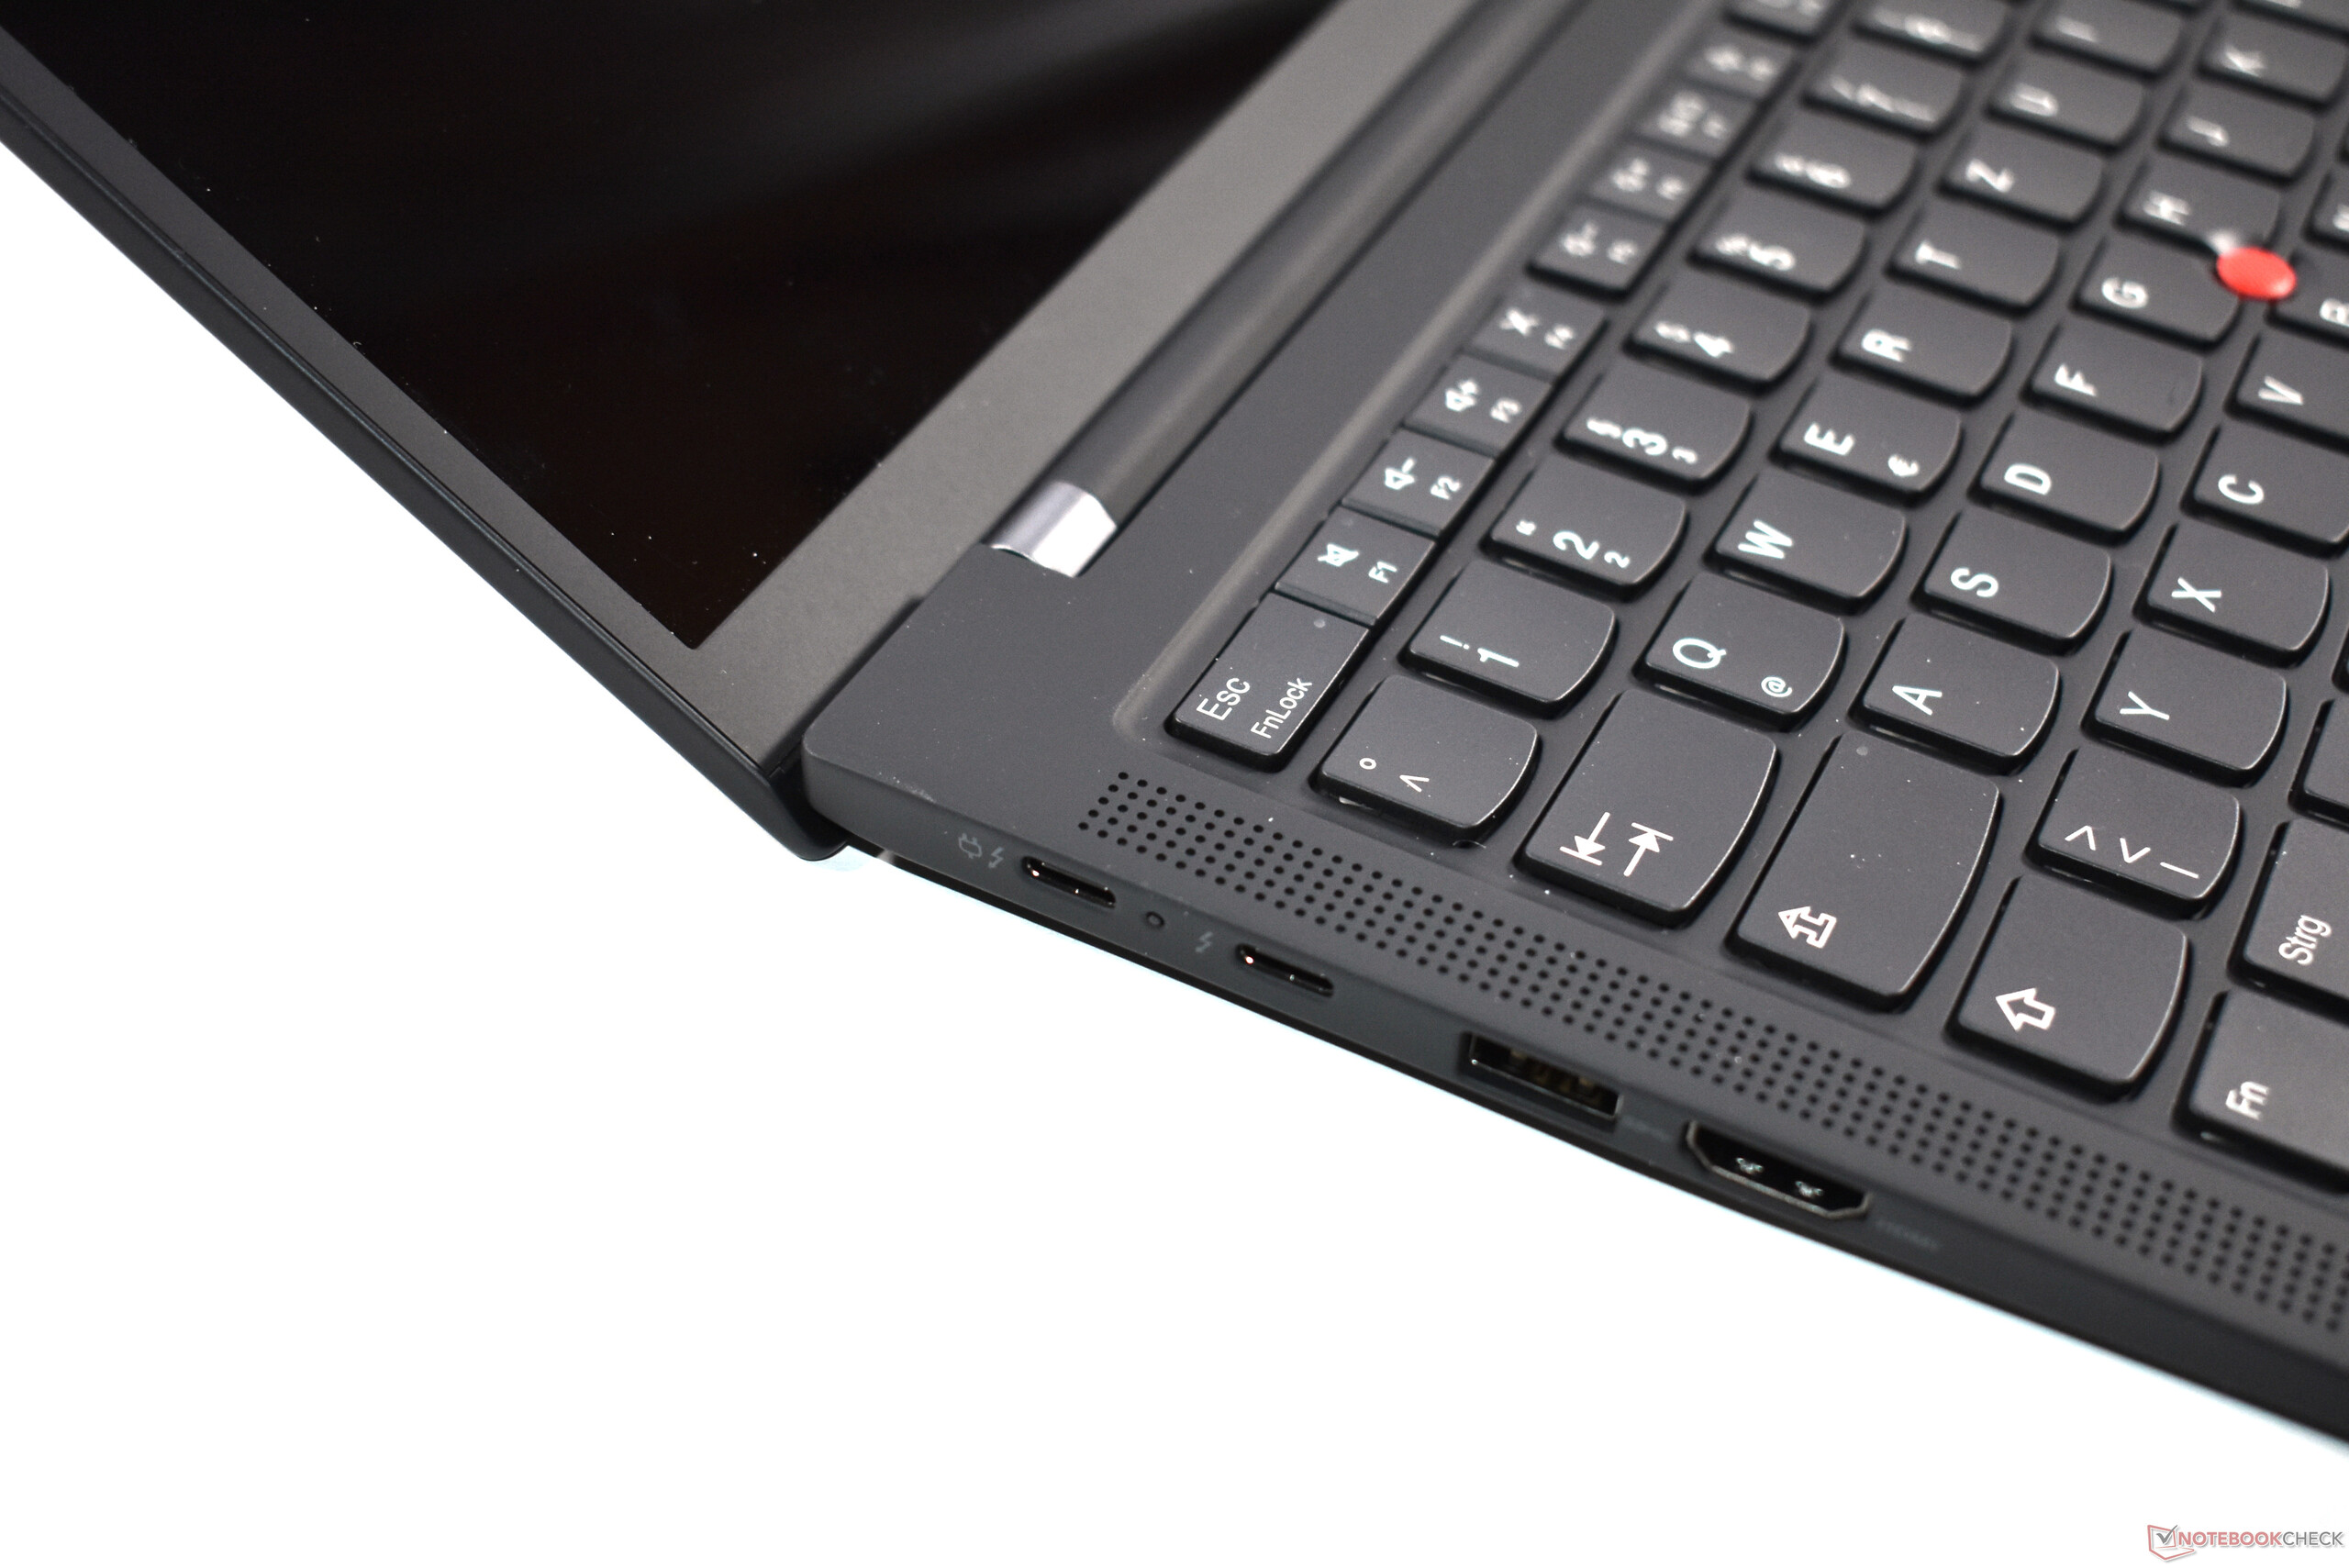
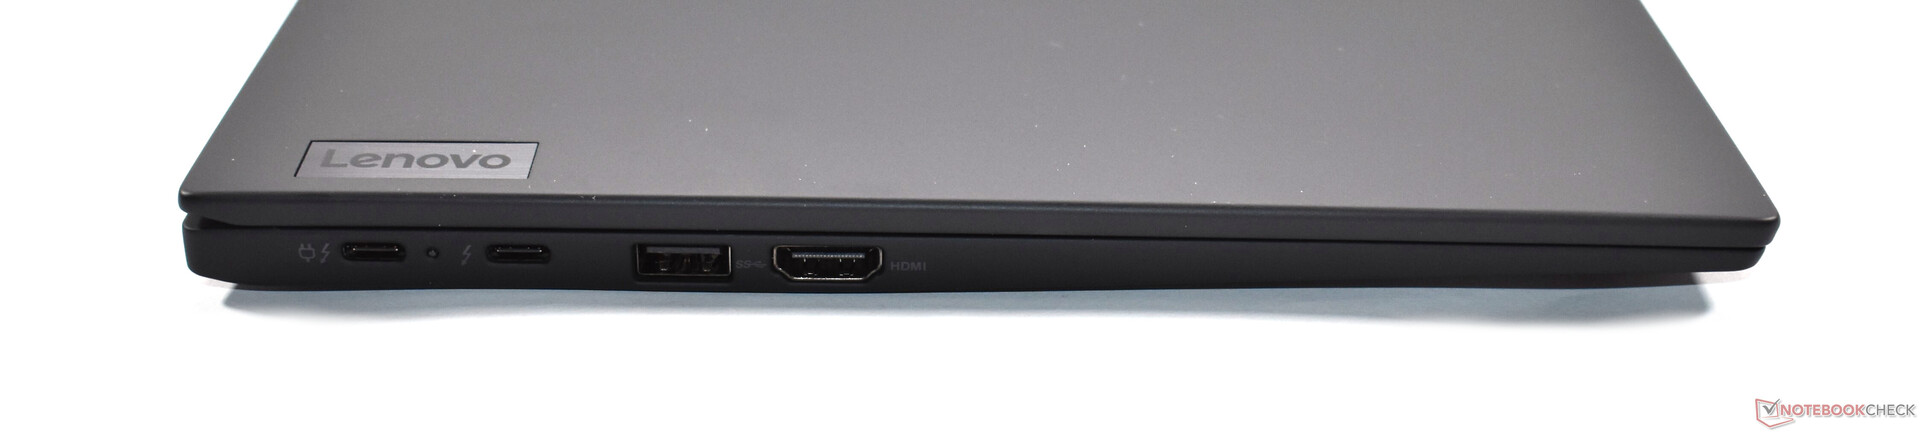
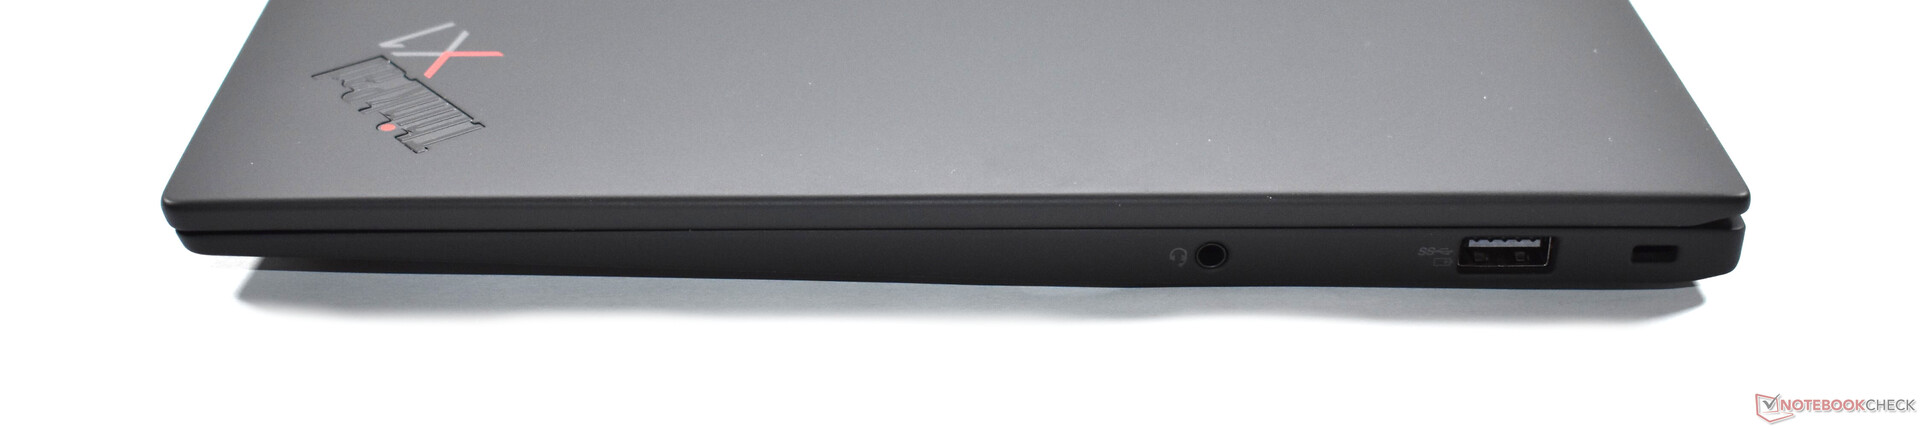
Intel Tiger Lake hjälper X1 Carbon att bli mer konkurrenskraftig i fråga om prestanda. Mjukvaran har dock ett irriterande problem - instabil GPU-prestanda - vilket gör att X1 Carbon lämpar sig dåligt för att spela spel. Spel är dock inte direkt prioriterat för en kontorslaptop som X1 Carbon Gen 9. Lenovo har inte gjort några betydande ändringar när det kommer till styrplattan/TrackPoint-enheten, portutbudet eller det lätta högkvalitativa chassit. På alla dessa områden visar ThinkPad-datorn sin styrka. Det är lite synd att WWAN inte går att uppgradera. Däremot är det bra att Lenovo äntligen gör det möjligt att ha 32 GB RAM i X1 Carbon.
Bortsett från ett aningen sämre tangentbord levererar Lenovo en stark uppföljare till ThinkPad-seriens flaggskepp i form av ThinkPad X1 Carbon Gen 9.
Totalt sett förtjänar Lenovo ThinkPad X1 Carbon Gen 9 vår rekommendation samt ett "riktigt bra" omdöme på 90%. WQUXGA-varianten passar bäst för den som vill ha högsta möjliga skärmkvalitet och som inte använder datorn på batteridrift allt för ofta.
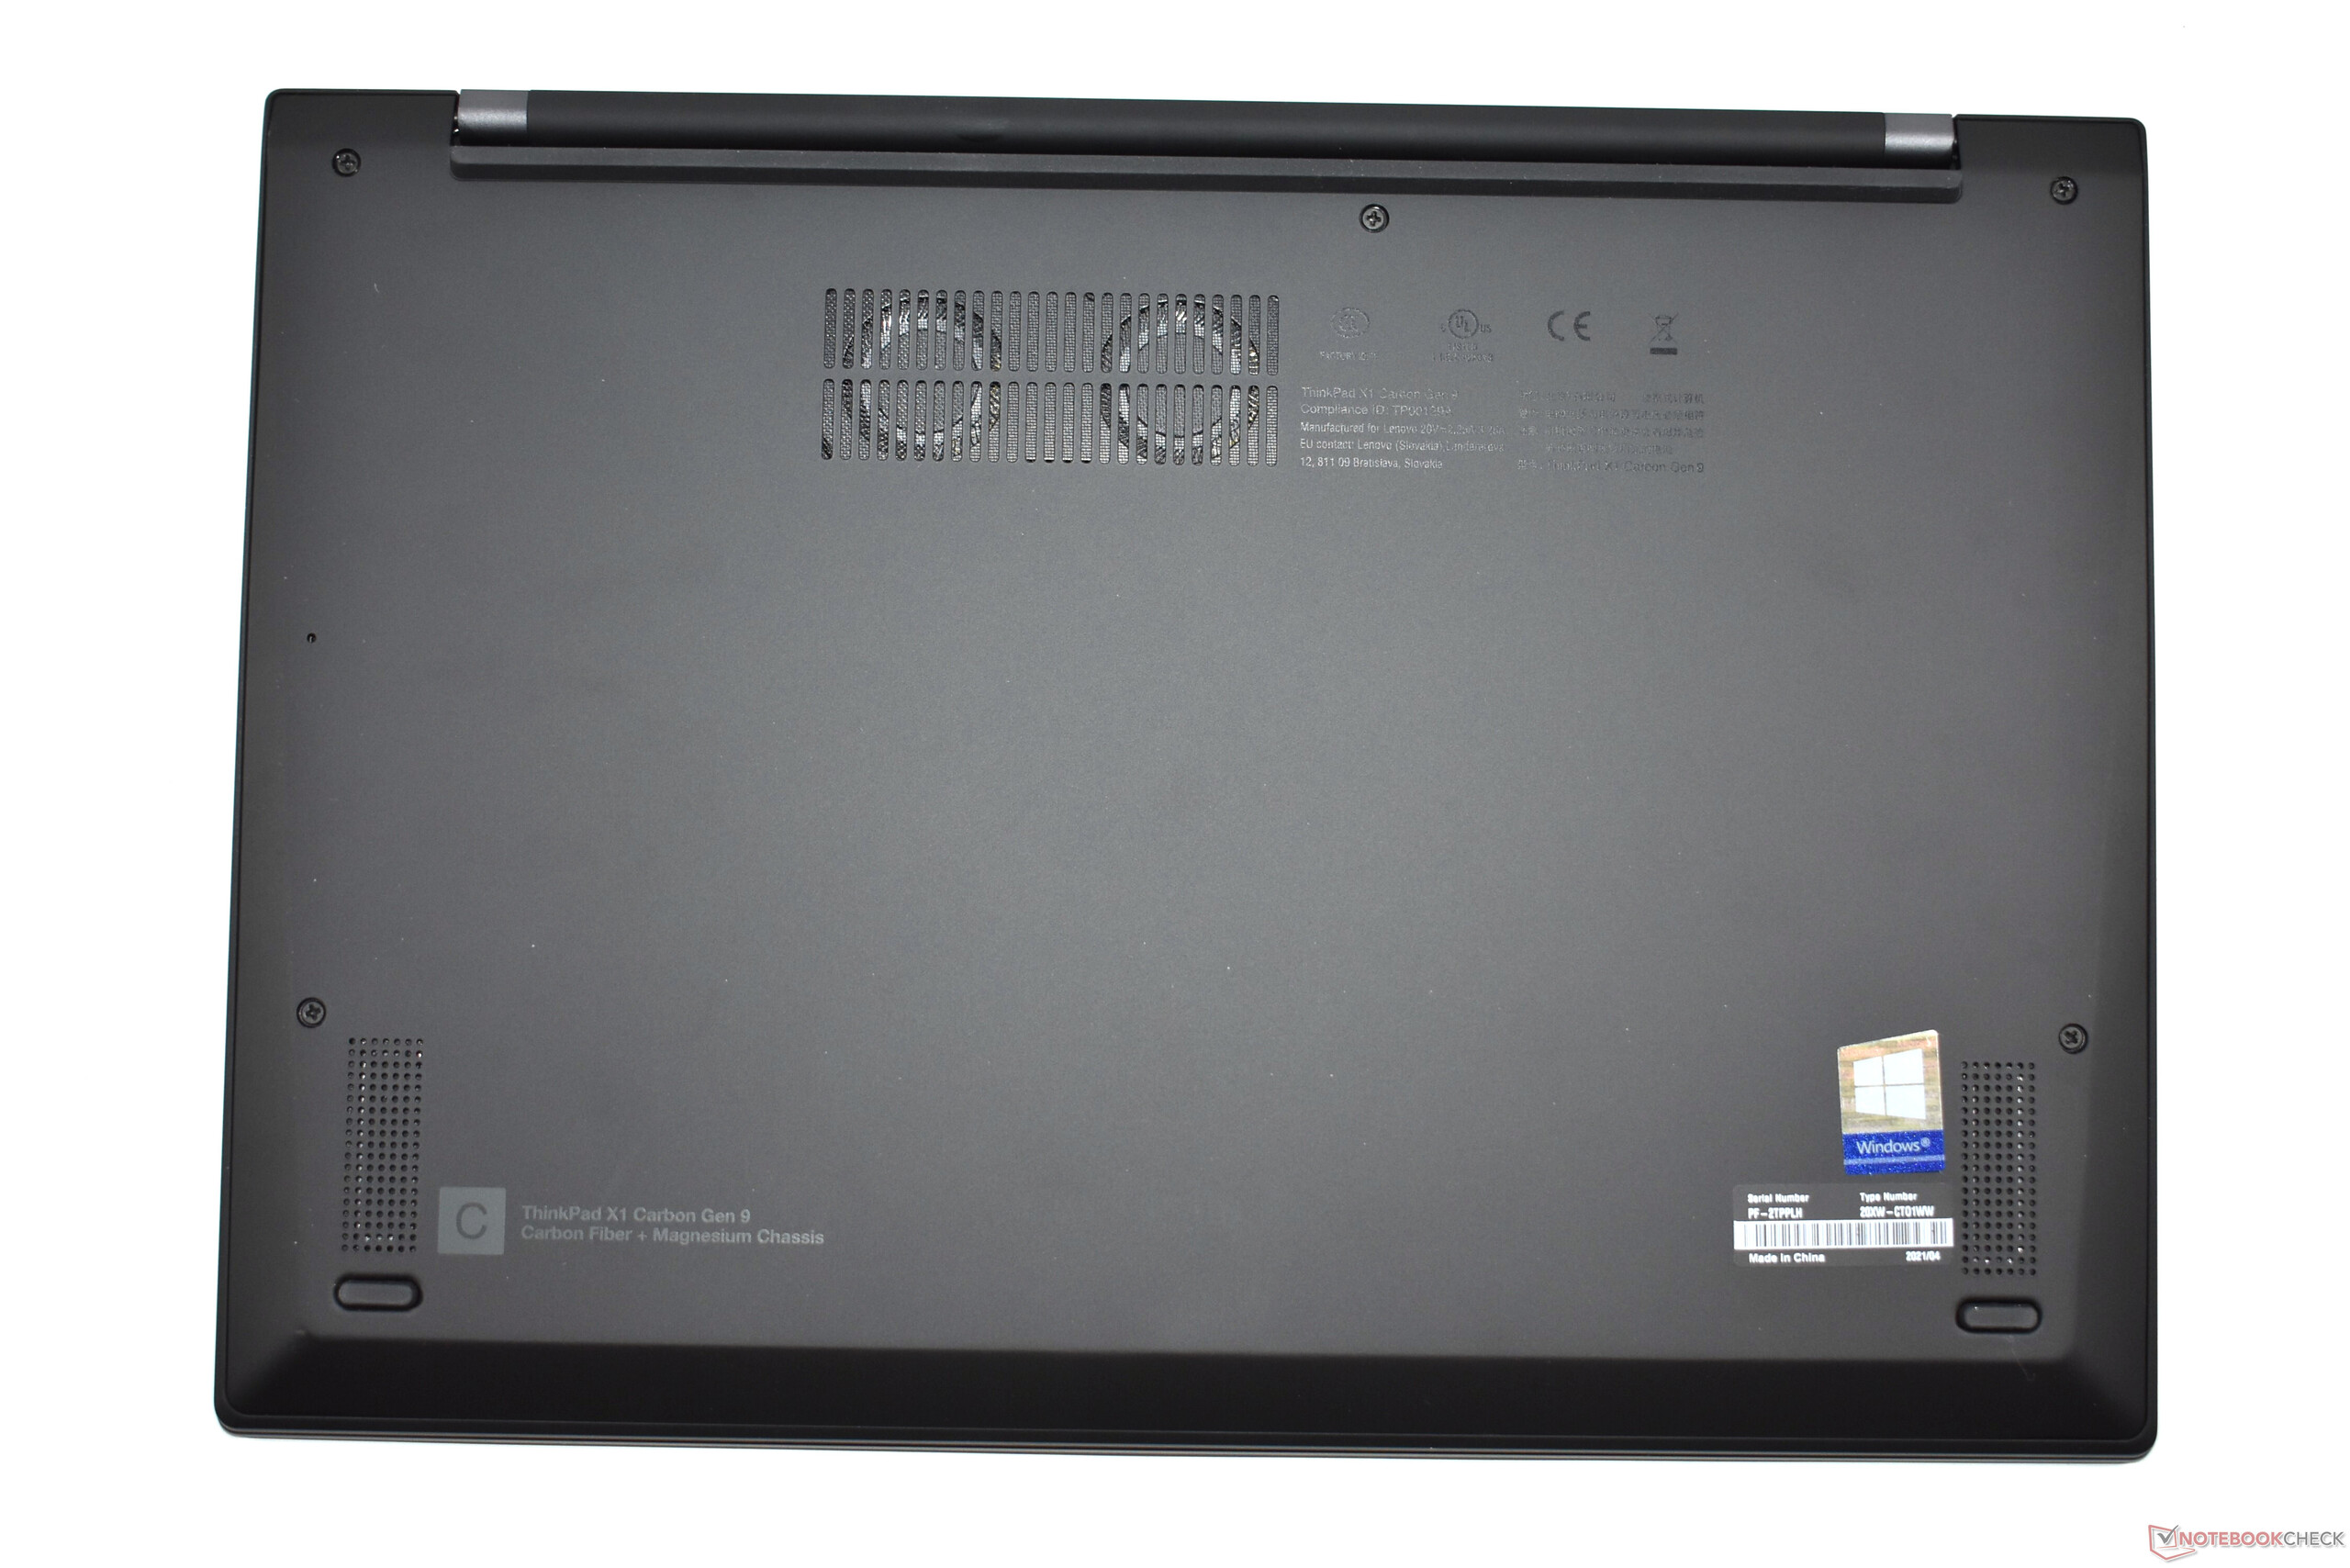
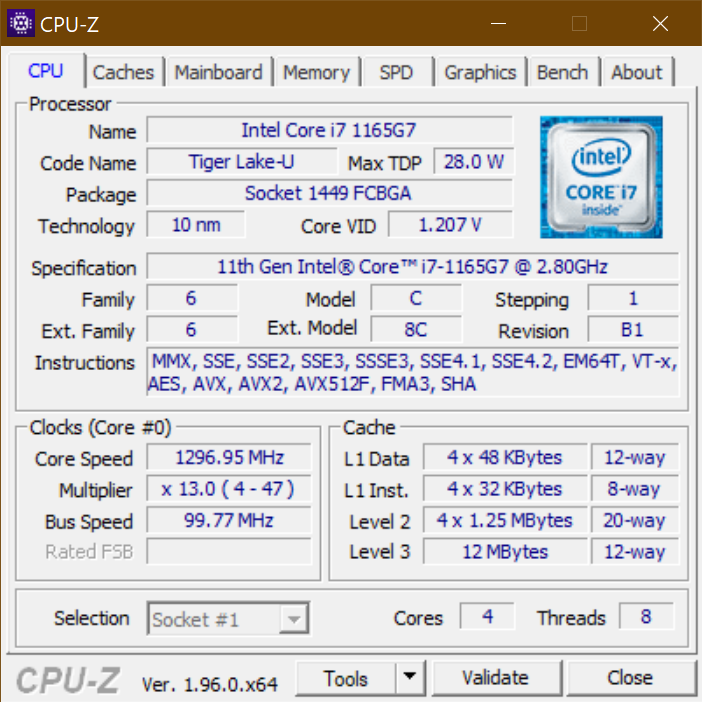
Lenovo ThinkPad X1 Carbon G9-20XWCTO1WW
- 05/07/2021 v7 (old)
Benjamin Herzig
Price comparison
