Tester av Intel Core i7-11370H processor
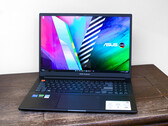
Recension av Asus Vivobook Pro 16X - Asus-system med OLED-skärm i toppklass
Fantastisk prestanda och en fantastisk skärm - det är vad Asus Vivobook Pro 16X erbjuder. OLED-skärmen är Pantone-validerad för särskilt exakta färger. Tack vare den dedikerade GPU:n täcker den bärbara multimediebärbara datorn ett brett spektrum av användningsområden, från spel till professionell video- eller fotoredigering.
Intel Core i7-11370H, NVIDIA GeForce RTX 3050 4GB Laptop GPU, 16", 2 kgRecension av Schenker Work 17 - Stor skärm och ett färgglatt tangentbord
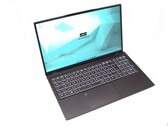
Schenker Work 17 har gott om utrymme för arbete. Dessutom har den en kraftfull Intel Core i7, en del uppgraderingsalternativ och möjlighet till personliga konfigurationer. Datorn erbjuder också ett RGB-tangentbord, vilket gör att man också kan arbeta på natten utan att bli bländad.
Uppdatering: En ny BIOS-version har testats.
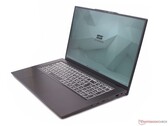
Intel Core i7-11370H, Iris Xe G7 96EUs, 17.3", 2.3 kgRecension av Microsoft Surface Laptop Studio - Intressant koncept med långsam Intel CPU
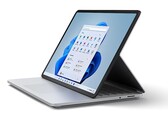
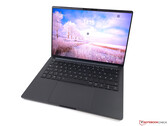
Microsofts Surface Laptop Studio har äntligen lanserats i Tyskland. Den vikbara skärmen är ett intressant koncept, men enheten hålls tillbaka av den långsamma fyrkärniga Tiger Lake-processorn från Intel.
Intel Core i7-11370H, NVIDIA GeForce RTX 3050 Ti Laptop GPU, 14.4", 1.8 kgRecension av Schenker Work 15 Tiger Lake-H: RGB-belysning på kontoret
i en vanlig bärbar dator är unikt. På undersidan har Schenker Work 15 mycket prestanda som kan anpassas exakt efter kundens behov. Den Intel Core i7 CPU som installerats i vår testenhet kan visa sin fulla prestanda.
Intel Core i7-11370H, Iris Xe G7 96EUs, 15.6", 1.7 kgRecension av Schenker Vision 14 - Går nu också att få med GeForce RTX 3050 Ti
Schenkers Vision 14 finns nu även med starkare processorer på 35 watt som levereras med en termisk vätskemetallförening som standard. För högre GPU-prestanda kan du också välja till en GeForce RTX 3050 Ti GPU med ett TGP-värde på 50 watt. Men fungerar det här faktiskt bra i ett såpass kompakt hölje?
Intel Core i7-11370H, NVIDIA GeForce RTX 3050 Ti Laptop GPU, 14", 1.1 kgXiaomi Mi NoteBook Pro: Intel Iris Xe Graphics G7 96EUs, 14.00", 1.4 kg
Test » Xiaomi Mi NoteBook Pro Laptop Review: Handikappad Core i7-11370H begränsar en annars bra enhet
Lenovo IdeaPad Slim 7i Pro 14IHU5: Intel Iris Xe Graphics G7 96EUs, 14.00", 1.4 kg
Test » Recension av den bärbara datorn Lenovo IdeaPad Slim 7i Pro: 90 Hz gör hela skillnaden
Asus TUF Dash F15 FX516PR: NVIDIA GeForce RTX 3070 Laptop GPU, 15.60", 2 kg
Test » Test: Asus TUF Dash F15 - Ampere med en fot på bromsen (Sammanfattning)
Asus VivoBook Pro 15 K3500PH: NVIDIA GeForce GTX 1650 Max-Q, 15.60", 1.7 kg
Externt test » Asus VivoBook Pro 15 K3500PH
Microsoft Surface Studio 2+: NVIDIA GeForce RTX 3060 Laptop GPU, 28.00", 9.6 kg
Externt test » Microsoft Surface Studio 2+
Asus VivoBook Pro 16X N7600PC-L2010W: NVIDIA GeForce RTX 3050 4GB Laptop GPU, 16.10", 2 kg
Externt test » Asus VivoBook Pro 16X N7600PC-L2010W
Lenovo Yoga Slim 7 Pro 14IHU5-82NH002QGE: NVIDIA GeForce MX450, 14.00", 1.4 kg
Externt test » Lenovo Yoga Slim 7 Pro 14IHU5-82NH002QGE
Microsoft Surface Laptop Studio i7 RTX 3050 Ti: NVIDIA GeForce RTX 3050 Ti Laptop GPU, 14.40", 1.8 kg
Externt test » Microsoft Surface Laptop Studio i7 RTX 3050 Ti
HP Pavilion Gaming 15-dk2070ng: NVIDIA GeForce RTX 3050 Ti Laptop GPU, 15.60", 2.3 kg
Externt test » HP Pavilion Gaming 15-dk2070ng
Xiaomi Mi Notebook Pro X14: NVIDIA GeForce RTX 3050 4GB Laptop GPU, 14.00", 1.6 kg
Externt test » Xiaomi Mi Notebook Pro X14
Asus VivoBook Pro 14X N7400PC-KM012T: NVIDIA GeForce RTX 3050 4GB Laptop GPU, 14.00", 1.5 kg
Externt test » Asus VivoBook Pro 14X N7400PC-KM012T
Asus Vivobook Pro 14 K3400PA, i7-11370H: Intel Iris Xe Graphics G7 96EUs, 14.00", 1.4 kg
Externt test » Asus Vivobook Pro 14 K3400PA, i7-11370H
Acer Swift 3 SF316-51: Intel Iris Xe Graphics G7 96EUs, 16.10", 1.7 kg
Externt test » Acer Swift 3 SF316-51
Tuxedo InfinityBook Pro 14 Gen6, 11370H 3K: NVIDIA GeForce RTX 3050 Ti Laptop GPU, 14.00", 1 kg
Externt test » Tuxedo InfinityBook Pro 14 Gen6, 11370H 2K
Asus VivoBook Pro 14X N7400PC-KM142W: NVIDIA GeForce RTX 3050 4GB Laptop GPU, 14.00", 1.5 kg
Externt test » Asus VivoBook Pro 14X N7400PC-KM142W
Asus VivoBook Pro 15 K3500PC, i7-11370H RTX 3050: NVIDIA GeForce RTX 3050 4GB Laptop GPU, 15.60", 1.7 kg
Externt test » Asus VivoBook Pro 15 K3500PC, i7-11370H RTX 3050
Asus VivoBook Pro 15 K3500PA-L1077T: Intel Iris Xe Graphics G7 96EUs, 15.60", 1.7 kg
Externt test » Asus VivoBook Pro 15 K3500PA-L1077T
Lenovo IdeaPad Slim 7i Pro 14IHU5: Intel Iris Xe Graphics G7 96EUs, 14.00", 1.4 kg
Externt test » Lenovo IdeaPad Slim 7i Pro 14IHU5
Asus VivoBook Pro 16X N7600PC: NVIDIA GeForce RTX 3050 4GB Laptop GPU, 16.10", 1.9 kg
Externt test » Asus VivoBook Pro 16X N7600PC
Microsoft Surface Laptop Studio, i7-11370H RTX 3050 Ti: NVIDIA GeForce RTX 3050 Ti Laptop GPU, 14.40", 1.8 kg
Externt test » Microsoft Surface Laptop Studio, i7-11370H RTX 3050 Ti
Microsoft Surface Laptop Studio, i7-11370H RTX A2000: NVIDIA RTX A2000 Laptop GPU, 14.40", 1.8 kg
Externt test » Microsoft Surface Laptop Studio, i7-11370H RTX A2000
HP Pavilion Gaming 17-cd2023ur: NVIDIA GeForce RTX 3050 4GB Laptop GPU, 17.30", 2.8 kg
Externt test » HP Pavilion Gaming 17-cd2023ur
Xiaomi Mi Notebook Pro 14, i7-11370H: Intel Iris Xe Graphics G7 96EUs, 14.00", 1.5 kg
Externt test » Xiaomi Mi Notebook Pro 14, i7-11370H
Acer Swift 3 SF316-51-7486: Intel Iris Xe Graphics G7 96EUs, 16.10", 1.8 kg
Externt test » Acer Swift 3 SF316-51-7486
Huawei MateBook 14s i7: Intel Iris Xe Graphics G7 96EUs, 14.20", 1.4 kg
Externt test » Huawei MateBook 14s i7
Xiaomi Mi Notebook Ultra 2021 i7: Intel Iris Xe Graphics G7 96EUs, 15.60", 1.7 kg
Externt test » Xiaomi Mi Notebook Ultra 2021 i7
Asus TUF Dash F15 TUF516PE-AB73: NVIDIA GeForce RTX 3050 Ti Laptop GPU, 15.60", 2 kg
Externt test » Asus TUF Dash F15 TUF516PE-AB73
Asus TUF Dash F15 FX516PM-HN135: NVIDIA GeForce RTX 3060 Laptop GPU, 15.60", 2 kg
Externt test » Asus TUF Dash F15 FX516PM-HN135
Asus TUF Dash F15 FX516PE-HN006T: NVIDIA GeForce RTX 3050 Ti Laptop GPU, 15.60", 2 kg
Externt test » Asus TUF Dash F15 FX516P-EHN006T
Asus ZenBook Flip 15 UX564PH-EZ007R: NVIDIA GeForce GTX 1650 Max-Q, 15.60", 1.9 kg
Externt test » Asus ZenBook Flip 15 UX564PH-EZ007R
Acer Nitro 5 AN515-56-75HR: NVIDIA GeForce GTX 1650 Mobile, 15.60", 2.3 kg
Externt test » Acer Nitro 5 AN515-56-75HR
Asus TUF Dash F15 FX516PM-HN023: NVIDIA GeForce RTX 3060 Laptop GPU, 15.60", 2 kg
Externt test » Asus TUF Dash F15 FX516PM-HN023
Acer Predator Triton 300SE PT314-51s-70CS: NVIDIA GeForce RTX 3060 Laptop GPU, 14.00", 1.7 kg
Externt test » Acer Predator Triton 300SE PT314-51s-70CS
Asus TUF Dash F15 FX516PR-AZ019T: NVIDIA GeForce RTX 3070 Laptop GPU, 15.60", 2 kg
Externt test » Asus TUF Dash F15 FX516PR-AZ019T
Asus TUF Gaming Dash F15 FX516PR-HN002: NVIDIA GeForce RTX 3070 Laptop GPU, 15.60", 2 kg
Externt test » Asus TUF Gaming Dash F15 FX516PR-HN002
Asus TUF Dash F15 FX516PR: NVIDIA GeForce RTX 3070 Laptop GPU, 15.60", 2 kg
Externt test » Asus TUF Dash F15 FX516PR
Asus TUF Dash F15 FX516PM: NVIDIA GeForce RTX 3060 Laptop GPU, 15.60", 2 kg
Externt test » Asus TUF Dash F15 FX516PM