Test: 2020 HP Pavilion 13 - Den är faktiskt riktigt bra (Sammanfattning)
Testgrupp
Gradering | Datum | Modell | Vikt | Höjd | Storlek | Upplösning | Pris |
|---|---|---|---|---|---|---|---|
| 81.5 % v7 (old) | 12/2020 | HP Pavilion 13-bb0015cl i7-1165G7, Iris Xe G7 96EUs | 1.2 kg | 17.7 mm | 13.30" | 3840x2160 | |
| 87.1 % v7 (old) | HP Envy 13-ba0001ng i7-10510U, GeForce MX350 | 1.3 kg | 16 mm | 13.30" | 1920x1080 | ||
| 88.8 % v7 (old) | 04/2020 | Dell XPS 13 9300 i5 FHD i5-1035G1, UHD Graphics G1 (Ice Lake 32 EU) | 1.2 kg | 14.8 mm | 13.40" | 1920x1200 | |
| 85 % v6 (old) | 05/2019 | Asus VivoBook S13 S330UA-EY034T i5-8550U, UHD Graphics 620 | 1.2 kg | 17.9 mm | 13.30" | 1920x1080 | |
| 85 % v7 (old) | Lenovo IdeaPad S540-13ARE-82DL000YGE R5 4600U, Vega 6 | 1.3 kg | 15.95 mm | 13.30" | 2560x1600 | ||
| 87 % v7 (old) | 02/2020 | Acer Swift 3 SF313-52-71Y7 i7-1065G7, Iris Plus Graphics G7 (Ice Lake 64 EU) | 1.2 kg | 16.6 mm | 13.50" | 2256x1504 |
| SD Card Reader | |
| average JPG Copy Test (av. of 3 runs) | |
| Dell XPS 13 9300 i5 FHD (Toshiba Exceria Pro M501 64 GB UHS-II) | |
| HP Pavilion 13-bb0015cl (Toshiba Exceria Pro M501 32 GB UHS-II) | |
| HP Envy 13-ba0001ng (Toshiba Exceria Pro M501 microSDXC 64GB) | |
| Asus VivoBook S13 S330UA-EY034T (Toshiba Exceria Pro M501 64 GB UHS-II) | |
| maximum AS SSD Seq Read Test (1GB) | |
| Dell XPS 13 9300 i5 FHD (Toshiba Exceria Pro M501 64 GB UHS-II) | |
| HP Pavilion 13-bb0015cl (Toshiba Exceria Pro M501 32 GB UHS-II) | |
| HP Envy 13-ba0001ng (Toshiba Exceria Pro M501 microSDXC 64GB) | |
| Asus VivoBook S13 S330UA-EY034T (Toshiba Exceria Pro M501 64 GB UHS-II) | |
| Networking | |
| iperf3 transmit AX12 | |
| HP Pavilion 13-bb0015cl | |
| Dell XPS 13 9300 i5 FHD | |
| HP Envy 13-ba0001ng | |
| Asus VivoBook S13 S330UA-EY034T | |
| Lenovo IdeaPad S540-13ARE-82DL000YGE | |
| iperf3 receive AX12 | |
| Dell XPS 13 9300 i5 FHD | |
| HP Pavilion 13-bb0015cl | |
| Lenovo IdeaPad S540-13ARE-82DL000YGE | |
| HP Envy 13-ba0001ng | |
| Asus VivoBook S13 S330UA-EY034T | |


| |||||||||||||||||||||||||
Distribution av ljusstyrkan: 91 %
Mitt på batteriet: 514.1 cd/m²
Kontrast: 1389:1 (Svärta: 0.37 cd/m²)
ΔE ColorChecker Calman: 4.35 | ∀{0.5-29.43 Ø4.72}
calibrated: 2.26
ΔE Greyscale Calman: 5.2 | ∀{0.09-98 Ø4.97}
93.3% sRGB (Argyll 1.6.3 3D)
60.6% AdobeRGB 1998 (Argyll 1.6.3 3D)
66.5% AdobeRGB 1998 (Argyll 3D)
93.4% sRGB (Argyll 3D)
65% Display P3 (Argyll 3D)
Gamma: 2.12
CCT: 6308 K
| HP Pavilion 13-bb0015cl AUOCA8D, IPS, 13.3", 3840x2160 | HP Envy 13-ba0001ng AU Optronics AUO3A8C, IPS, 13.3", 1920x1080 | Dell XPS 13 9300 i5 FHD SHP14CB, IPS, 13.4", 1920x1200 | Asus VivoBook S13 S330UA-EY034T N133HCE-EAA, IPS LED, 13.3", 1920x1080 | Lenovo IdeaPad S540-13ARE-82DL000YGE Chi Mei CMN13B0 (N133GCA-GQ1), IPS, 13.3", 2560x1600 | Acer Swift 3 SF313-52-71Y7 BOE, NE135FBM-N41, IPS, 13.5", 2256x1504 | |
|---|---|---|---|---|---|---|
| Display | 4% | 9% | -34% | 0% | 7% | |
| Display P3 Coverage (%) | 65 | 67.1 3% | 71.5 10% | 42.16 -35% | 64.2 -1% | 70.1 8% |
| sRGB Coverage (%) | 93.4 | 99.1 6% | 99.4 6% | 63.2 -32% | 95.7 2% | 99.8 7% |
| AdobeRGB 1998 Coverage (%) | 66.5 | 69.2 4% | 73.5 11% | 43.59 -34% | 66 -1% | 71.2 7% |
| Response Times | 11% | 3% | 26% | 41% | 10% | |
| Response Time Grey 50% / Grey 80% * (ms) | 52.4 ? | 56 ? -7% | 60 ? -15% | 40.8 ? 22% | 33 ? 37% | 55 ? -5% |
| Response Time Black / White * (ms) | 41.6 ? | 30 ? 28% | 33.2 ? 20% | 29.6 ? 29% | 23 ? 45% | 31 ? 25% |
| PWM Frequency (Hz) | 2500 ? | 26040 ? | 208 ? | |||
| Screen | 32% | 13% | -42% | -0% | 8% | |
| Brightness middle (cd/m²) | 514.1 | 466 -9% | 619 20% | 280 -46% | 321 -38% | 474 -8% |
| Brightness (cd/m²) | 501 | 418 -17% | 591 18% | 265 -47% | 304 -39% | 426 -15% |
| Brightness Distribution (%) | 91 | 85 -7% | 91 0% | 89 -2% | 88 -3% | 82 -10% |
| Black Level * (cd/m²) | 0.37 | 0.215 42% | 0.35 5% | 0.24 35% | 0.32 14% | 0.29 22% |
| Contrast (:1) | 1389 | 2167 56% | 1769 27% | 1167 -16% | 1003 -28% | 1634 18% |
| Colorchecker dE 2000 * | 4.35 | 1.06 76% | 3 31% | 5.6 -29% | 3.41 22% | 2.38 45% |
| Colorchecker dE 2000 max. * | 6.5 | 1.59 76% | 8.2 -26% | 20.7 -218% | 5.88 10% | |
| Colorchecker dE 2000 calibrated * | 2.26 | 1.09 52% | 1 56% | 4.3 -90% | 0.66 71% | 2.69 -19% |
| Greyscale dE 2000 * | 5.2 | 1.3 75% | 5.2 -0% | 4.1 21% | 5.54 -7% | 3.75 28% |
| Gamma | 2.12 104% | 2.39 92% | 2.14 103% | 2.44 90% | 2.33 94% | 2.37 93% |
| CCT | 6308 103% | 6699 97% | 6340 103% | 6614 98% | 6476 100% | 6466 101% |
| Color Space (Percent of AdobeRGB 1998) (%) | 60.6 | 63 4% | 66.9 10% | 40.1 -34% | 61 1% | 65 7% |
| Color Space (Percent of sRGB) (%) | 93.3 | 99 6% | 99.3 6% | 63 -32% | 96 3% | 100 7% |
| Totalt genomsnitt (program/inställningar) | 16% /
24% | 8% /
11% | -17% /
-32% | 14% /
5% | 8% /
8% |
* ... mindre är bättre
Visa svarstider
| ↔ Svarstid svart till vitt | ||
|---|---|---|
| 41.6 ms ... stiga ↗ och falla ↘ kombinerat | ↗ 21.2 ms stiga | 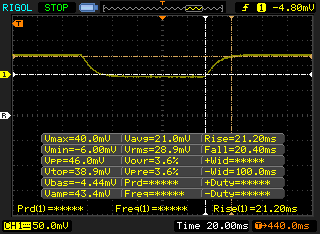 |
| ↘ 20.4 ms hösten | ||
| Skärmen visar långsamma svarsfrekvenser i våra tester och kommer att vara otillfredsställande för spelare. I jämförelse sträcker sig alla testade enheter från 0.1 (minst) till 240 (maximalt) ms. » 98 % av alla enheter är bättre. Detta innebär att den uppmätta svarstiden är sämre än genomsnittet av alla testade enheter (19.8 ms). | ||
| ↔ Svarstid 50 % grått till 80 % grått | ||
| 52.4 ms ... stiga ↗ och falla ↘ kombinerat | ↗ 25.2 ms stiga | 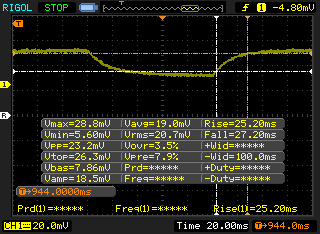 |
| ↘ 27.2 ms hösten | ||
| Skärmen visar långsamma svarsfrekvenser i våra tester och kommer att vara otillfredsställande för spelare. I jämförelse sträcker sig alla testade enheter från 0.165 (minst) till 636 (maximalt) ms. » 89 % av alla enheter är bättre. Detta innebär att den uppmätta svarstiden är sämre än genomsnittet av alla testade enheter (31 ms). | ||
Skärmflimmer / PWM (Puls-Width Modulation)
| Skärmflimmer / PWM upptäcktes inte | 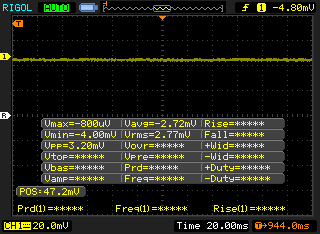 | ||
Som jämförelse: 52 % av alla testade enheter använder inte PWM för att dämpa skärmen. Om PWM upptäcktes mättes ett medelvärde av 7781 (minst: 5 - maximum: 343500) Hz. | |||
Cinebench R15: CPU Multi 64Bit | CPU Single 64Bit
Blender: v2.79 BMW27 CPU
7-Zip 18.03: 7z b 4 -mmt1 | 7z b 4
Geekbench 5.5: Single-Core | Multi-Core
HWBOT x265 Benchmark v2.2: 4k Preset
LibreOffice : 20 Documents To PDF
R Benchmark 2.5: Overall mean
| Cinebench R20 / CPU (Multi Core) | |
| Lenovo Yoga Slim 7-14ARE | |
| Lenovo Yoga Slim 7 14ARE05 82A20008GE | |
| Dell XPS 13 7390 Core i7-10710U | |
| Genomsnitt Intel Core i7-1165G7 (1060 - 2657, n=81) | |
| HP Pavilion 13-bb0015cl | |
| Asus Zenbook S UX393JA | |
| Huawei MateBook 13 2020 i5 | |
| HP Envy 13-ba0001ng | |
| HP Envy 13-aq0003ng | |
| HP Envy x360 13-ar0601ng | |
| HP Elite Dragonfly-8MK79EA | |
| Cinebench R20 / CPU (Single Core) | |
| HP Pavilion 13-bb0015cl | |
| Genomsnitt Intel Core i7-1165G7 (442 - 589, n=81) | |
| Lenovo Yoga Slim 7-14ARE | |
| Lenovo Yoga Slim 7 14ARE05 82A20008GE | |
| Dell XPS 13 7390 Core i7-10710U | |
| Asus Zenbook S UX393JA | |
| HP Envy 13-ba0001ng | |
| Huawei MateBook 13 2020 i5 | |
| HP Elite Dragonfly-8MK79EA | |
| HP Envy 13-aq0003ng | |
| HP Envy x360 13-ar0601ng | |
| Cinebench R15 / CPU Multi 64Bit | |
| Lenovo Yoga Slim 7-14ARE | |
| Lenovo Yoga Slim 7 14ARE05 82A20008GE | |
| Dell XPS 13 7390 Core i7-10710U | |
| Genomsnitt Intel Core i7-1165G7 (553 - 1027, n=86) | |
| HP Pavilion 13-bb0015cl | |
| HP Envy x360 13-ar0601ng | |
| Huawei MateBook 13 2020 i5 | |
| Asus Zenbook S UX393JA | |
| HP Envy 13-ba0001ng | |
| HP Envy 13-aq0003ng | |
| HP Elite Dragonfly-8MK79EA | |
| Cinebench R15 / CPU Single 64Bit | |
| HP Pavilion 13-bb0015cl | |
| Genomsnitt Intel Core i7-1165G7 (115 - 230, n=78) | |
| Lenovo Yoga Slim 7-14ARE | |
| Dell XPS 13 7390 Core i7-10710U | |
| Asus Zenbook S UX393JA | |
| Lenovo Yoga Slim 7 14ARE05 82A20008GE | |
| HP Envy 13-ba0001ng | |
| HP Envy 13-aq0003ng | |
| Huawei MateBook 13 2020 i5 | |
| HP Elite Dragonfly-8MK79EA | |
| HP Envy x360 13-ar0601ng | |
| Blender / v2.79 BMW27 CPU | |
| HP Elite Dragonfly-8MK79EA | |
| HP Envy x360 13-ar0601ng | |
| HP Envy 13-ba0001ng | |
| Huawei MateBook 13 2020 i5 | |
| Asus Zenbook S UX393JA | |
| HP Pavilion 13-bb0015cl | |
| Genomsnitt Intel Core i7-1165G7 (468 - 1138, n=80) | |
| Dell XPS 13 7390 Core i7-10710U | |
| Lenovo Yoga Slim 7 14ARE05 82A20008GE | |
| Lenovo Yoga Slim 7-14ARE | |
| 7-Zip 18.03 / 7z b 4 -mmt1 | |
| HP Pavilion 13-bb0015cl | |
| Genomsnitt Intel Core i7-1165G7 (4478 - 5507, n=80) | |
| HP Envy 13-ba0001ng | |
| Lenovo Yoga Slim 7-14ARE | |
| Asus Zenbook S UX393JA | |
| Dell XPS 13 7390 Core i7-10710U | |
| Lenovo Yoga Slim 7 14ARE05 82A20008GE | |
| Huawei MateBook 13 2020 i5 | |
| HP Elite Dragonfly-8MK79EA | |
| HP Envy x360 13-ar0601ng | |
| 7-Zip 18.03 / 7z b 4 | |
| Lenovo Yoga Slim 7-14ARE | |
| Lenovo Yoga Slim 7 14ARE05 82A20008GE | |
| Dell XPS 13 7390 Core i7-10710U | |
| Genomsnitt Intel Core i7-1165G7 (15347 - 27405, n=80) | |
| HP Pavilion 13-bb0015cl | |
| Asus Zenbook S UX393JA | |
| Huawei MateBook 13 2020 i5 | |
| HP Envy 13-ba0001ng | |
| HP Envy x360 13-ar0601ng | |
| HP Elite Dragonfly-8MK79EA | |
| Geekbench 5.5 / Single-Core | |
| HP Pavilion 13-bb0015cl | |
| Genomsnitt Intel Core i7-1165G7 (1302 - 1595, n=77) | |
| Asus Zenbook S UX393JA | |
| HP Envy 13-ba0001ng | |
| Lenovo Yoga Slim 7-14ARE | |
| Lenovo Yoga Slim 7-14ARE | |
| Lenovo Yoga Slim 7 14ARE05 82A20008GE | |
| Huawei MateBook 13 2020 i5 | |
| Geekbench 5.5 / Multi-Core | |
| Lenovo Yoga Slim 7-14ARE | |
| Lenovo Yoga Slim 7-14ARE | |
| Lenovo Yoga Slim 7 14ARE05 82A20008GE | |
| Genomsnitt Intel Core i7-1165G7 (3078 - 5926, n=77) | |
| HP Pavilion 13-bb0015cl | |
| Asus Zenbook S UX393JA | |
| Huawei MateBook 13 2020 i5 | |
| HP Envy 13-ba0001ng | |
| HWBOT x265 Benchmark v2.2 / 4k Preset | |
| Lenovo Yoga Slim 7-14ARE | |
| Lenovo Yoga Slim 7 14ARE05 82A20008GE | |
| Genomsnitt Intel Core i7-1165G7 (1.39 - 8.47, n=80) | |
| Dell XPS 13 7390 Core i7-10710U | |
| HP Pavilion 13-bb0015cl | |
| Asus Zenbook S UX393JA | |
| Huawei MateBook 13 2020 i5 | |
| HP Envy 13-ba0001ng | |
| HP Elite Dragonfly-8MK79EA | |
| HP Envy x360 13-ar0601ng | |
| LibreOffice / 20 Documents To PDF | |
| Lenovo Yoga Slim 7 14ARE05 82A20008GE | |
| Huawei MateBook 13 2020 i5 | |
| Lenovo Yoga Slim 7-14ARE | |
| HP Envy 13-ba0001ng | |
| Genomsnitt Intel Core i7-1165G7 (21.5 - 88.1, n=78) | |
| Asus Zenbook S UX393JA | |
| HP Pavilion 13-bb0015cl | |
| R Benchmark 2.5 / Overall mean | |
| Huawei MateBook 13 2020 i5 | |
| Asus Zenbook S UX393JA | |
| HP Envy 13-ba0001ng | |
| Lenovo Yoga Slim 7 14ARE05 82A20008GE | |
| Lenovo Yoga Slim 7-14ARE | |
| Genomsnitt Intel Core i7-1165G7 (0.552 - 1.002, n=80) | |
| HP Pavilion 13-bb0015cl | |
* ... mindre är bättre
| PCMark 8 | |
| Home Score Accelerated v2 | |
| Genomsnitt Intel Core i7-1165G7, Intel Iris Xe Graphics G7 96EUs (3769 - 5686, n=17) | |
| Lenovo IdeaPad S540-13ARE-82DL000YGE | |
| HP Envy 13-ba0001ng | |
| Dell XPS 13 9300 i5 FHD | |
| HP Pavilion 13-bb0015cl | |
| Acer Swift 3 SF313-52-71Y7 | |
| Asus VivoBook S13 S330UA-EY034T | |
| Work Score Accelerated v2 | |
| HP Envy 13-ba0001ng | |
| Asus VivoBook S13 S330UA-EY034T | |
| Lenovo IdeaPad S540-13ARE-82DL000YGE | |
| Dell XPS 13 9300 i5 FHD | |
| Acer Swift 3 SF313-52-71Y7 | |
| Genomsnitt Intel Core i7-1165G7, Intel Iris Xe Graphics G7 96EUs (2431 - 3221, n=15) | |
| HP Pavilion 13-bb0015cl | |
| PCMark 8 Home Score Accelerated v2 | 3769 poäng | |
| PCMark 8 Work Score Accelerated v2 | 2734 poäng | |
| PCMark 10 Score | 4917 poäng | |
Hjälp | ||
| DPC Latencies / LatencyMon - interrupt to process latency (max), Web, Youtube, Prime95 | |
| HP Envy 13-ba0001ng | |
| HP Pavilion 13-bb0015cl | |
| Dell XPS 13 9300 i5 FHD | |
| Lenovo IdeaPad S540-13ARE-82DL000YGE | |
* ... mindre är bättre
| HP Pavilion 13-bb0015cl Samsung PM991 MZVLQ512HALU | HP Envy 13-ba0001ng Intel SSD 660p SSDPEKNW512G8 | Asus VivoBook S13 S330UA-EY034T Kingston RBU-SNS8180DS3512GJ | Lenovo IdeaPad S540-13ARE-82DL000YGE WDC PC SN730 SDBPNTY-256G | HP EliteBook x360 1030 G7 Samsung SSD PM981a MZVLB512HBJQ | |
|---|---|---|---|---|---|
| AS SSD | -11% | -64% | 0% | 13% | |
| Seq Read (MB/s) | 1632 | 1587 -3% | 485.5 -70% | 2193 34% | 2036 25% |
| Seq Write (MB/s) | 896 | 709 -21% | 351 -61% | 1797 101% | 1422 59% |
| 4K Read (MB/s) | 44.66 | 52 16% | 30.94 -31% | 45.79 3% | 53.8 20% |
| 4K Write (MB/s) | 128.4 | 144 12% | 61.6 -52% | 140.3 9% | 122 -5% |
| 4K-64 Read (MB/s) | 862 | 322.8 -63% | 323.8 -62% | 721 -16% | 680 -21% |
| 4K-64 Write (MB/s) | 778 | 835 7% | 439.9 -43% | 651 -16% | 1445 86% |
| Access Time Read * (ms) | 0.064 | 0.103 -61% | 0.108 -69% | 0.086 -34% | 0.041 36% |
| Access Time Write * (ms) | 0.081 | 0.045 44% | 0.174 -115% | 0.027 67% | 0.091 -12% |
| Score Read (Points) | 1070 | 533 -50% | 403 -62% | 986 -8% | 937 -12% |
| Score Write (Points) | 996 | 1050 5% | 537 -46% | 971 -3% | 1709 72% |
| Score Total (Points) | 2586 | 1832 -29% | 1150 -56% | 2453 -5% | 3111 20% |
| Copy ISO MB/s (MB/s) | 1283 | 1483 16% | 546 -57% | 1201 -6% | 2109 64% |
| Copy Program MB/s (MB/s) | 806 | 730 -9% | 106.2 -87% | 303 -62% | 103.5 -87% |
| Copy Game MB/s (MB/s) | 1182 | 943 -20% | 151 -87% | 436.4 -63% | 387.8 -67% |
| CrystalDiskMark 5.2 / 6 | 3% | -52% | 38% | 42% | |
| Write 4K (MB/s) | 96.5 | 146.3 52% | 64.5 -33% | 157.4 63% | 122.2 27% |
| Read 4K (MB/s) | 36.81 | 55.7 51% | 24.91 -32% | 48.59 32% | 44.56 21% |
| Write Seq (MB/s) | 1168 | 949 -19% | 453.4 -61% | 2199 88% | 2105 80% |
| Read Seq (MB/s) | 1476 | 1494 1% | 424.9 -71% | 2011 36% | 2346 59% |
| Write 4K Q32T1 (MB/s) | 389.5 | 408.5 5% | 257.8 -34% | 265.3 -32% | 349.6 -10% |
| Read 4K Q32T1 (MB/s) | 347.8 | 304 -13% | 200.4 -42% | 478.8 38% | 340.6 -2% |
| Write Seq Q32T1 (MB/s) | 1398 | 984 -30% | 504 -64% | 2193 57% | 2958 112% |
| Read Seq Q32T1 (MB/s) | 2364 | 1779 -25% | 459.6 -81% | 2870 21% | 3564 51% |
| Write 4K Q8T8 (MB/s) | 284.4 | ||||
| Read 4K Q8T8 (MB/s) | 301.2 | ||||
| Totalt genomsnitt (program/inställningar) | -4% /
-6% | -58% /
-60% | 19% /
14% | 28% /
23% |
* ... mindre är bättre

DiskSpd Read Loop, Queue Depth 8
| 3DMark 11 Performance | 6517 poäng | |
| 3DMark Cloud Gate Standard Score | 14415 poäng | |
| 3DMark Fire Strike Score | 4037 poäng | |
| 3DMark Time Spy Score | 1492 poäng | |
Hjälp | ||
| låg | med. | hög | ultra | |
|---|---|---|---|---|
| GTA V (2015) | 80.1 | 67 | 19.7 | 7.94 |
| The Witcher 3 (2015) | 72.1 | 48.9 | 29.3 | 12.9 |
| Dota 2 Reborn (2015) | 81.5 | 56.6 | 41.5 | 39.3 |
| Final Fantasy XV Benchmark (2018) | 33.8 | 18.3 | 14.5 | |
| X-Plane 11.11 (2018) | 54.9 | 39.8 | 35.9 |
| HP Pavilion 13-bb0015cl Iris Xe G7 96EUs, i7-1165G7, Samsung PM991 MZVLQ512HALU | HP Envy 13-ba0001ng GeForce MX350, i7-10510U, Intel SSD 660p SSDPEKNW512G8 | Dell XPS 13 9300 i5 FHD UHD Graphics G1 (Ice Lake 32 EU), i5-1035G1, Toshiba XG6 KXG60ZNV512G | Asus VivoBook S13 S330UA-EY034T UHD Graphics 620, i5-8550U, Kingston RBU-SNS8180DS3512GJ | Lenovo IdeaPad S540-13ARE-82DL000YGE Vega 6, R5 4600U, WDC PC SN730 SDBPNTY-256G | Acer Swift 3 SF313-52-71Y7 Iris Plus Graphics G7 (Ice Lake 64 EU), i7-1065G7, Intel SSD 660p 1TB SSDPEKNW010T8 | |
|---|---|---|---|---|---|---|
| Noise | 2% | 1% | 1% | 5% | -2% | |
| av / miljö * (dB) | 28 | 25.4 9% | 29.3 -5% | 29 -4% | 25 11% | 30.3 -8% |
| Idle Minimum * (dB) | 28 | 25.4 9% | 29.3 -5% | 29 -4% | 25 11% | 30.3 -8% |
| Idle Average * (dB) | 28 | 25.4 9% | 29.3 -5% | 29 -4% | 25 11% | 30.3 -8% |
| Idle Maximum * (dB) | 28 | 25.4 9% | 29.3 -5% | 29 -4% | 25 11% | 30.3 -8% |
| Load Average * (dB) | 35.2 | 40.6 -15% | 30 15% | 29.9 15% | 32.8 7% | 31.7 10% |
| Witcher 3 ultra * (dB) | 36.8 | |||||
| Load Maximum * (dB) | 36.6 | 39.1 -7% | 32.4 11% | 33.3 9% | 44.5 -22% | 32.7 11% |
* ... mindre är bättre
Ljudnivå
| Låg belastning |
| 28 / 28 / 28 dB(A) |
| Hög belastning |
| 35.2 / 36.6 dB(A) |
 | ||
30 dB tyst 40 dB(A) hörbar 50 dB(A) högt ljud |
||
min: | ||
(+) Den maximala temperaturen på ovansidan är 37.6 °C / 100 F, jämfört med genomsnittet av 35.9 °C / 97 F , allt från 21.4 till 59 °C för klassen Subnotebook.
(-) Botten värms upp till maximalt 45.2 °C / 113 F, jämfört med genomsnittet av 39.2 °C / 103 F
(+) Vid tomgångsbruk är medeltemperaturen för ovansidan 30.1 °C / 86 F, jämfört med enhetsgenomsnittet på 30.8 °C / ### class_avg_f### F.
(+) Handledsstöden och pekplattan är kallare än hudtemperaturen med maximalt 28.2 °C / 82.8 F och är därför svala att ta på.
(±) Medeltemperaturen för handledsstödsområdet på liknande enheter var 28.2 °C / 82.8 F (0 °C / 0 F).
HP Pavilion 13-bb0015cl ljudanalys
(+) | högtalare kan spela relativt högt (82.6 dB)
Bas 100 - 315 Hz
(-) | nästan ingen bas - i genomsnitt 17.1% lägre än medianen
(±) | linjäriteten för basen är genomsnittlig (12% delta till föregående frekvens)
Mellan 400 - 2000 Hz
(+) | balanserad mellan - endast 1% från medianen
(+) | mids är linjära (1.5% delta till föregående frekvens)
Högsta 2 - 16 kHz
(+) | balanserade toppar - endast 2.6% från medianen
(+) | toppar är linjära (6.1% delta till föregående frekvens)
Totalt 100 - 16 000 Hz
(+) | det totala ljudet är linjärt (12% skillnad mot median)
Jämfört med samma klass
» 14% av alla testade enheter i den här klassen var bättre, 4% liknande, 82% sämre
» Den bästa hade ett delta på 5%, genomsnittet var 18%, sämst var 53%
Jämfört med alla testade enheter
» 9% av alla testade enheter var bättre, 2% liknande, 88% sämre
» Den bästa hade ett delta på 4%, genomsnittet var 24%, sämst var 134%
Apple MacBook 12 (Early 2016) 1.1 GHz ljudanalys
(+) | högtalare kan spela relativt högt (83.6 dB)
Bas 100 - 315 Hz
(±) | reducerad bas - i genomsnitt 11.3% lägre än medianen
(±) | linjäriteten för basen är genomsnittlig (14.2% delta till föregående frekvens)
Mellan 400 - 2000 Hz
(+) | balanserad mellan - endast 2.4% från medianen
(+) | mids är linjära (5.5% delta till föregående frekvens)
Högsta 2 - 16 kHz
(+) | balanserade toppar - endast 2% från medianen
(+) | toppar är linjära (4.5% delta till föregående frekvens)
Totalt 100 - 16 000 Hz
(+) | det totala ljudet är linjärt (10.2% skillnad mot median)
Jämfört med samma klass
» 7% av alla testade enheter i den här klassen var bättre, 2% liknande, 91% sämre
» Den bästa hade ett delta på 5%, genomsnittet var 18%, sämst var 53%
Jämfört med alla testade enheter
» 5% av alla testade enheter var bättre, 1% liknande, 94% sämre
» Den bästa hade ett delta på 4%, genomsnittet var 24%, sämst var 134%
| Av/Standby | |
| Låg belastning | |
| Hög belastning |
|
Förklaring:
min: | |
| HP Pavilion 13-bb0015cl i7-1165G7, Iris Xe G7 96EUs, Samsung PM991 MZVLQ512HALU, IPS, 3840x2160, 13.3" | HP Envy 13-ba0001ng i7-10510U, GeForce MX350, Intel SSD 660p SSDPEKNW512G8, IPS, 1920x1080, 13.3" | Dell XPS 13 9300 i5 FHD i5-1035G1, UHD Graphics G1 (Ice Lake 32 EU), Toshiba XG6 KXG60ZNV512G, IPS, 1920x1200, 13.4" | Asus VivoBook S13 S330UA-EY034T i5-8550U, UHD Graphics 620, Kingston RBU-SNS8180DS3512GJ, IPS LED, 1920x1080, 13.3" | Lenovo IdeaPad S540-13ARE-82DL000YGE R5 4600U, Vega 6, WDC PC SN730 SDBPNTY-256G, IPS, 2560x1600, 13.3" | Acer Swift 3 SF313-52-71Y7 i7-1065G7, Iris Plus Graphics G7 (Ice Lake 64 EU), Intel SSD 660p 1TB SSDPEKNW010T8, IPS, 2256x1504, 13.5" | |
|---|---|---|---|---|---|---|
| Power Consumption | 28% | 18% | 15% | -0% | 48% | |
| Idle Minimum * (Watt) | 4.6 | 2 57% | 3.4 26% | 2.8 39% | 1.8 61% | |
| Idle Average * (Watt) | 10.6 | 4 62% | 6 43% | 5 53% | 4.6 57% | |
| Idle Maximum * (Watt) | 11.4 | 6.5 43% | 10.2 11% | 8.3 27% | 9.4 18% | 6.1 46% |
| Load Average * (Watt) | 43.2 | 44 -2% | 36.6 15% | 42.8 1% | 37.6 13% | 27.4 37% |
| Witcher 3 ultra * (Watt) | 39.9 | |||||
| Load Maximum * (Watt) | 46 | 55.6 -21% | 49.3 -7% | 65.8 -43% | 60.7 -32% | 27 41% |
* ... mindre är bättre
| HP Pavilion 13-bb0015cl i7-1165G7, Iris Xe G7 96EUs, 43 Wh | HP Envy 13-ba0001ng i7-10510U, GeForce MX350, 51 Wh | Dell XPS 13 9300 i5 FHD i5-1035G1, UHD Graphics G1 (Ice Lake 32 EU), 52 Wh | Asus VivoBook S13 S330UA-EY034T i5-8550U, UHD Graphics 620, 42 Wh | Lenovo IdeaPad S540-13ARE-82DL000YGE R5 4600U, Vega 6, 56 Wh | Acer Swift 3 SF313-52-71Y7 i7-1065G7, Iris Plus Graphics G7 (Ice Lake 64 EU), 54.5 Wh | |
|---|---|---|---|---|---|---|
| Batteridrifttid | 88% | 161% | 87% | 79% | 101% | |
| Reader / Idle (h) | 10.8 | 15.7 45% | 21 94% | 21.4 98% | ||
| WiFi v1.3 (h) | 4.5 | 10.5 133% | 11.7 160% | 8.4 87% | 11 144% | 10.3 129% |
| Load (h) | 1.3 | 2.4 85% | 3.4 162% | 1.3 0% | 2.3 77% |
För
Emot
Läs den fullständiga versionen av den här recensionen på engelska här.
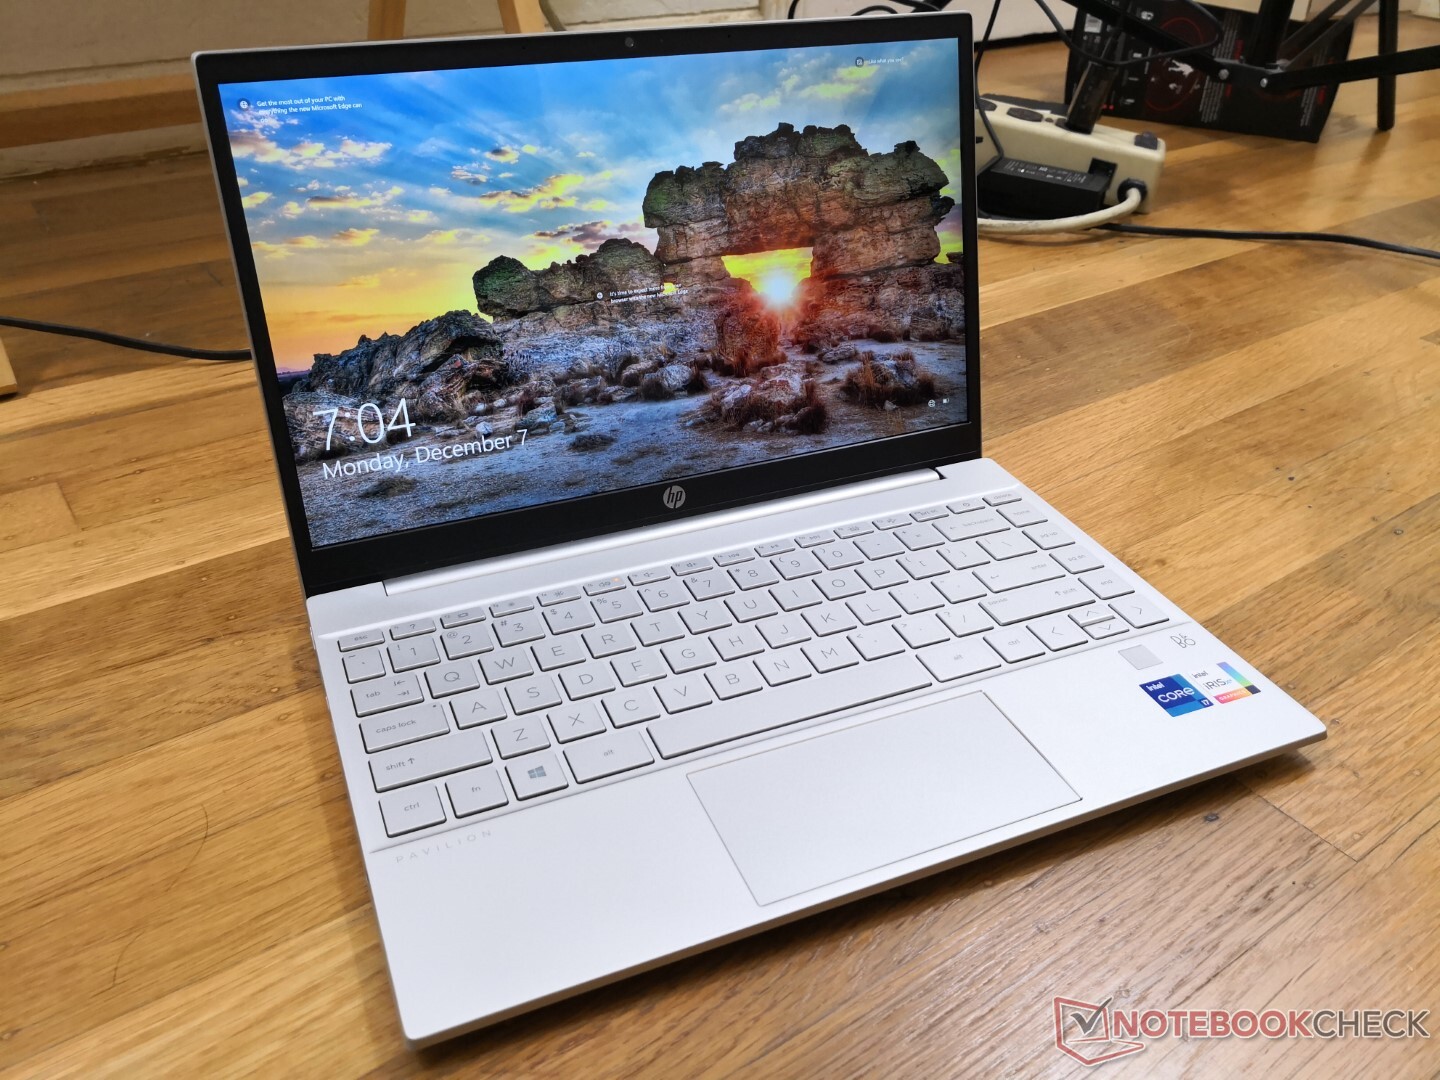
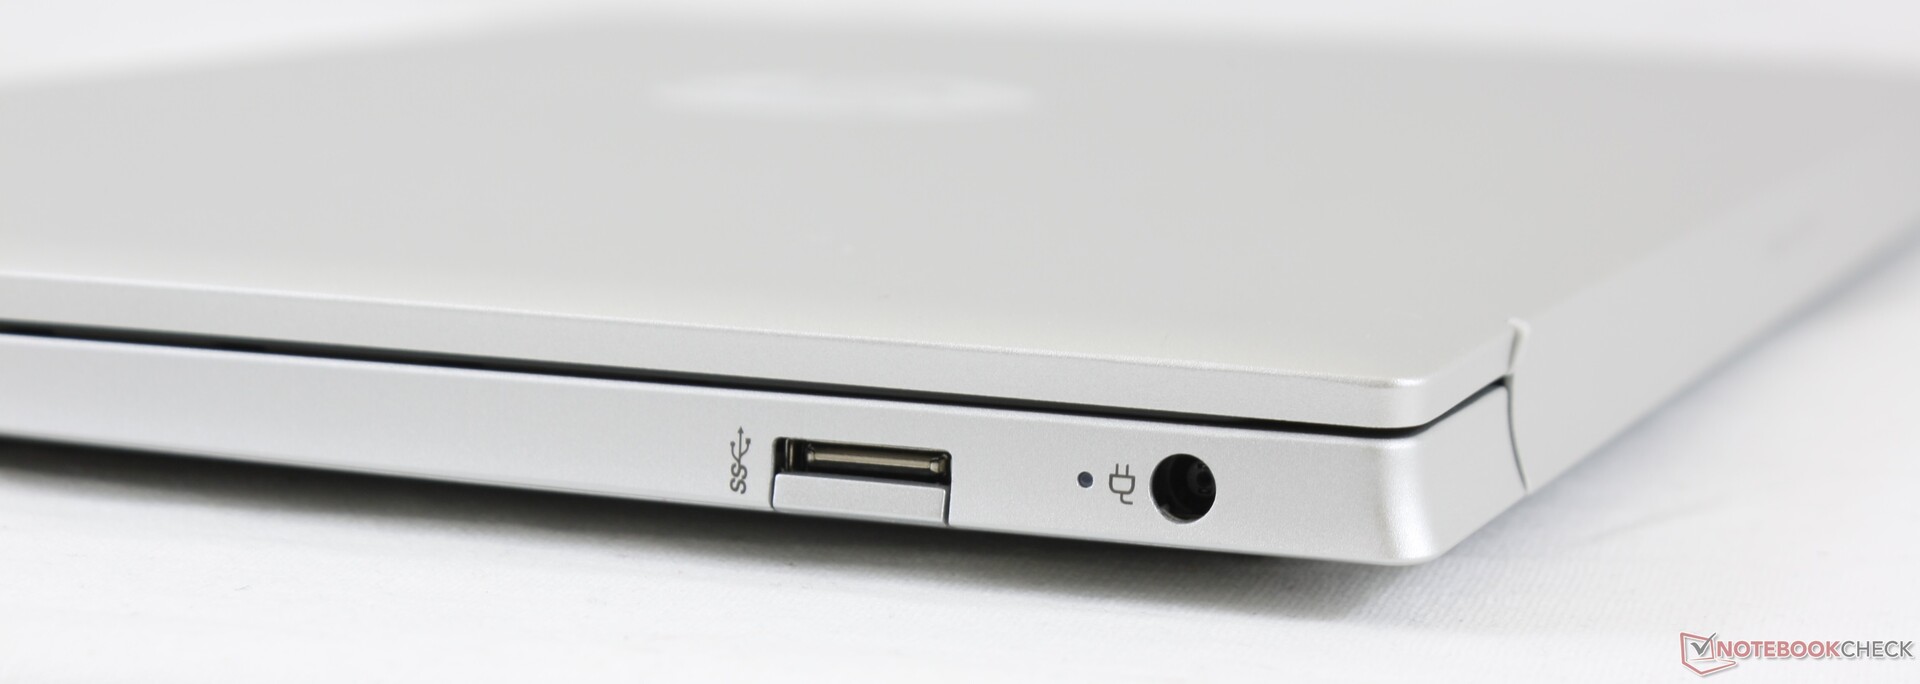
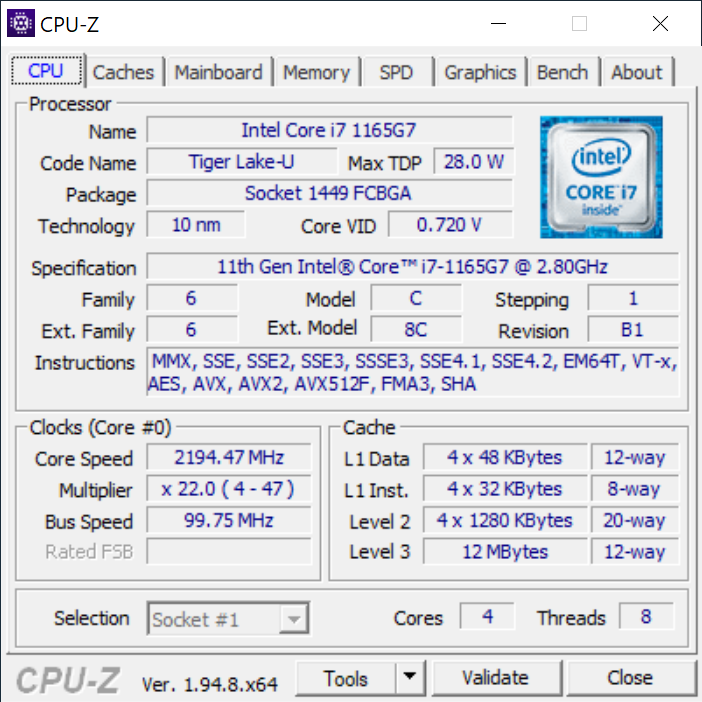
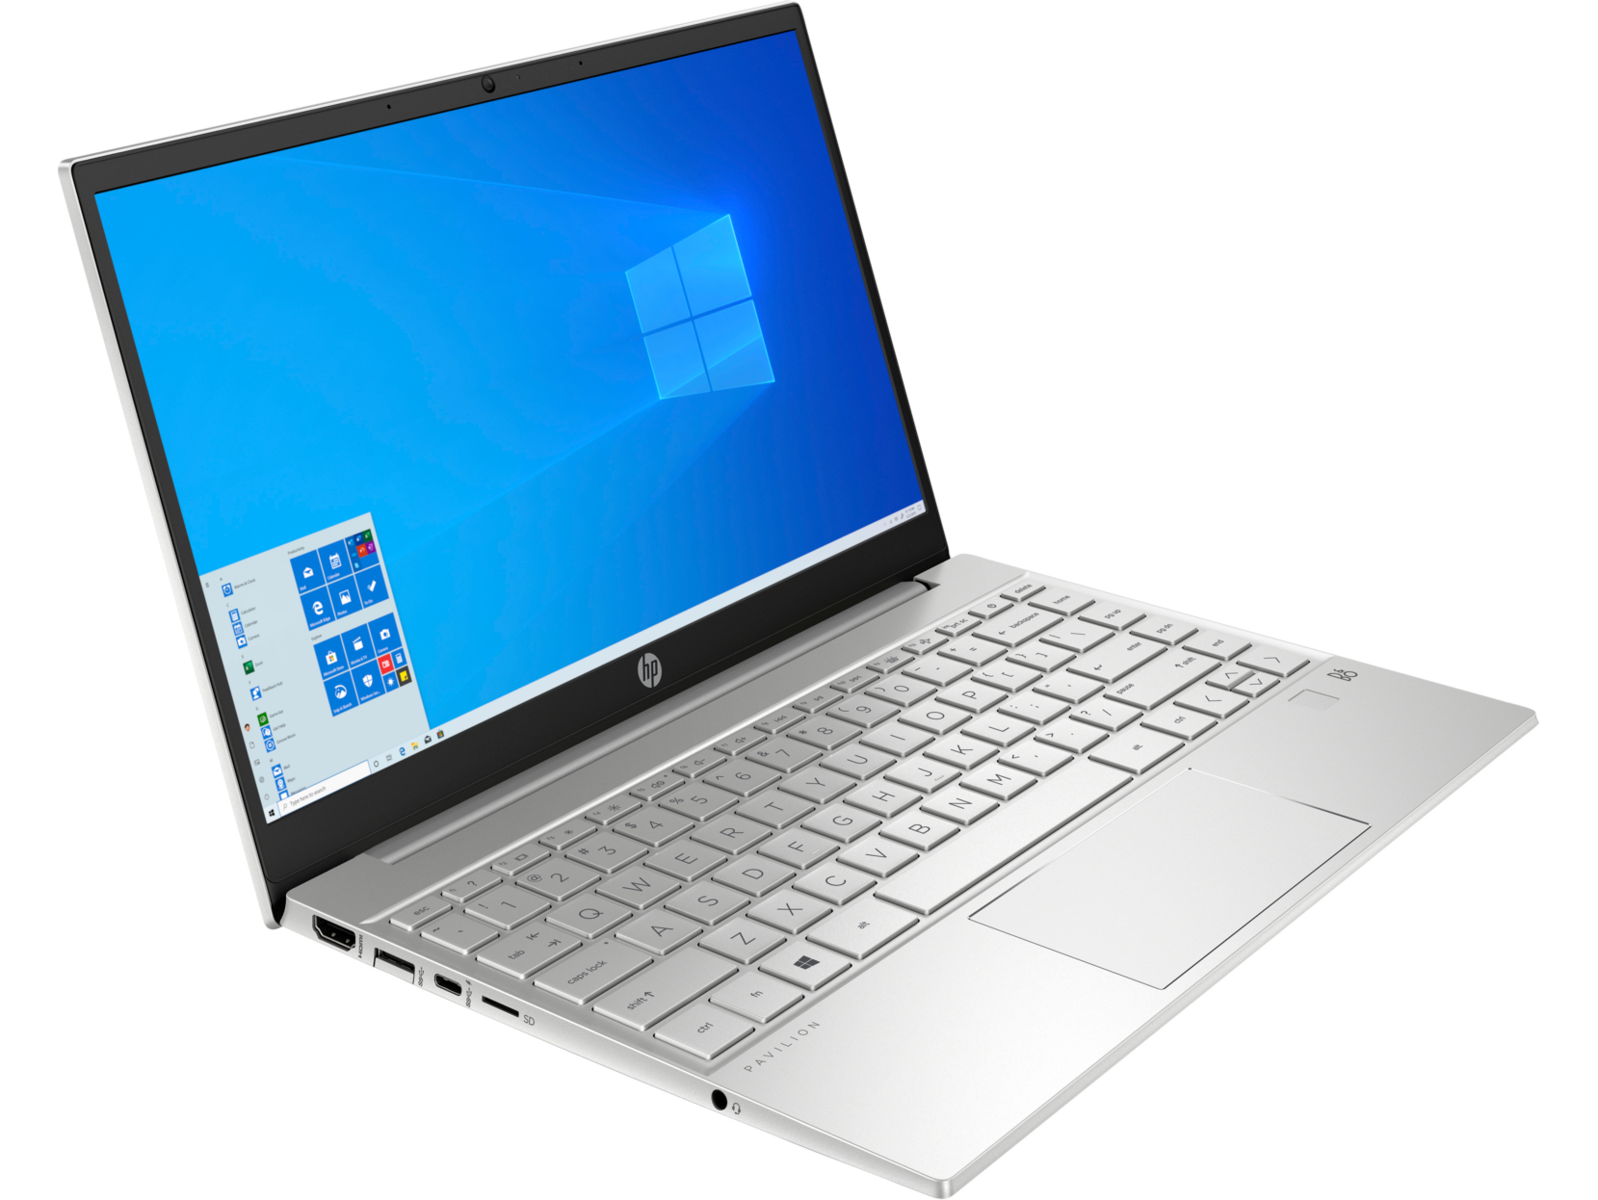
För ca 7.300 kronor kommer Pavilion 13 med en Intel Core i7-1165G7 CPU, integrerad Iris Xe-grafik, en 1080p-skärm, 16 GB RAM och en NVMe SSD-enhet på 512 GB, allt packat i ett gediget hölje som känns betydligt bättre än på modellerna från tidigare generationer. Det största säljargumentet för Pavilion är att den är såpass prisvärd, särskilt med tanke på hur mycket prestanda man får per krona samt att den till och med har skaplig förmåga att spela enklare spel.
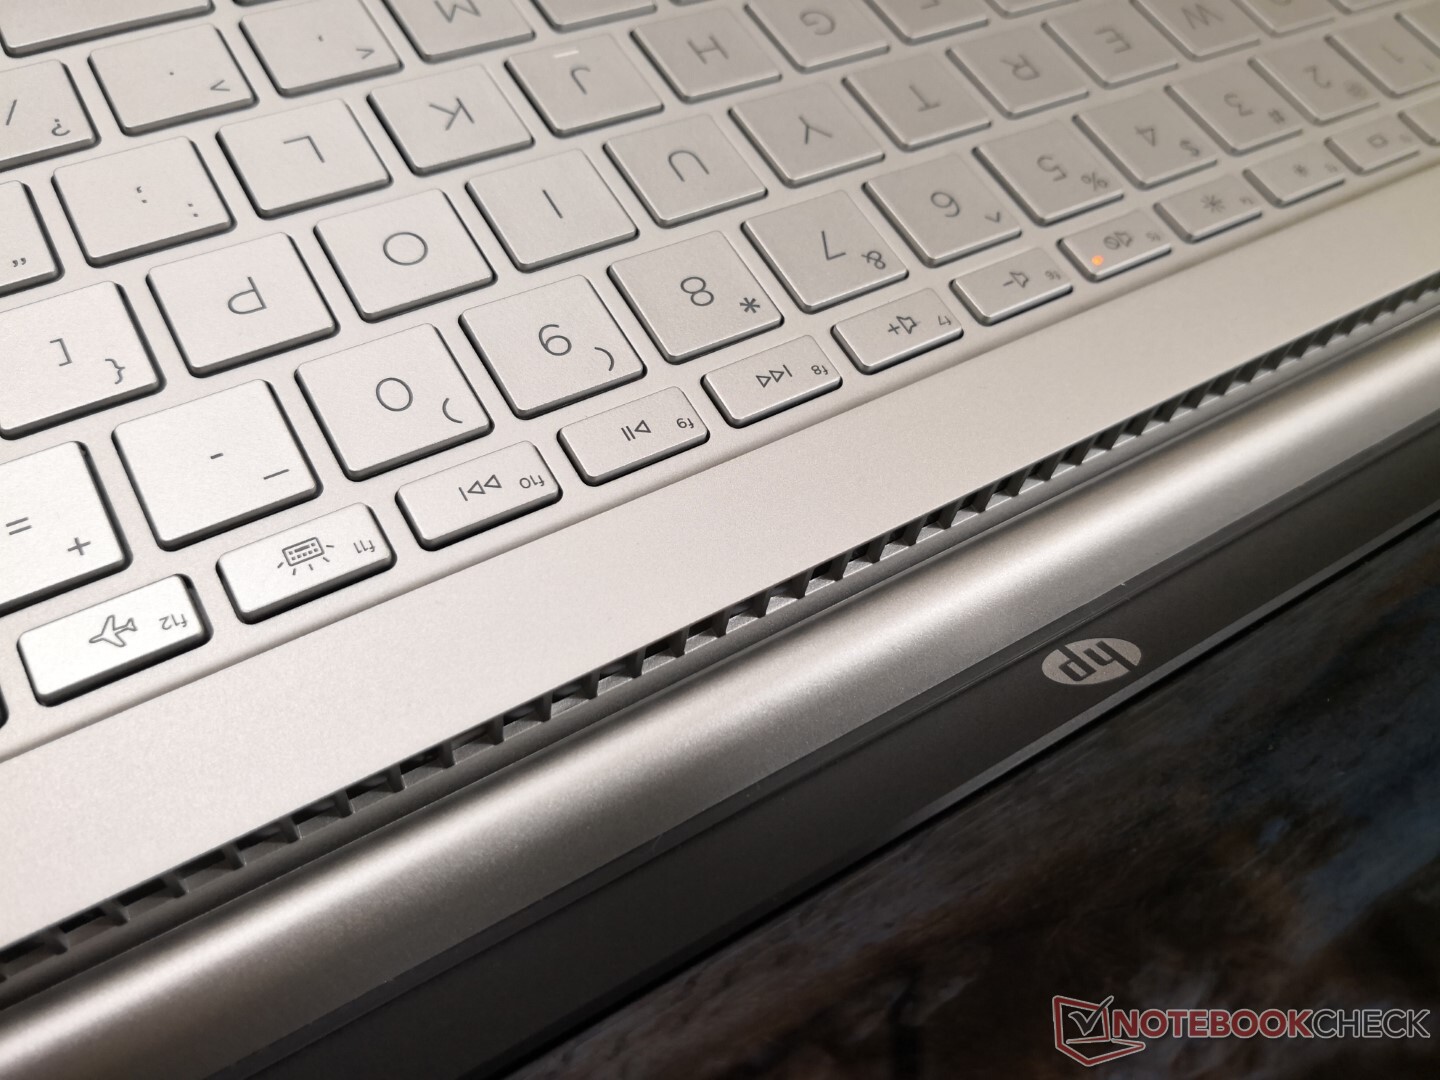
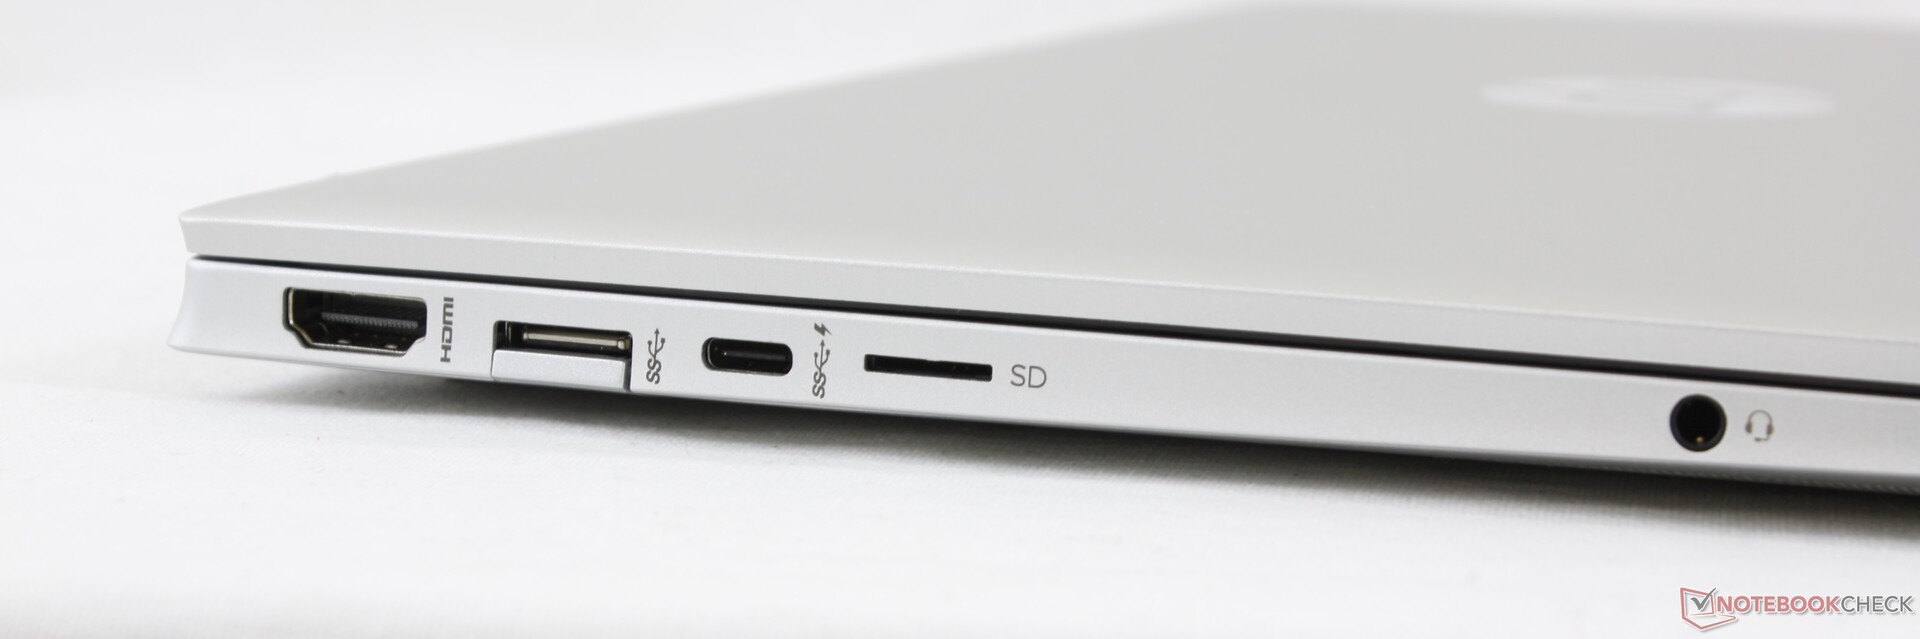
Man får ge upp lång batteritid, Windows Hello, stöd för Thunderbolt och enkel service. Den svampiga Enter-knappen och den svampiga styrplattan tar lite tid att vänja sig vid och vi kan hoppas att HP förbättrar gångjärnen på framtida modeller. Men för en budgetlaptop lyckas 2020 års Pavilion 13 bra på nästan alla viktiga områden och ger ett starkt intryck.
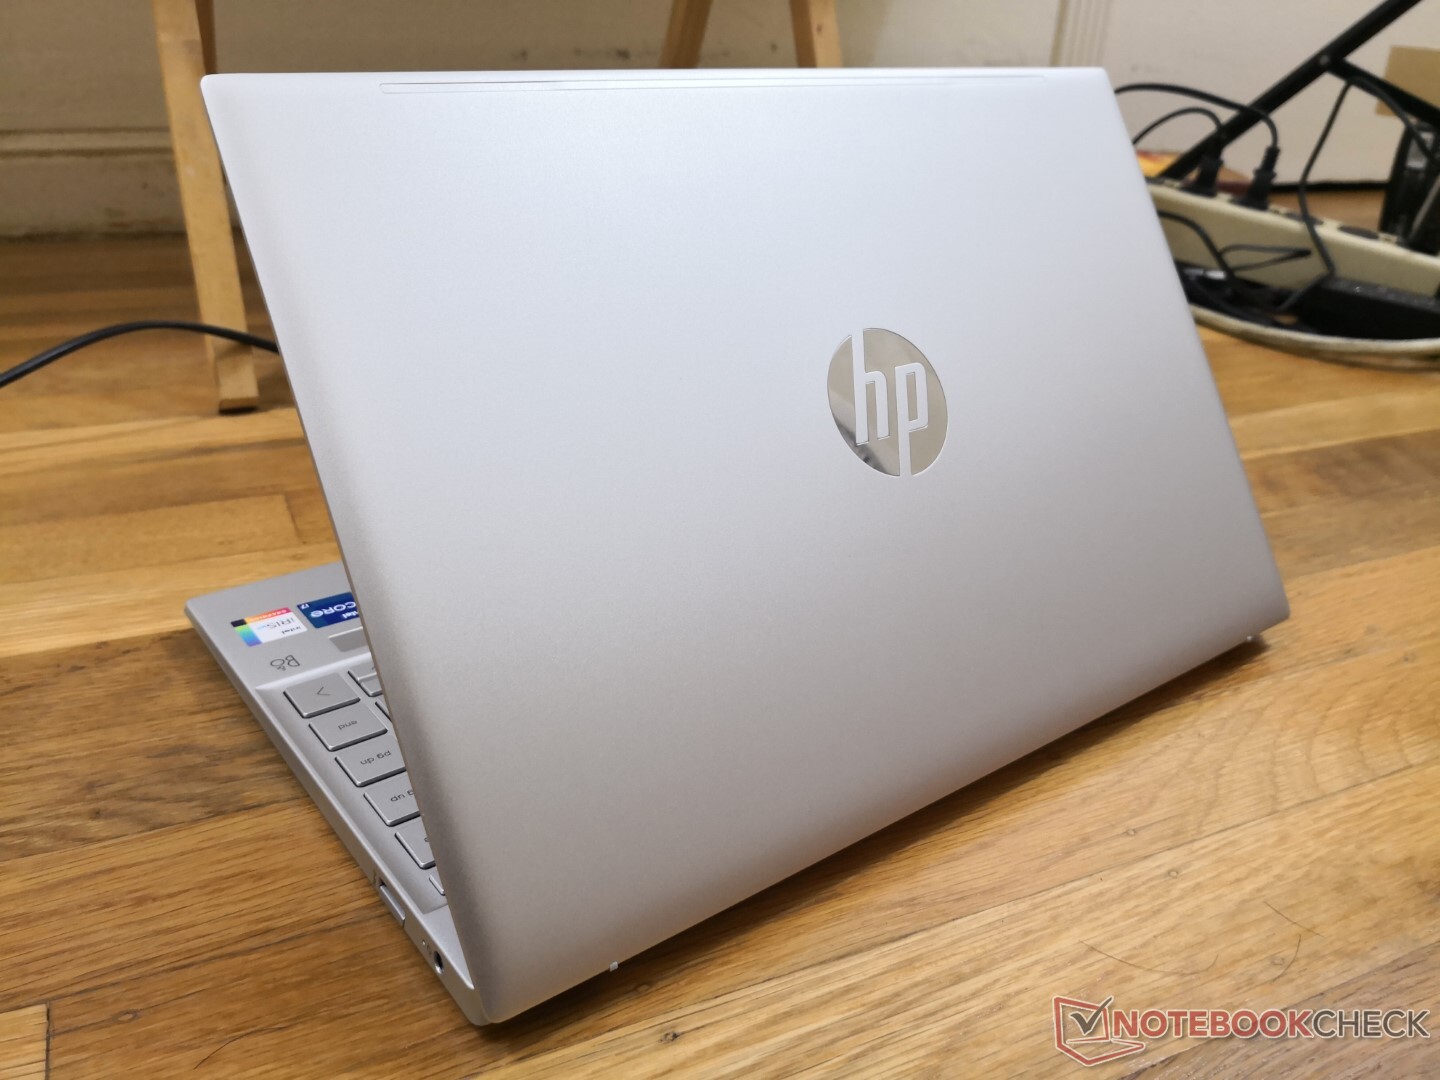
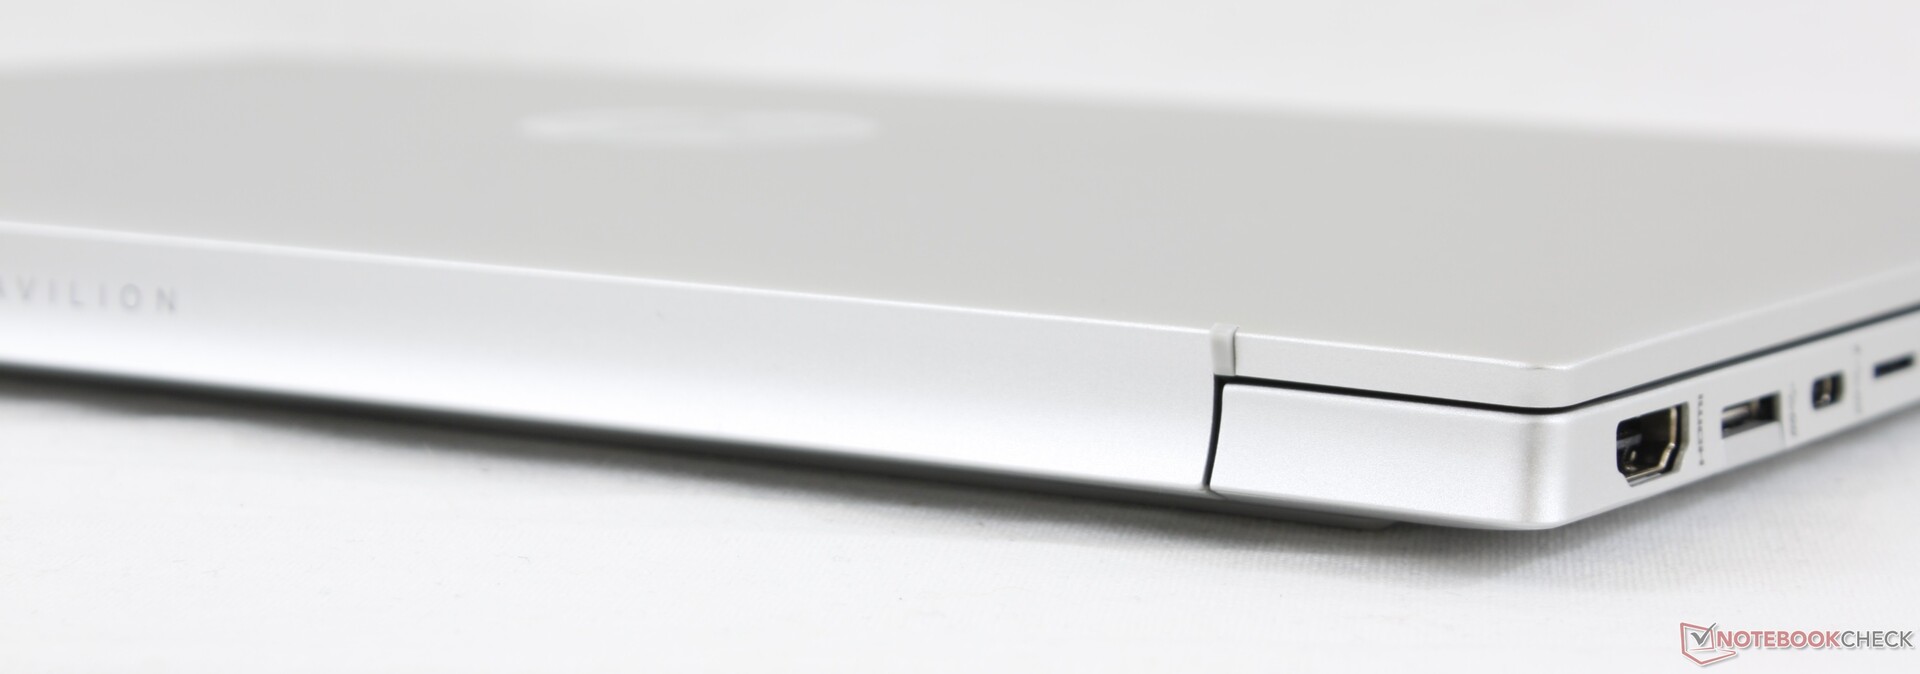
2020 års Pavilion 13 har kraftfulla specifikationer och hög prestanda relativt till priset och storleken. Den Spectre-inspirerade chassidesignen hjälper datorn att kännas och se mer ut som en mittenskiktslaptop utan att den kostar i närheten så mycket.
HP Pavilion 13-bb0015cl
- 12/08/2020 v7 (old)
Allen Ngo
Price comparison
