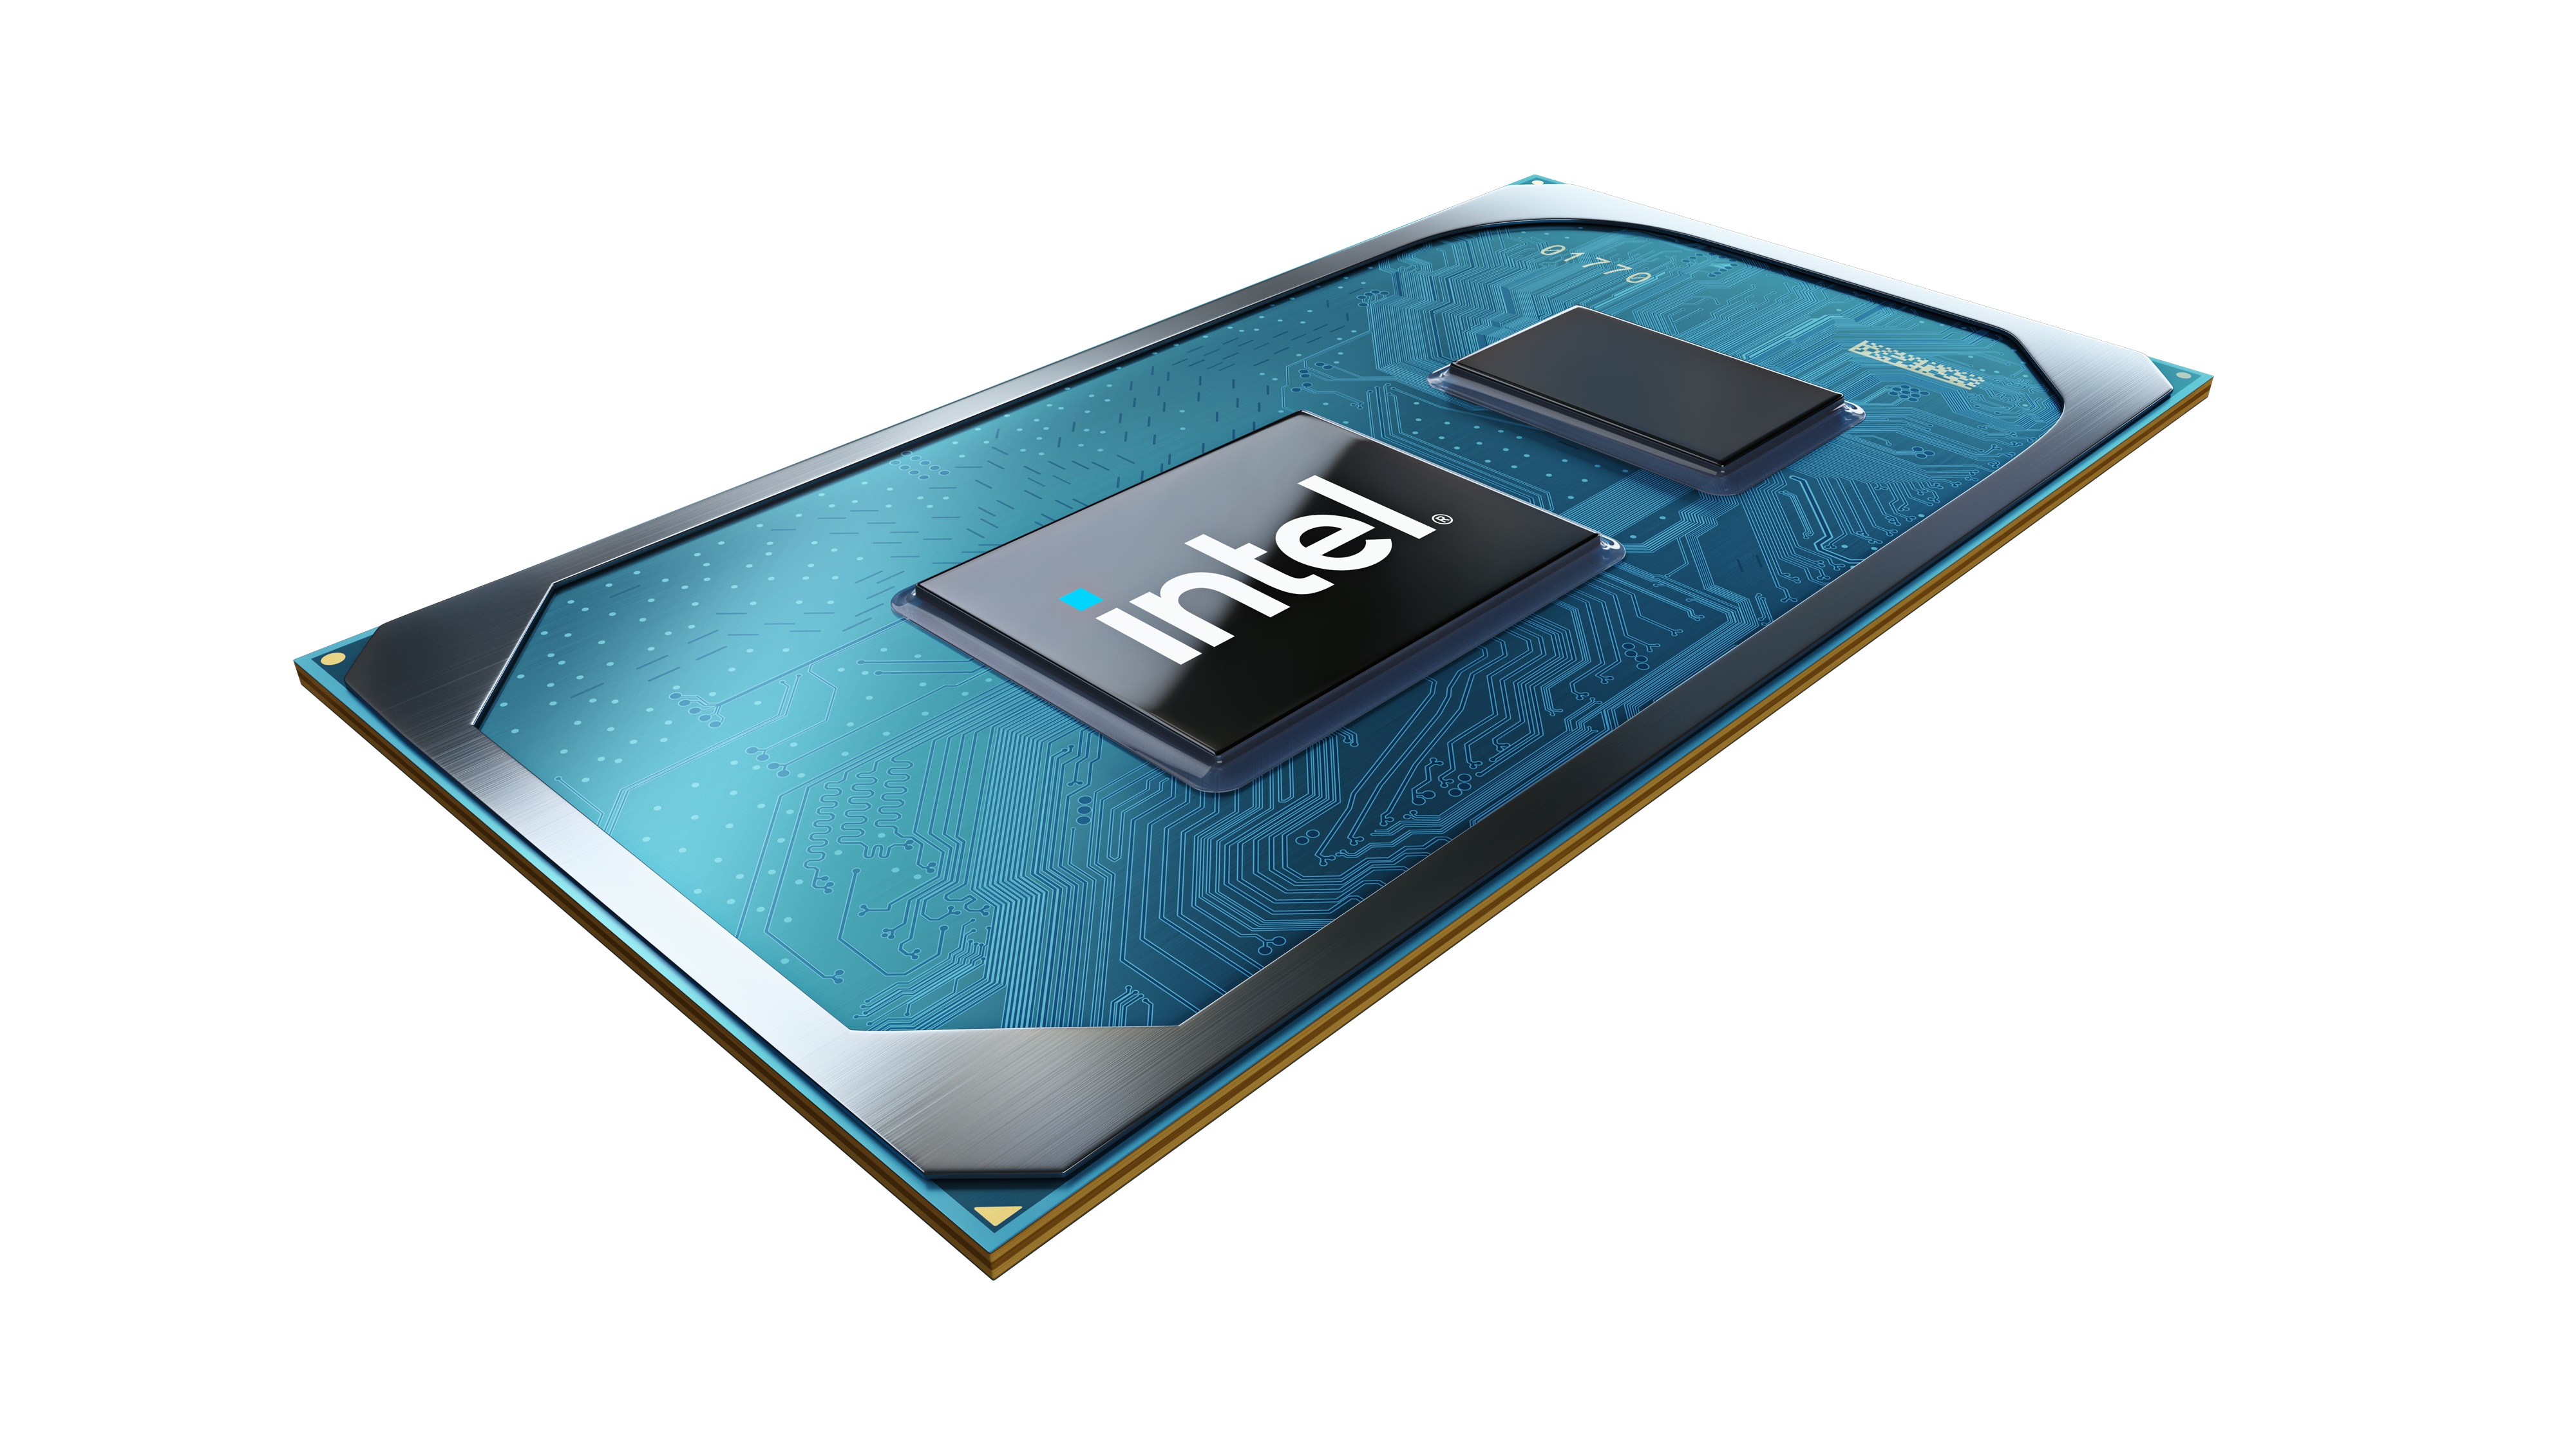
Tester av Intel Core i5-1135G7 processor
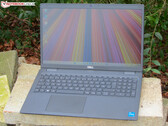
Dell Latitude 3520 i en recension: Bärbar dator för kontoret med Core i5 ger bra körtider
Dells 15,6-tummare har en Tiger Lake -processor, måttliga utsläppsnivåer och bra batteritider. Windows 10 Pro fungerar som operativsystem (en uppgradering till Windows 11 är möjlig).
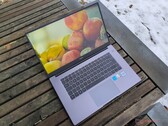
Intel Core i5-1135G7, Iris Xe G7 80EUs, 15.6", 1.8 kgHuawei MateBook D 15 Intel laptop recension: Billig tyst löpare
Huaweis MateBook D 15 Office Laptop övertygar med ett lågt pris på 549 euro, är exceptionellt tyst med hög systemprestanda och erbjuder ett elegant metallhölje med en tillräckligt ljusstark matt IPS-skärm. Tangentbordet och pekplattan i den mycket bärbara 15,6-tums bärbara datorn är också övertygande, men det snabba LPDDR4X RAM-minnet är inte expanderbart.
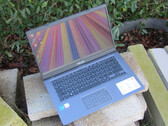
Intel Core i5-1135G7, Iris Xe G7 80EUs, 15.6", 1.5 kgRecension av Asus F415EA: Cool och tyst Core i5 bärbar dator för kontoret
Den 14-tums Asus F415EA har en Tiger Lake -processor, värms knappt upp och låter väldigt lite. Den installerade FHD-skärmen visar sig dock vara ett felaktigt val.
Intel Core i5-1135G7, Iris Xe G7 80EUs, 14", 1.6 kgHuawei MateBook D 14 recension: Tyst kontorsdator med lång batteritid
Den bärbara 14-tumsdatorn från Huawei har en Tiger Lake -processor, ett elegant metallhölje, lite buller och lång batteritid. Vid tiden för vårt test finns hela paketet tillgängligt från 600 euro (~652 dollar).
Intel Core i5-1135G7, Iris Xe G7 80EUs, 14", 1.4 kgAce Magician TK11-A0 recension: Effektiv minidator med Thunderbolt 4 och ytterligare användbara funktioner
Under namnet Ace Magician TK11-A0 erbjuder Minipc Union en modern kontorsdator för många användningsområden. Ta reda på prestandan hos denna Tiger Lake SoC i denna detaljerade recension med många mätningar och benchmarks.
Intel Core i5-1135G7, Iris Xe G7 96EUs, 586 gLenovo IdeaPad 5 Pro 14ITL6: Intel Iris Xe Graphics G7 80EUs, 14.00", 1.4 kg
Test » Recension av Lenovo IdeaPad 5 Pro 14ITL6: en snygg 14-tumslaptop
HP Envy 14-eb0252ng: Intel Iris Xe Graphics G7 80EUs, 14.00", 1.5 kg
Test » Recension av HP Envy 14 - Framgångsrik allt-i-allo
Microsoft Surface Laptop Go 2 Core i5: Intel Iris Xe Graphics G7 80EUs, 12.40", 1.1 kg
Test » Microsoft Surface Laptop Go 2 recension - Kompakt följeslagare med gammal hårdvara
LG Gram 14T90P: Intel Iris Xe Graphics G7 80EUs, 14.00", 1.2 kg
Test » Recension av LG Gram 14T90P - Utmanar Lenovo Yoga och HP Spectre
Dell Latitude 5320-TM4V2: Intel Iris Xe Graphics G7 80EUs, 13.30", 1.3 kg
Test » Recension av Latitude 5320 - Dell förstör musersättningen
Samsung Galaxy Book Pro 360 15 NP950QDB-KC3DE: Intel Iris Xe Graphics G7 80EUs, 15.60", 1.4 kg
Test » Recension av Samsung Galaxy Book Pro 360 15-tum - Större fotavtryck, mer kraft
Acer Extensa 15 EX215-54-5103: Intel Iris Xe Graphics G7 80EUs, 15.60", 1.9 kg
Test » Recension av Acer Extensa 15 EX215-54 - Billig Core i5-kraft
Acer Swift 3 SF314-511-54ZK: Intel Iris Xe Graphics G7 80EUs, 14.00", 1.2 kg
Test » Recension av Acer Swift 3 SF314 - Klarar testet med bravur
Acer TravelMate P4 TMP414-51-59MR: Intel Iris Xe Graphics G7 80EUs, 14.00", 1.4 kg
Test » Recension av Acer TravelMate P4 - Kontorsfokuserad långdistanslöpare med Thunderbolt 4
Dell Latitude 14 5420-D2G5W: Intel Iris Xe Graphics G7 80EUs, 14.00", 1.5 kg
Test » Recension av Dell Latitude 14 5420 - Väldigt nära att ta hem priset för bästa kontorslaptop
Dell Inspiron 15 3000 3511: Intel Iris Xe Graphics G7 80EUs, 15.60", 1.7 kg
Test » Recension av Dell Inspiron 15 3000 3511 - Att göra billigare bättre
HP Pavilion 14-dv0357ng: Intel Iris Xe Graphics G7 80EUs, 14.00", 1.4 kg
Test » Recension: HP Pavilion 14 Laptop - En väl genomtänkt enhet med ett attraktivt yttre
Beelink GTI 11: Intel Iris Xe Graphics G7 80EUs, 0.6 kg
Test » Vårt bästa alternativ till Intel NUC 11 - Recension av Beelink GTI 11 mini PC
Lenovo ThinkPad L14 G2-20X1003WGE: Intel Iris Xe Graphics G7 80EUs, 14.00", 1.7 kg
Test » Recension av Lenovo ThinkPad L14 G2: Bra även med Intel
Asus ExpertBook B1 B1400CEAE, i5-1135G7: Intel Iris Xe Graphics G7 80EUs, 14.00", 1.5 kg
Test » Asus ExpertBook B1 B1400 i en recension: Liten, lätt och prisvärd
Asus ExpertBook B1 B1500CEAE, i5-1135G7: Intel Iris Xe Graphics G7 80EUs, 15.60", 1.7 kg
Test » Recension: Asus ExpertBook B1 B1500 - Företagslaptop med många portar
Asus ExpertBook B5 Flip B5302FEA: Intel Iris Xe Graphics G7 80EUs, 13.30", 1.3 kg
Test » Recension av Asus ExpertBook B5 Flip: Kompakt och uthållig omvandlingsbar perfekt för universitet, kontor och soffa
Lenovo ThinkPad X1 Carbon G9-20XW0089GE: Intel Iris Xe Graphics G7 80EUs, 14.00", 1.2 kg
Test » Recension av den bärbara datorn Lenovo ThinkPad X1 Carbon G9: ePrivacy-skärmen är fortfarande problematisk
HP Pavilion x360 14-dy0157ng: Intel Iris Xe Graphics G7 80EUs, 14.00", 1.5 kg
Test » Test: HP Pavilion x360 14 (2021) – 2-i-1 laptop med stöd för penna och Power Delivery (Sammanfattning)
HP Envy 14-eb0010nr: NVIDIA GeForce GTX 1650 Ti Max-Q, 14.00", 1.6 kg
Test » Test: 2021 HP Envy 14 - Tiger Lake, 16:10 och GeForce GTX 1650 Ti Max-Q i samma enhet (Sammanfattning)
GPD Win 3: Intel Iris Xe Graphics G7 80EUs, 5.50", 0.6 kg
Test » Test: GPD Win 3 - En inofficiell Microsoft Switch (Sammanfattning)
Dell Inspiron 15 7506 2-in-1 P97F: Intel Iris Xe Graphics G7 80EUs, 15.60", 1.8 kg
Test » Test: Dell Inspiron 15 7506 2-in-1 - Enkel att använda, enkel att skaffa (Sammanfattning)
Lenovo Yoga 9i 14ITL5: Intel Iris Xe Graphics G7 80EUs, 14.00", 1.4 kg
Test » Test: Lenovo Yoga 9i 14 - Tvilling till Yoga C940 (Sammanfattning)
Lenovo Yoga 7 14ITL5: Intel Iris Xe Graphics G7 80EUs, 14.00", 1.5 kg
Test » Test: Lenovo Yoga 7i 14 tum Tiger Lake - Debut för Core i5-1135G7 (Sammanfattning)
Asus ZenBook Flip 14 UP5401EA, i5-1135G7: Intel Iris Xe Graphics G7 80EUs, 14.00", 1.4 kg
Externt test » Asus ZenBook Flip 14 UP5401EA, i5-1135G7
Honor MagicBook X 15 2022, i5-1135G7: Intel Iris Xe Graphics G7 80EUs, 15.60", 1.6 kg
Externt test » Honor MagicBook X 15 2022, i5-1135G7
Acer Extensa 15 EX215-54-57VY: Intel Iris Xe Graphics G7 80EUs, 15.60", 1.9 kg
Externt test » Acer Extensa 15 EX215-54-57VY
Asus VivoBook 15 F1500EA, i5-1135G7: Intel Iris Xe Graphics G7 80EUs, 15.60", 1.8 kg
Externt test » Asus VivoBook 15 F1500EA, i5-1135G7
Asus Vivobook 14 F1400EA-EB1837W: Intel Iris Xe Graphics G7 80EUs, 14.00", 1.6 kg
Externt test » Asus Vivobook 14 F1400EA-EB1837W
Dell Vostro 15 3500, i5-1135G7 iGPU: Intel Iris Xe Graphics G7 80EUs, 15.60", 1.8 kg
Externt test » Dell Vostro 15 3500, i5-1135G7 iGPU
Asus Vivobook 14 F1400EA-EB1517W: Intel Iris Xe Graphics G7 80EUs, 14.00", 1.6 kg
Externt test » Asus Vivobook 14 F1400EA-EB1517W
Asus Vivobook Flip 14 TP470EA-EC384W: Intel Iris Xe Graphics G7 80EUs, 14.00", 1.5 kg
Externt test » Asus Vivobook Flip 14 TP470EA-EC384W
Acer TravelMate P2 TMP214-53-53VY: Intel Iris Xe Graphics G7 80EUs, 14.00", 1.6 kg
Externt test » Acer TravelMate P2 TMP214-53-53VY
Fujitsu CH 13 4ZR1C22927: Intel Iris Xe Graphics G7 80EUs, 13.30", 1 kg
Externt test » Fujitsu CH 13 4ZR1C22927
Asus ExpertBook P1 P1512CEA-EJ0213: Intel Iris Xe Graphics G7 80EUs, 15.60", 1.8 kg
Externt test » Asus ExpertBook P1 P1512CEA-EJ0213
Asus Vivobook 14 F1400EA-EB1648 : Intel Iris Xe Graphics G7 80EUs, 14.00", 1.6 kg
Externt test » Asus Vivobook 14 F1400EA-EB1648
Asus VivoBook 15 F515EA-EJ2079W: Intel Iris Xe Graphics G7 80EUs, 15.60", 1.8 kg
Externt test » Asus VivoBook 15 F515EA-EJ2079W
Monster Huma H5 V3.1: Intel Iris Xe Graphics G7 80EUs, 15.60", 1.7 kg
Externt test » Monster Huma H5 V3.1
Asus VivoBook 15 K513EA-L12891W: Intel Iris Xe Graphics G7 80EUs, 15.60", 1.8 kg
Externt test » Asus VivoBook 15 K513EA-L12891W
Asus Vivobook 14 K413EA-EB1156T: Intel Iris Xe Graphics G7 80EUs, 14.00", 1.4 kg
Externt test » Asus Vivobook 14 K413EA-EB1156T
Lenovo ThinkPad E14 Gen2-20TA00HKSP: Intel Iris Xe Graphics G7 80EUs, 14.00", 1.6 kg
Externt test » Lenovo ThinkPad E14 Gen2-20TA00HKSP
Acer Aspire 3 A315-58-54JJ: Intel Iris Xe Graphics G7 80EUs, 15.60", 1.7 kg
Externt test » Acer Aspire 3 A315-58-54JJ
HP 15s-fq2708nd: Intel Iris Xe Graphics G7 80EUs, 15.60", 1.7 kg
Externt test » HP 15s-fq2708nd
Acer Aspire 3 A315-58-57F6: Intel Iris Xe Graphics G7 80EUs, 15.60", 1.7 kg
Externt test » Acer Aspire 3 A315-58-57F6
Asus VivoBook 14 X415EA-EB1703W: Intel Iris Xe Graphics G7 80EUs, 14.10", 1.6 kg
Externt test » Asus VivoBook 14 X415EA-EB1703W
Intel NUC M15 LAPBC510: Intel Iris Xe Graphics G7 80EUs, 15.60", 1.7 kg
Externt test » Intel NUC M15 LAPBC510
Asus Vivobook 14 F415EA-EK1255W: Intel Iris Xe Graphics G7 80EUs, 14.00", 1.6 kg
Externt test » Asus Vivobook 14 F415EA-EK1255W
HP Envy 13-ba1009ns: Intel Iris Xe Graphics G7 80EUs, 13.30", 1.3 kg
Externt test » HP Envy 13-ba1009ns
Lenovo ThinkPad P14s G2 20VX00A7GE: NVIDIA T500 Laptop GPU, 14.00", 1.4 kg
Externt test » Lenovo ThinkPad P14s G2 20VX00A7GE
Lenovo IdeaPad 5 Pro 14ITL6: Intel Iris Xe Graphics G7 80EUs, 14.00", 1.4 kg
Externt test » Lenovo IdeaPad 5 Pro 14ITL6
Asus VivoBook 15 X515EA-BQ943T: Intel Iris Xe Graphics G7 80EUs, 15.60", 1.8 kg
Externt test » Asus VivoBook 15 X515EA-BQ943T
Lenovo IdeaPad 3 14ITL6-9QSP: Intel Iris Xe Graphics G7 80EUs, 14.10", 1.4 kg
Externt test » Lenovo IdeaPad 3 14ITL6-9QSP
Lenovo V14 G2 ITL-82KA001KSP: Intel Iris Xe Graphics G7 80EUs, 14.00", 1.6 kg
Externt test » Lenovo V14 G2 ITL-82KA001KSP
Asus VivoBook 14 K413EA-EB362T: Intel Iris Xe Graphics G7 80EUs, 14.00", 1.4 kg
Externt test » Asus VivoBook 14 K413EA-EB362T
HP Pavilion x360 14-dy0018ns: Intel Iris Xe Graphics G7 80EUs, 14.00", 1.8 kg
Externt test » HP Pavilion x360 14-dy0018ns
HP Envy x360 13-bd0018na: Intel Iris Xe Graphics G7 80EUs, 13.30", 1.3 kg
Externt test » HP Envy x360 13-bd0018na
LG Gram 14T90P: Intel Iris Xe Graphics G7 80EUs, 14.00", 1.2 kg
Externt test » LG Gram 14T90P
Microsoft Surface Laptop Go 2 Core i5: Intel Iris Xe Graphics G7 80EUs, 12.40", 1.1 kg
Externt test » Microsoft Surface Laptop Go 2 Core i5
Dynabook Satellite Pro C40-J-11I: Intel Iris Xe Graphics G7 80EUs, 14.00", 1.6 kg
Externt test » Dynabook Satellite Pro C40-J-11I
Acer TravelMate P4 TMP414-51-59MR: Intel Iris Xe Graphics G7 80EUs, 14.00", 1.4 kg
Externt test » Acer TravelMate P4 TMP414-51-59MR
Asus Expertbook B5 B5302C, i5-1135G7: Intel Iris Xe Graphics G7 80EUs, 13.30", 1.2 kg
Externt test » Asus Expertbook B5 B5302C, i5-1135G7
Acer Swift 3 SF314-59-50MZ: Intel Iris Xe Graphics G7 80EUs, 14.00", 1.2 kg
Externt test » Acer Swift 3 SF314-59-50MZ
Asus Vivobook 14 X413EA-EK1338T: Intel Iris Xe Graphics G7 80EUs, 14.00", 1.4 kg
Externt test » Asus Vivobook 14 X413EA-EK1338T
Asus Vivobook 14 F415EA-EK1005W: Intel Iris Xe Graphics G7 80EUs, 14.00", 1.6 kg
Externt test » Asus Vivobook 14 F415EA-EK1005W
Asus VivoBook 14 K413EA-EK231T: Intel Iris Xe Graphics G7 80EUs, 14.00", 1.4 kg
Externt test » Asus VivoBook 14 K413EA-EK231T
Acer Aspire 5 A514-54-501Z: Intel Iris Xe Graphics G7 80EUs, 14.00", 1.6 kg
Externt test » Acer Aspire 5 A514-54-501Z
Asus VivoBook 15 K513EA-AB54: Intel Iris Xe Graphics G7 80EUs, 15.60", 1.8 kg
Externt test » Asus VivoBook 15 K513EA-AB54
Dell Vostro 13 5301-V078G: Intel Iris Xe Graphics G7 80EUs, 13.30", 1.1 kg
Externt test » Dell Vostro 13 5301-V078G
Acer Chromebook Spin 713 CP713-3W-5102: NVIDIA GeForce MX330, 13.50", 1.4 kg
Externt test » Acer Chromebook Spin 713 CP713-3W-5102
Lenovo ThinkPad L15 G2-20X300P0GE: Intel Iris Xe Graphics G7 80EUs, 15.60", 2 kg
Externt test » Lenovo ThinkPad L15 G2-20X300P0GE
Acer Aspire 5 A517-52G-59GP: NVIDIA GeForce MX450, 17.30", 2.6 kg
Externt test » Acer Aspire 5 A517-52G-59GP
Acer Aspire 3 A317-53-58F1: Intel Iris Xe Graphics G7 80EUs, 17.30", 2.6 kg
Externt test » Acer Aspire 3 A317-53-58F1
HP ZBook Firefly 14 G8-2C9Q8EA: Intel Iris Xe Graphics G7 80EUs, 14.00", 1.4 kg
Externt test » HP ZBook Firefly 14 G8-2C9Q8EA
Asus ExpertBook B3 Flip B3402FEA-EC0048R: Intel Iris Xe Graphics G7 80EUs, 14.00", 1.6 kg
Externt test » Asus ExpertBook B3 Flip B3402FEA-EC0048R
Acer Swift 3 SF314-511-54ZK: Intel Iris Xe Graphics G7 80EUs, 14.00", 1.2 kg
Externt test » Acer Swift 3 SF314-511-54ZK
Asus VivoBook 15 X513EA-BQ003T: Intel Iris Xe Graphics G7 80EUs, 15.60", 1.8 kg
Externt test » Asus VivoBook 15 X513EA-BQ003T
MSI Modern 15 A11MU-619XES: Intel Iris Xe Graphics G7 80EUs, 15.60", 1.6 kg
Externt test » MSI Modern 15 A11MU-619XES
HP Envy x360 13-bd0055nf: Intel Iris Xe Graphics G7 80EUs, 13.30", 1.3 kg
Externt test » HP Envy x360 13-bd0055nf
HP 15s-fq2079ns: Intel Iris Xe Graphics G7 80EUs, 15.60", 1.7 kg
Externt test » HP 15s-fq2079ns
Medion Akoya S15449-MD62127: Intel Iris Xe Graphics G7 80EUs, 15.60", 1.8 kg
Externt test » Medion Akoya S15449-MD62127
Asus Chromebook Flip CX5 CX5500FEA-E60030: Intel Iris Xe Graphics G7 80EUs, 15.60", 2 kg
Externt test » Asus Chromebook Flip CX5 CX5500FEA-E60030
HP 17-cn0025nr: Intel Iris Xe Graphics G7 80EUs, 17.30", 2.1 kg
Externt test » HP 17-cn0025nr
HP 15s-fq2016sa: Intel Iris Xe Graphics G7 80EUs, 15.60", 1.7 kg
Externt test » HP 15s-fq2016sa
Dynabook Tecra A50-J-18Z: Intel Iris Xe Graphics G7 80EUs, 15.60", 1.7 kg
Externt test » Dynabook Tecra A50-J-18Z
Lenovo ThinkPad X1 Yoga G6-20XY003GGE: Intel Iris Xe Graphics G7 80EUs, 14.00", 1.4 kg
Externt test » Lenovo ThinkPad X1 Yoga G6-20XY003GGE
HP 470 G8-3S8S1EA: Intel Iris Xe Graphics G7 80EUs, 17.30", 2.1 kg
Externt test » HP 470 G8-3S8S1EA
HP ProBook 430 G8-2W1H2EA: Intel Iris Xe Graphics G7 80EUs, 13.30", 1.4 kg
Externt test » HP ProBook 430 G8-2W1H2EA
Lenovo V17 G2 ITL-82NX00EBMH: Intel Iris Xe Graphics G7 80EUs, 17.30", 2.2 kg
Externt test » Lenovo V17 G2 ITL-82NX00EBMH
Asus VivoBook 15 K513EA-L11430T: Intel Iris Xe Graphics G7 80EUs, 15.60", 1.7 kg
Externt test » Asus VivoBook 15 K513EA-L11430T
MSI Modern 14 B11SB, i5-1135G7 MX450: NVIDIA GeForce MX450, 14.00", 1.3 kg
Externt test » MSI Modern 14 B11SB, i5-1135G7 MX450
Medion Akoya E16401-MD62290: Intel Iris Xe Graphics G7 80EUs, 16.10", 2 kg
Externt test » Medion Akoya E16401-MD62290
Lenovo ThinkBook 15 Gen2 ITL: Intel Iris Xe Graphics G7 80EUs, 15.60", 1.8 kg
Externt test » Lenovo ThinkBook 15 Gen2 ITL
Asus ExpertBook B1 B1500CEAE, i5-1135G7: Intel Iris Xe Graphics G7 80EUs, 15.60", 1.7 kg
Externt test » Asus ExpertBook B1 B1500CEAE, i5-1135G7
Asus VivoBook S15 S533EA-L11012T: Intel Iris Xe Graphics G7 80EUs, 15.60", 1.8 kg
Externt test » Asus VivoBook S15 S533EA-L11012T
Asus Zenbook 14X UX5400EG, i5-1135G7: NVIDIA GeForce MX450, 14.00", 1.4 kg
Externt test » Asus Zenbook 14X UX5400EG, i5-1135G7
Asus VivoBook Flip 14 TP470EA-EC084T: Intel Iris Xe Graphics G7 80EUs, 14.00", 1.5 kg
Externt test » Asus VivoBook Flip 14 TP470EA-EC084T
Medion Akoya S15449-MD62034: Intel Iris Xe Graphics G7 80EUs, 15.60", 1.9 kg
Externt test » Medion Akoya S15449-MD62034
HP Chromebook x360 14c-cc0025no: Intel Iris Xe Graphics G7 80EUs, 14.00", 1.7 kg
Externt test » HP Chromebook x360 14c-cc0025no
Acer Chromebook Spin 713 CP713-3W-503Z: Intel Iris Xe Graphics G7 80EUs, 13.50", 1.4 kg
Externt test » Acer Chromebook Spin 713 CP713-3W-503Z
HP Envy 13-ba1013na: Intel Iris Xe Graphics G7 80EUs, 13.30", 1.3 kg
Externt test » HP Envy 13-ba1013na
Asus ExpertBook B5 Flip B5302FEA: Intel Iris Xe Graphics G7 80EUs, 13.30", 1.3 kg
Externt test » Asus ExpertBook B5 Flip B5302FEA
Asus VivoBook S14 S433EA-AM464T: Intel Iris Xe Graphics G7 80EUs, 14.00", 1.4 kg
Externt test » Asus VivoBook S14 S433EA-AM464T
Asus VivoBook Flip 14 TP470EA-EC163T: Intel Iris Xe Graphics G7 80EUs, 14.00", 1.5 kg
Externt test » Asus VivoBook Flip 14 TP470EA-EC163T
Alldocube iWork GT i5: Intel Iris Xe Graphics G7 80EUs, 10.95", 0.6 kg
Externt test » Alldocube iWork GT i5
Acer Aspire 5 A515-56-572C: Intel Iris Xe Graphics G7 80EUs, 15.60", 1.9 kg
Externt test » Acer Aspire 5 A515-56-572C
Acer Swift 3 SF314-511-58NS: Intel Iris Xe Graphics G7 80EUs, 14.00", 1.2 kg
Externt test » Acer Swift 3 SF314-511-58NS
HP 15-dy2024nr: Intel Iris Xe Graphics G7 80EUs, 15.60", 1.7 kg
Externt test » HP 15-dy2024nr
Asus Chromebook Flip CX5 CX5500FEA-E60025: Intel UHD Graphics Xe G4 48EUs, 15.60", 2 kg
Externt test » Asus Chromebook Flip CX5 CX5500FEA-E60025
HP Envy x360 15-ed1016ur: Intel Iris Xe Graphics G7 80EUs, 15.60", 1.9 kg
Externt test » HP Envy x360 15-ed1016ur
Asus Chromebook Flip CX5 CX5500FEA-E60038: Intel Iris Xe Graphics G7 80EUs, 15.60", 2 kg
Externt test » Asus Chromebook Flip CX5 CX5500FEA-E60038
Dell Latitude 15 3520-7D36T: Intel Iris Xe Graphics G7 80EUs, 15.60", 1.8 kg
Externt test » Dell Latitude 15 3520-7D36T
Lenovo IdeaPad Flex 5 CB 13ITL6-82M70028GE: Intel Iris Xe Graphics G7 80EUs, 13.30", 1.6 kg
Externt test » Lenovo IdeaPad Flex 5 CB 13ITL6-82M70028GE
Lenovo IdeaPad Slim 5 Pro 14ITL6-82L3009LIN: Intel Iris Xe Graphics G7 80EUs, 14.00", 1.4 kg
Externt test » Lenovo IdeaPad Slim 5 Pro 14ITL6-82L3009LIN
Asus Chromebook CX9400, i5-1135G7: Intel Iris Xe Graphics G7 80EUs, 14.00", 1.1 kg
Externt test » Asus Chromebook CX9400, i5-1135G7
HP Pavilion x360 15-er0155ng: Intel Iris Xe Graphics G7 80EUs, 15.60", 1.8 kg
Externt test » HP Pavilion x360 15-er0155ng
Acer Aspire 5 A515-56-50RS: Intel Iris Xe Graphics G7 80EUs, 15.60", 1.7 kg
Externt test » Acer Aspire 5 A515-56-50RS
Dell Inspiron 14 5410 2-in-1: Intel Iris Xe Graphics G7 80EUs, 14.00", 1.7 kg
Externt test » Dell Inspiron 14 5410 2-in-1
HP Pavilion x360 14-dy0009ns: Intel Iris Xe Graphics G7 80EUs, 14.00", 1.6 kg
Externt test » HP Pavilion x360 14-dy0009ns
Lenovo IdeaPad 3 17ITL6-82H9008UMH: Intel Iris Xe Graphics G7 80EUs, 17.30", 2.1 kg
Externt test » Lenovo IdeaPad 3 17ITL6-82H9008UMH
HP Pavilion x360 14-dw1028ns: Intel Iris Xe Graphics G7 80EUs, 14.00", 1.6 kg
Externt test » HP Pavilion x360 14-dw1028ns
Asus VivoBook 15 K513EA-L512TS: Intel Iris Xe Graphics G7 80EUs, 15.60", 1.8 kg
Externt test » Asus VivoBook K513EA-L512TS
Getac S410 G4, 1135G7: Intel Iris Xe Graphics G7 80EUs, 14.00", 2.4 kg
Externt test » Getac S410 G4, 1135G7
Fujitsu Stylistic Q7311, i5-1135G7: Intel Iris Xe Graphics G7 80EUs, 13.30", 0.8 kg
Externt test » Fujitsu Stylistic Q7311, i5-1135G7
Lenovo Yoga Duet 7 13ITL6-82MA000QGE: Intel Iris Xe Graphics G7 80EUs, 13.00", 0.8 kg
Externt test » Lenovo Yoga Duet 7 13ITL6-82MA000QGE
Asus VivoBook 14 X415, i5-1135G7: Intel Iris Xe Graphics G7 80EUs, 14.00", 1.6 kg
Externt test » Asus VivoBook 14 X415, i5-1135G7
Asus ExpertBook B1 B1500C, i5-1135G7 MX330: NVIDIA GeForce MX330, 15.60", 1.7 kg
Externt test » Asus ExpertBook B1 B1500C, i5-1135G7 MX330
Dynabook Tecra A40-J-12E: Intel Iris Xe Graphics G7 80EUs, 14.00", 1.4 kg
Externt test » Dynabook Tecra A40-J-12E
MSI Summit E13 Flip Evo A11MT-095: Intel Iris Xe Graphics G7 80EUs, 13.40", 1.4 kg
Externt test » MSI Summit E13 Flip Evo A11MT-095
Realme Book Slim i5: Intel Iris Xe Graphics G7 80EUs, 14.00", 1.4 kg
Externt test » realme Book Slim i5
Dell Inspiron 15 3501-PFV0X: Intel Iris Xe Graphics G7 80EUs, 15.60", 1.9 kg
Externt test » Dell Inspiron 15 3501-PFV0X
LG Gram 14Z90P-G.AP55G: Intel Iris Xe Graphics G7 80EUs, 14.00", 1 kg
Externt test » LG Gram 14Z90P-G.AP55G
Samsung Galaxy Book Pro 13 NP930XDB-KH1US: Intel Iris Xe Graphics G7 80EUs, 13.30", 0.9 kg
Externt test » Samsung Galaxy Book Pro 13 NP930XDB-KH1US
Lenovo Yoga Slim 9 14ITL5-82D10044LT: Intel Iris Xe Graphics G7 80EUs, 14.00", 1.3 kg
Externt test » Lenovo Yoga Slim 9 14ITL5-82D10044LT
Lenovo IdeaPad 3 14ITL6-82H7009FSP: Intel Iris Xe Graphics G7 80EUs, 14.00", 1.4 kg
Externt test » Lenovo IdeaPad 3 14ITL6-82H7009FSP
Lenovo ThinkPad X1 Carbon G9-20XW0026GE: Intel Iris Xe Graphics G7 80EUs, 14.00", 1.1 kg
Externt test » Lenovo ThinkPad X1 Carbon G9-20XW0026GE
HP 15s-fq2038ns: Intel Iris Xe Graphics G7 80EUs, 15.60", 1.7 kg
Externt test » HP 15s-fq2038ns
HP Envy 13-ba1014ns: Intel Iris Xe Graphics G7 80EUs, 13.30", 1.3 kg
Externt test » HP Envy 13-ba1014ns
Asus VivoBook 14 X413EA-EB070T: Intel Iris Xe Graphics G7 80EUs, 14.00", 1.5 kg
Externt test » Asus VivoBook 14 X413EA-EB070T
Lenovo ThinkPad X13 G2-20WK00AHGE: Intel Iris Xe Graphics G7 80EUs, 13.30", 1.3 kg
Externt test » Lenovo ThinkPad X13 G2-20WK00AHGE
Gateway GWTN141-10GR: Intel Iris Xe Graphics G7 80EUs, 14.10", 1.6 kg
Externt test » Gateway GWTN141-10GR
Acer Aspire 5 A517-52-59SV: Intel Iris Xe Graphics G7 80EUs, 17.30", 2.6 kg
Externt test » Acer Aspire 5 A517-52-59SV
Acer Swift 3 SF314-59-5021: Intel Iris Xe Graphics G7 80EUs, 14.00", 1.2 kg
Externt test » Acer Swift 3 SF314-59-5021
Asus ExpertBook B1 B1400CEAE, i5-1135G7: Intel Iris Xe Graphics G7 80EUs, 14.00", 1.5 kg
Externt test » Asus ExpertBook B1 B1400CEAE, i5-1135G7
Dell Latitude 13 3320, i5-1135G7: Intel Iris Xe Graphics G7 80EUs, 13.30", 1.2 kg
Externt test » Dell Latitude 13 3320, i5-1135G7
Dell Latitude 14 9420 2-in-1, i5-1135G7: Intel Iris Xe Graphics G7 80EUs, 14.00", 1.3 kg
Externt test » Dell Latitude 14 9420 2-in-1, i5-1135G7
HP Pavilion x360 14-dw1024nr: Intel Iris Xe Graphics G7 80EUs, 14.00", 1.6 kg
Externt test » HP Pavilion x360 14-dw1024nr
HP Pavilion 14-dv0007na: Intel Iris Xe Graphics G7 80EUs, 14.00", 1.4 kg
Externt test » HP Pavilion 14-dv0007na
HP 15s-fq2005ns: Intel Iris Xe Graphics G7 80EUs, 15.60", 1.7 kg
Externt test » HP 15s-fq2005ns
Samsung Galaxy Book 15, i5-1135G7: Intel Iris Xe Graphics G7 80EUs, 15.60", 1.6 kg
Externt test » Samsung Galaxy Book 15, i5-1135G7
HP 14s-dq2003ns: Intel Iris Xe Graphics G7 80EUs, 14.00", 1.5 kg
Externt test » HP 14s-dq2003ns
Lenovo Yoga Duet 7 13IML05, i5-1135G7: Intel Iris Xe Graphics G7 80EUs, 13.00", 0.8 kg
Externt test » Lenovo Yoga Duet 7 13IML05, i5-1135G7
Acer Swift 5 SF514-55T-5001: Intel Iris Xe Graphics G7 80EUs, 14.00", 1.1 kg
Externt test » Acer Swift 5 SF514-55T-5001
Lenovo Yoga Slim 7 15ITL05-82AC002FGE: Intel Iris Xe Graphics G7 80EUs, 15.60", 1.9 kg
Externt test » Lenovo Yoga Slim 7 15ITL05-82AC002FGE
Acer Swift 3X SF314-510G-55EP: Intel Iris Xe Graphics G7 80EUs, 14.00", 1.4 kg
Externt test » Acer Swift 3X SF314-510G-55EP
MSI Prestige 15 A11SB-449: NVIDIA GeForce MX450, 15.60", 1.7 kg
Externt test » MSI Prestige 15 A11SB-449
Lenovo Yoga Slim 7 13ITL5-82CU002JGE: Intel Iris Xe Graphics G7 80EUs, 13.30", 1.2 kg
Externt test » Lenovo Yoga Slim 7 13ITL5-82CU002JGE
Lenovo IdeaPad Flex 5 14ITL05-82HS004TGE: Intel Iris Xe Graphics G7 80EUs, 14.00", 1.5 kg
Externt test » Lenovo IdeaPad Flex 5 14ITL05-82HS004TGE
Acer Chromebook 514 CB514-1WT-57YM: Intel Iris Xe Graphics G7 80EUs, 14.00", 1.4 kg
Externt test » Acer Chromebook 514 CB514-1WT-57YM
VAIO SE14 NP14V3IN033P: Intel Iris Xe Graphics G7 80EUs, 14.00", 1.4 kg
Externt test » VAIO SE14 NP14V3IN033P
Dynabook Portégé X30L-J-10G: Intel Iris Xe Graphics G7 80EUs, 13.30", 0.9 kg
Externt test » Dynabook Portégé X30L-J-10G
HP Pavilion 14-dv0021ns: Intel Iris Xe Graphics G7 80EUs, 14.00", 1.4 kg
Externt test » HP Pavilion 14-dv0021ns
HP 15s-fq2041ns: Intel Iris Xe Graphics G7 80EUs, 15.60", 1.7 kg
Externt test » HP 15s-fq2041ns
Lenovo ThinkPad L13 Yoga Gen2-20VK000VGE: Intel Iris Xe Graphics G7 80EUs, 13.30", 1.5 kg
Externt test » Lenovo ThinkPad L13 Yoga Gen2-20VK000VGE
Acer Swift 3X SF314-510G-52N1: Intel Iris Xe Graphics G7 80EUs, 14.00", 1.4 kg
Externt test » Acer Swift 3X SF314-510G-52N1
Honor MagicBook 15 i5 1135G7: Intel Iris Xe Graphics G7 80EUs, 15.60", 1.5 kg
Externt test » Honor MagicBook 15 i5 1135G7
Samsung Book 15 NP550XDA-KF2BR: Intel Iris Xe Graphics G7 80EUs, 15.60", 1.8 kg
Externt test » Samsung Book 15 NP550XDA-KF2BR
Huawei MateBook 14 2021, i5-1135G7: Intel Iris Xe Graphics G7 80EUs, 14.00", 1.5 kg
Externt test » Huawei MateBook 14 2021, i5-1135G7
HP Pavilion x360 14-dy0157ng: Intel Iris Xe Graphics G7 80EUs, 14.00", 1.5 kg
Externt test » HP Pavilion x360 14-dy0157ng
Lenovo Yoga Slim 7 Carbon 13ITL5-82EV0048GE: Intel Iris Xe Graphics G7 80EUs, 13.30", 1 kg
Externt test » Lenovo Yoga Slim 7 Carbon 13ITL5-82EV0048GE
Lenovo ThinkPad L13 Gen2-20VH0017GE: Intel Iris Xe Graphics G7 80EUs, 13.30", 1.4 kg
Externt test » Lenovo ThinkPad L13 Gen2-20VH0017GE
Lenovo ThinkBook 13s G2 ITL-20V90003GE: Intel Iris Xe Graphics G7 80EUs, 13.30", 1.3 kg
Externt test » Lenovo ThinkBook 13s G2 ITL-20V90003GE
HP Pavilion x360 14-dw1001ns: Intel Iris Xe Graphics G7 80EUs, 14.00", 1.6 kg
Externt test » HP Pavilion x360 14-dw1001ns
HP 15-dy2021nr: Intel Iris Xe Graphics G7 80EUs, 15.60", 1.7 kg
Externt test » HP 15-dy2021nr
HP Spectre x360 13-aw2003dx: Intel Iris Xe Graphics G7 80EUs, 13.30", 1.2 kg
Externt test » HP Spectre x360 13-aw2003dx
Xiaomi RedmiBook Pro 14 2021, i5-1135G7: Intel Iris Xe Graphics G7 80EUs, 14.00", 1.5 kg
Externt test » Xiaomi RedmiBook Pro 14 2021, i5-1135G7
Acer Chromebook Spin 713 CP713-3W-57R0: Intel Iris Xe Graphics G7 80EUs, 13.50", 1.4 kg
Externt test » Acer Chromebook Spin 713 CP713-3W-57R0
HP Envy x360 13-bd0062TU: Intel Iris Xe Graphics G7 80EUs, 13.30", 1.3 kg
Externt test » HP Envy x360 13-bd0062TU
Acer Aspire 5 A514-54G-58R8: NVIDIA GeForce MX350, 14.00", 1.7 kg
Externt test » Acer Aspire 5 A514-54G-58R8
Acer TravelMate Spin P4 TMP414RN-51-53J8: Intel Iris Xe Graphics G7 80EUs, 14.00", 1.4 kg
Externt test » Acer TravelMate Spin P4 TMP414RN-51-53J8
Asus VivoBook X515EP, i5-1135G7 MX330: NVIDIA GeForce MX330, 15.60", 1.8 kg
Externt test » Asus VivoBook X515EP, i5-1135G7 MX330
HP Pavilion x360 14-dw1002ns: Intel Iris Xe Graphics G7 80EUs, 14.00", 1.6 kg
Externt test » HP Pavilion x360 14-dw1002ns
HP Pavilion 14-dv0001ns: Intel Iris Xe Graphics G7 80EUs, 14.00", 1.4 kg
Externt test » HP Pavilion 14-dv0001ns
HP Pavilion 13-bb0062tu: Intel Iris Xe Graphics G7 80EUs, 13.30", 1.2 kg
Externt test » HP Pavilion 13-bb0062tu
Dynabook Portégé X30L-J-11J: Intel Iris Xe Graphics G7 80EUs, 13.30", 0.9 kg
Externt test » Dynabook Portégé X30L-J-11J
Lenovo IdeaPad 3 15ITL6-82H800KDGE: Intel Iris Xe Graphics G7 80EUs, 15.60", 1.7 kg
Externt test » Lenovo IdeaPad 3 15ITL6-82H800KDGE
HP 14s-dq2004ns: Intel Iris Xe Graphics G7 80EUs, 14.00", 1.5 kg
Externt test » HP 14s-dq2004ns
Lenovo IdeaPad 3 15ITL6-82H800BXGE: Intel Iris Xe Graphics G7 80EUs, 15.60", 1.7 kg
Externt test » Lenovo IdeaPad 3 15ITL6-82H800BXGE
HP Pavilion 15-eg0005ns: Intel Iris Xe Graphics G7 80EUs, 15.60", 1.8 kg
Externt test » HP Pavilion 15-eg0005ns
Dell Inspiron 13 5301, i5-1135G7: Intel Iris Xe Graphics G7 80EUs, 13.30", 1.2 kg
Externt test » Dell Inspiron 13 5301, i5-1135G7
Acer Aspire 5 A515-56-55LT: Intel Iris Xe Graphics G7 80EUs, 15.60", 1.7 kg
Externt test » Acer Aspire 5 A515-56-55LT
Acer Aspire 5 A514-54-552U: Intel Iris Xe Graphics G7 80EUs, 14.00", 1.5 kg
Externt test » Acer Aspire 5 A514-54-552U
Samsung Galaxy Book Pro 360 13: Intel Iris Xe Graphics G7 80EUs, 13.20", 1.1 kg
Externt test » Samsung Galaxy Book Pro 360 13
Microsoft Surface Laptop 4 13 i5: Intel Iris Xe Graphics G7 80EUs, 13.50", 1.3 kg
Externt test » Microsoft Surface Laptop 4 13 i5
MSI Modern 14 B11SB, i5-1135G7: Intel Iris Xe Graphics G7 80EUs, 14.00", 1.3 kg
Externt test » MSI Modern 14 B11SB, i5-1135G7
Asus VivoBook S14 S435EA-HM003T: Intel Iris Xe Graphics G7 80EUs, 14.00", 1.3 kg
Externt test » Asus VivoBook S14 S435EA-HM003T
Acer Spin 5 SP513-55N-53HZ: Intel Iris Xe Graphics G7 80EUs, 13.50", 1.2 kg
Externt test » Acer Spin 5 SP513-55N-53HZ
Dell Precision 15 3560 J6V7Y: NVIDIA T500 Laptop GPU, 15.60", 1.6 kg
Externt test » Dell Precision 15 3560 J6V7Y
HP Envy 13-ba1028TU: Intel Iris Xe Graphics G7 80EUs, 13.30", 1.2 kg
Externt test » HP Envy 13-ba1028TU
Dell Latitude 13 5320, i5-1135G7: Intel Iris Xe Graphics G7 80EUs, 13.30", 1.2 kg
Externt test » Dell Latitude 13 5320, i5-1135G7
Dell Latitude 15 5520, i5-1135G7: Intel Iris Xe Graphics G7 80EUs, 15.60", 1.6 kg
Externt test » Dell Latitude 15 5520, i5-1135G7
HP Pavilion 13-bb0154ng: Intel Iris Xe Graphics G7 80EUs, 13.30", 1.2 kg
Externt test » HP Pavilion 13-bb0154ng
Lenovo ThinkBook 13s-ITL-20V90003GE: Intel Iris Xe Graphics G7 80EUs, 13.30", 1.3 kg
Externt test » Lenovo ThinkBook 13s-ITL-20V90003GE
Acer Swift 3 SF314-59-52Q3: Intel Iris Xe Graphics G7 80EUs, 14.00", 1.2 kg
Externt test » Acer Swift 3 Infinity 3 SF314-59, i5-1135G7
Honor MagicBook 14, i5-1135G7: Intel Iris Xe Graphics G7 80EUs, 14.00", 1.4 kg
Externt test » Honor MagicBook 14, i5-1135G7
Huawei MateBook D 15 2021, i5-1135G7: Intel Iris Xe Graphics G7 80EUs, 15.60", 1.5 kg
Externt test » Huawei MateBook D 15 2021, i5-1135G7
HP Pavilion 14-dv0020ns: Intel Iris Xe Graphics G7 80EUs, 14.00", 1.4 kg
Externt test » HP Pavilion 14-dv0020ns
Dell XPS 13 9310, i5-1135G7 FHD: Intel Iris Xe Graphics G7 80EUs, 13.40", 1.2 kg
Externt test » Dell XPS 13 9310, i5-1135G7 FHD
Dell Vostro 14 5402, i5-1135G7: Intel Iris Xe Graphics G7 80EUs, 14.00", 1.4 kg
Externt test » Dell Vostro 14 5402, i5-1135G7
Asus Zenbook Flip 13 UX363EA-EM087T: Intel Iris Xe Graphics G7 80EUs, 14.00", 1.3 kg
Externt test » Asus Zenbook Flip 13 UX363EA-EM087T
HP 15s-fq2086ns: Intel Iris Xe Graphics G7 80EUs, 15.60"
Externt test » HP 15s-fq2086ns
HP 14s-dq2012ns: Intel Iris Xe Graphics G7 80EUs, 14.00", 1.5 kg
Externt test » HP 14s-dq2012ns
Acer Swift 5 SF514-55TA-574H: Intel Iris Xe Graphics G7 80EUs, 14.00", 1.1 kg
Externt test » Acer Swift 5 SF514-55TA-574H
HP Pavilion 14-dv0000ns: Intel Iris Xe Graphics G7 80EUs, 14.00", 1.4 kg
Externt test » HP Pavilion 14-dv0000ns
HP 15s-fq2087ns: Intel Iris Xe Graphics G7 80EUs, 15.60", 1.7 kg
Externt test » HP 15s-fq2087ns
HP 15s-fq2000ns: Intel Iris Xe Graphics G7 80EUs, 15.60", 1.7 kg
Externt test » HP 15s-fq2000ns
Lenovo ThinkBook 14 G2 ITL 20VD008WGE: Intel Iris Xe Graphics G7 80EUs, 14.00", 1.5 kg
Externt test » Lenovo ThinkBook 14 G2 ITL 20VD008WGE
MSI Modern 15 A11M-007NE: Intel Iris Xe Graphics G7 80EUs, 15.60", 1.6 kg
Externt test » MSI Modern 15 A11M-007NE
HP 15s-fq2091ns: Intel Iris Xe Graphics G7 80EUs, 15.60", 1.7 kg
Externt test » HP 15s-fq2091ns
HP Pavilion 14-dv0006ns: NVIDIA GeForce MX350, 14.00", 1.4 kg
Externt test » HP Pavilion 14-dv0006ns
HP 15s-fq2007ns: Intel Iris Xe Graphics G7 80EUs, 15.60", 1.7 kg
Externt test » HP 15s-fq2007ns
HP 15s-fq2002ns: Intel Iris Xe Graphics G7 80EUs, 15.60", 1.7 kg
Externt test » HP 15s-fq2002ns
Dell Latitude 13 7320, i5-1135G7: Intel Iris Xe Graphics G7 80EUs, 13.30", 1.1 kg
Externt test » Dell Latitude 7320, i5-1135G7
Lenovo ThinkBook 14s Yoga ITL, i5-1135G7: Intel Iris Xe Graphics G7 80EUs, 14.00", 1.5 kg
Externt test » Lenovo ThinkBook 14s Yoga ITL, i5-1135G7
MSI Modern 15 A11M, i5-1135G7: Intel Iris Xe Graphics G7 80EUs, 15.60", 1.6 kg
Externt test » MSI Modern 15 A11M, i5-1135G7
Dell Inspiron 15 7506 2-in-1 P97F: Intel Iris Xe Graphics G7 80EUs, 15.60", 1.8 kg
Externt test » Dell Inspiron 15 7506 2-in-1 P97F
Acer Swift 5 SF514-55T-58DN: Intel Iris Xe Graphics G7 80EUs, 14.00", 1 kg
Externt test » Acer Swift 5 SF514-55T-58DN
Dynabook Portégé X30W-J-10H: Intel Iris Xe Graphics G7 80EUs, 13.30", 1 kg
Externt test » Dynabook Portégé X30W-J-10H
Lenovo ThinkPad E15 Gen2-20TD0003GE: Intel Iris Xe Graphics G7 80EUs, 15.60", 1.7 kg
Externt test » Lenovo ThinkPad E15 Gen2-20TD0003GE
HP 15s-fq2009ns: Intel Iris Xe Graphics G7 80EUs, 15.60", 1.7 kg
Externt test » HP 15s-fq2009ns
Microsoft Surface Pro 7 Plus: Intel Iris Xe Graphics G7 80EUs, 12.30", 0.8 kg
Externt test » Microsoft Surface Pro 7 Plus
HP 15s-fq2013ns: Intel Iris Xe Graphics G7 80EUs, 15.60", 1.7 kg
Externt test » HP 15s-fq2013ns
Microsoft Surface Pro 7+ 3BQ-00003: Intel Iris Xe Graphics G7 80EUs, 12.30", 0.8 kg
Externt test » Microsoft Surface Pro 7+ 3BQ-00003
HP EliteBook 840 Aero G8: Intel Iris Xe Graphics G7 80EUs, 14.00", 1.2 kg
Externt test » HP EliteBook 840 Aero G8
HP Pavilion 14-dv0065tx: NVIDIA GeForce MX450, 14.00", 1.4 kg
Externt test » HP Pavilion 14-dv0065tx
HP 15s-fq2004ns: Intel Iris Xe Graphics G7 80EUs, 15.60", 1.7 kg
Externt test » HP 15s-fq2004ns
HP 14s-dq2006ns: Intel Iris Xe Graphics G7 80EUs, 14.00", 1.5 kg
Externt test » HP 14s-dq2006ns
Medion Akoya S15449 MD61991: Intel Iris Xe Graphics G7 80EUs, 15.60", 1.8 kg
Externt test » Medion Akoya S15449 MD61991
HP ProBook 450 G8, i5-1135G7: Intel Iris Xe Graphics G7 80EUs, 15.60", 1.7 kg
Externt test » HP ProBook 450 G8, i5-1135G7
HP Envy 13-ba1018ns : Intel Iris Xe Graphics G7 80EUs, 13.30", 1.3 kg
Externt test » HP Envy 13-ba1018ns
HP 15s-fq2008ns: Intel Iris Xe Graphics G7 80EUs, 15.60", 1.7 kg
Externt test » HP 15s-fq2008ns
Asus Zenbook Flip S UX371EA-HL144R: Intel Iris Xe Graphics G7 80EUs, 13.30", 1.2 kg
Externt test » Asus Zenbook Flip S UX371EA-HL144R
Lenovo IdeaPad 5 15ITL05-82FG00B0GE: Intel Iris Xe Graphics G7 80EUs, 15.60", 1.7 kg
Externt test » Lenovo IdeaPad 5 15ITL05-82FG00B0GE
Dell XPS 13 9310 2-in-1, i5-1135G7: Intel Iris Xe Graphics G7 80EUs, 13.40", 1.3 kg
Externt test » Dell XPS 13 9310 2-in-1, i5-1135G7
Acer Swift 3 Air 3: Intel Iris Xe Graphics G7 80EUs, 13.50", 1.2 kg
Externt test » Acer Swift 3 Air 3
Lenovo Yoga Slim 7 14ITL05, i5-1135G7: Intel Iris Xe Graphics G7 80EUs, 14.00", 1.4 kg
Externt test » Lenovo Yoga Slim 7 14ITL05, i5-1135G7
Fujitsu UH-X, i5: Intel Iris Xe Graphics G7 80EUs, 13.30", 0.7 kg
Externt test » Fujitsu UH-X
HP Pavilion 15-eg0656ng: Intel Iris Xe Graphics G7 80EUs, 15.60", 1.8 kg
Externt test » HP Pavilion 15-eg0656ng
HP ProBook 650 G8, i5-1135G7: Intel Iris Xe Graphics G7 80EUs, 15.60", 1.7 kg
Externt test » HP ProBook 650 G8, i5-1135G7
Asus VivoBook Flip 14 TP470EA-EC033T: Intel Iris Xe Graphics G7 80EUs, 14.00", 1.5 kg
Externt test » Asus VivoBook Flip 14 TP470EA-EC033T
Lenovo ThinkPad E14 Gen2-20TA004FUS: Intel Iris Xe Graphics G7 80EUs, 14.00", 1.6 kg
Externt test » Lenovo ThinkPad E14 Gen2-20TA004FUS
Acer Book RS Porsche Design AP714-51T-59ZV: Intel Iris Xe Graphics G7 80EUs, 14.00", 1.3 kg
Externt test » Acer Book RS Porsche Design AP714-51T-59ZV
Asus Vivobook Flip 14 TP470EA-EC029TS: Intel Iris Xe Graphics G7 80EUs, 14.00", 1.5 kg
Externt test » Asus Vivobook Flip 14 TP470EA-EC029TS
Dell Inspiron 14 5406, i5-1135G7 MX330: NVIDIA GeForce MX330, 14.00", 1.7 kg
Externt test » Dell Inspiron 14 5406, i5-1135G7 MX330
HP Envy 14-eb0010nr: NVIDIA GeForce GTX 1650 Ti Max-Q, 14.00", 1.6 kg
Externt test » HP Envy 14-eb0010nr
HP Pavilion 14-dv0301ng: Intel Iris Xe Graphics G7 80EUs, 14.00", 1.4 kg
Externt test » HP Pavilion 14-dv0301ng
Acer Aspire 5 A515-56G-51YF: NVIDIA GeForce MX350, 15.60", 1.7 kg
Externt test » Acer Aspire 5 A515-56G-51YF
Lenovo Yoga 7 14ITL5: Intel Iris Xe Graphics G7 80EUs, 14.00", 1.5 kg
Externt test » Lenovo Yoga 7 14ITL5
Acer Aspire 5 A514-54-59BP: Intel Iris Xe Graphics G7 80EUs, 14.00", 1.6 kg
Externt test » Acer Aspire 5 A514-54-59BP
Asus VivoBook S14 S433EA-EB043T: Intel Iris Xe Graphics G7 80EUs, 14.00", 1.4 kg
Externt test » Asus VivoBook S14 S433EA-EB043T
Asus ZenBook 13 UX325EA, i5-1135G7: Intel Iris Xe Graphics G7 80EUs, 13.30", 1.1 kg
Externt test » Asus ZenBook 13 UX325EA, i5-1135G7
Lenovo IdeaPad Slim 5 15, i5-1135G7: Intel Iris Xe Graphics G7 80EUs, 15.60", 1.7 kg
Externt test » Lenovo IdeaPad Slim 5 15, i5-1135G7
Acer Aspire 5 A514-54-55X7: Intel Iris Xe Graphics G7 80EUs, 14.00", 1.7 kg
Externt test » Acer Aspire 5 A514-54-55X7
Medion Akoya S15449 MD61865: Intel Iris Xe Graphics G7 80EUs, 15.60", 1.8 kg
Externt test » Medion Akoya S15449 MD61865
Acer Swift 5 SF514-55TA-57P3: Intel Iris Xe Graphics G7 80EUs, 14.00", 1.1 kg
Externt test » Acer Swift 5 SF514-55TA-57P3
Acer Aspire 5 A515-56-51P5: Intel Iris Xe Graphics G7 80EUs, 15.60", 1.9 kg
Externt test » Acer Aspire 5 A515-56-51P5
Asus ZenBook 14 UX435EA: Intel Iris Xe Graphics G7 80EUs, 14.00", 1.3 kg
Externt test » Asus ZenBook 14 UX435EA
Asus ZenBook 14 UX425EA-HM038T: Intel Iris Xe Graphics G7 80EUs, 14.00", 1.4 kg
Externt test » Asus ZenBook 14 UX425EA-HM038T
Lenovo Yoga 9i 14ITL5: Intel Iris Xe Graphics G7 80EUs, 14.00", 1.4 kg
Externt test » Lenovo Yoga 9i 14ITL5
Asus Vivobook 15 K513EQ, i5-1135G7: Intel Iris Xe Graphics G7 80EUs, 15.60", 1.8 kg
Externt test » Asus Vivobook 15 K513, i5-1135G7
Acer Swift 3 SF314-59-52A6 silber: Intel Iris Xe Graphics G7 80EUs, 14.00"
Externt test » Acer Swift 3 SF314-59-52A6 silber
Asus Zenbook Flip 13 UX363EA-EM179R: Intel Iris Xe Graphics G7 80EUs, 13.30", 1.3 kg
Externt test » Asus Zenbook Flip 13 UX363EA-EM179R
Acer Book RS Porsche Design AP714-51T-57D6: Intel Iris Xe Graphics G7 80EUs, 14.00", 1.3 kg
Externt test » Acer Book RS Porsche Design AP714-51T-57D6
Asus Zenbook Flip 13 UX363EA-EM111T: Intel Iris Xe Graphics G7 80EUs, 13.30", 1.3 kg
Externt test » Asus Zenbook Flip 13 UX363EA-EM111T
Asus VivoBook 15 S513EA-EJ118T: Intel Iris Xe Graphics G7 80EUs, 15.60", 1.7 kg
Externt test » Asus VivoBook 15 S513EA-EJ118T
Acer Aspire 5 A515-56-511A: Intel Iris Xe Graphics G7 80EUs, 15.60", 1.9 kg
Externt test » Acer Aspire 5 A515-56-511A
Acer Swift 3 SF314-59-74VC: Intel Iris Xe Graphics G7 80EUs, 14.00", 1.2 kg
Externt test » Acer Swift 3 SF314-59-74VC
Acer Swift 5 SF514-55T-55WL: Intel Iris Xe Graphics G7 96EUs, 14.00", 1.1 kg
Externt test » Acer Swift 5 SF514-55T-55WL