Test: HP Spectre x360 14 - En omedelbar favorit (Sammanfattning)
Testgrupp
Gradering | Datum | Modell | Vikt | Höjd | Storlek | Upplösning | Pris |
|---|---|---|---|---|---|---|---|
| 89.4 % v7 (old) | 12/2020 | HP Spectre x360 14t-ea000 i7-1165G7, Iris Xe G7 96EUs | 1.3 kg | 17.2 mm | 13.50" | 1920x1280 | |
| 88.4 % v7 (old) | 01/2020 | HP Spectre x360 13-aw0013dx i7-1065G7, Iris Plus Graphics G7 (Ice Lake 64 EU) | 1.2 kg | 16.9 mm | 13.30" | 1920x1080 | |
| 86.3 % v7 (old) | 10/2019 | Dell XPS 13 7390 2-in-1 Core i7 i7-1065G7, Iris Plus Graphics G7 (Ice Lake 64 EU) | 1.3 kg | 13 mm | 13.40" | 1920x1200 | |
| 86.3 % v7 (old) | 12/2020 | Huawei MateBook 14 2020 Intel i7-10510U, GeForce MX350 | 1.5 kg | 15.9 mm | 14.00" | 2160x1440 | |
| 85.1 % v7 (old) | Asus Zenbook S UX393JA i7-1065G7, Iris Plus Graphics G7 (Ice Lake 64 EU) | 1.4 kg | 15.7 mm | 13.90" | 3300x2200 | ||
| 87.1 % v7 (old) | 12/2020 | Lenovo Yoga 9i 14ITL5 i5-1135G7, Iris Xe G7 80EUs | 1.4 kg | 15.7 mm | 14.00" | 1920x1080 |
| SD Card Reader | |
| average JPG Copy Test (av. of 3 runs) | |
| HP Spectre x360 14t-ea000 (Toshiba Exceria Pro M501 microSDXC 32GB) | |
| HP Spectre x360 13-aw0013dx (Toshiba Exceria Pro M501 microSDXC 64GB) | |
| Dell XPS 13 7390 2-in-1 Core i7 (Toshiba Exceria Pro M501 64 GB UHS-II) | |
| Asus Zenbook S UX393JA (Toshiba Exceria Pro M501 64 GB UHS-II) | |
| maximum AS SSD Seq Read Test (1GB) | |
| HP Spectre x360 14t-ea000 (Toshiba Exceria Pro M501 microSDXC 32GB) | |
| Dell XPS 13 7390 2-in-1 Core i7 (Toshiba Exceria Pro M501 64 GB UHS-II) | |
| HP Spectre x360 13-aw0013dx (Toshiba Exceria Pro M501 microSDXC 64GB) | |
| Asus Zenbook S UX393JA (Toshiba Exceria Pro M501 64 GB UHS-II) | |
| Networking | |
| iperf3 transmit AX12 | |
| Huawei MateBook 14 2020 Intel | |
| HP Spectre x360 14t-ea000 | |
| Lenovo Yoga 9i 14ITL5 | |
| Asus Zenbook S UX393JA | |
| Dell XPS 13 7390 2-in-1 Core i7 | |
| iperf3 receive AX12 | |
| Asus Zenbook S UX393JA | |
| HP Spectre x360 14t-ea000 | |
| Huawei MateBook 14 2020 Intel | |
| Lenovo Yoga 9i 14ITL5 | |
| Dell XPS 13 7390 2-in-1 Core i7 | |


| |||||||||||||||||||||||||
Distribution av ljusstyrkan: 78 %
Mitt på batteriet: 443.5 cd/m²
Kontrast: 2609:1 (Svärta: 0.17 cd/m²)
ΔE ColorChecker Calman: 2.7 | ∀{0.5-29.43 Ø4.71}
calibrated: 2.61
ΔE Greyscale Calman: 3.4 | ∀{0.09-98 Ø4.96}
98.5% sRGB (Argyll 1.6.3 3D)
62.1% AdobeRGB 1998 (Argyll 1.6.3 3D)
67.9% AdobeRGB 1998 (Argyll 3D)
98.2% sRGB (Argyll 3D)
65.8% Display P3 (Argyll 3D)
Gamma: 2.09
CCT: 6144 K
| HP Spectre x360 14t-ea000 LG Philips LGD0663, IPS, 13.5", 1920x1280 | HP Spectre x360 13-aw0013dx AU Optronics AUO5E2D, IPS, 13.3", 1920x1080 | Dell XPS 13 7390 2-in-1 Core i7 Sharp LQ134N1, IPS, 13.4", 1920x1200 | Huawei MateBook 14 2020 Intel TV140WTM-NH0, IPS LED, 14", 2160x1440 | Asus Zenbook S UX393JA AU Optronics B139KAN01.0, IPS, 13.9", 3300x2200 | Lenovo Yoga 9i 14ITL5 LG Display LP140WF9-SPE2, IPS, 14", 1920x1080 | |
|---|---|---|---|---|---|---|
| Display | 4% | 4% | 2% | 26% | -3% | |
| Display P3 Coverage (%) | 65.8 | 69.6 6% | 69.9 6% | 67.1 2% | 97.7 48% | 64.2 -2% |
| sRGB Coverage (%) | 98.2 | 98.9 1% | 99.2 1% | 99.1 1% | 99.8 2% | 94.2 -4% |
| AdobeRGB 1998 Coverage (%) | 67.9 | 71.5 5% | 71.5 5% | 69 2% | 87.9 29% | 65 -4% |
| Response Times | 5% | 25% | 41% | 6% | 12% | |
| Response Time Grey 50% / Grey 80% * (ms) | 62 ? | 60.8 ? 2% | 47.6 ? 23% | 37.6 ? 39% | 56.4 ? 9% | 55.2 ? 11% |
| Response Time Black / White * (ms) | 39.6 ? | 36.8 ? 7% | 29.2 ? 26% | 22.4 ? 43% | 38.8 ? 2% | 34.4 ? 13% |
| PWM Frequency (Hz) | 2500 ? | 59520 ? | ||||
| Screen | -28% | 1% | -12% | -19% | -16% | |
| Brightness middle (cd/m²) | 443.5 | 447.4 1% | 549.8 24% | 458 3% | 444.1 0% | 365 -18% |
| Brightness (cd/m²) | 394 | 420 7% | 520 32% | 448 14% | 423 7% | 346 -12% |
| Brightness Distribution (%) | 78 | 85 9% | 86 10% | 89 14% | 89 14% | 82 5% |
| Black Level * (cd/m²) | 0.17 | 0.31 -82% | 0.39 -129% | 0.25 -47% | 0.37 -118% | 0.23 -35% |
| Contrast (:1) | 2609 | 1443 -45% | 1410 -46% | 1832 -30% | 1200 -54% | 1587 -39% |
| Colorchecker dE 2000 * | 2.7 | 4.23 -57% | 2.12 21% | 3.4 -26% | 2.94 -9% | 3.65 -35% |
| Colorchecker dE 2000 max. * | 4.36 | 9.34 -114% | 3.66 16% | 6.7 -54% | 7.37 -69% | 6.69 -53% |
| Colorchecker dE 2000 calibrated * | 2.61 | 1.32 49% | 1.37 48% | 1.7 35% | 3.05 -17% | 1.61 38% |
| Greyscale dE 2000 * | 3.4 | 6.1 -79% | 2.6 24% | 4.9 -44% | 2.9 15% | 4 -18% |
| Gamma | 2.09 105% | 2.11 104% | 2.3 96% | 2.16 102% | 2.1 105% | 2.33 94% |
| CCT | 6144 106% | 6136 106% | 6884 94% | 7704 84% | 6766 96% | 6873 95% |
| Color Space (Percent of AdobeRGB 1998) (%) | 62.1 | 64.8 4% | 65.4 5% | 63.5 2% | 78.2 26% | 60.1 -3% |
| Color Space (Percent of sRGB) (%) | 98.5 | 98.9 0% | 99.7 1% | 99.1 1% | 99.8 1% | 93.9 -5% |
| Totalt genomsnitt (program/inställningar) | -6% /
-18% | 10% /
4% | 10% /
-3% | 4% /
-7% | -2% /
-10% |
* ... mindre är bättre
Visa svarstider
| ↔ Svarstid svart till vitt | ||
|---|---|---|
| 39.6 ms ... stiga ↗ och falla ↘ kombinerat | ↗ 21.6 ms stiga | 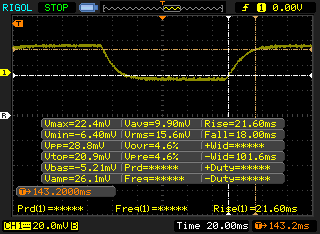 |
| ↘ 18 ms hösten | ||
| Skärmen visar långsamma svarsfrekvenser i våra tester och kommer att vara otillfredsställande för spelare. I jämförelse sträcker sig alla testade enheter från 0.1 (minst) till 240 (maximalt) ms. » 97 % av alla enheter är bättre. Detta innebär att den uppmätta svarstiden är sämre än genomsnittet av alla testade enheter (19.8 ms). | ||
| ↔ Svarstid 50 % grått till 80 % grått | ||
| 62 ms ... stiga ↗ och falla ↘ kombinerat | ↗ 32 ms stiga | 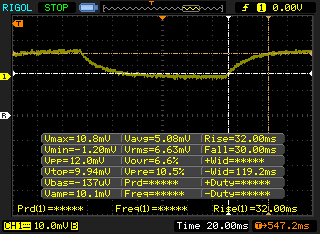 |
| ↘ 30 ms hösten | ||
| Skärmen visar långsamma svarsfrekvenser i våra tester och kommer att vara otillfredsställande för spelare. I jämförelse sträcker sig alla testade enheter från 0.165 (minst) till 636 (maximalt) ms. » 97 % av alla enheter är bättre. Detta innebär att den uppmätta svarstiden är sämre än genomsnittet av alla testade enheter (30.9 ms). | ||
Skärmflimmer / PWM (Puls-Width Modulation)
| Skärmflimmer / PWM upptäcktes inte |  | ||
Som jämförelse: 52 % av alla testade enheter använder inte PWM för att dämpa skärmen. Om PWM upptäcktes mättes ett medelvärde av 7741 (minst: 5 - maximum: 343500) Hz. | |||
Cinebench R15: CPU Multi 64Bit | CPU Single 64Bit
Blender: v2.79 BMW27 CPU
7-Zip 18.03: 7z b 4 -mmt1 | 7z b 4
Geekbench 5.5: Single-Core | Multi-Core
HWBOT x265 Benchmark v2.2: 4k Preset
LibreOffice : 20 Documents To PDF
R Benchmark 2.5: Overall mean
| Cinebench R20 / CPU (Multi Core) | |
| Lenovo Yoga Slim 7-14ARE | |
| Lenovo Yoga Slim 7 14ARE05 82A20008GE | |
| Dell XPS 13 7390 Core i7-10710U | |
| Lenovo Yoga 9i 14ITL5 | |
| Dell XPS 13 7390 2-in-1 Core i7 | |
| HP Spectre x360 14t-ea000 | |
| Genomsnitt Intel Core i7-1165G7 (1060 - 2657, n=81) | |
| HP Spectre x360 13-aw0013dx | |
| Asus Zenbook S UX393JA | |
| Asus ZenBook 14 UX434FL-DB77 | |
| Huawei MateBook 14 2020 Intel | |
| HP Envy x360 13-ar0601ng | |
| Cinebench R20 / CPU (Single Core) | |
| Genomsnitt Intel Core i7-1165G7 (442 - 589, n=81) | |
| HP Spectre x360 14t-ea000 | |
| Lenovo Yoga 9i 14ITL5 | |
| Lenovo Yoga Slim 7-14ARE | |
| Lenovo Yoga Slim 7 14ARE05 82A20008GE | |
| Dell XPS 13 7390 2-in-1 Core i7 | |
| Dell XPS 13 7390 Core i7-10710U | |
| Asus Zenbook S UX393JA | |
| Asus ZenBook 14 UX434FL-DB77 | |
| Huawei MateBook 14 2020 Intel | |
| HP Spectre x360 13-aw0013dx | |
| HP Envy x360 13-ar0601ng | |
| Cinebench R15 / CPU Multi 64Bit | |
| Lenovo Yoga Slim 7-14ARE | |
| Lenovo Yoga Slim 7 14ARE05 82A20008GE | |
| Dell XPS 13 7390 Core i7-10710U | |
| HP Spectre x360 14t-ea000 | |
| Genomsnitt Intel Core i7-1165G7 (553 - 1027, n=86) | |
| Dell XPS 13 7390 2-in-1 Core i7 | |
| Lenovo Yoga 9i 14ITL5 | |
| Asus ZenBook 14 UX434FL-DB77 | |
| HP Envy x360 13-ar0601ng | |
| HP Spectre x360 13-aw0013dx | |
| Asus Zenbook S UX393JA | |
| Huawei MateBook 14 2020 Intel | |
| Cinebench R15 / CPU Single 64Bit | |
| Genomsnitt Intel Core i7-1165G7 (115 - 230, n=78) | |
| HP Spectre x360 14t-ea000 | |
| Lenovo Yoga 9i 14ITL5 | |
| Lenovo Yoga Slim 7-14ARE | |
| Huawei MateBook 14 2020 Intel | |
| Dell XPS 13 7390 Core i7-10710U | |
| Asus Zenbook S UX393JA | |
| HP Spectre x360 13-aw0013dx | |
| Asus ZenBook 14 UX434FL-DB77 | |
| Lenovo Yoga Slim 7 14ARE05 82A20008GE | |
| Dell XPS 13 7390 2-in-1 Core i7 | |
| HP Envy x360 13-ar0601ng | |
| Blender / v2.79 BMW27 CPU | |
| HP Envy x360 13-ar0601ng | |
| Huawei MateBook 14 2020 Intel | |
| Asus Zenbook S UX393JA | |
| Asus ZenBook 14 UX434FL-DB77 | |
| HP Envy x360 13-ay0359ng | |
| Dell XPS 13 7390 2-in-1 Core i7 | |
| Lenovo Yoga 9i 14ITL5 | |
| Genomsnitt Intel Core i7-1165G7 (468 - 1138, n=80) | |
| HP Spectre x360 14t-ea000 | |
| Dell XPS 13 7390 Core i7-10710U | |
| Lenovo Yoga Slim 7 14ARE05 82A20008GE | |
| Lenovo Yoga Slim 7-14ARE | |
| 7-Zip 18.03 / 7z b 4 -mmt1 | |
| Genomsnitt Intel Core i7-1165G7 (4478 - 5507, n=80) | |
| HP Spectre x360 14t-ea000 | |
| Lenovo Yoga 9i 14ITL5 | |
| Huawei MateBook 14 2020 Intel | |
| Lenovo Yoga Slim 7-14ARE | |
| Dell XPS 13 7390 2-in-1 Core i7 | |
| Asus Zenbook S UX393JA | |
| Dell XPS 13 7390 Core i7-10710U | |
| Lenovo Yoga Slim 7 14ARE05 82A20008GE | |
| HP Envy x360 13-ay0359ng | |
| Asus ZenBook 14 UX434FL-DB77 | |
| HP Envy x360 13-ar0601ng | |
| 7-Zip 18.03 / 7z b 4 | |
| Lenovo Yoga Slim 7-14ARE | |
| Lenovo Yoga Slim 7 14ARE05 82A20008GE | |
| Dell XPS 13 7390 Core i7-10710U | |
| Genomsnitt Intel Core i7-1165G7 (15347 - 27405, n=80) | |
| Dell XPS 13 7390 2-in-1 Core i7 | |
| Lenovo Yoga 9i 14ITL5 | |
| HP Envy x360 13-ay0359ng | |
| HP Spectre x360 14t-ea000 | |
| Asus Zenbook S UX393JA | |
| Huawei MateBook 14 2020 Intel | |
| Asus ZenBook 14 UX434FL-DB77 | |
| HP Envy x360 13-ar0601ng | |
| Geekbench 5.5 / Single-Core | |
| Genomsnitt Intel Core i7-1165G7 (1302 - 1595, n=77) | |
| HP Spectre x360 14t-ea000 | |
| Lenovo Yoga 9i 14ITL5 | |
| Asus Zenbook S UX393JA | |
| Huawei MateBook 14 2020 Intel | |
| Asus ZenBook 14 UX434FL-DB77 | |
| Lenovo Yoga Slim 7-14ARE | |
| Lenovo Yoga Slim 7-14ARE | |
| Lenovo Yoga Slim 7 14ARE05 82A20008GE | |
| Geekbench 5.5 / Multi-Core | |
| Lenovo Yoga Slim 7-14ARE | |
| Lenovo Yoga Slim 7-14ARE | |
| Lenovo Yoga Slim 7 14ARE05 82A20008GE | |
| HP Spectre x360 14t-ea000 | |
| Lenovo Yoga 9i 14ITL5 | |
| Genomsnitt Intel Core i7-1165G7 (3078 - 5926, n=77) | |
| Asus Zenbook S UX393JA | |
| Huawei MateBook 14 2020 Intel | |
| Asus ZenBook 14 UX434FL-DB77 | |
| HWBOT x265 Benchmark v2.2 / 4k Preset | |
| Lenovo Yoga Slim 7-14ARE | |
| Lenovo Yoga Slim 7 14ARE05 82A20008GE | |
| Lenovo Yoga 9i 14ITL5 | |
| Dell XPS 13 7390 2-in-1 Core i7 | |
| Genomsnitt Intel Core i7-1165G7 (1.39 - 8.47, n=80) | |
| HP Spectre x360 14t-ea000 | |
| HP Envy x360 13-ay0359ng | |
| Dell XPS 13 7390 Core i7-10710U | |
| Asus ZenBook 14 UX434FL-DB77 | |
| Huawei MateBook 14 2020 Intel | |
| Asus Zenbook S UX393JA | |
| HP Envy x360 13-ar0601ng | |
| LibreOffice / 20 Documents To PDF | |
| HP Envy x360 13-ay0359ng | |
| Asus ZenBook 14 UX434FL-DB77 | |
| Lenovo Yoga Slim 7 14ARE05 82A20008GE | |
| Lenovo Yoga Slim 7-14ARE | |
| HP Spectre x360 14t-ea000 | |
| Huawei MateBook 14 2020 Intel | |
| Genomsnitt Intel Core i7-1165G7 (21.5 - 88.1, n=78) | |
| Lenovo Yoga 9i 14ITL5 | |
| Asus Zenbook S UX393JA | |
| R Benchmark 2.5 / Overall mean | |
| Asus ZenBook 14 UX434FL-DB77 | |
| Asus Zenbook S UX393JA | |
| Huawei MateBook 14 2020 Intel | |
| HP Envy x360 13-ay0359ng | |
| Lenovo Yoga 9i 14ITL5 | |
| Lenovo Yoga Slim 7 14ARE05 82A20008GE | |
| Lenovo Yoga Slim 7-14ARE | |
| HP Spectre x360 14t-ea000 | |
| Genomsnitt Intel Core i7-1165G7 (0.552 - 1.002, n=80) | |
Cinebench R15: CPU Multi 64Bit | CPU Single 64Bit
Blender: v2.79 BMW27 CPU
7-Zip 18.03: 7z b 4 -mmt1 | 7z b 4
Geekbench 5.5: Single-Core | Multi-Core
HWBOT x265 Benchmark v2.2: 4k Preset
LibreOffice : 20 Documents To PDF
R Benchmark 2.5: Overall mean
* ... mindre är bättre
| PCMark 8 | |
| Home Score Accelerated v2 | |
| Genomsnitt Intel Core i7-1165G7, Intel Iris Xe Graphics G7 96EUs (3769 - 5686, n=17) | |
| HP Spectre x360 14t-ea000 | |
| Lenovo Yoga 9i 14ITL5 | |
| Dell XPS 13 7390 2-in-1 Core i7 | |
| HP Spectre x360 13-aw0013dx | |
| Huawei MateBook 14 2020 Intel | |
| Asus Zenbook S UX393JA | |
| Work Score Accelerated v2 | |
| HP Spectre x360 13-aw0013dx | |
| Dell XPS 13 7390 2-in-1 Core i7 | |
| Huawei MateBook 14 2020 Intel | |
| HP Spectre x360 14t-ea000 | |
| Lenovo Yoga 9i 14ITL5 | |
| Genomsnitt Intel Core i7-1165G7, Intel Iris Xe Graphics G7 96EUs (2431 - 3221, n=15) | |
| Asus Zenbook S UX393JA | |
| PCMark 8 Home Score Accelerated v2 | 4409 poäng | |
| PCMark 8 Work Score Accelerated v2 | 3039 poäng | |
| PCMark 10 Score | 4955 poäng | |
Hjälp | ||
| DPC Latencies / LatencyMon - interrupt to process latency (max), Web, Youtube, Prime95 | |
| Asus Zenbook S UX393JA | |
| HP Spectre x360 14t-ea000 | |
| Lenovo Yoga 9i 14ITL5 | |
| Huawei MateBook 14 2020 Intel | |
* ... mindre är bättre
| HP Spectre x360 14t-ea000 Samsung SSD PM981a MZVLB512HBJQ | Dell XPS 13 7390 2-in-1 Core i7 Toshiba BG4 KBG40ZPZ512G | Huawei MateBook 14 2020 Intel Lite-On CA5-8D512 | Asus Zenbook S UX393JA Intel SSD 660p 1TB SSDPEKNW010T8 | Lenovo Yoga 9i 14ITL5 Samsung SSD PM981a MZVLB256HBHQ | |
|---|---|---|---|---|---|
| AS SSD | -80% | -2% | -27% | -21% | |
| Seq Read (MB/s) | 2188 | 1801 -18% | 2933 34% | 1405 -36% | 2177 -1% |
| Seq Write (MB/s) | 1320 | 1125 -15% | 810 -39% | 1062 -20% | 813 -38% |
| 4K Read (MB/s) | 53.5 | 39.7 -26% | 56.6 6% | 50.8 -5% | 53.2 -1% |
| 4K Write (MB/s) | 123.7 | 67 -46% | 147.6 19% | 124.9 1% | 180 46% |
| 4K-64 Read (MB/s) | 1010 | 1253 24% | 856 -15% | 590 -42% | 531 -47% |
| 4K-64 Write (MB/s) | 1808 | 209 -88% | 1099 -39% | 840 -54% | 398.5 -78% |
| Access Time Read * (ms) | 0.055 | 0.069 -25% | 0.046 16% | 0.041 25% | 0.052 5% |
| Access Time Write * (ms) | 0.076 | 0.625 -722% | 0.028 63% | 0.118 -55% | 0.058 24% |
| Score Read (Points) | 1282 | 1472 15% | 1206 -6% | 781 -39% | 802 -37% |
| Score Write (Points) | 2063 | 388 -81% | 1328 -36% | 1071 -48% | 660 -68% |
| Score Total (Points) | 3970 | 2583 -35% | 3059 -23% | 2251 -43% | 1822 -54% |
| Copy ISO MB/s (MB/s) | 1644 | 1293 -21% | 1459 -11% | 1962 19% | |
| Copy Program MB/s (MB/s) | 920 | 560 -39% | 600 -35% | 522 -43% | |
| Copy Game MB/s (MB/s) | 1725 | 927 -46% | 1411 -18% | 1258 -27% | |
| CrystalDiskMark 5.2 / 6 | -10% | 25% | -12% | 4% | |
| Write 4K (MB/s) | 82.2 | 106.7 30% | 161.8 97% | 129.5 58% | 139.6 70% |
| Read 4K (MB/s) | 45.7 | 49.94 9% | 60.6 33% | 54 18% | 37.3 -18% |
| Write Seq (MB/s) | 2000 | 1223 -39% | 2209 10% | 1265 -37% | 1827 -9% |
| Read Seq (MB/s) | 2206 | 1801 -18% | 2473 12% | 1410 -36% | 2253 2% |
| Write 4K Q32T1 (MB/s) | 451.2 | 325.3 -28% | 514 14% | 420.3 -7% | 467.9 4% |
| Read 4K Q32T1 (MB/s) | 351 | 551 57% | 586 67% | 357.7 2% | 366.7 4% |
| Write Seq Q32T1 (MB/s) | 2982 | 1224 -59% | 2205 -26% | 1799 -40% | 2349 -21% |
| Read Seq Q32T1 (MB/s) | 3529 | 2350 -33% | 3352 -5% | 1616 -54% | 3540 0% |
| Totalt genomsnitt (program/inställningar) | -45% /
-55% | 12% /
10% | -20% /
-22% | -9% /
-12% |
* ... mindre är bättre

DiskSpd Read Loop, Queue Depth 8
| 3DMark 11 Performance | 7067 poäng | |
| 3DMark Cloud Gate Standard Score | 17116 poäng | |
| 3DMark Fire Strike Score | 4769 poäng | |
| 3DMark Time Spy Score | 1718 poäng | |
Hjälp | ||
| låg | med. | hög | ultra | |
|---|---|---|---|---|
| The Witcher 3 (2015) | 77.6 | 50.9 | 30.1 | 13.6 |
| Dota 2 Reborn (2015) | 83.6 | 65.5 | 53 | 46.6 |
| Final Fantasy XV Benchmark (2018) | 41.2 | 22.8 | 17.6 | |
| X-Plane 11.11 (2018) | 46.6 | 34.7 | 31.3 |
| HP Spectre x360 14t-ea000 Iris Xe G7 96EUs, i7-1165G7, Samsung SSD PM981a MZVLB512HBJQ | HP Spectre x360 13-aw0013dx Iris Plus Graphics G7 (Ice Lake 64 EU), i7-1065G7, Intel Optane Memory H10 with Solid State Storage 32GB + 512GB HBRPEKNX0202A(L/H) | Dell XPS 13 7390 2-in-1 Core i7 Iris Plus Graphics G7 (Ice Lake 64 EU), i7-1065G7, Toshiba BG4 KBG40ZPZ512G | Huawei MateBook 14 2020 Intel GeForce MX350, i7-10510U, Lite-On CA5-8D512 | Lenovo Yoga 9i 14ITL5 Iris Xe G7 80EUs, i5-1135G7, Samsung SSD PM981a MZVLB256HBHQ | |
|---|---|---|---|---|---|
| Noise | -4% | -11% | -12% | -8% | |
| av / miljö * (dB) | 25.8 | 28.5 -10% | 28.1 -9% | 29.3 -14% | 26.3 -2% |
| Idle Minimum * (dB) | 25.9 | 28.5 -10% | 28.1 -8% | 29.3 -13% | 26.3 -2% |
| Idle Average * (dB) | 25.9 | 28.5 -10% | 28.1 -8% | 29.3 -13% | 26.3 -2% |
| Idle Maximum * (dB) | 25.9 | 28.5 -10% | 28.1 -8% | 30.8 -19% | 26.3 -2% |
| Load Average * (dB) | 26.4 | 28.5 -8% | 31.7 -20% | 35.7 -35% | 34.1 -29% |
| Witcher 3 ultra * (dB) | 36.9 | 35.3 4% | 43.4 -18% | 35.7 3% | 43.4 -18% |
| Load Maximum * (dB) | 41.5 | 35.3 15% | 43.4 -5% | 37.9 9% | 43.3 -4% |
* ... mindre är bättre
Ljudnivå
| Låg belastning |
| 25.9 / 25.9 / 25.9 dB(A) |
| Hög belastning |
| 26.4 / 41.5 dB(A) |
 | ||
30 dB tyst 40 dB(A) hörbar 50 dB(A) högt ljud |
||
min: | ||
(±) Den maximala temperaturen på ovansidan är 40.4 °C / 105 F, jämfört med genomsnittet av 35.4 °C / 96 F , allt från 19.6 till 60 °C för klassen Convertible.
(-) Botten värms upp till maximalt 52.8 °C / 127 F, jämfört med genomsnittet av 36.9 °C / 98 F
(+) Vid tomgångsbruk är medeltemperaturen för ovansidan 25 °C / 77 F, jämfört med enhetsgenomsnittet på 30.3 °C / ### class_avg_f### F.
(+) Handledsstöden och pekplattan är kallare än hudtemperaturen med maximalt 27.6 °C / 81.7 F och är därför svala att ta på.
(±) Medeltemperaturen för handledsstödsområdet på liknande enheter var 28 °C / 82.4 F (+0.4 °C / 0.7 F).
HP Spectre x360 14t-ea000 ljudanalys
(±) | högtalarljudstyrkan är genomsnittlig men bra (79.6 dB)
Bas 100 - 315 Hz
(±) | reducerad bas - i genomsnitt 11.6% lägre än medianen
(±) | linjäriteten för basen är genomsnittlig (10.5% delta till föregående frekvens)
Mellan 400 - 2000 Hz
(+) | balanserad mellan - endast 3.2% från medianen
(+) | mids är linjära (4% delta till föregående frekvens)
Högsta 2 - 16 kHz
(+) | balanserade toppar - endast 2.8% från medianen
(+) | toppar är linjära (5.3% delta till föregående frekvens)
Totalt 100 - 16 000 Hz
(+) | det totala ljudet är linjärt (12.3% skillnad mot median)
Jämfört med samma klass
» 14% av alla testade enheter i den här klassen var bättre, 3% liknande, 83% sämre
» Den bästa hade ett delta på 6%, genomsnittet var 20%, sämst var 57%
Jämfört med alla testade enheter
» 10% av alla testade enheter var bättre, 3% liknande, 87% sämre
» Den bästa hade ett delta på 4%, genomsnittet var 23%, sämst var 134%
Apple MacBook 12 (Early 2016) 1.1 GHz ljudanalys
(+) | högtalare kan spela relativt högt (83.6 dB)
Bas 100 - 315 Hz
(±) | reducerad bas - i genomsnitt 11.3% lägre än medianen
(±) | linjäriteten för basen är genomsnittlig (14.2% delta till föregående frekvens)
Mellan 400 - 2000 Hz
(+) | balanserad mellan - endast 2.4% från medianen
(+) | mids är linjära (5.5% delta till föregående frekvens)
Högsta 2 - 16 kHz
(+) | balanserade toppar - endast 2% från medianen
(+) | toppar är linjära (4.5% delta till föregående frekvens)
Totalt 100 - 16 000 Hz
(+) | det totala ljudet är linjärt (10.2% skillnad mot median)
Jämfört med samma klass
» 7% av alla testade enheter i den här klassen var bättre, 2% liknande, 90% sämre
» Den bästa hade ett delta på 5%, genomsnittet var 18%, sämst var 53%
Jämfört med alla testade enheter
» 5% av alla testade enheter var bättre, 1% liknande, 94% sämre
» Den bästa hade ett delta på 4%, genomsnittet var 23%, sämst var 134%
| Av/Standby | |
| Låg belastning | |
| Hög belastning |
|
Förklaring:
min: | |
| HP Spectre x360 14t-ea000 i7-1165G7, Iris Xe G7 96EUs, Samsung SSD PM981a MZVLB512HBJQ, IPS, 1920x1280, 13.5" | HP Spectre x360 13-aw0013dx i7-1065G7, Iris Plus Graphics G7 (Ice Lake 64 EU), Intel Optane Memory H10 with Solid State Storage 32GB + 512GB HBRPEKNX0202A(L/H), IPS, 1920x1080, 13.3" | Dell XPS 13 7390 2-in-1 Core i7 i7-1065G7, Iris Plus Graphics G7 (Ice Lake 64 EU), Toshiba BG4 KBG40ZPZ512G, IPS, 1920x1200, 13.4" | Huawei MateBook 14 2020 Intel i7-10510U, GeForce MX350, Lite-On CA5-8D512, IPS LED, 2160x1440, 14" | Asus Zenbook S UX393JA i7-1065G7, Iris Plus Graphics G7 (Ice Lake 64 EU), Intel SSD 660p 1TB SSDPEKNW010T8, IPS, 3300x2200, 13.9" | Lenovo Yoga 9i 14ITL5 i5-1135G7, Iris Xe G7 80EUs, Samsung SSD PM981a MZVLB256HBHQ, IPS, 1920x1080, 14" | |
|---|---|---|---|---|---|---|
| Power Consumption | -2% | -1% | -43% | -20% | -11% | |
| Idle Minimum * (Watt) | 3 | 3.9 -30% | 2.6 13% | 3 -0% | 4.1 -37% | 3.3 -10% |
| Idle Average * (Watt) | 5.1 | 6.3 -24% | 5.3 -4% | 9 -76% | 7.5 -47% | 6.7 -31% |
| Idle Maximum * (Watt) | 6.4 | 6.8 -6% | 7 -9% | 11 -72% | 8.5 -33% | 6.9 -8% |
| Load Average * (Watt) | 39.6 | 32.6 18% | 43.1 -9% | 60.8 -54% | 36.8 7% | 41.4 -5% |
| Witcher 3 ultra * (Watt) | 39.6 | 25.6 35% | 43.1 -9% | 56 -41% | 39.2 1% | 39.3 1% |
| Load Maximum * (Watt) | 56.2 | 59 -5% | 49 13% | 65.6 -17% | 61.6 -10% | 64.7 -15% |
* ... mindre är bättre
| HP Spectre x360 14t-ea000 i7-1165G7, Iris Xe G7 96EUs, 66 Wh | HP Spectre x360 13-aw0013dx i7-1065G7, Iris Plus Graphics G7 (Ice Lake 64 EU), 60 Wh | Dell XPS 13 7390 2-in-1 Core i7 i7-1065G7, Iris Plus Graphics G7 (Ice Lake 64 EU), 51 Wh | Huawei MateBook 14 2020 Intel i7-10510U, GeForce MX350, 56 Wh | Asus Zenbook S UX393JA i7-1065G7, Iris Plus Graphics G7 (Ice Lake 64 EU), 67 Wh | Lenovo Yoga 9i 14ITL5 i5-1135G7, Iris Xe G7 80EUs, 60 Wh | |
|---|---|---|---|---|---|---|
| Batteridrifttid | -0% | -24% | -5% | -4% | -14% | |
| Reader / Idle (h) | 36.4 | 37.1 2% | 38.4 5% | 37.7 4% | ||
| WiFi v1.3 (h) | 11.8 | 9.9 -16% | 9 -24% | 12.8 8% | 8.3 -30% | 9.9 -16% |
| Load (h) | 2.4 | 2.7 13% | 2 -17% | 2.7 13% | 1.7 -29% |
För
Emot
Läs den fullständiga versionen av den här recensionen på engelska här.
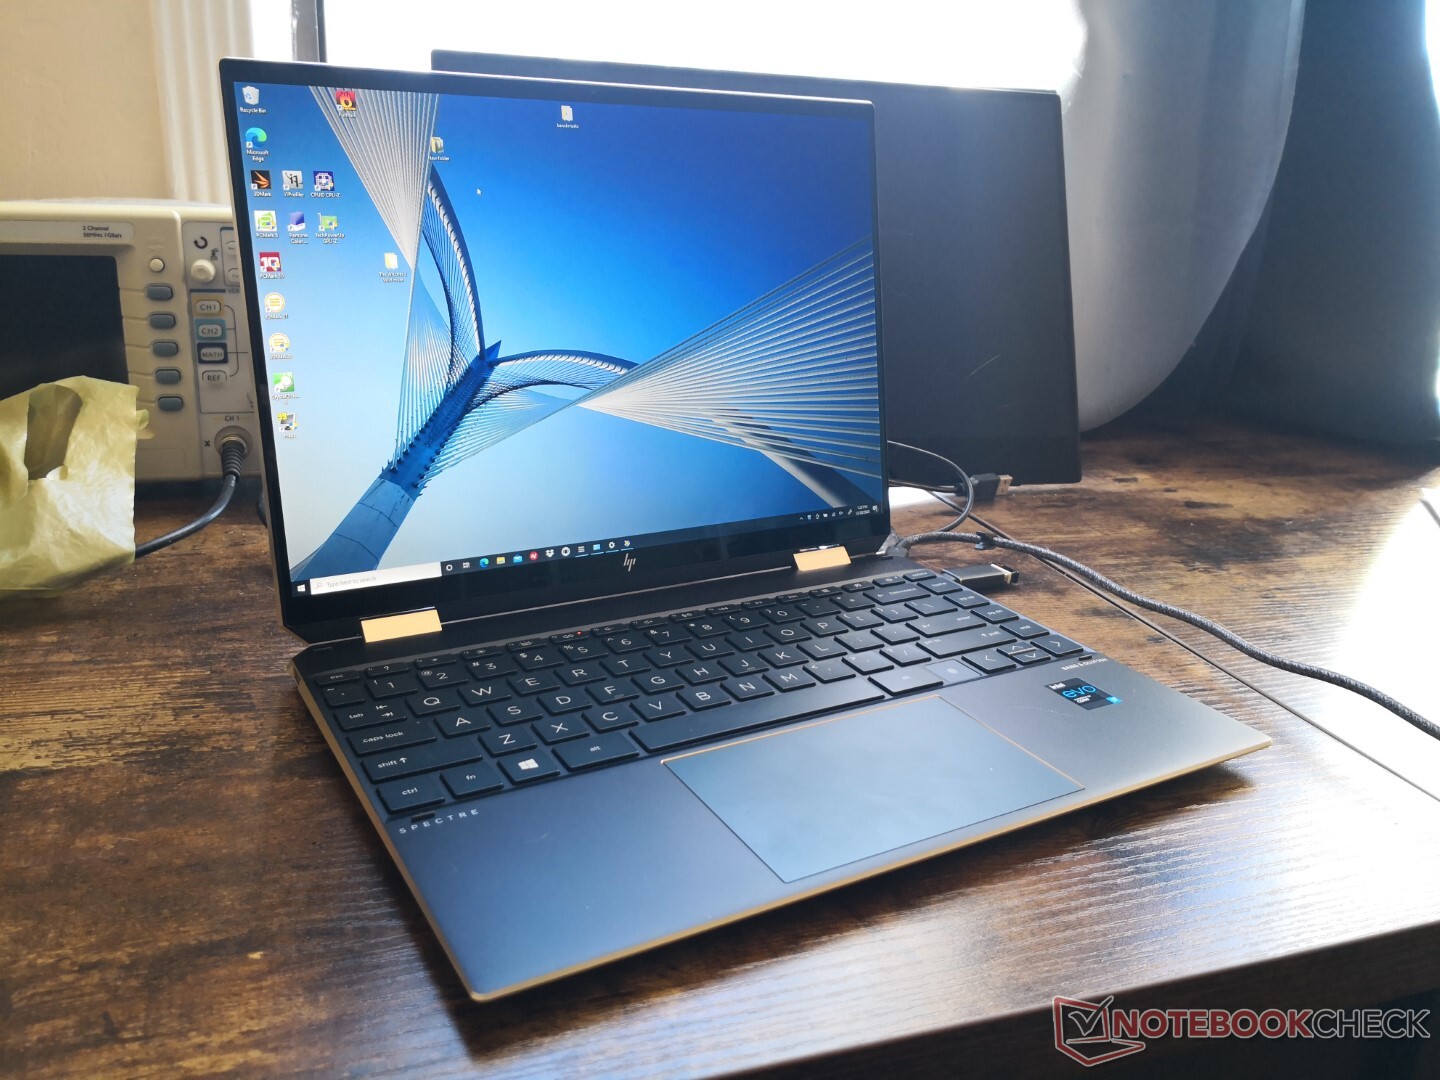
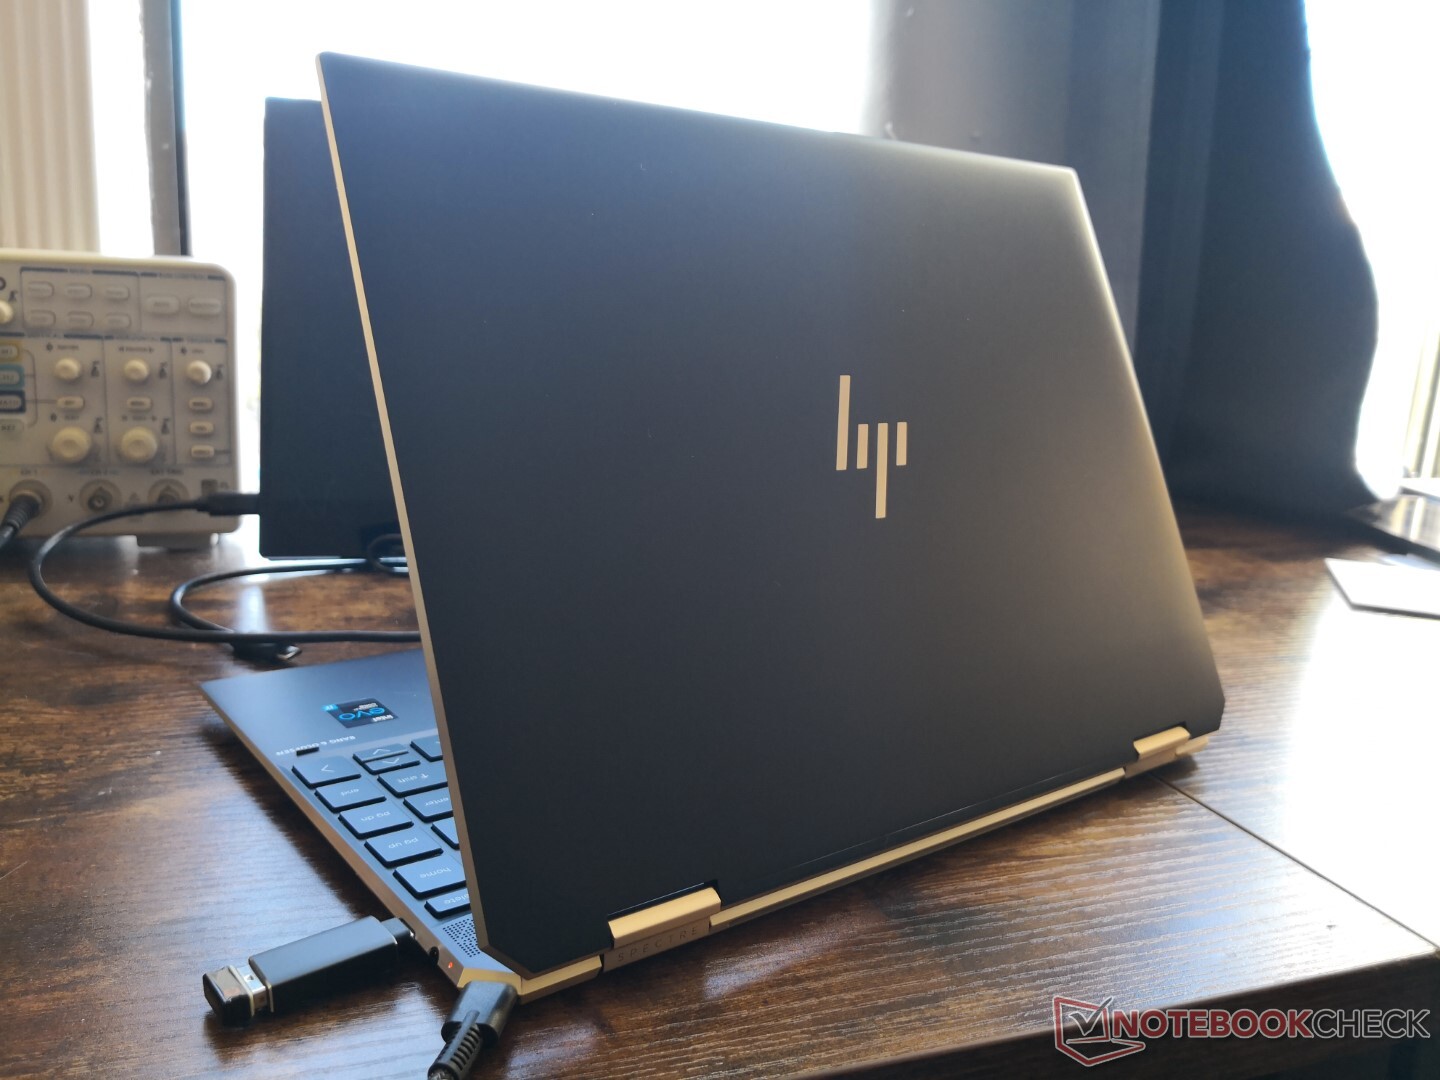
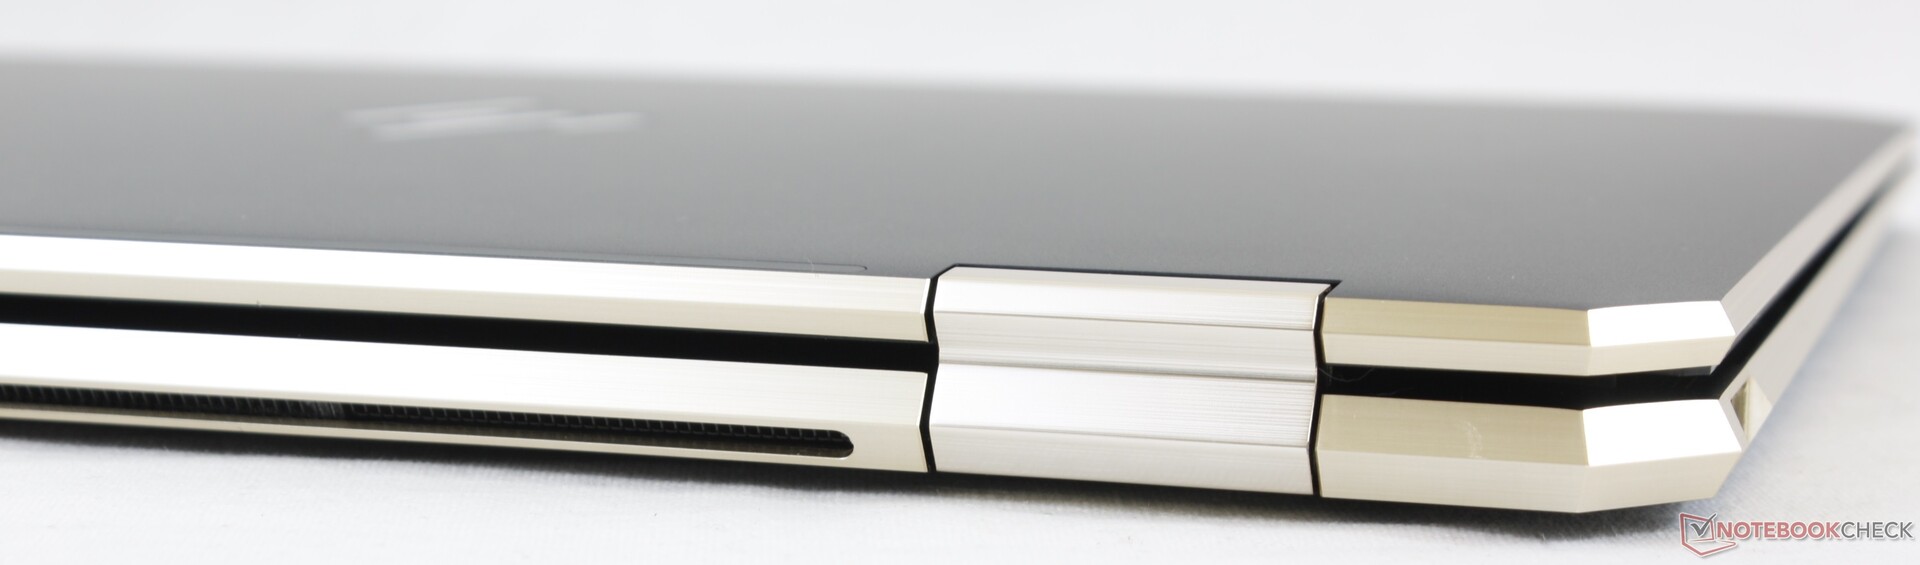
Det bästa med Spectre x360 14 är att den är en perfekt anpassning av Spectre x360 13. Nästan allt vi gillade med modellen på 13.3 tum finns oskatt på 13.5-tumsmodellen, inklusive utmärkt tangentbordsåterkoppling, en stark och tjusig metalldesign, en skärm med hög kontrast som täcker hela sRGB samt lång batteritid. Men det innebär också att systemet ärver många av nackdelarna Spectre x360 13 led av, som varierande CPU-klockfrekvenser, RAM som inte går att uppgradera av användaren, medelmåttigt fasta gångjärn i vissa vinklar samt långsamma svart-vita responstider. Det finns på så sätt fortfarande saker att förbättra.
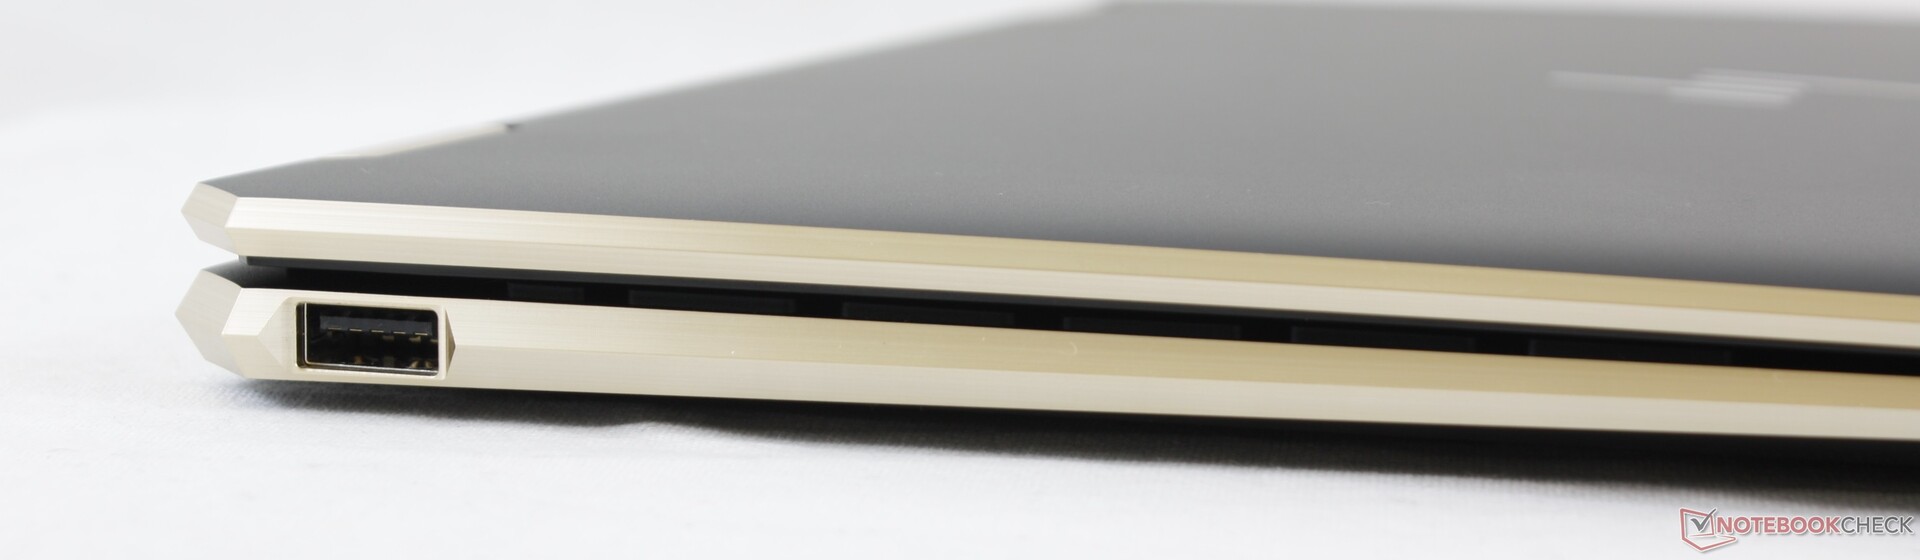
En del förändringar uppskattade vi inte. Spectre x360 13 hade WAN som tillval men detta saknas på Spectre x360. Och även om den större fingeravtrycksläsaren är lättare att använda kommer den på bekostnad av en Ctrl-knapp. Om du däremot inte använt någon av dessa saker är ändringarna inte något större problem.
Spectre x360 14 på 13.5 tum gör det svårt för 13.3-tummaren Spectre x360 13. Även om HP insisterar på att den förstnämnda inte kommer att ersätta den sista kan vi ändå tänka oss att Spectre x360 13 sakta kommer att fasas ut till fördel för Spectre x360 14 eftersom de båda är så lika. Om du är ute efter en Spectre rekommenderar vi modellen på 13.5 tum framför den på 13.3 tum helt enkelt för att den har en märkbart större skärm trots en marginell ökning av storlek och vikt.
HP:s senaste omvandlingsbara är snabbare än Dell XPS 13 med samma Core i7 CPU samtidigt som den har en större och, om du väljer till det, dubbelt så ljusstark skärm. Den har några få brister, men de är lätta att ha överseende med eftersom Spectre x360 14 är så välgjord och trevlig att arbeta med.
HP Spectre x360 14t-ea000
- 12/22/2020 v7 (old)
Allen Ngo
Price comparison
