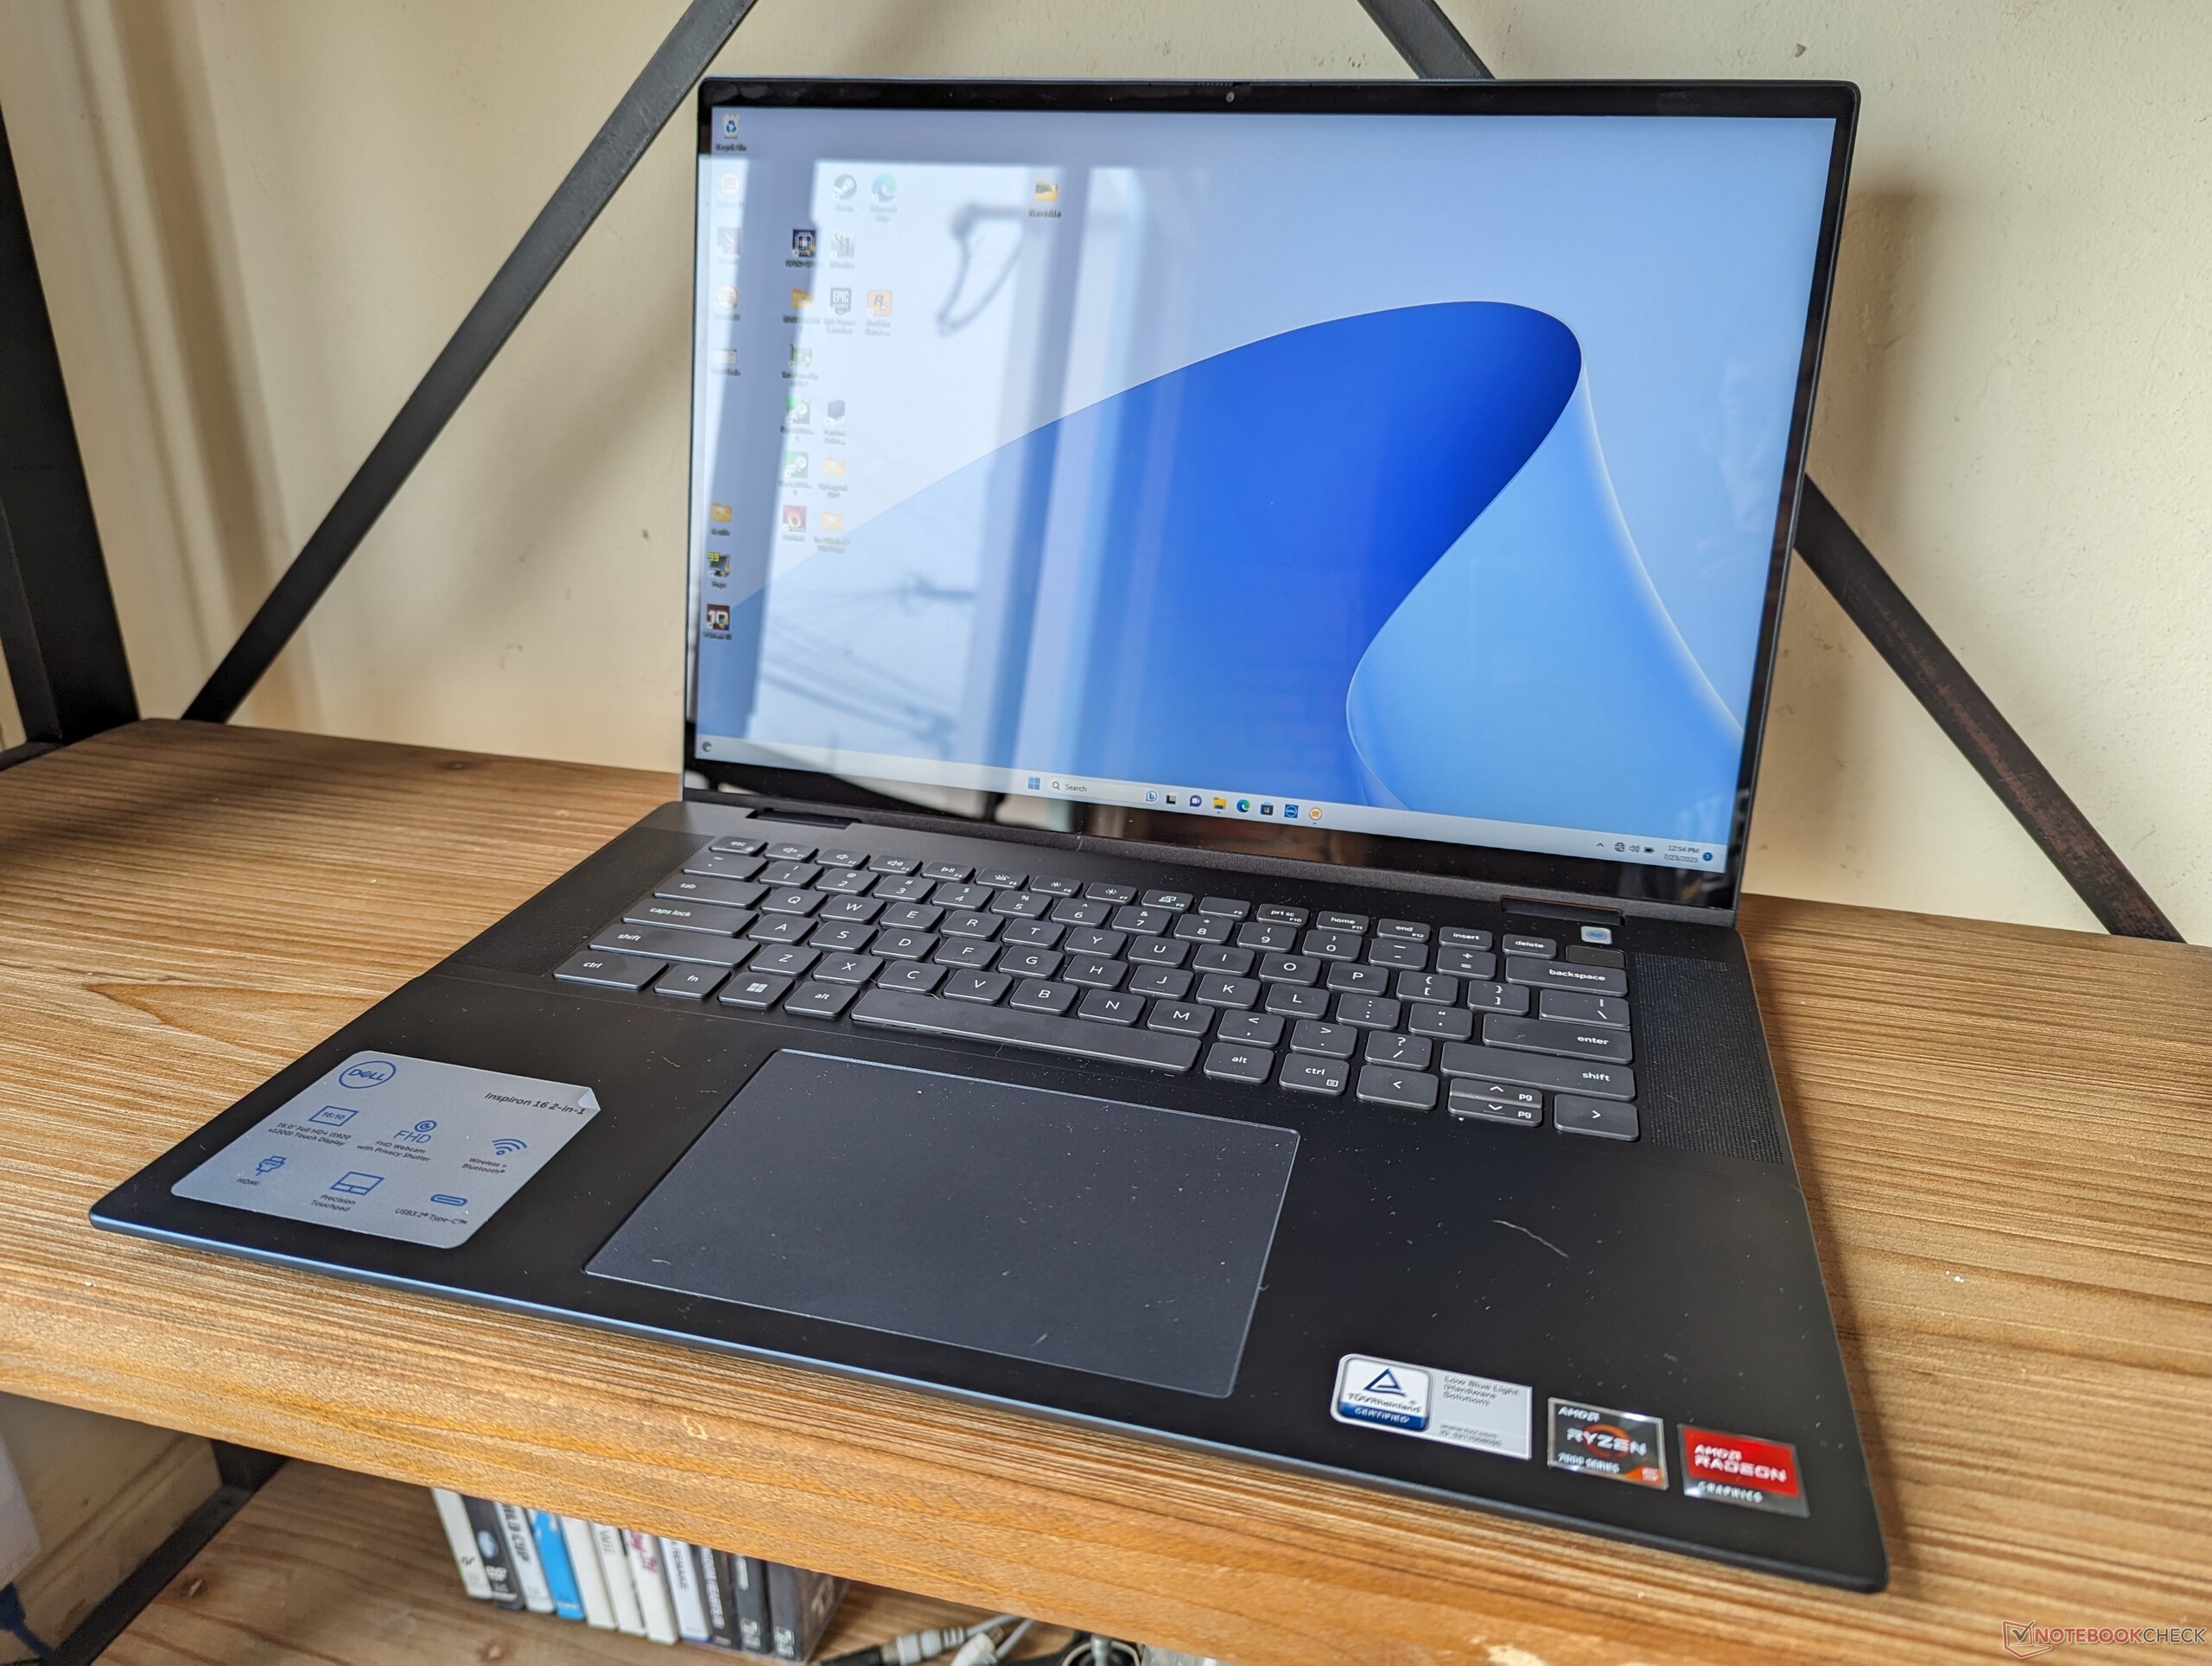
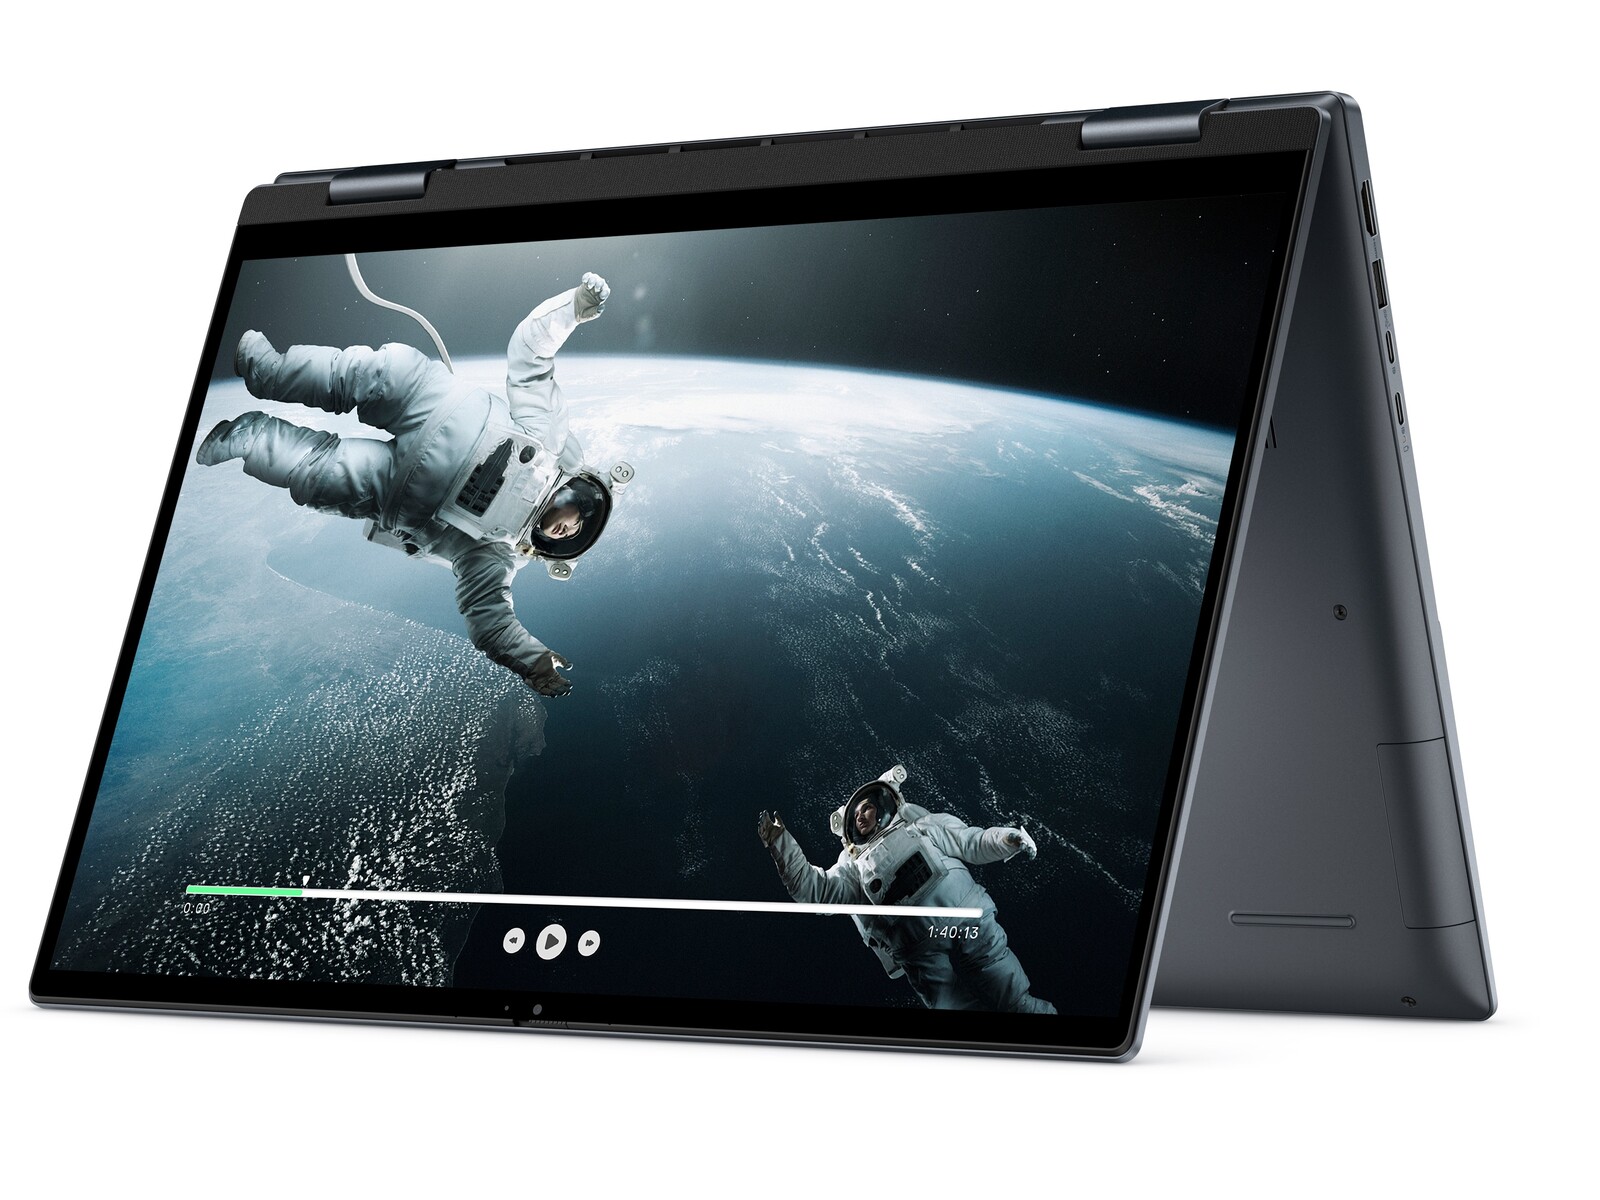
Dell Inspiron 16 7635 2-i-1 laptop recension: En urvattnad Inspiron 16 7630 med AMD Ryzen

Inspiron 16 7635 2-i-1 är AMD-versionen av den Intel-baserade Inspiron 16 7630 2-i-1. Precis som andra Inspiron-modeller riktar den sig till budget- och mellansegmentet i konsumentkategorin, till skillnad från den mer avancerade affärscentrerade Latitude eller prosumer XPS-serien. Den är en direkt efterföljare till förra årets Inspiron 16 7620 2-i-1 med både nya processorer och en reviderad yttre design.
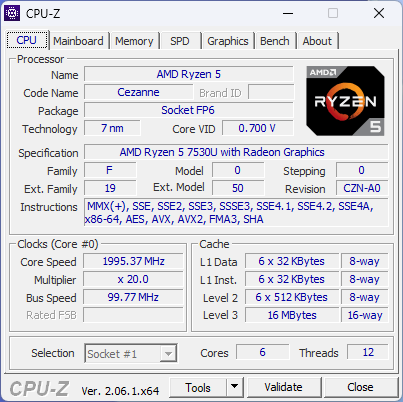
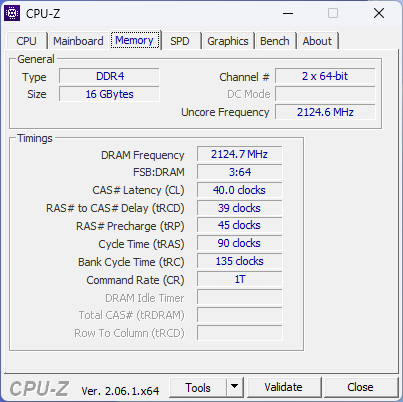
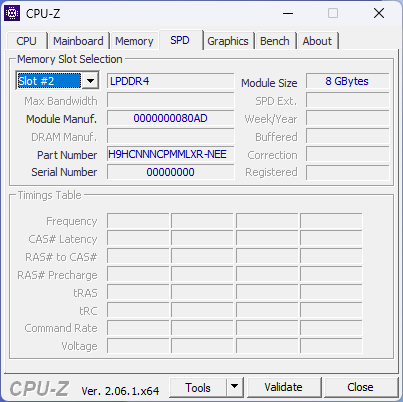
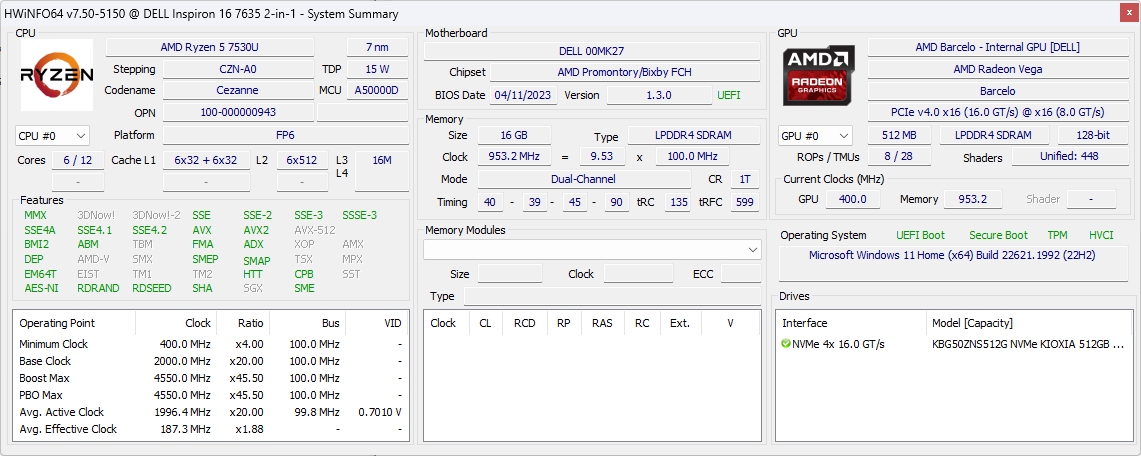
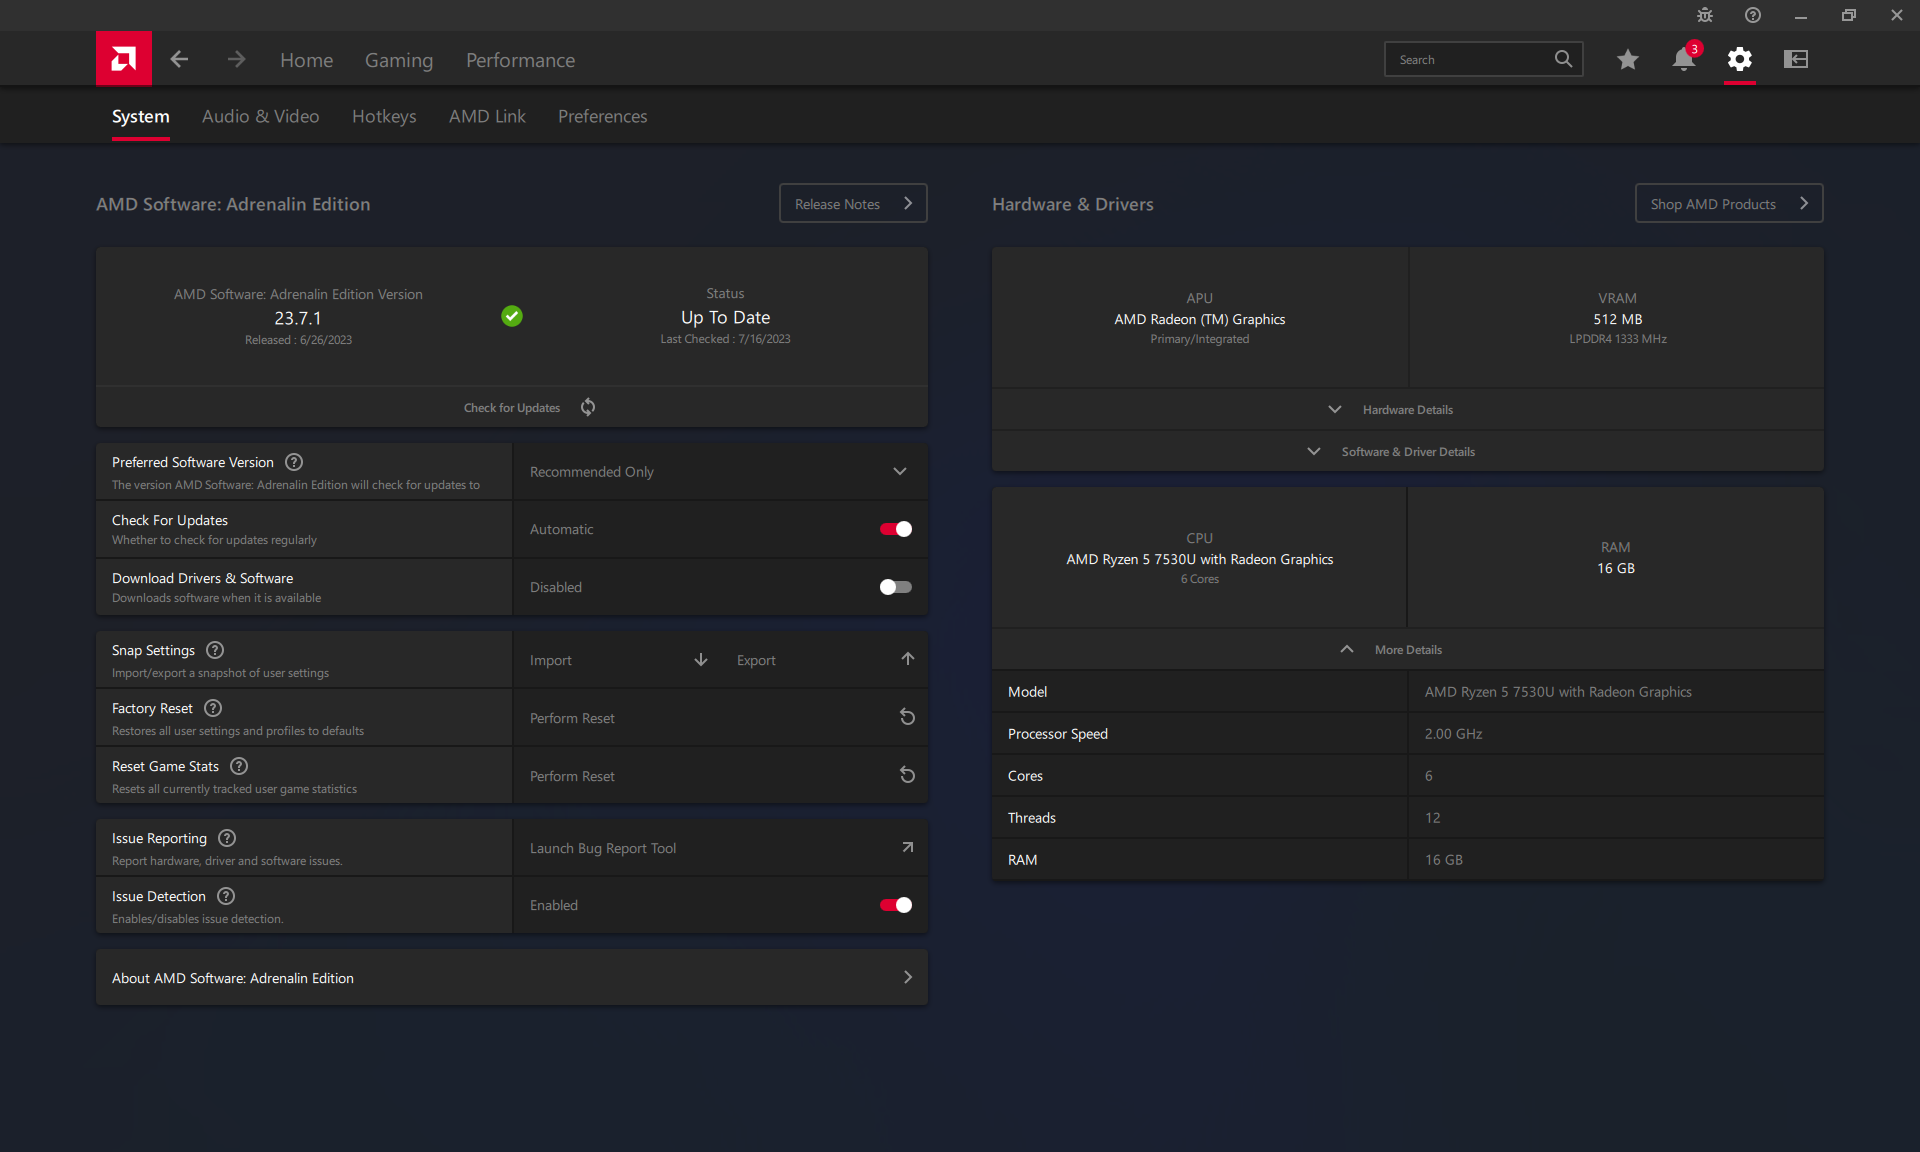
Vår specifika testenhet är en lägre konfiguration med Zen 3 Ryzen 5 7530U CPU, 16 GB lödd LPDDR4x 4266 MHz RAM och 512 GB NVMe SSD för cirka 900 USD i detaljhandel. Ett mer avancerat Ryzen 7 7730U-alternativ finns tillgängligt, men alla AMD SKU:er levereras för närvarande med samma 1200p IPS-panel medan Intel-versionen har ett dyrare 2400p OLED-alternativ.
Alternativ till Inspiron 16 7635 2-i-1 inkluderar andra stora konvertibla bärbara datorer som Lenovo Flex 5 16 eller den mer kraftfulla MSI Summit E16 Flipeller HP Spectre x360 16.
Fler recensioner av Dell:
Potentiella konkurrenter i jämförelse
Gradering | Datum | Modell | Vikt | Höjd | Storlek | Upplösning | Pris |
|---|---|---|---|---|---|---|---|
| 84.6 % v7 (old) | 07/2023 | Dell Inspiron 16 7635 2-in-1 R5 7530U, Vega 7 | 2 kg | 18.99 mm | 16.00" | 1920x1200 | |
| 87.5 % v7 (old) | 06/2023 | Acer Swift Edge SFE16-42-R1GM R7 7735U, Radeon 680M | 1.2 kg | 13.95 mm | 16.00" | 3840x2400 | |
| 85.8 % v7 (old) | 05/2023 | Lenovo Yoga 7 16IRL8 i7-1355U, Iris Xe G7 96EUs | 2 kg | 16.99 mm | 16.00" | 1920x1200 | |
| 85.6 % v7 (old) | 05/2023 | Samsung Galaxy Book3 Pro 16 i5-1340P, Iris Xe G7 80EUs | 1.6 kg | 12.5 mm | 16.00" | 2880x1800 | |
| 80.7 % v7 (old) | 04/2023 | Lenovo IdeaPad Flex 5 16ABR G8 R7 7730U, Vega 8 | 2 kg | 18.7 mm | 16.00" | 1920x1200 | |
| 85.7 % v7 (old) | 06/2022 | Dell Inspiron 16 7620 2-in-1 i7-1260P, Iris Xe G7 96EUs | 2.1 kg | 18.41 mm | 16.00" | 1920x1200 |
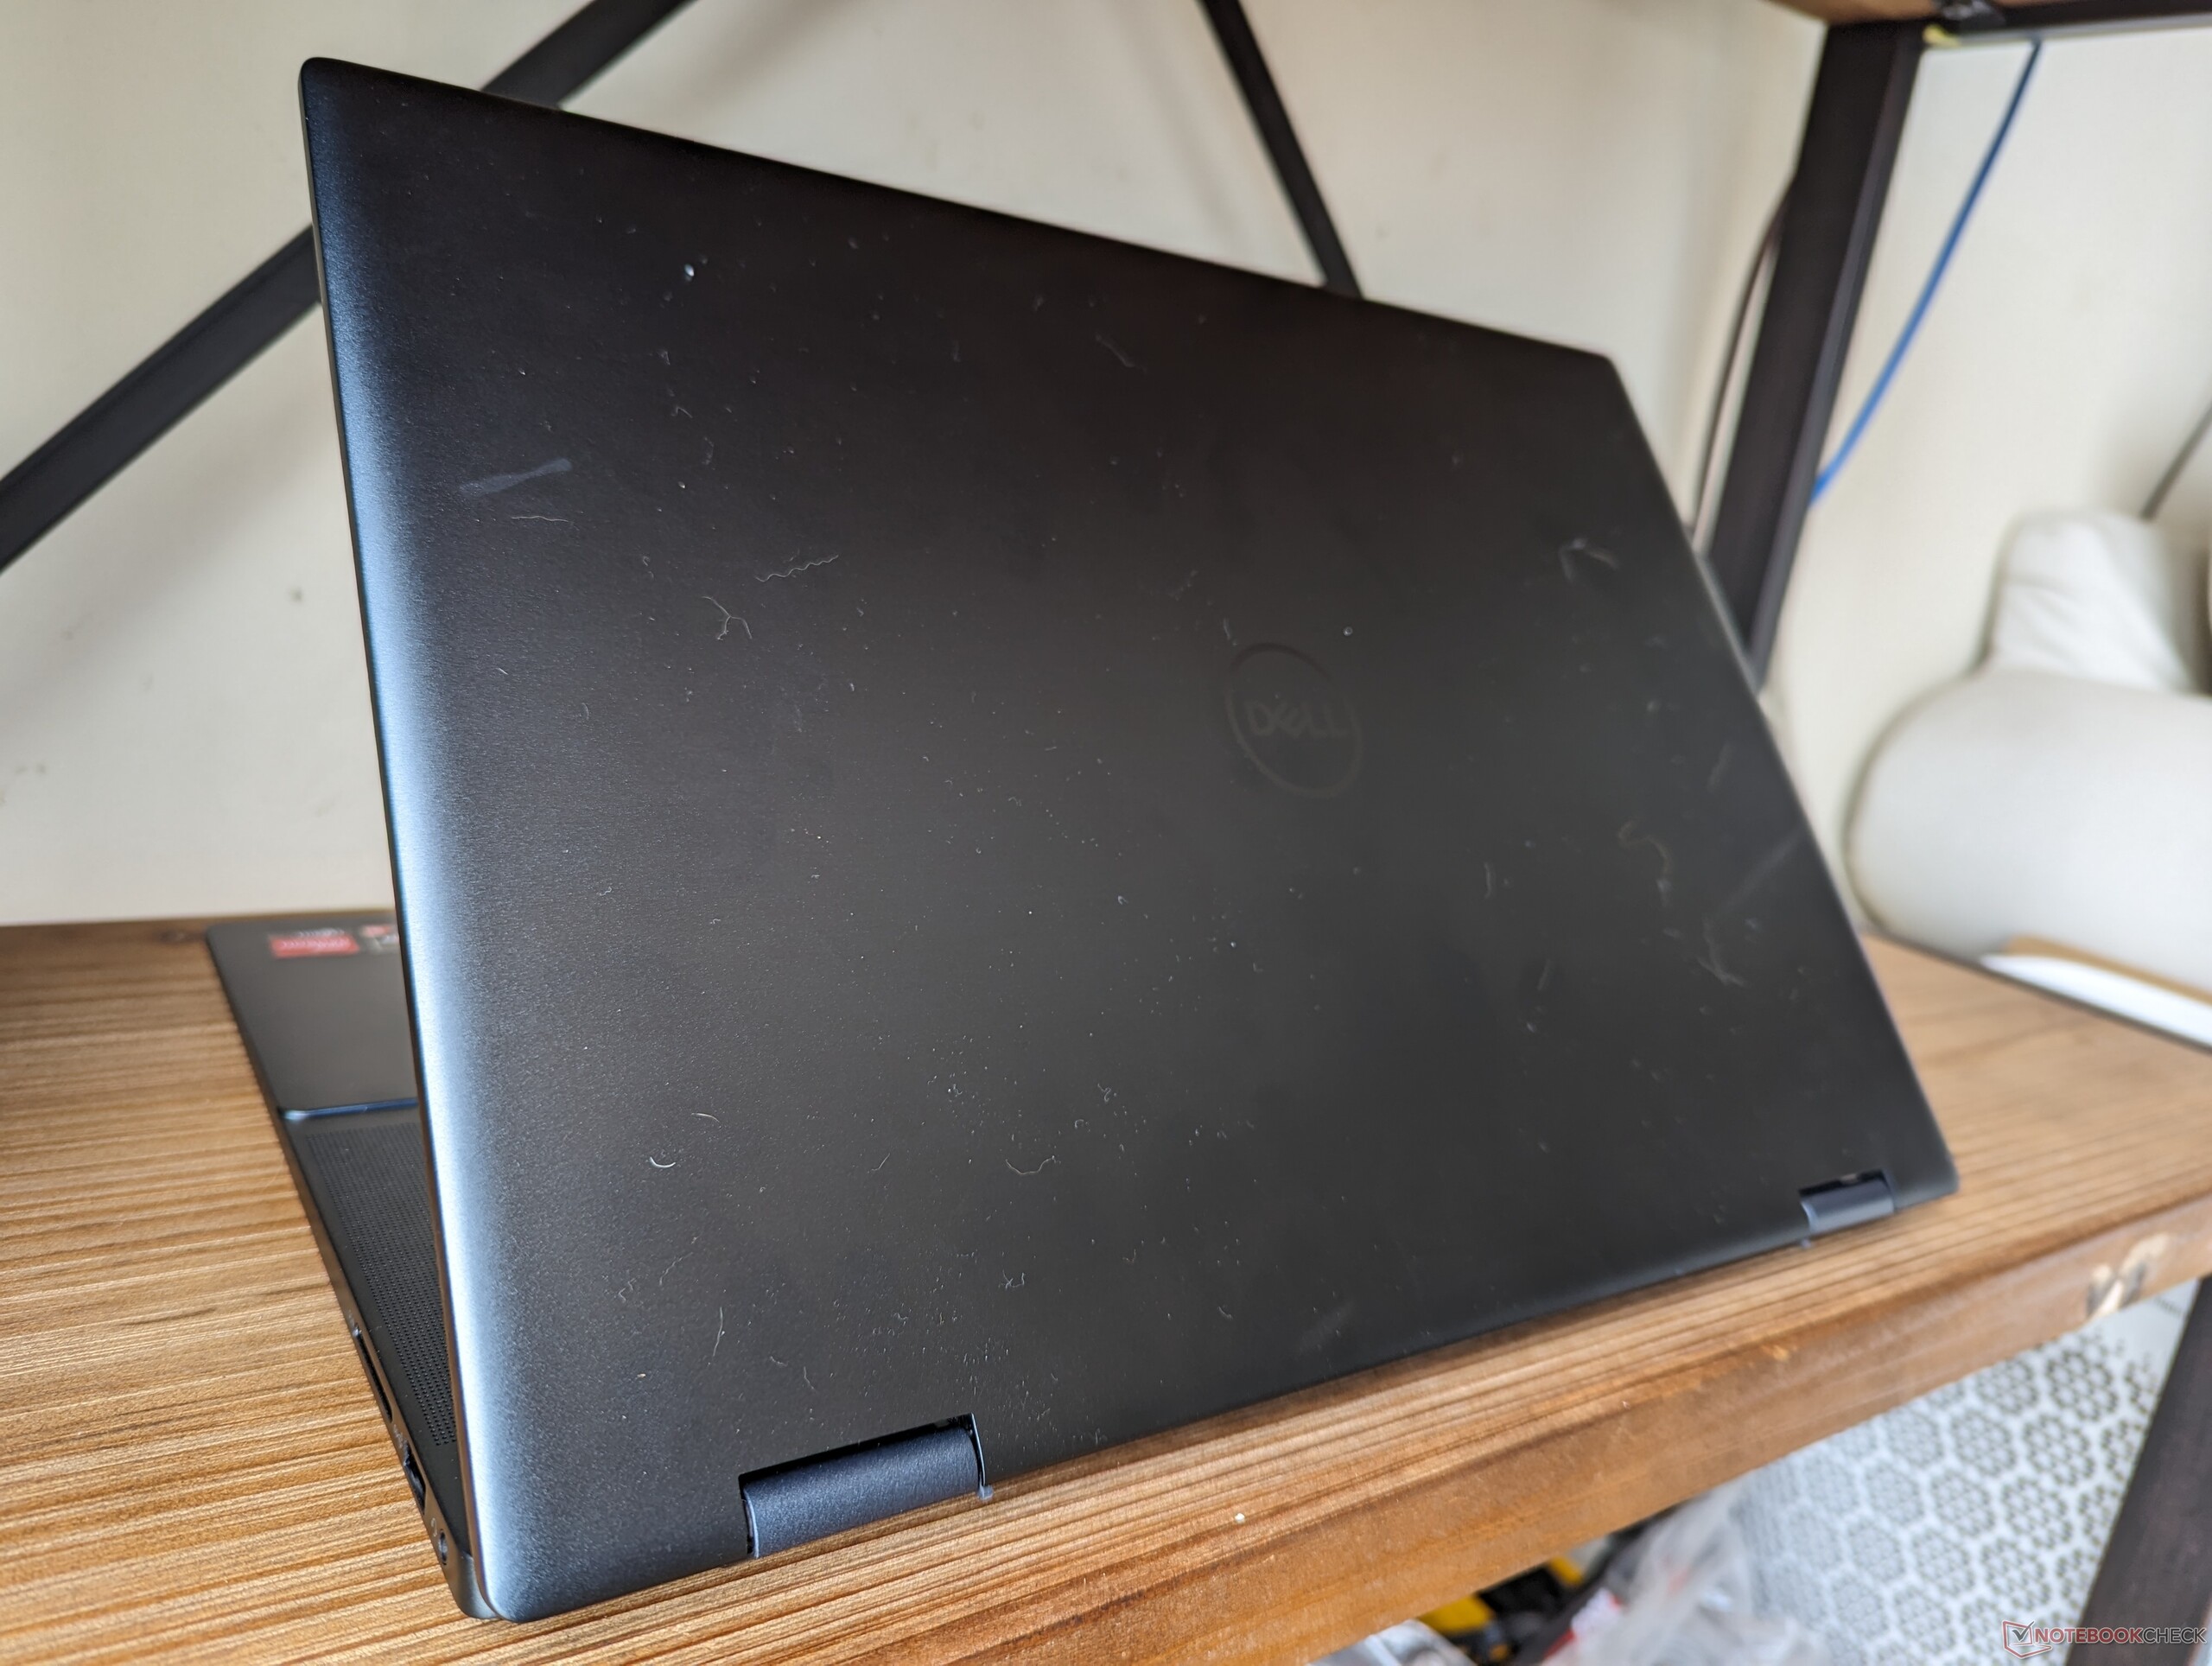
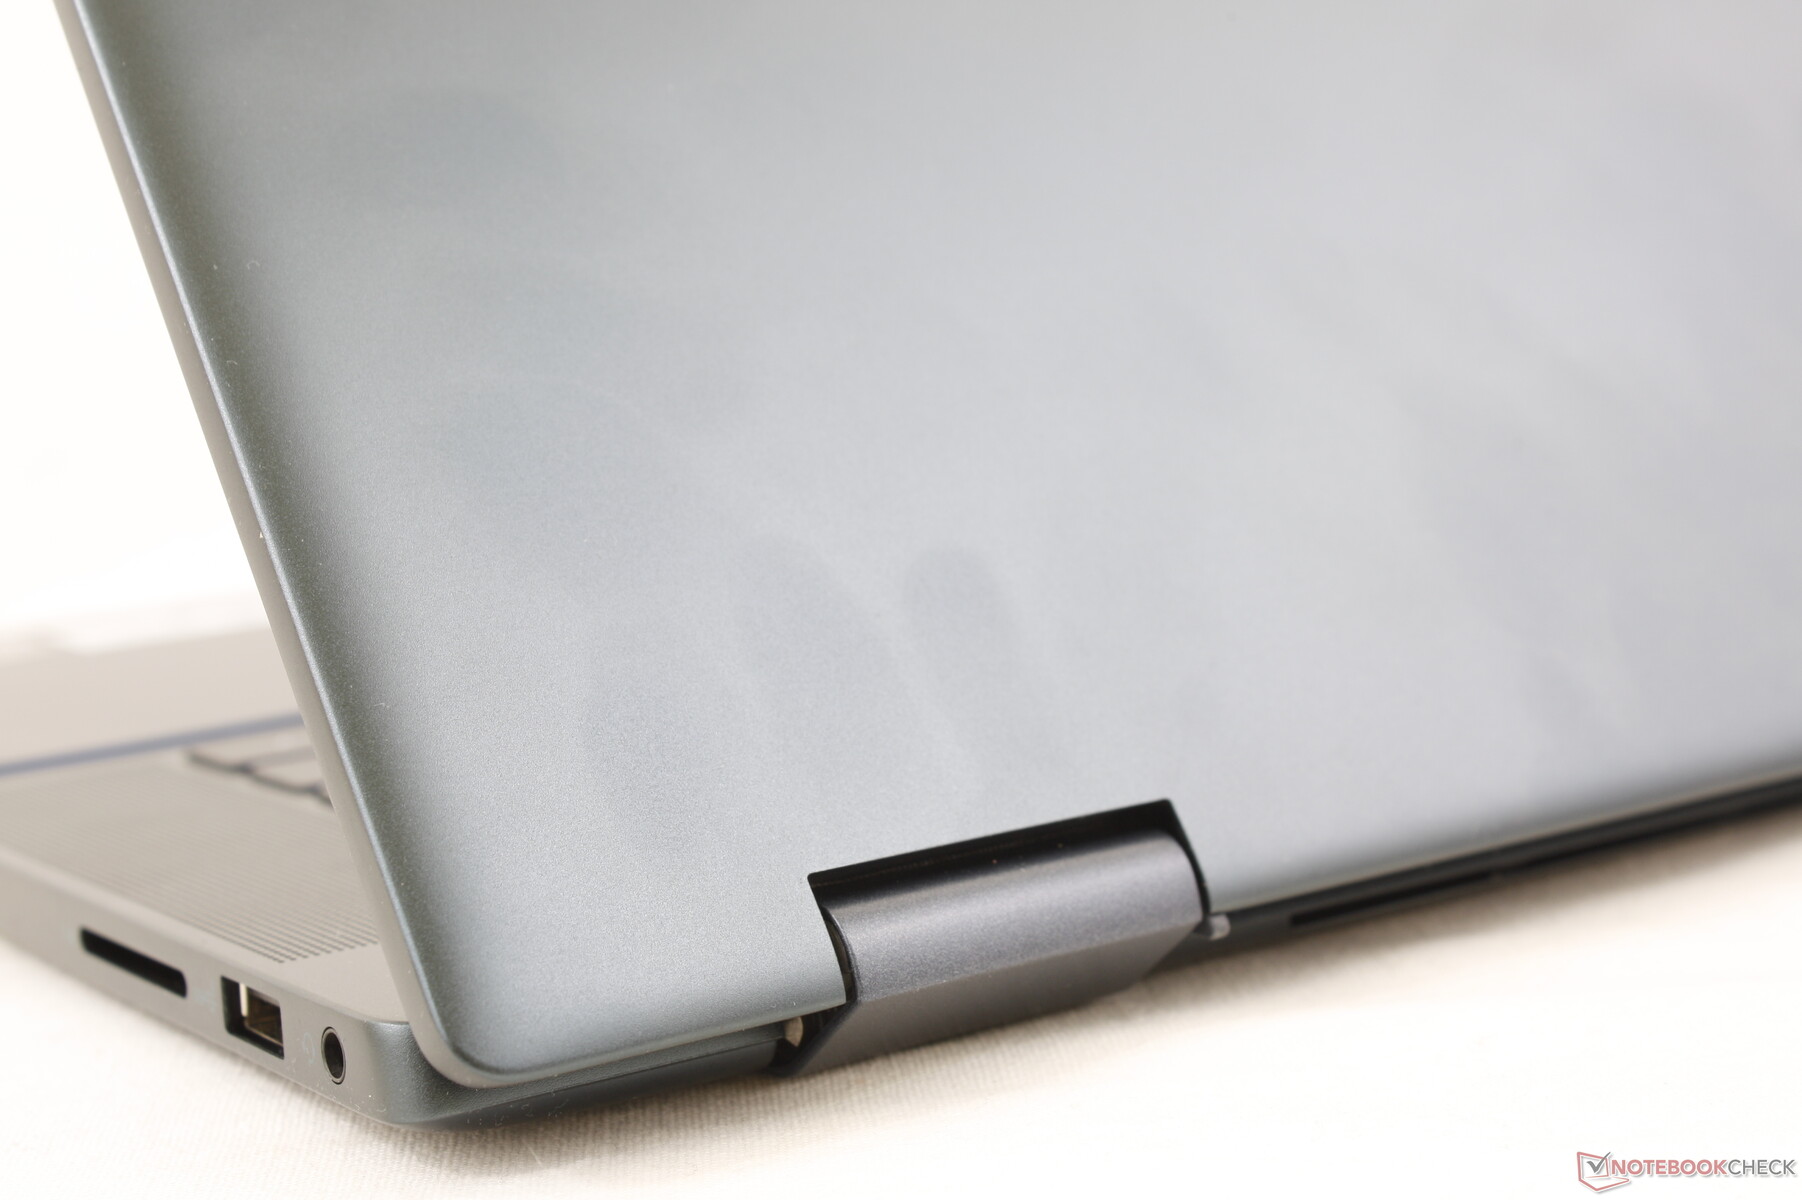
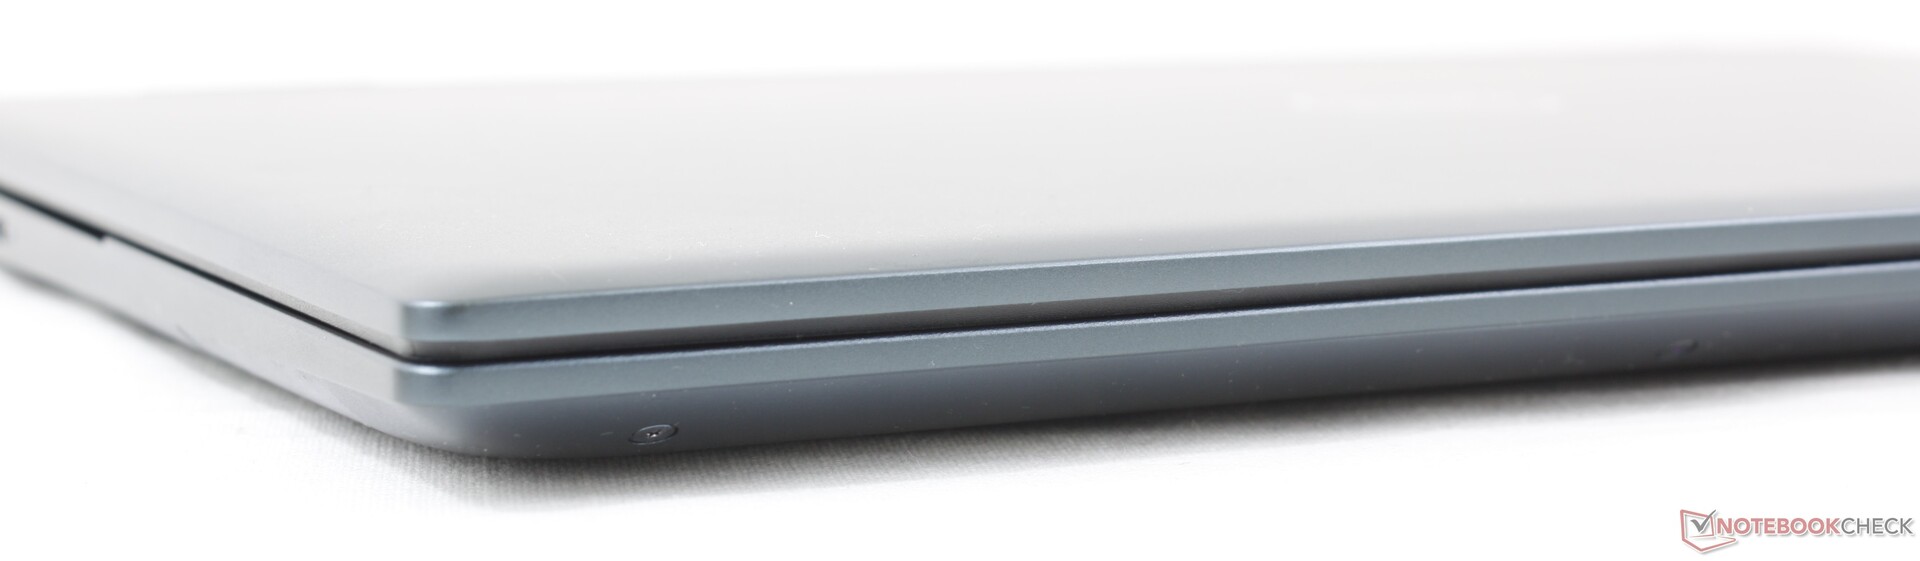
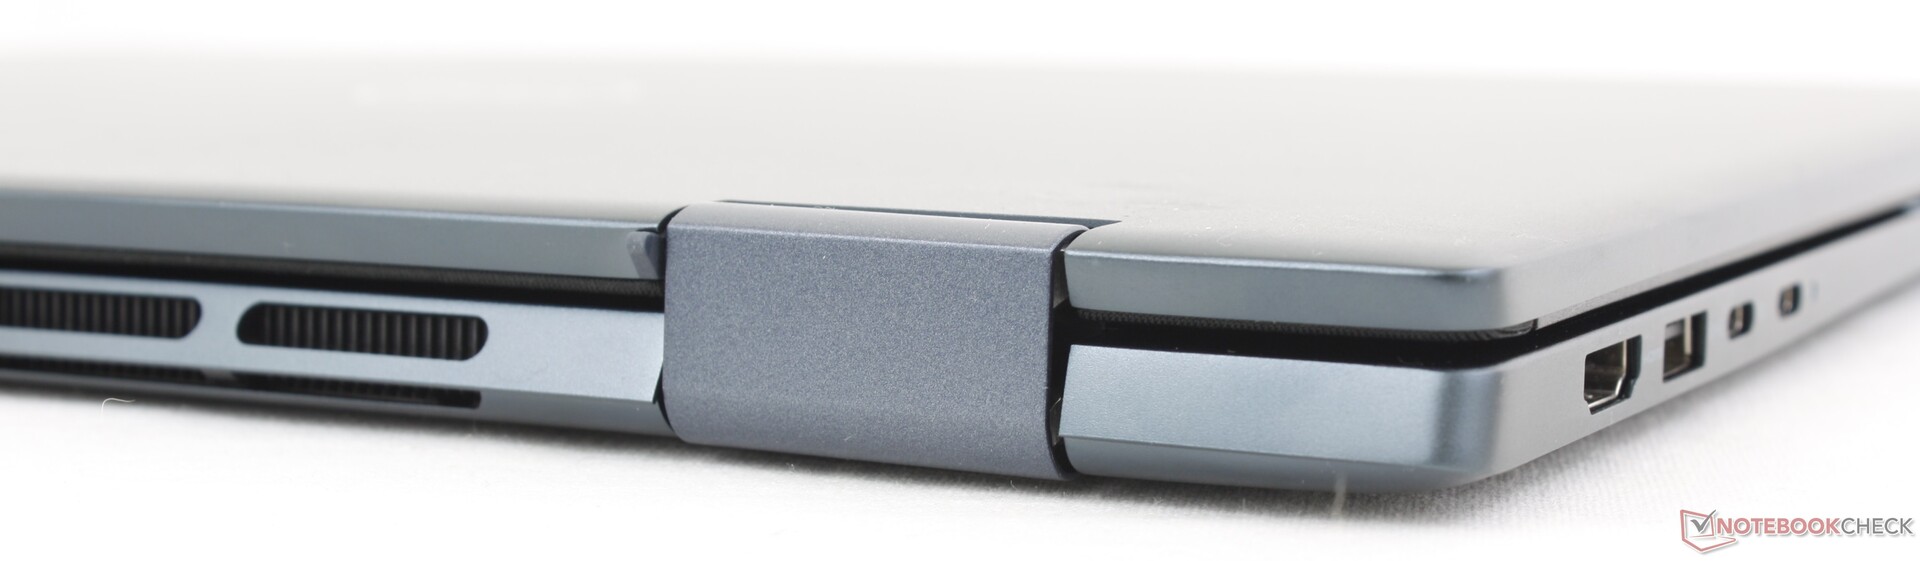
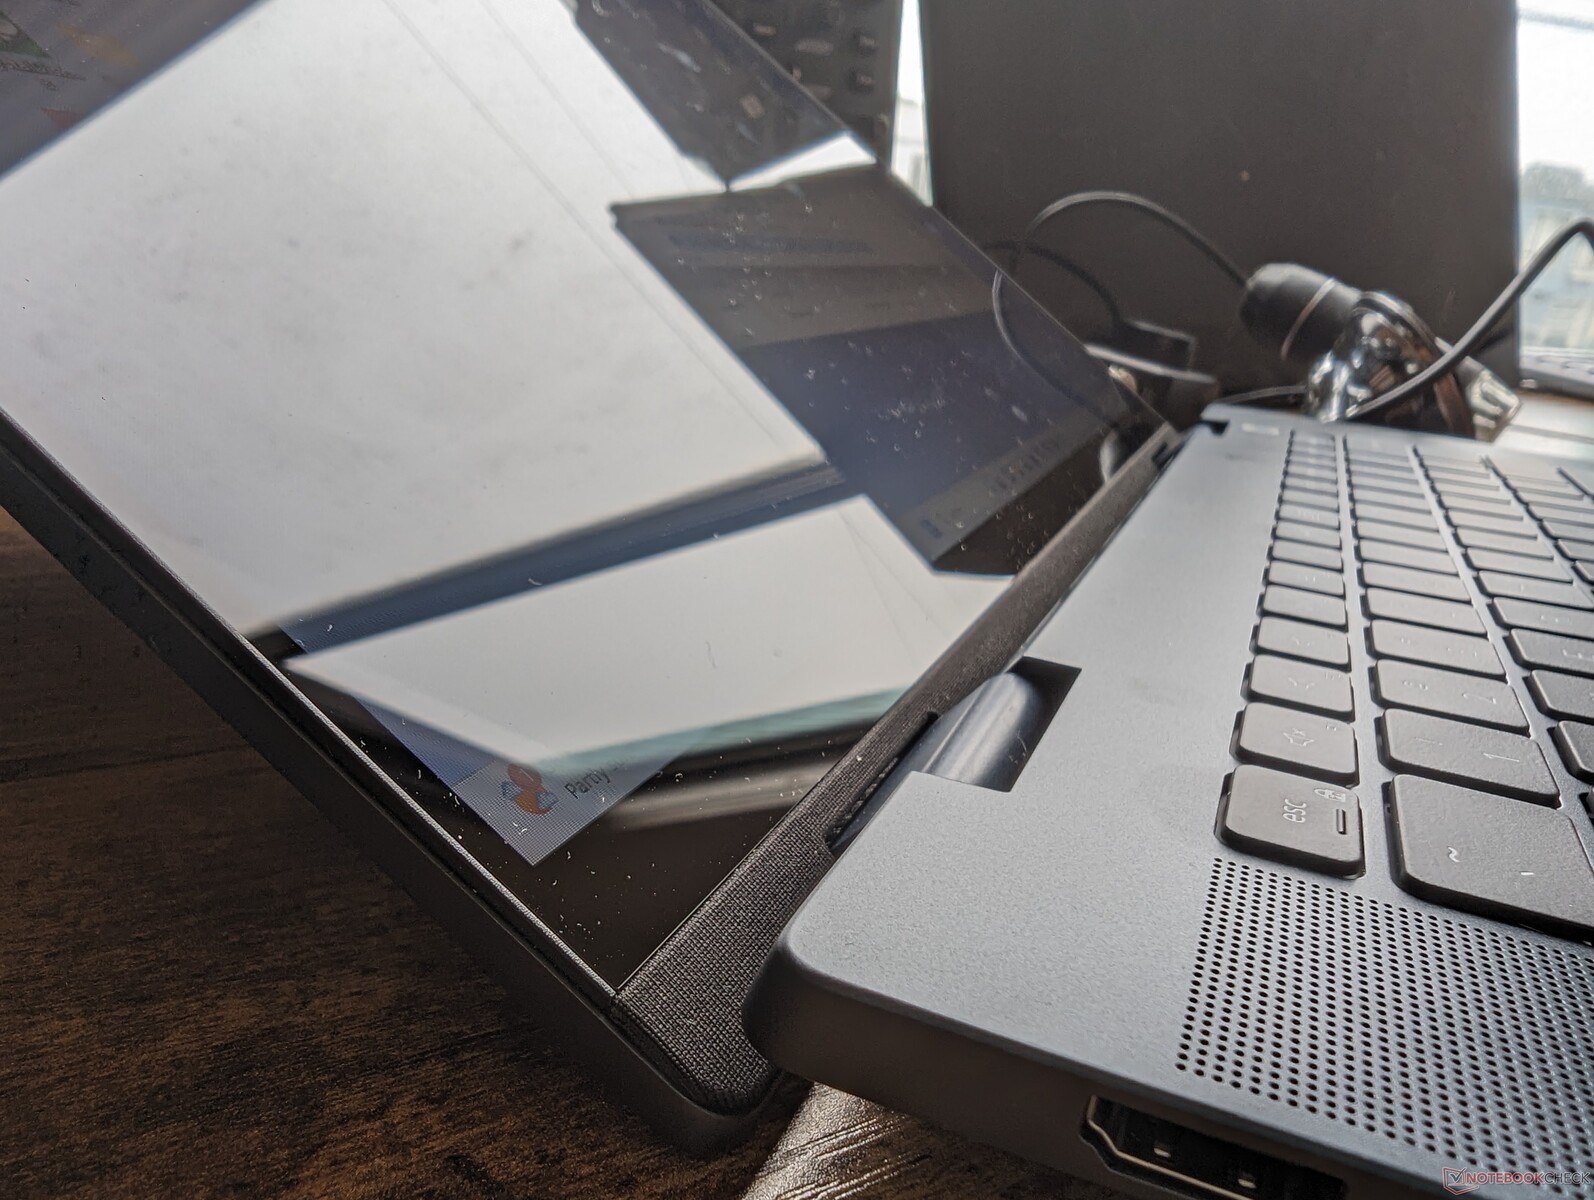
Case - Tyst droppande Mylar
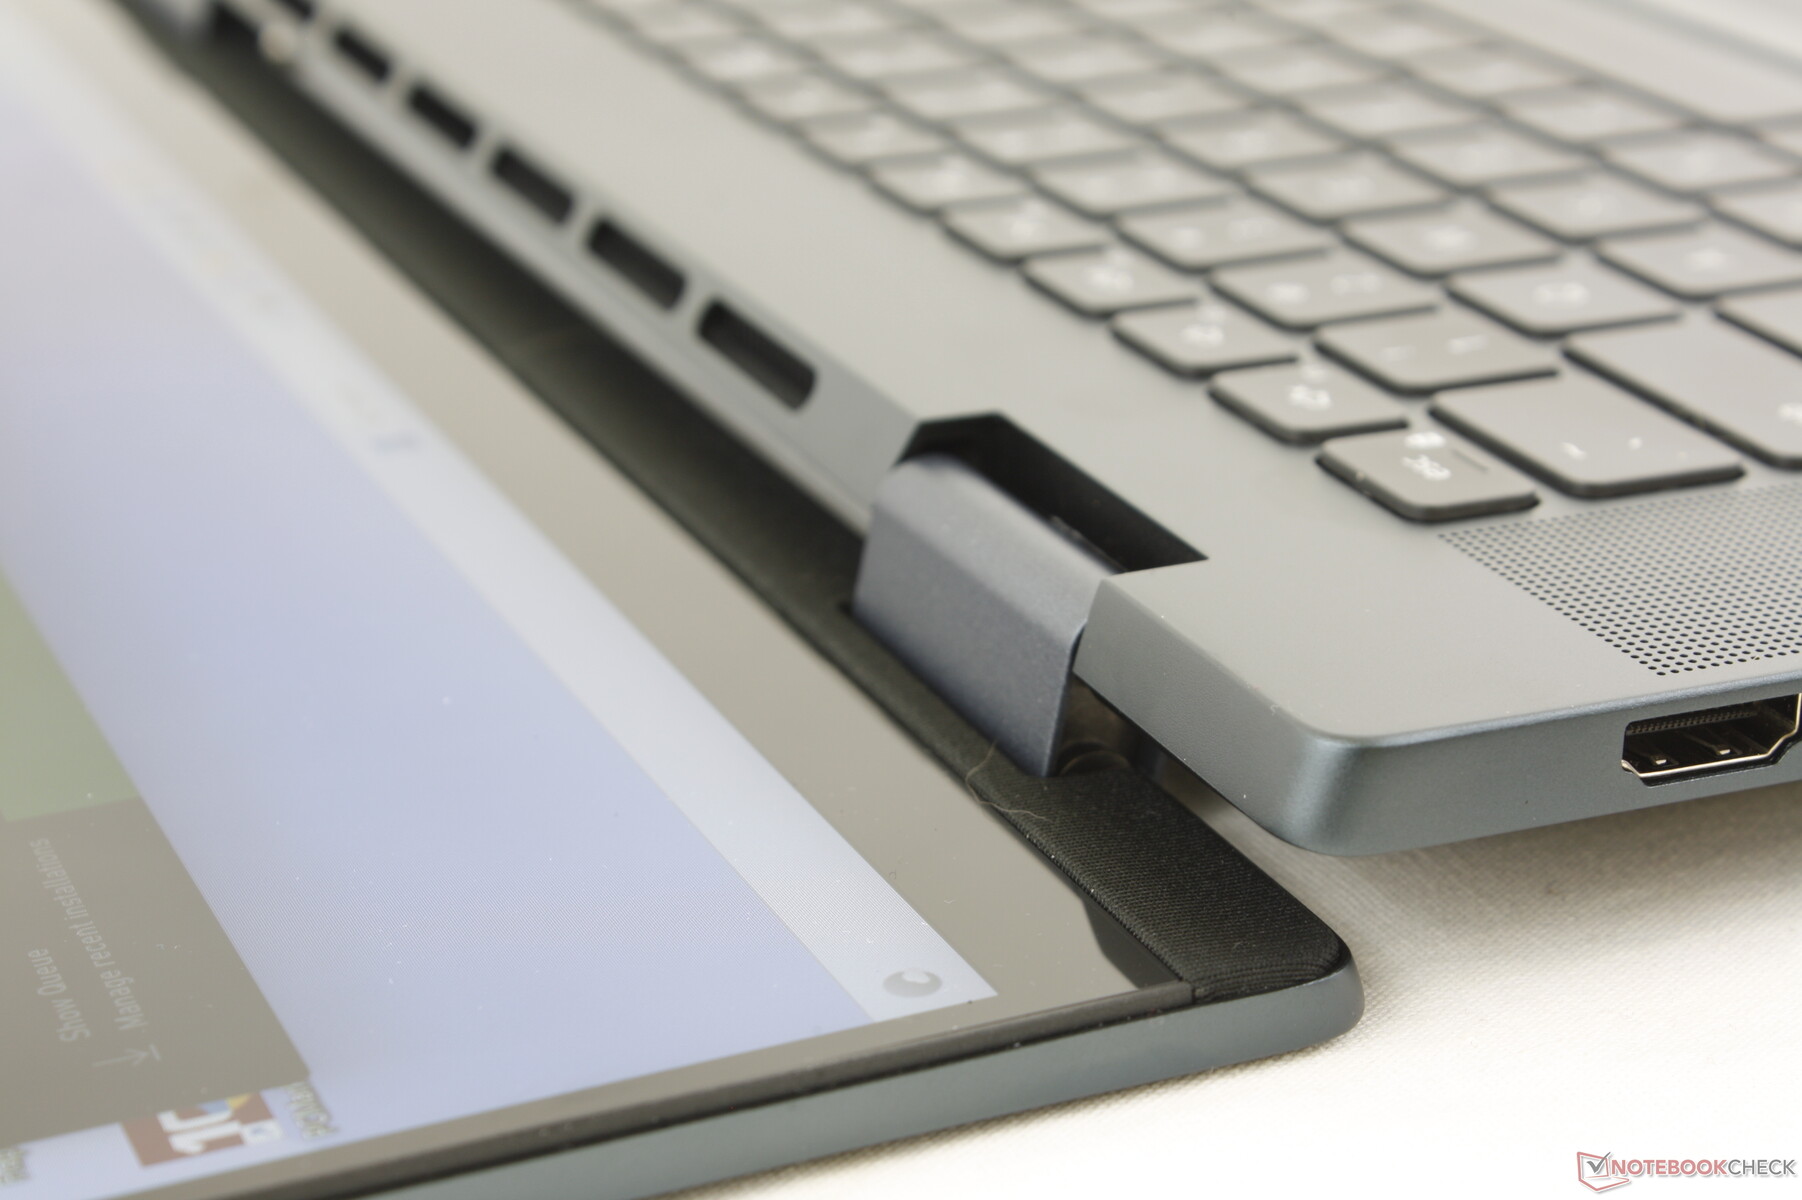
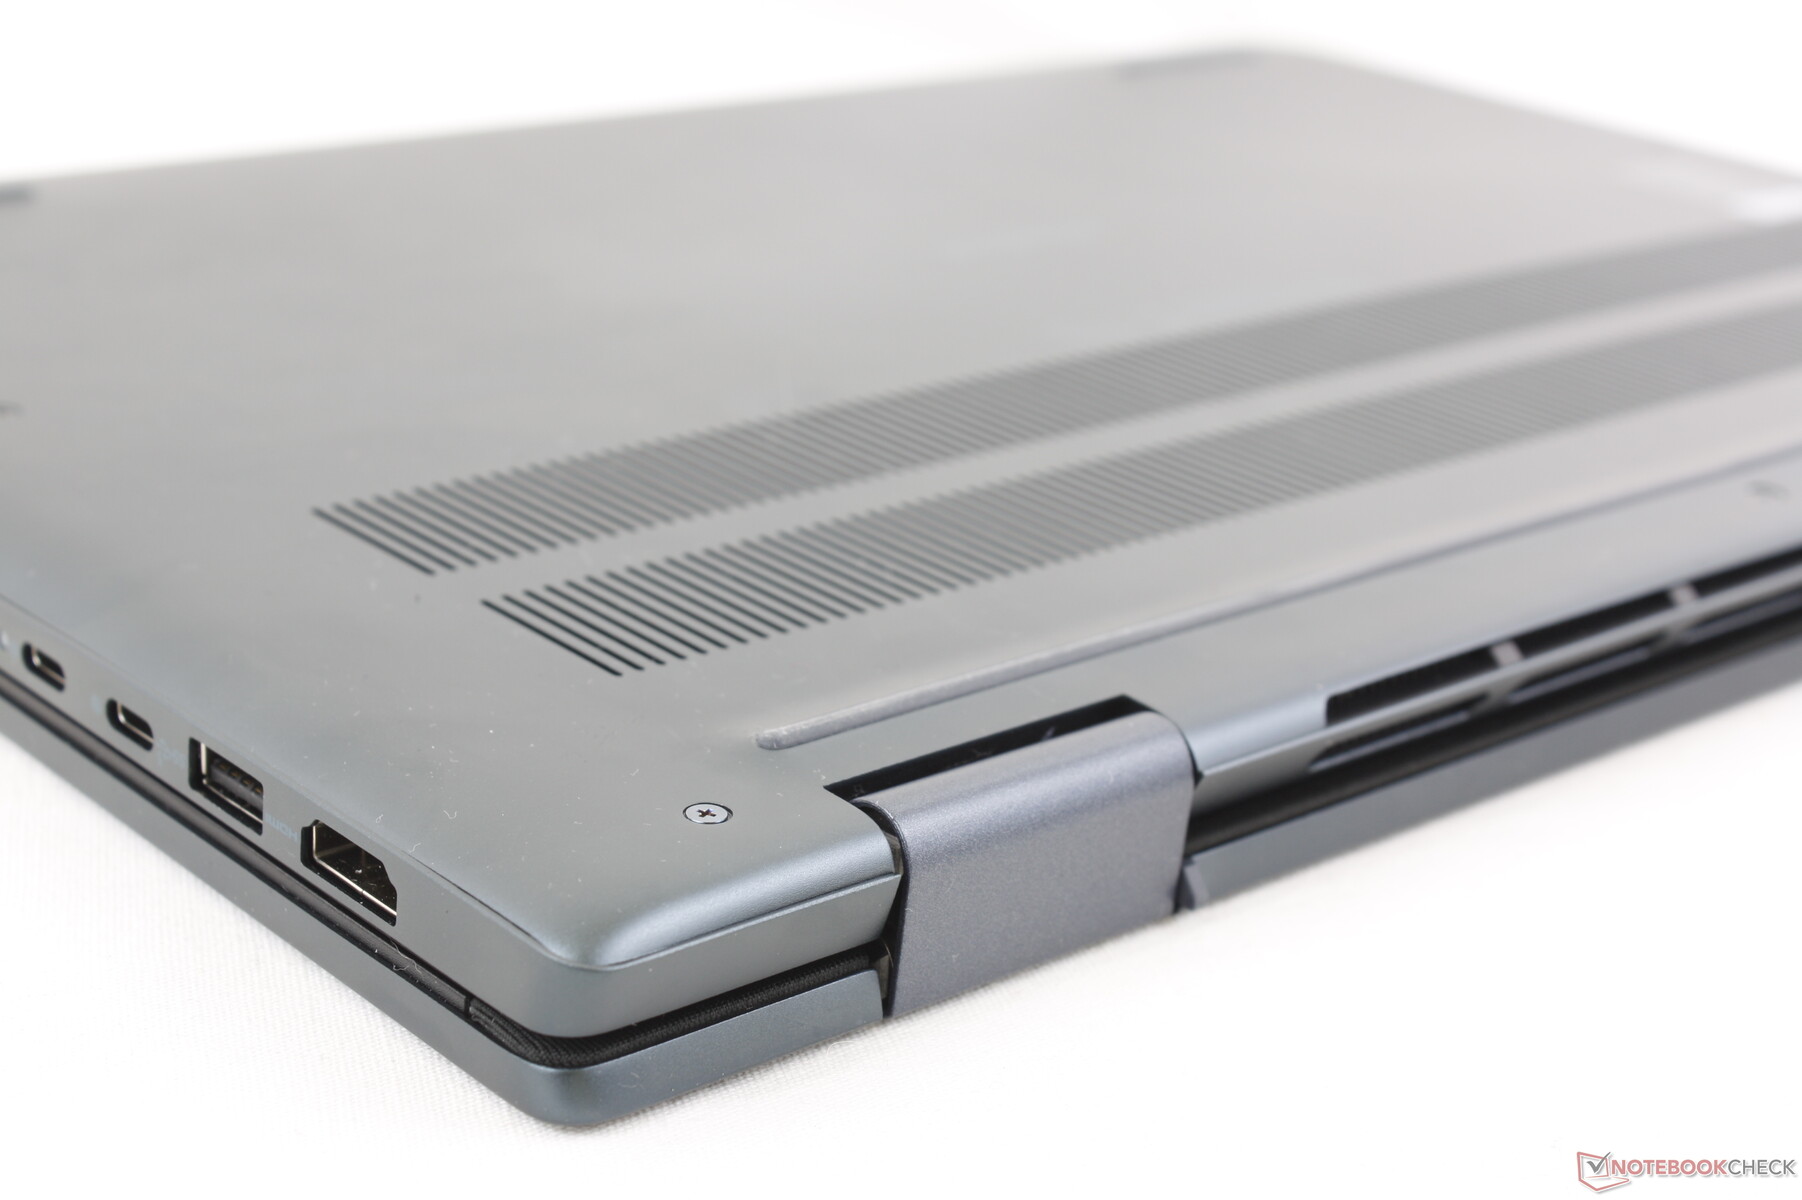
Dell gjorde en stor grej av sin användning av Mylar på förra årets Inspiron 16 7620 2-in-1 och därför är det lite förbryllande att plötsligt se det borta för årets Inspiron 16 7630/7635-uppdatering. Istället består chassit nu av en kombination av aluminium och återvunnen plast för ett mer monotont färgschema och utseende. Gångjärnen har också omformats för att bli plattare och det finns nu ytterligare ventilationsgaller längs baksidan för att hjälpa till med kylningen.
Chassikvaliteten är ungefär densamma jämfört med föregående år trots de exteriöra förändringarna. Den täta vikten bidrar till en orubblig bas för starka första intryck som bara är ett steg eller två ner från den mycket dyrare och lika tungaHP Spectre x360 16.
Kanske av en slump är dimensioner och vikt nästan identiska med den konkurrerandeIdeaPad Flex 5 16. Den nya modellen är tyvärr inte mindre eller lättare än förra årets Inspiron 16 7620 2-i-1 och därför är det fortfarande en relativt tung bärbar dator även för 16-tums storlekskategorin.
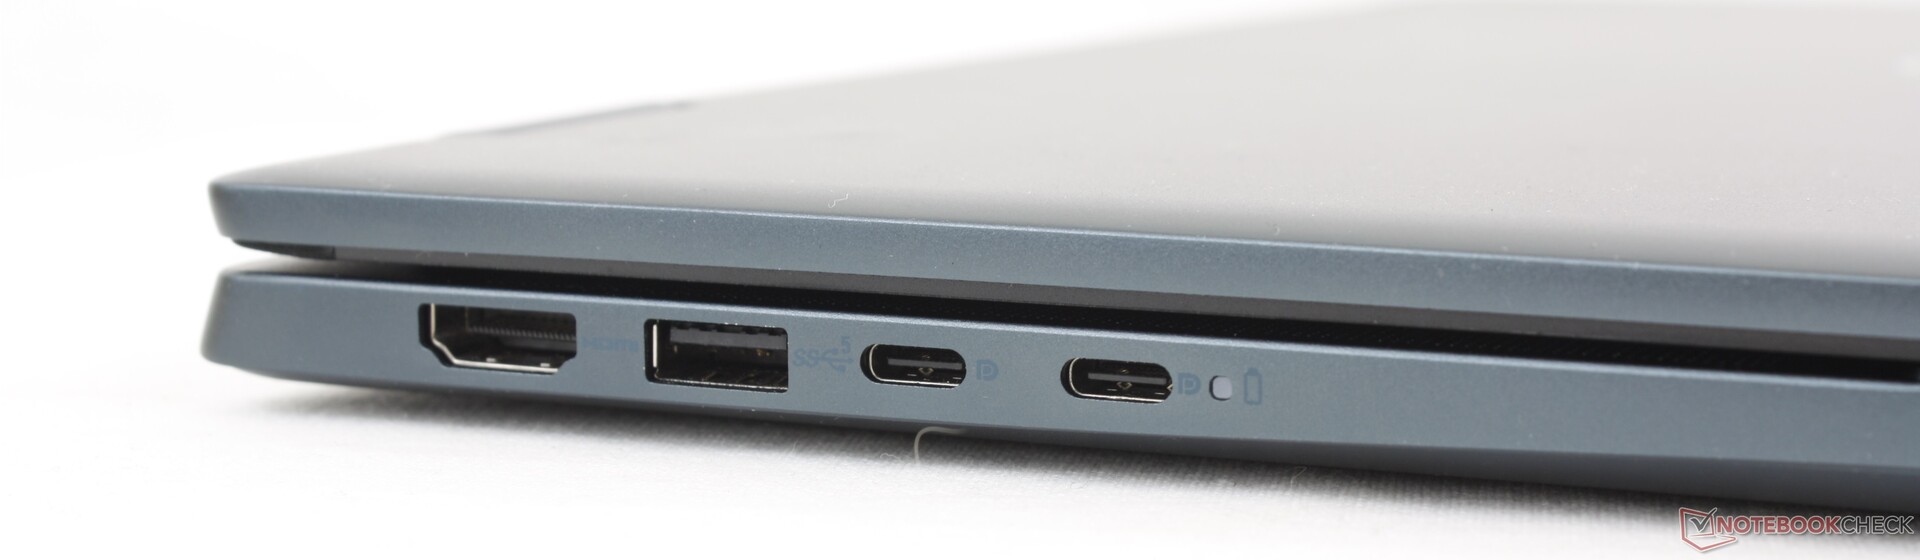
Anslutningsmöjligheter - Inget stöd för Thunderbolt
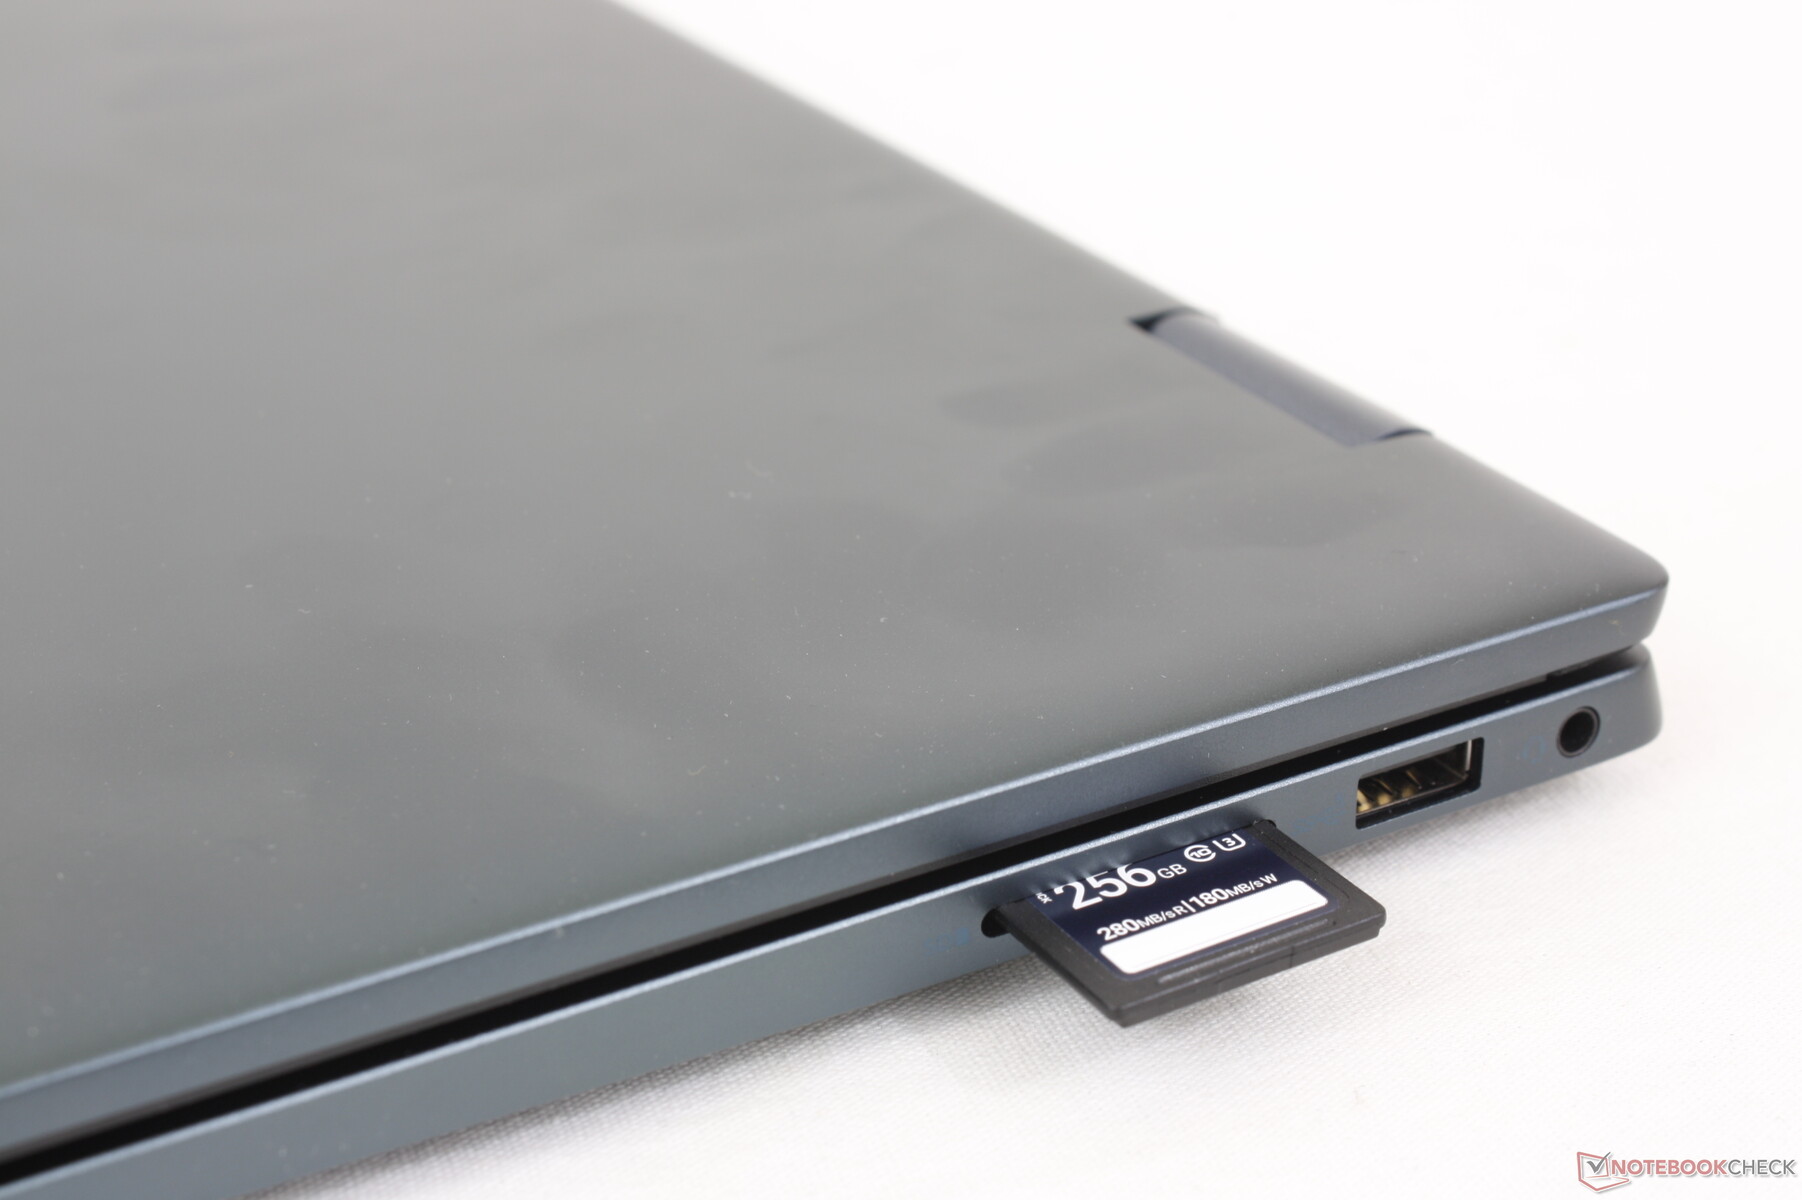
Modellen behåller alla portar som fanns på förra årets Inspiron 16 7620 2-i-1. Den största skillnaden är dock att vår AMD-konfiguration saknar Thunderbolt-stöd. Portutbudet är fortfarande jämförbart med andra 16-tums bärbara datorer, som IdeaPad Flex 5 16 eller Acer Swift Edge SFE16.
Tänk på att HDMI-porten endast är 1.4 istället för 2.0. För korrekt stöd av externa 4K-skärmar vid 60 Hz, se till att använda USB-C-portarna istället.
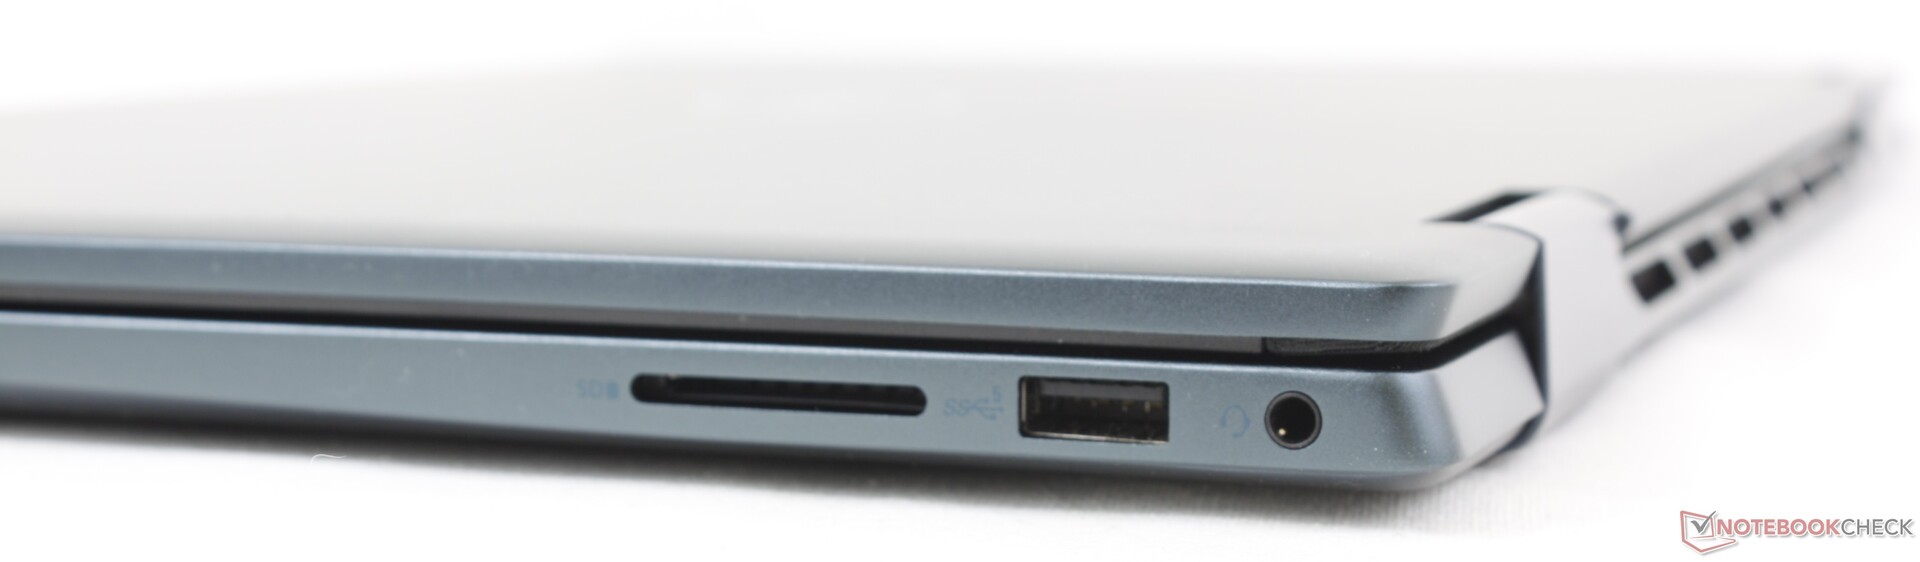
SD-kortläsare
Den integrerade kortläsaren är något snabbare än tidigare, men överföringshastigheterna är fortfarande ungefär hälften så snabba som på Lenovo IdeaPad Flex 5 16 eller Galaxy Book3 Pro 16. Att flytta 1 GB bilder från vårt PNY UHS-II-testkort till skrivbordet tar cirka 32 sekunder jämfört med 17 sekunder på den tidigare nämnda Lenovo.
| SD Card Reader | |
| average JPG Copy Test (av. of 3 runs) | |
| Lenovo IdeaPad Flex 5 16ABR G8 (Angelibird AV Pro V60) | |
| Samsung Galaxy Book3 Pro 16 | |
| Lenovo Yoga 7 16IRL8 (AV Pro SD microSD 128 GB V60) | |
| Dell Inspiron 16 7635 2-in-1 (PNY EliteX-Pro60 V60 256 GB) | |
| Dell Inspiron 16 7620 2-in-1 (Toshiba Exceria Pro SDXC 64 GB UHS-II) | |
| maximum AS SSD Seq Read Test (1GB) | |
| Lenovo Yoga 7 16IRL8 (AV Pro SD microSD 128 GB V60) | |
| Lenovo IdeaPad Flex 5 16ABR G8 (Angelibird AV Pro V60) | |
| Samsung Galaxy Book3 Pro 16 | |
| Dell Inspiron 16 7635 2-in-1 (PNY EliteX-Pro60 V60 256 GB) | |
| Dell Inspiron 16 7620 2-in-1 (Toshiba Exceria Pro SDXC 64 GB UHS-II) | |
Kommunikation
AMD Inspiron levereras med MediaTek Wi-Fi 6E MT7922 medan Intel Inspiron levereras med AX211. Båda modulerna är kompatibla med Wi-Fi 6E- eller 6 GHz-routrar. Prestandan är stabil och utan problem när den paras ihop med vår Asus AXE11000.
Webbkamera
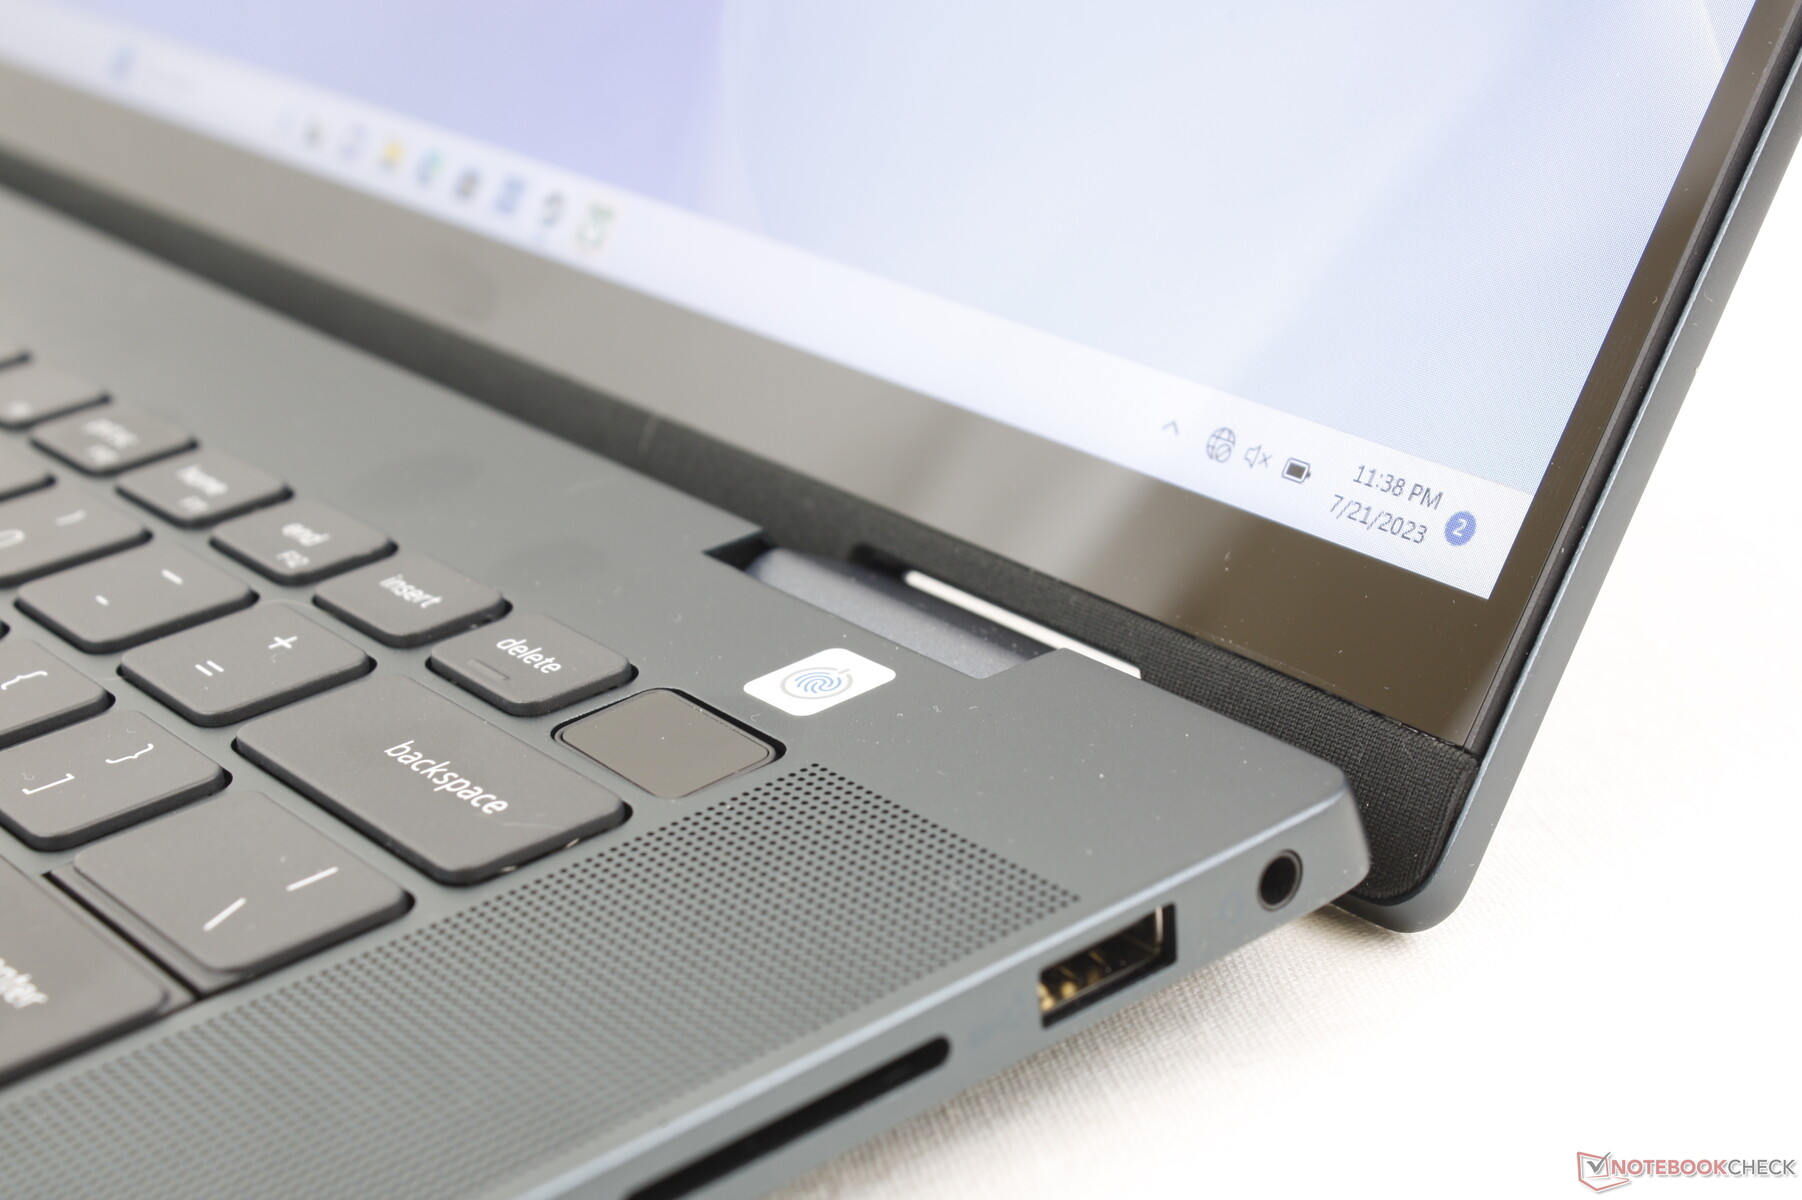
En 1080p-webbkamera och sekretesslucka är standard på alla konfigurationer för inga överraskningar när det gäller bildkvalitet. Endast Intel-modellen kommer dock med en IR-sensor som tillval.


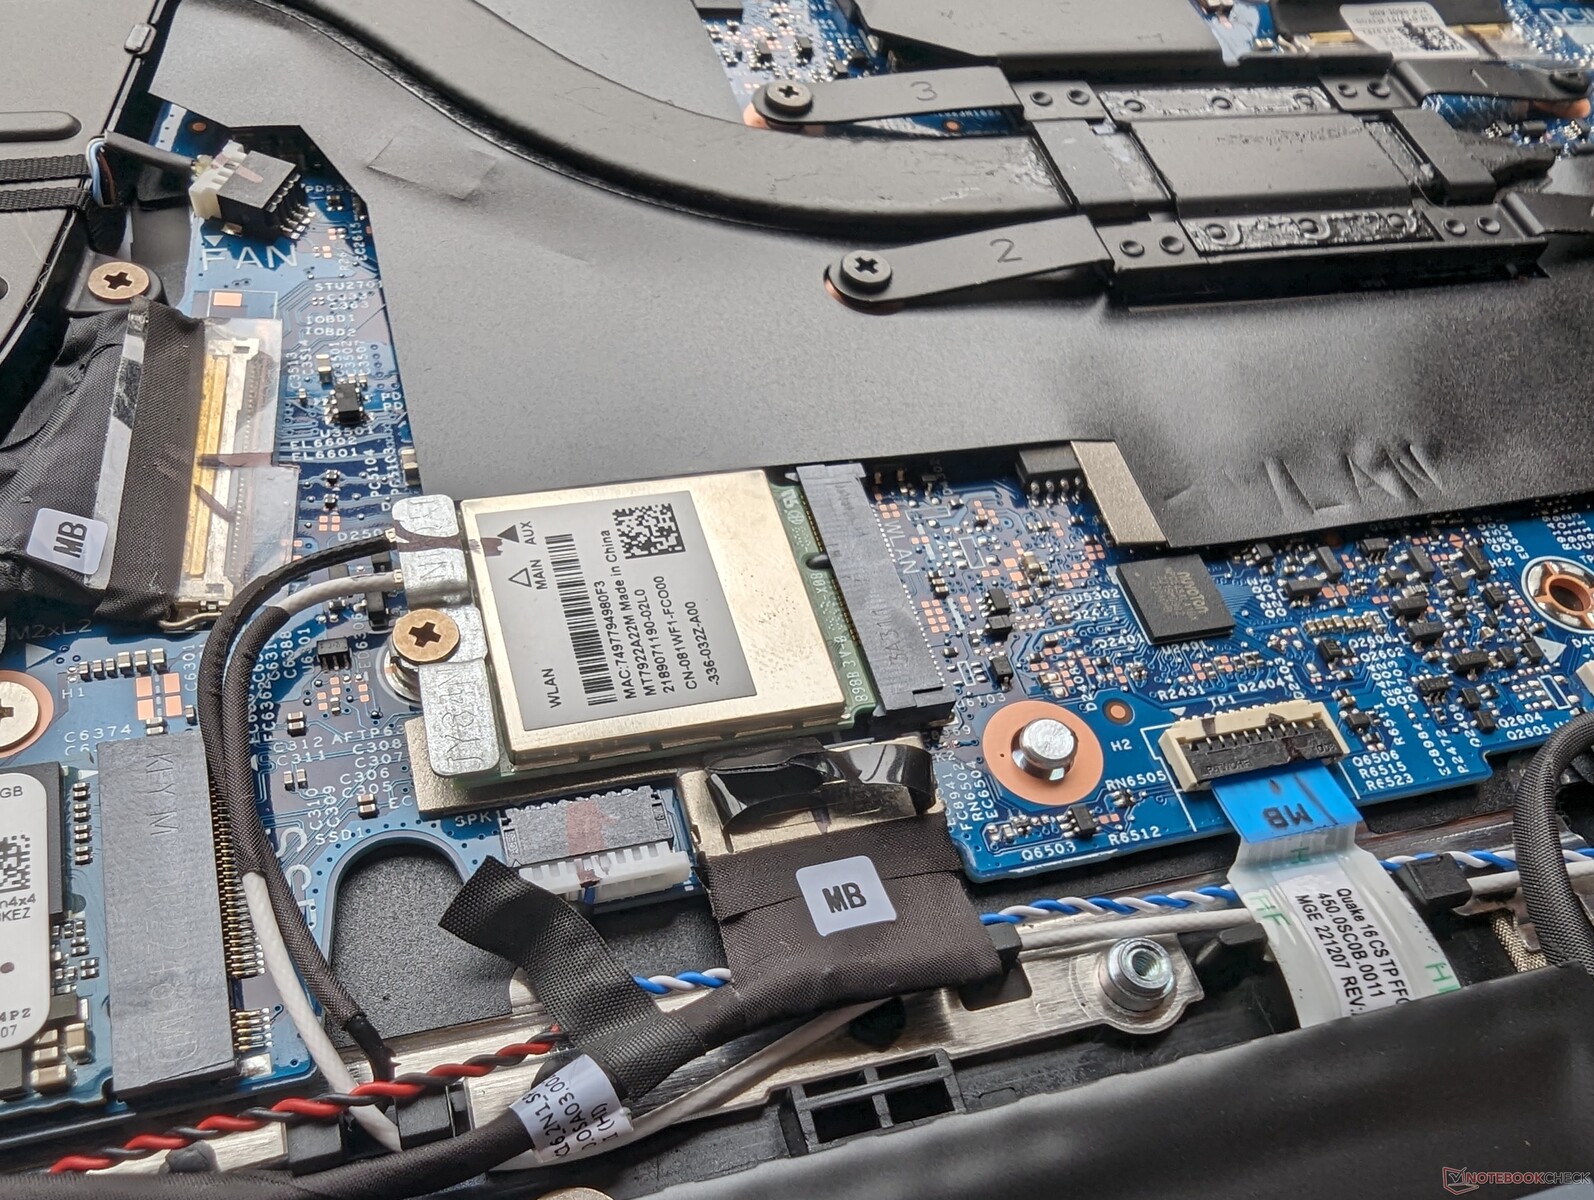
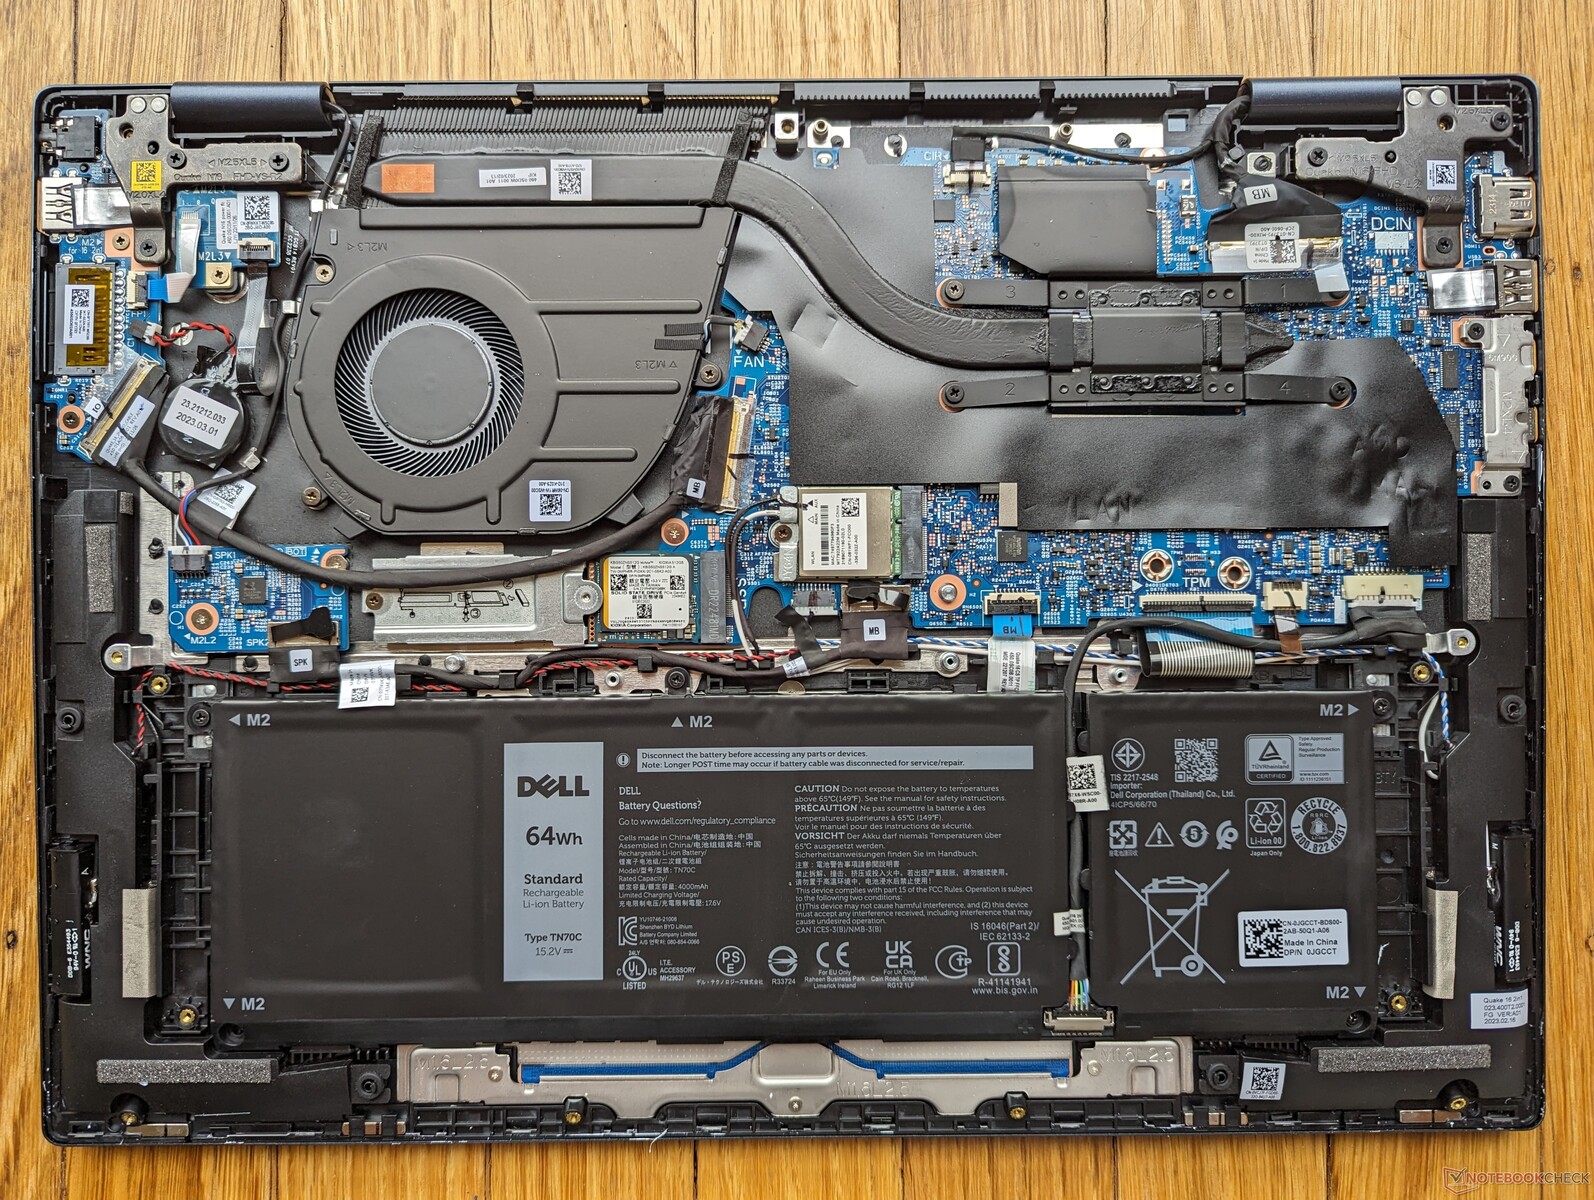
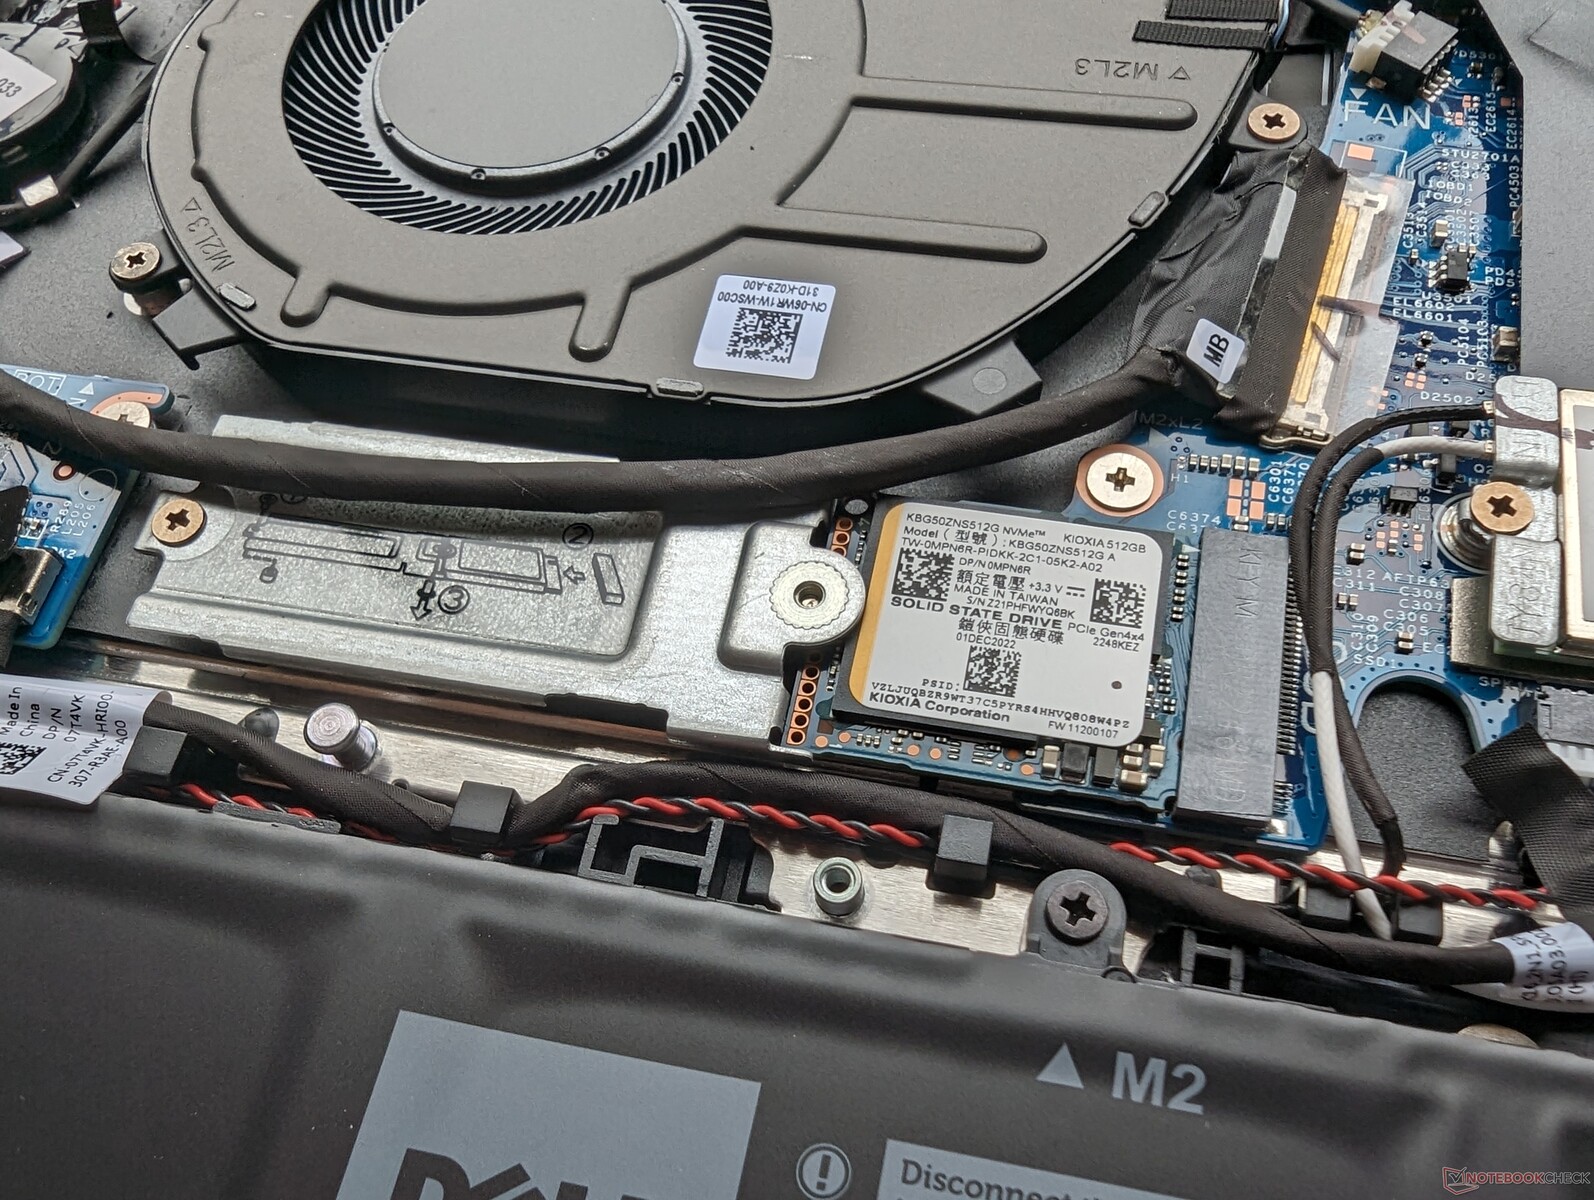
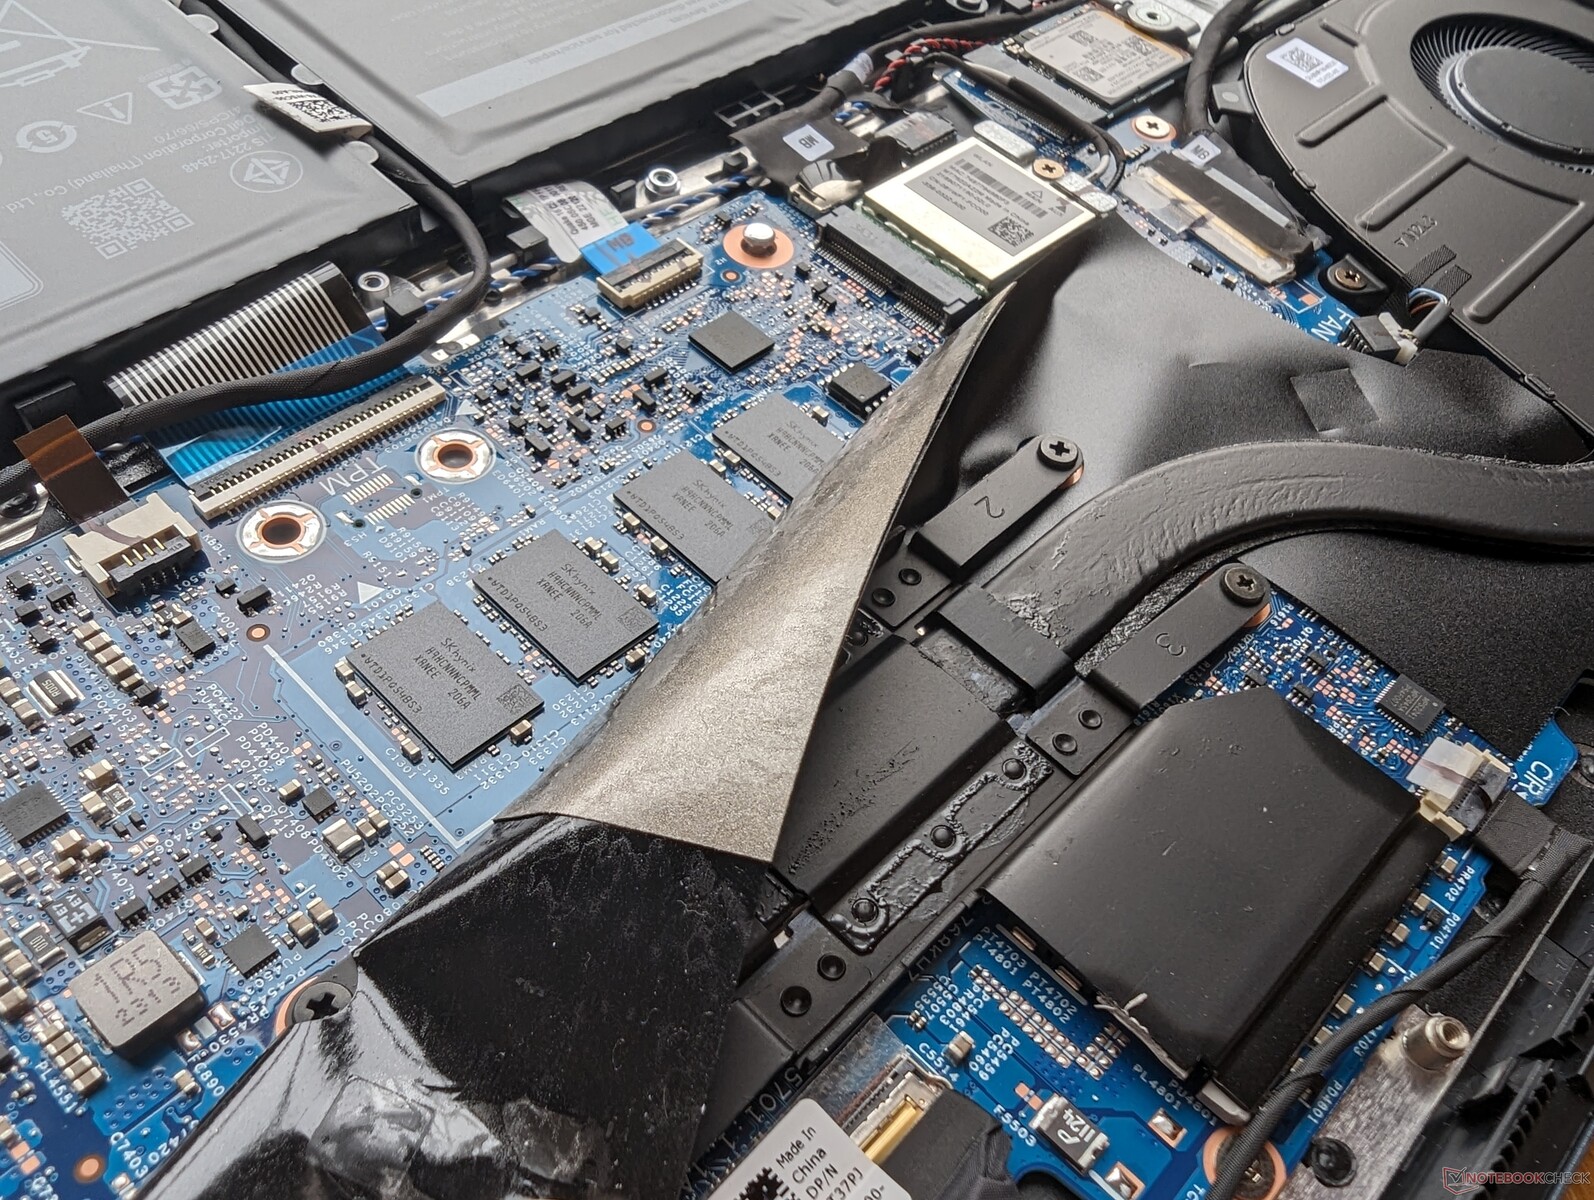
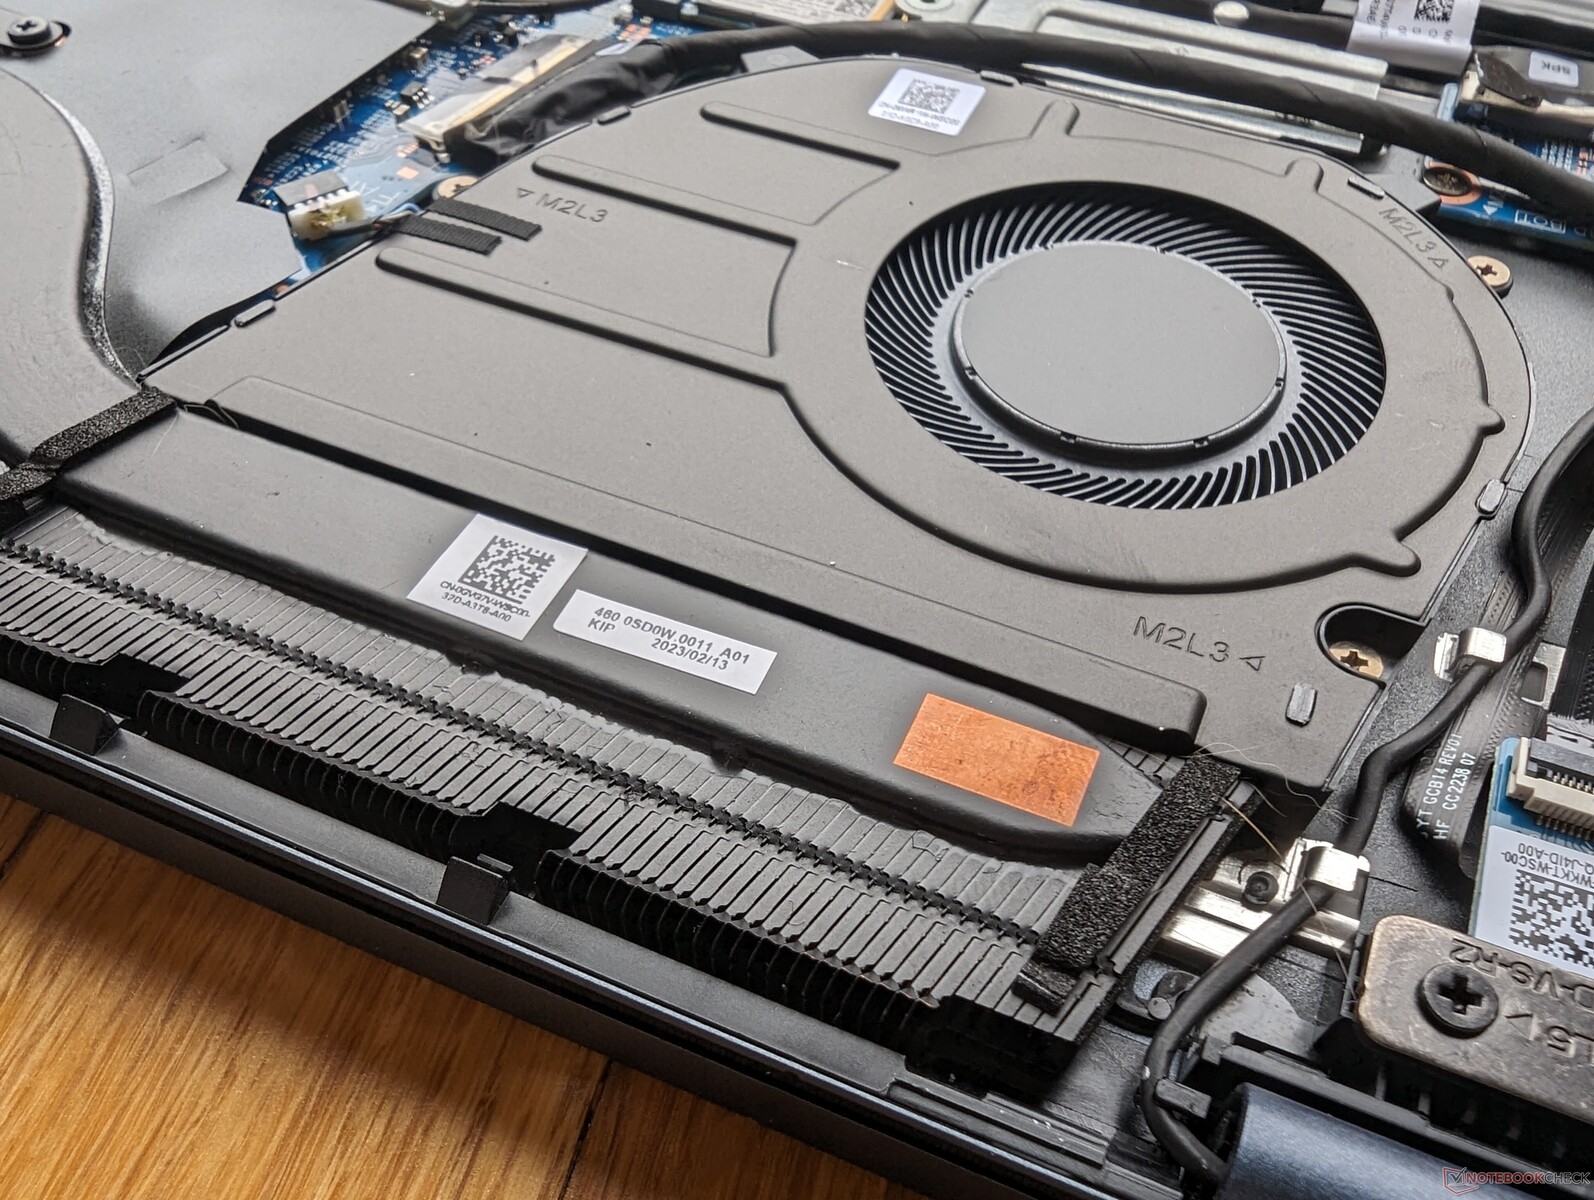
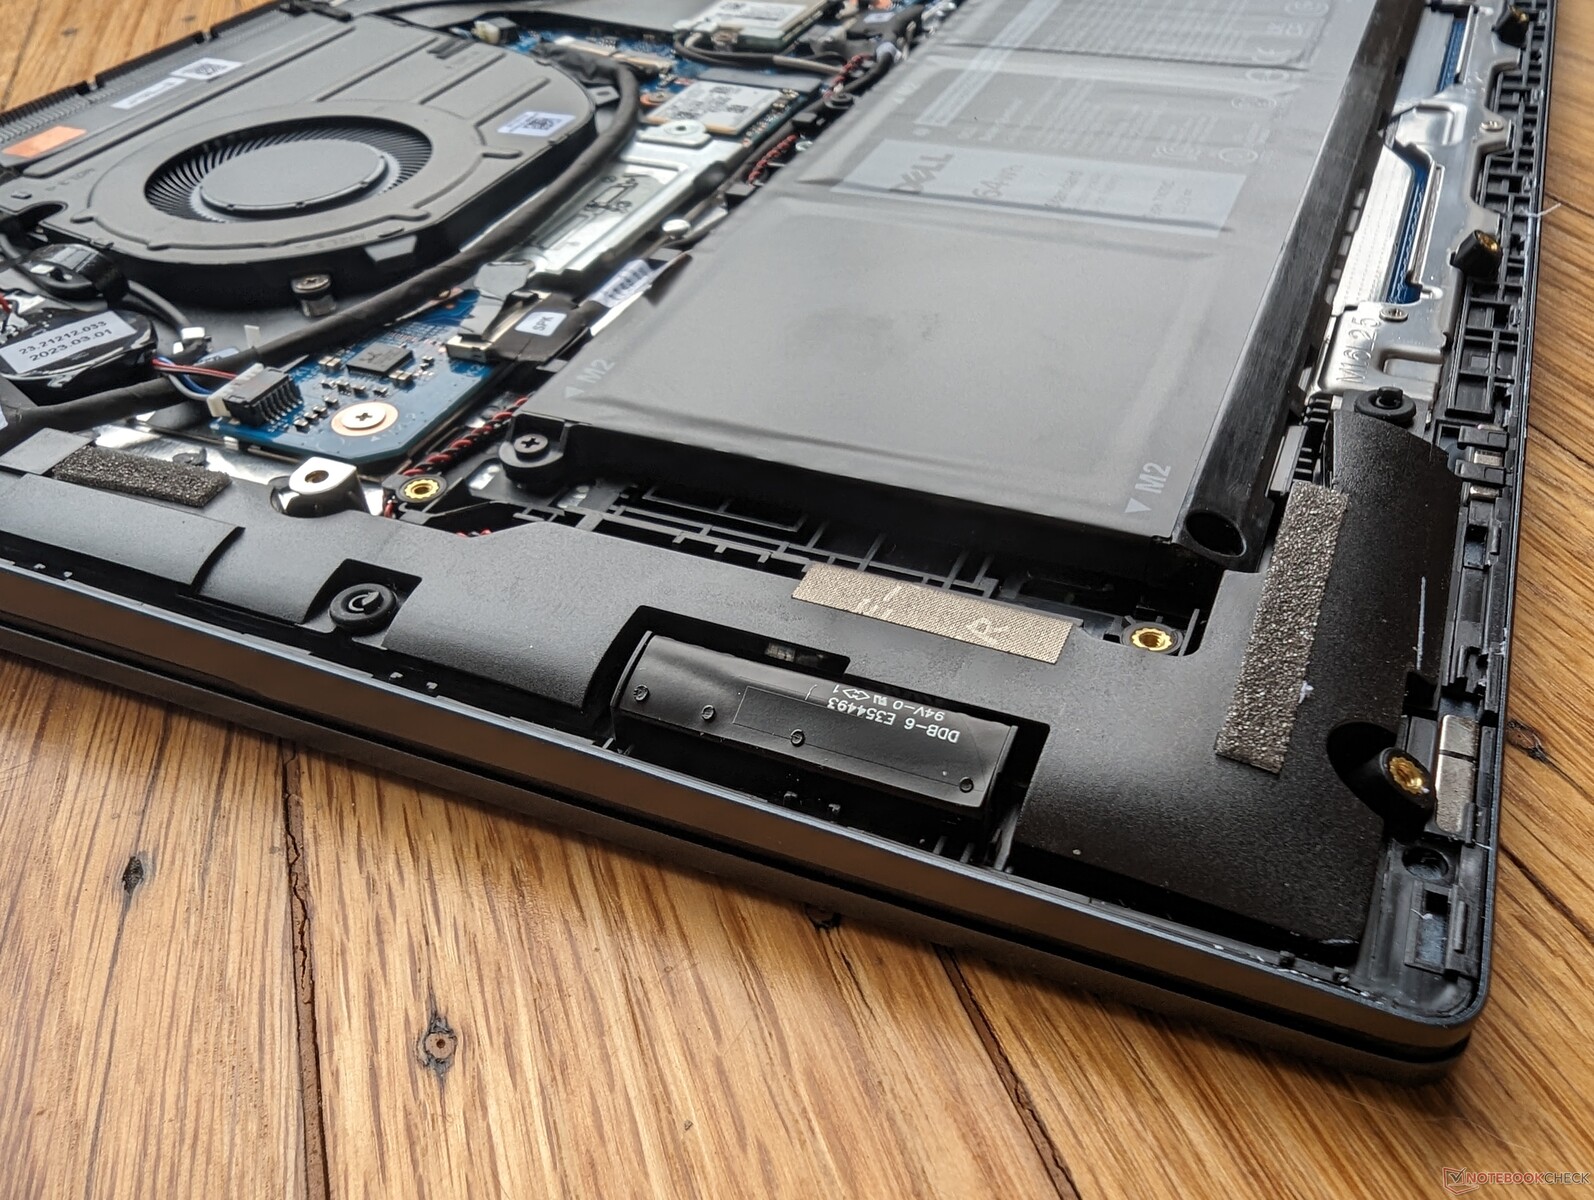
Underhåll
Bottenpanelen fästs med nio stjärnskruvar. Observera att spärrarna runt kanterna är mycket snäva och därför rekommenderar vi att du använder en vass plastkant för att försiktigt bända upp panelen från baksidan.
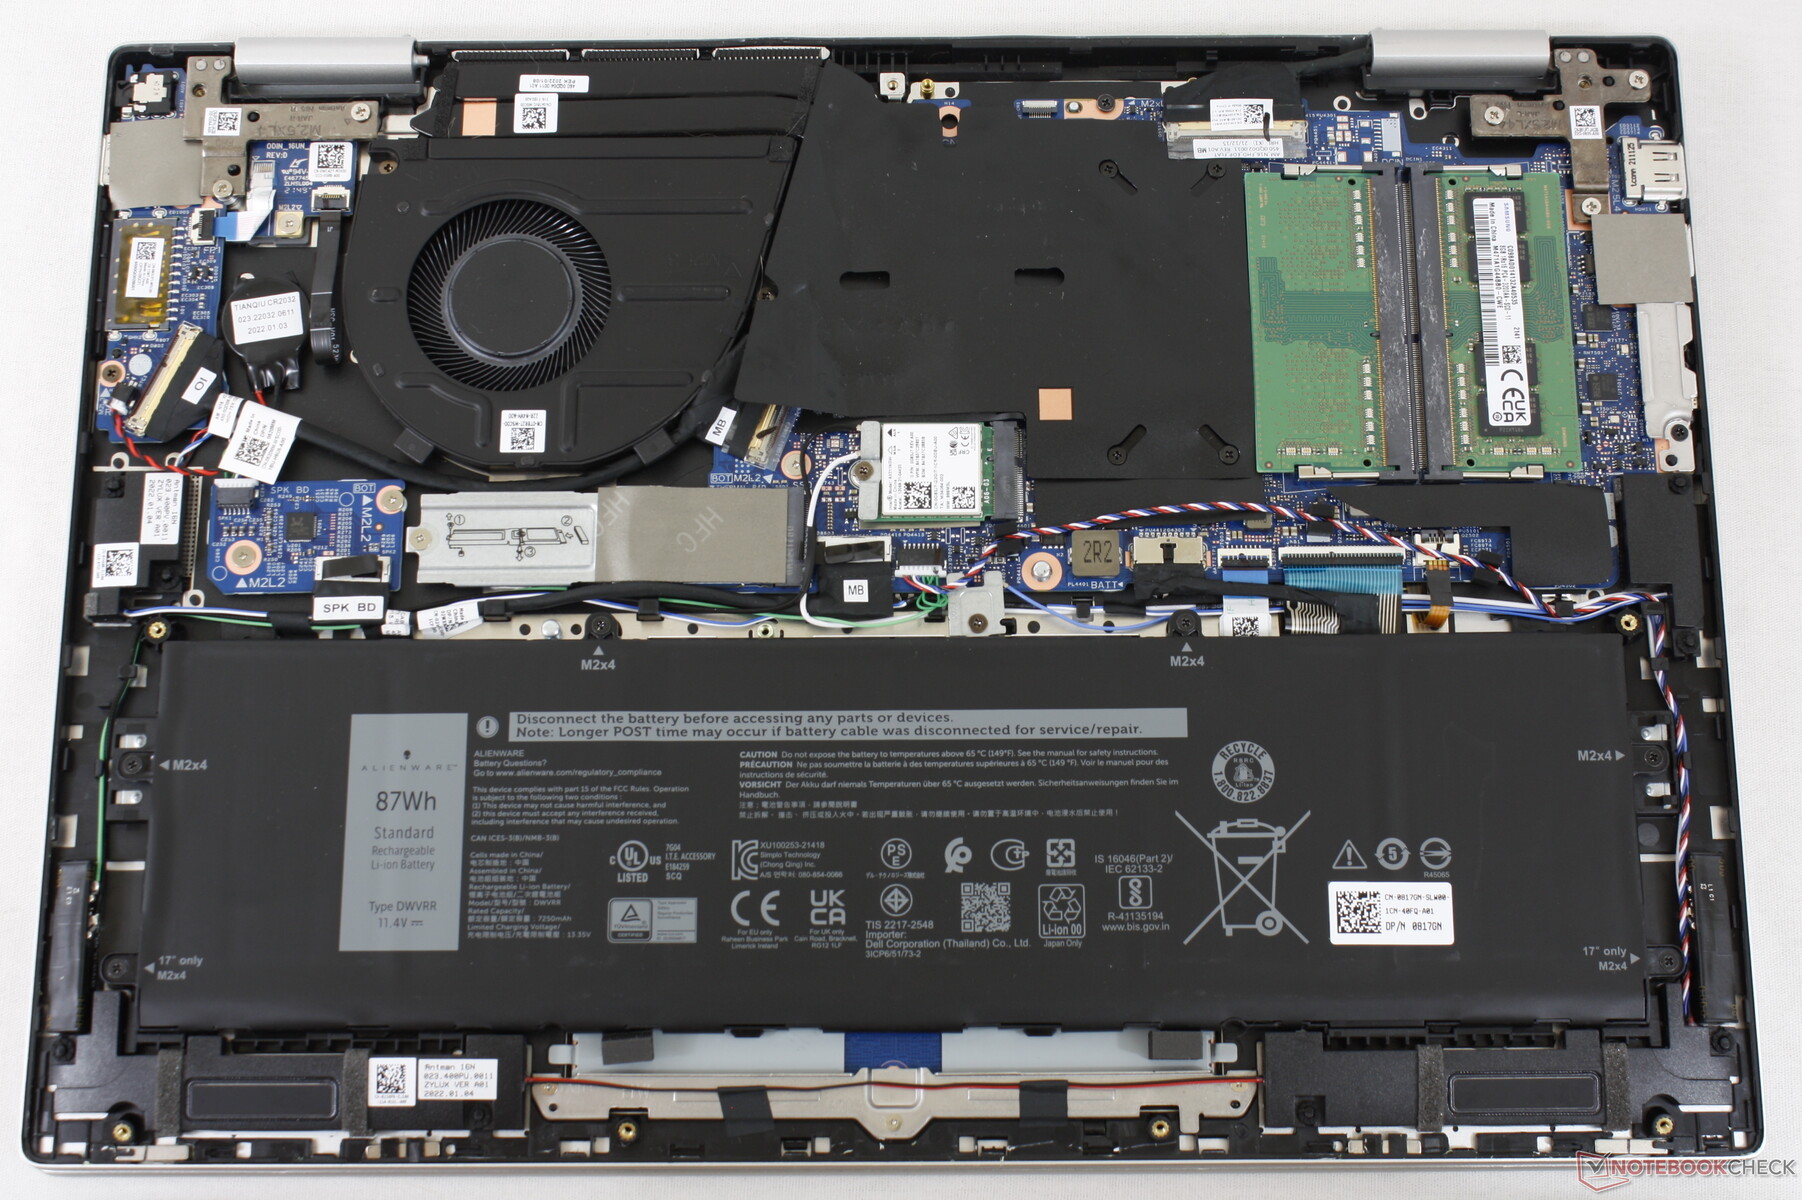
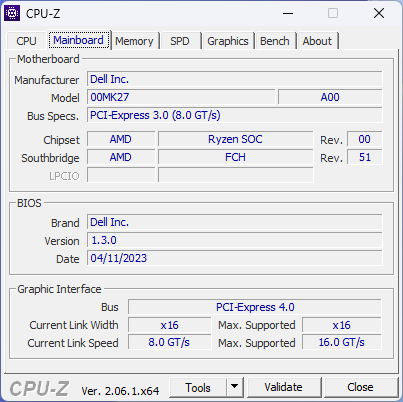
RAM-minnet är nu fastlött på 2023-modellen medan det kunde uppgraderas av användaren på 2022-versionen, vilket framgår av bilderna nedan.
Tillbehör och garanti
Det finns inget extra i förpackningen förutom nätadapter och pappersarbete. Den vanliga ettåriga begränsade tillverkargarantin gäller vid köp i USA.
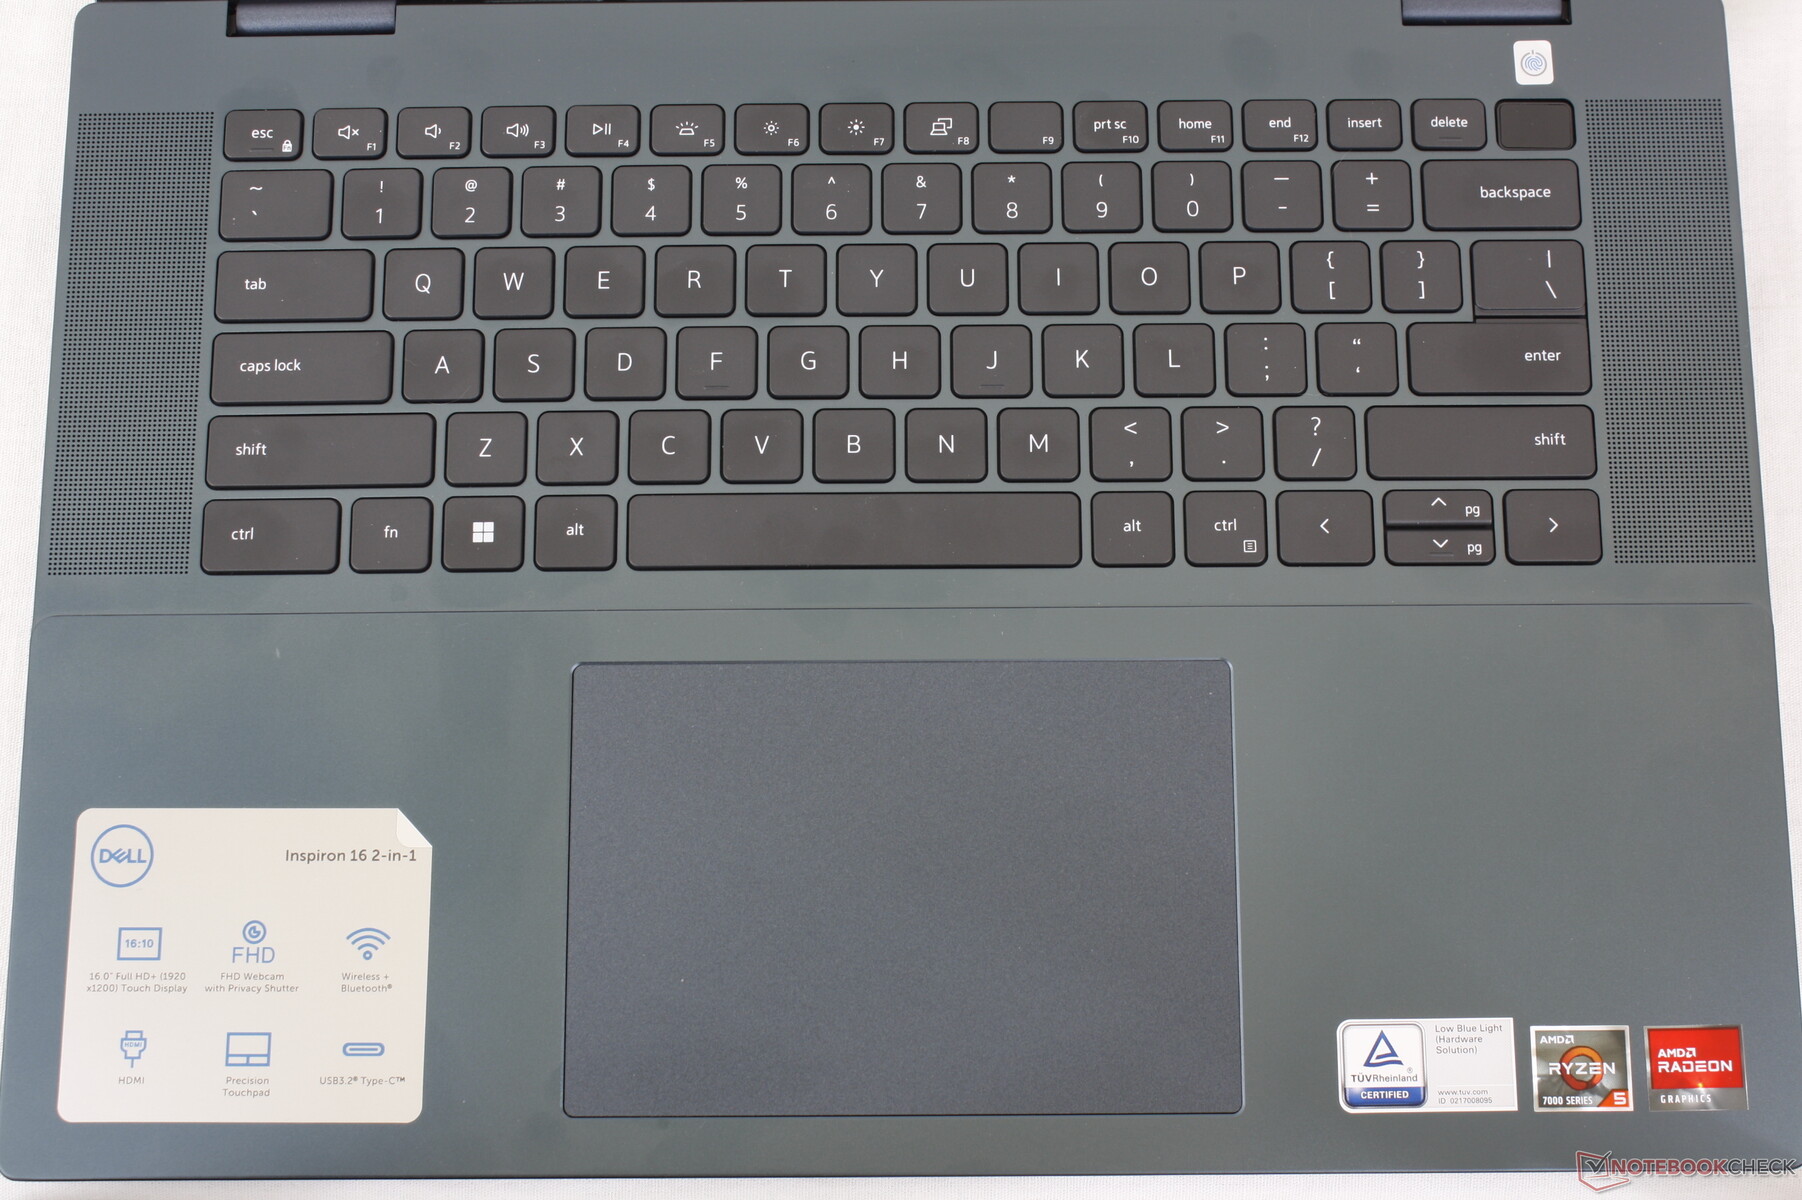
Inmatningsenheter
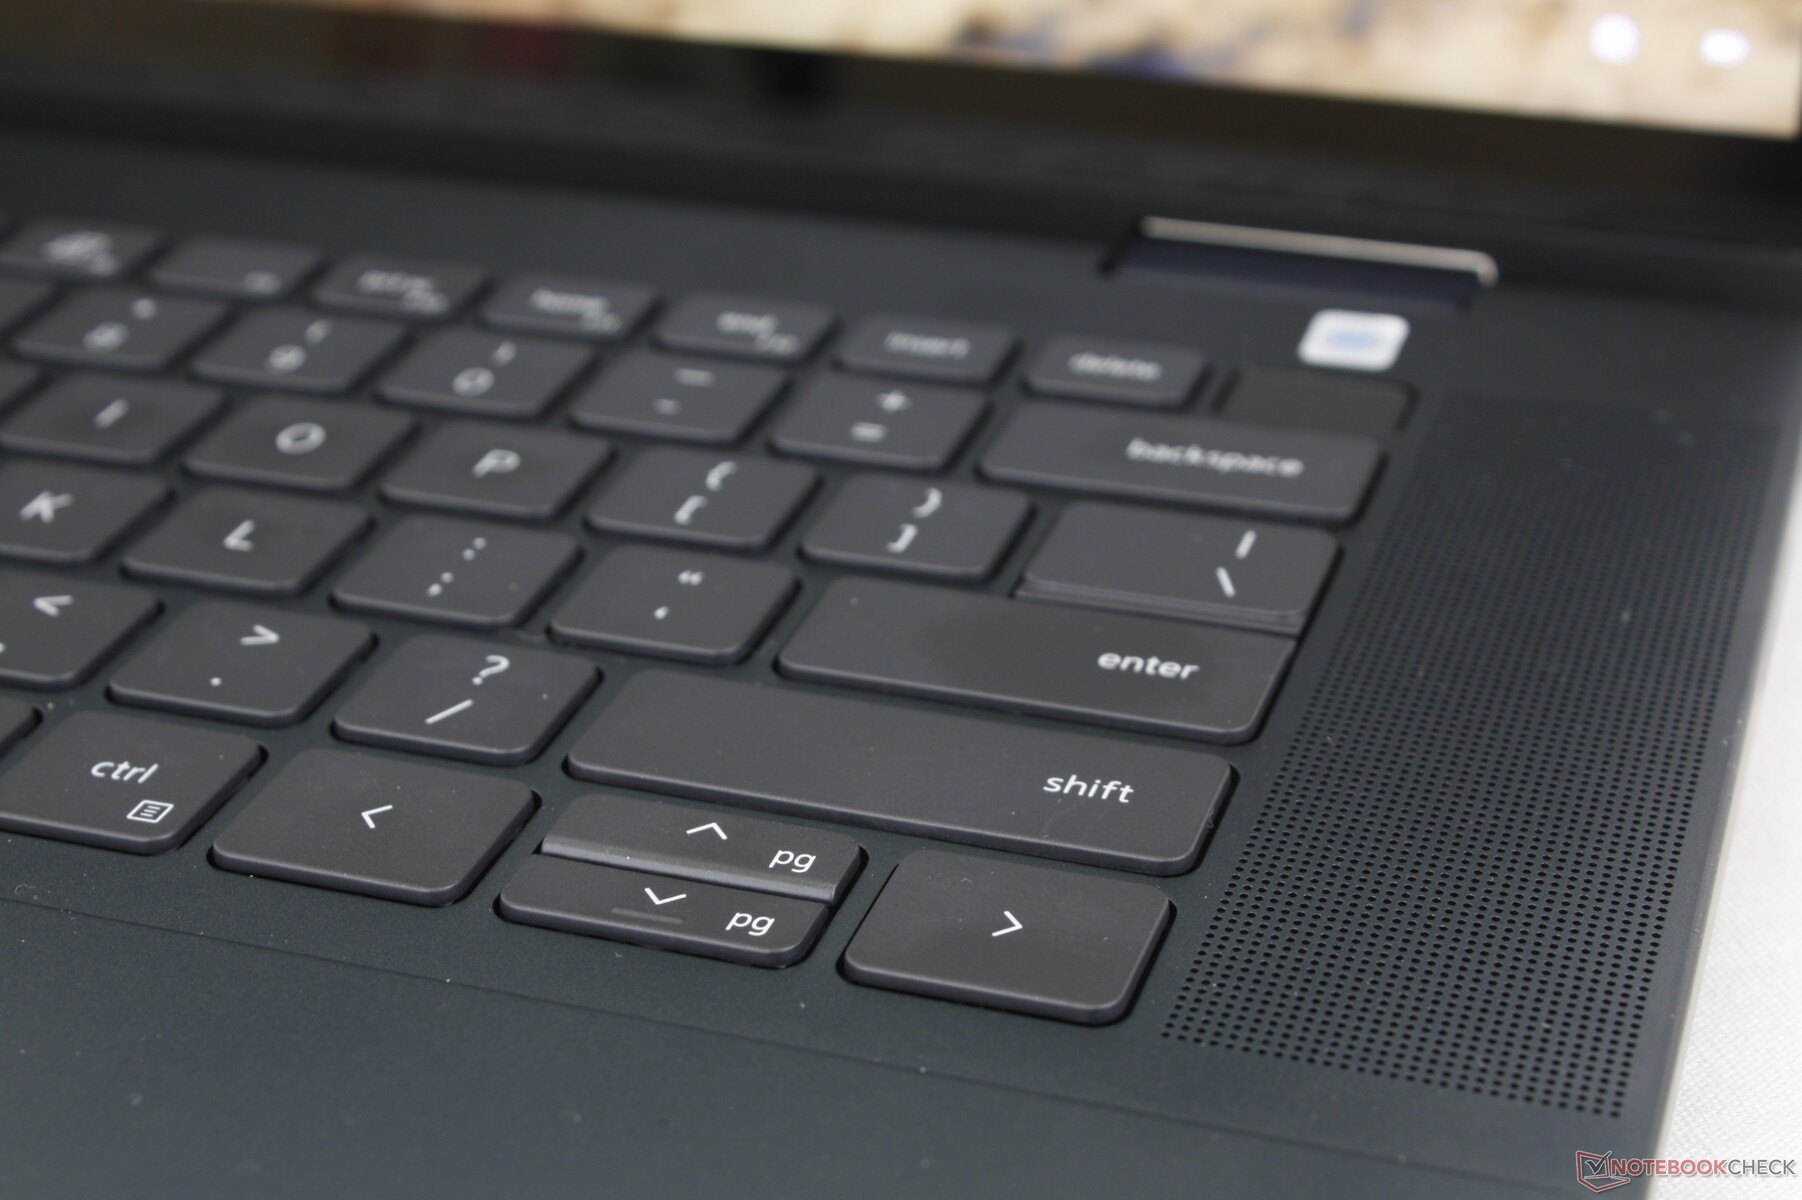
Tangentbord
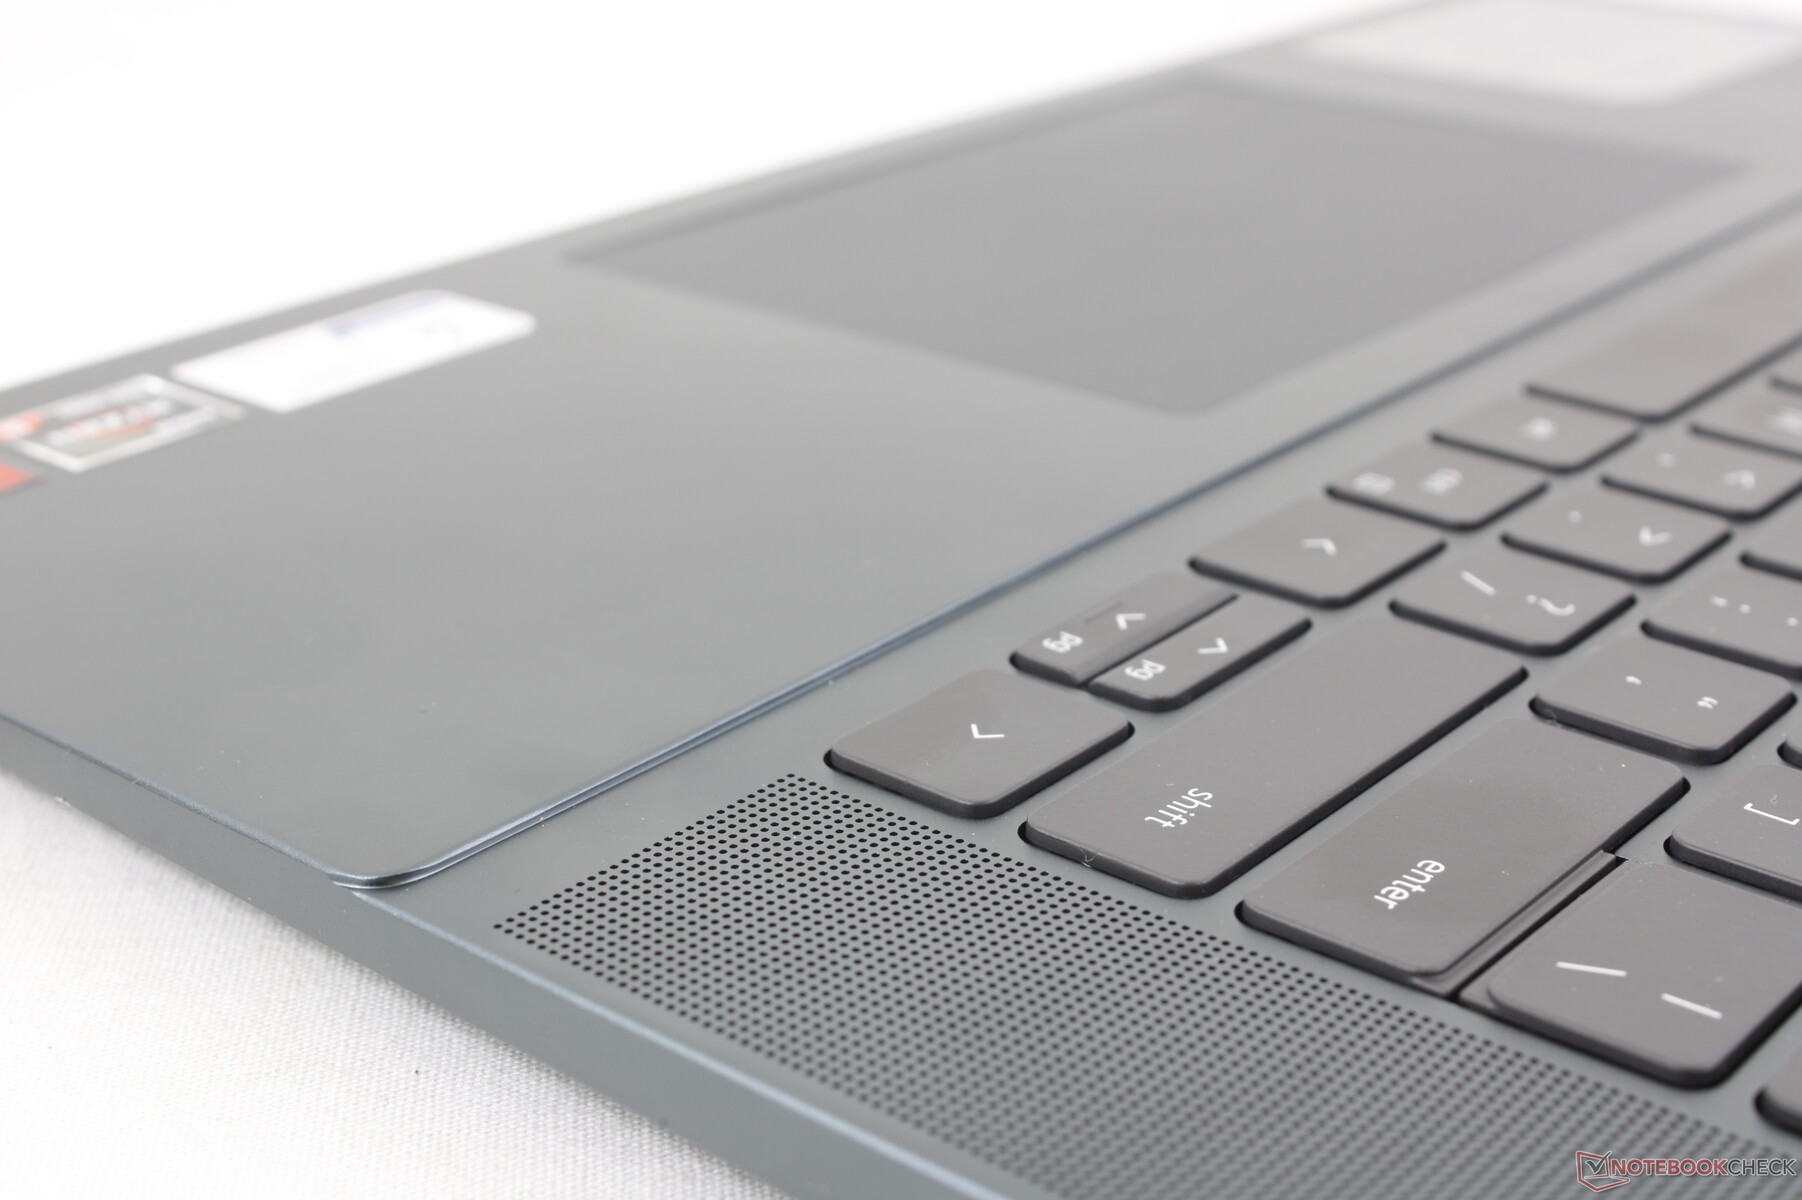
Skrivupplevelsen är ganska konsekvent för alla bärbara Inspiron-datorer och QWERTY-tangenterna är därför relativt mjuka och har en grund slaglängd. Även 14-tums Inspiron 14 använder samma tangentbord som på vår större 16-tums Inspiron 16; den enda skillnaden är att Inspiron 16 integrerar ytterligare uppåtriktade högtalare längs tangentbordets sidor. De extra högtalarna i stället för en numpad understryker det faktum att Inspiron 16 7635 2-i-1 i första hand är en multimediadator.
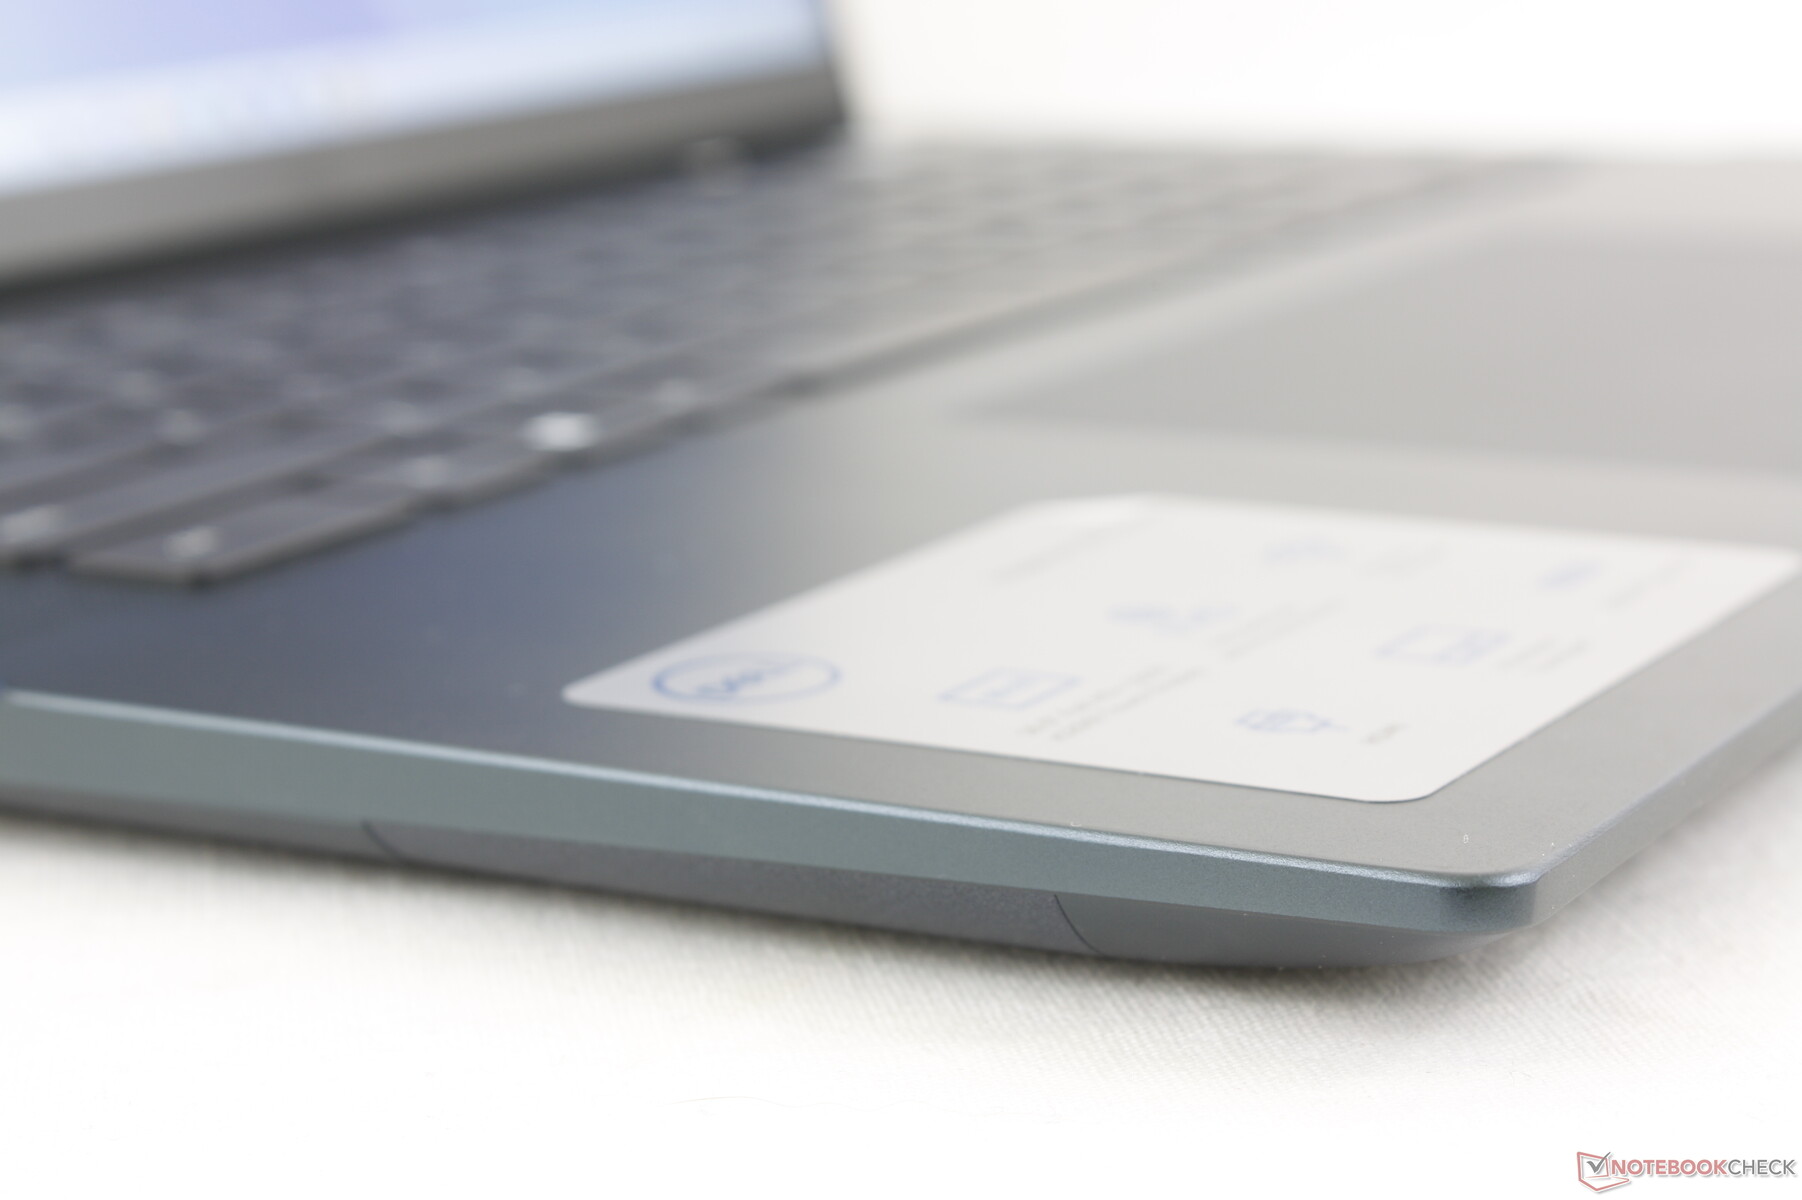
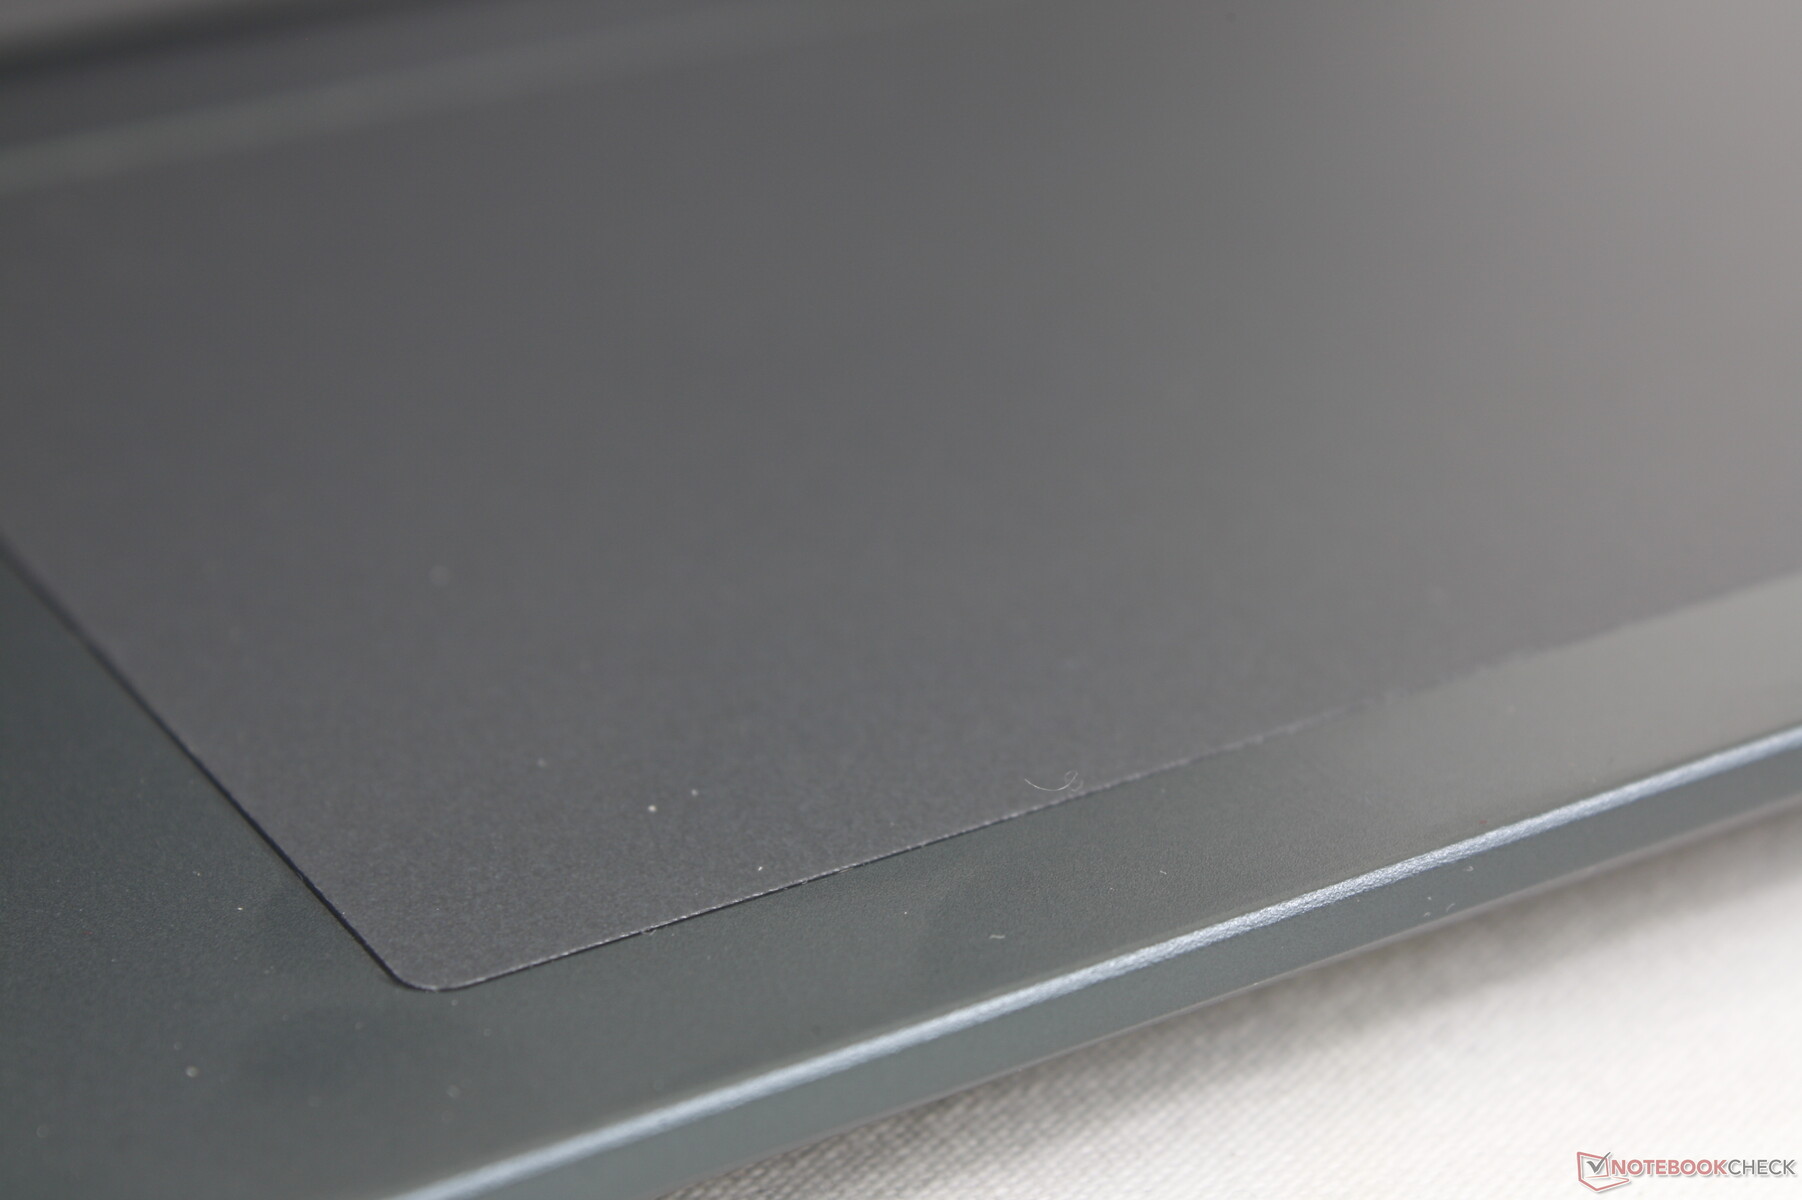
Pekplatta
Storleken på klickplattan (13,3 x 9 cm) är oförändrad från förra årets modell även om den visuella designen av klickplattan har återgått till ett mer traditionellt utseende. Tyvärr har återkopplingen när man klickar på ytan inte förbättrats och därför är den fortfarande mjuk och ytlig jämfört med den fastare klickplattan på HP Spectre klickplatta.

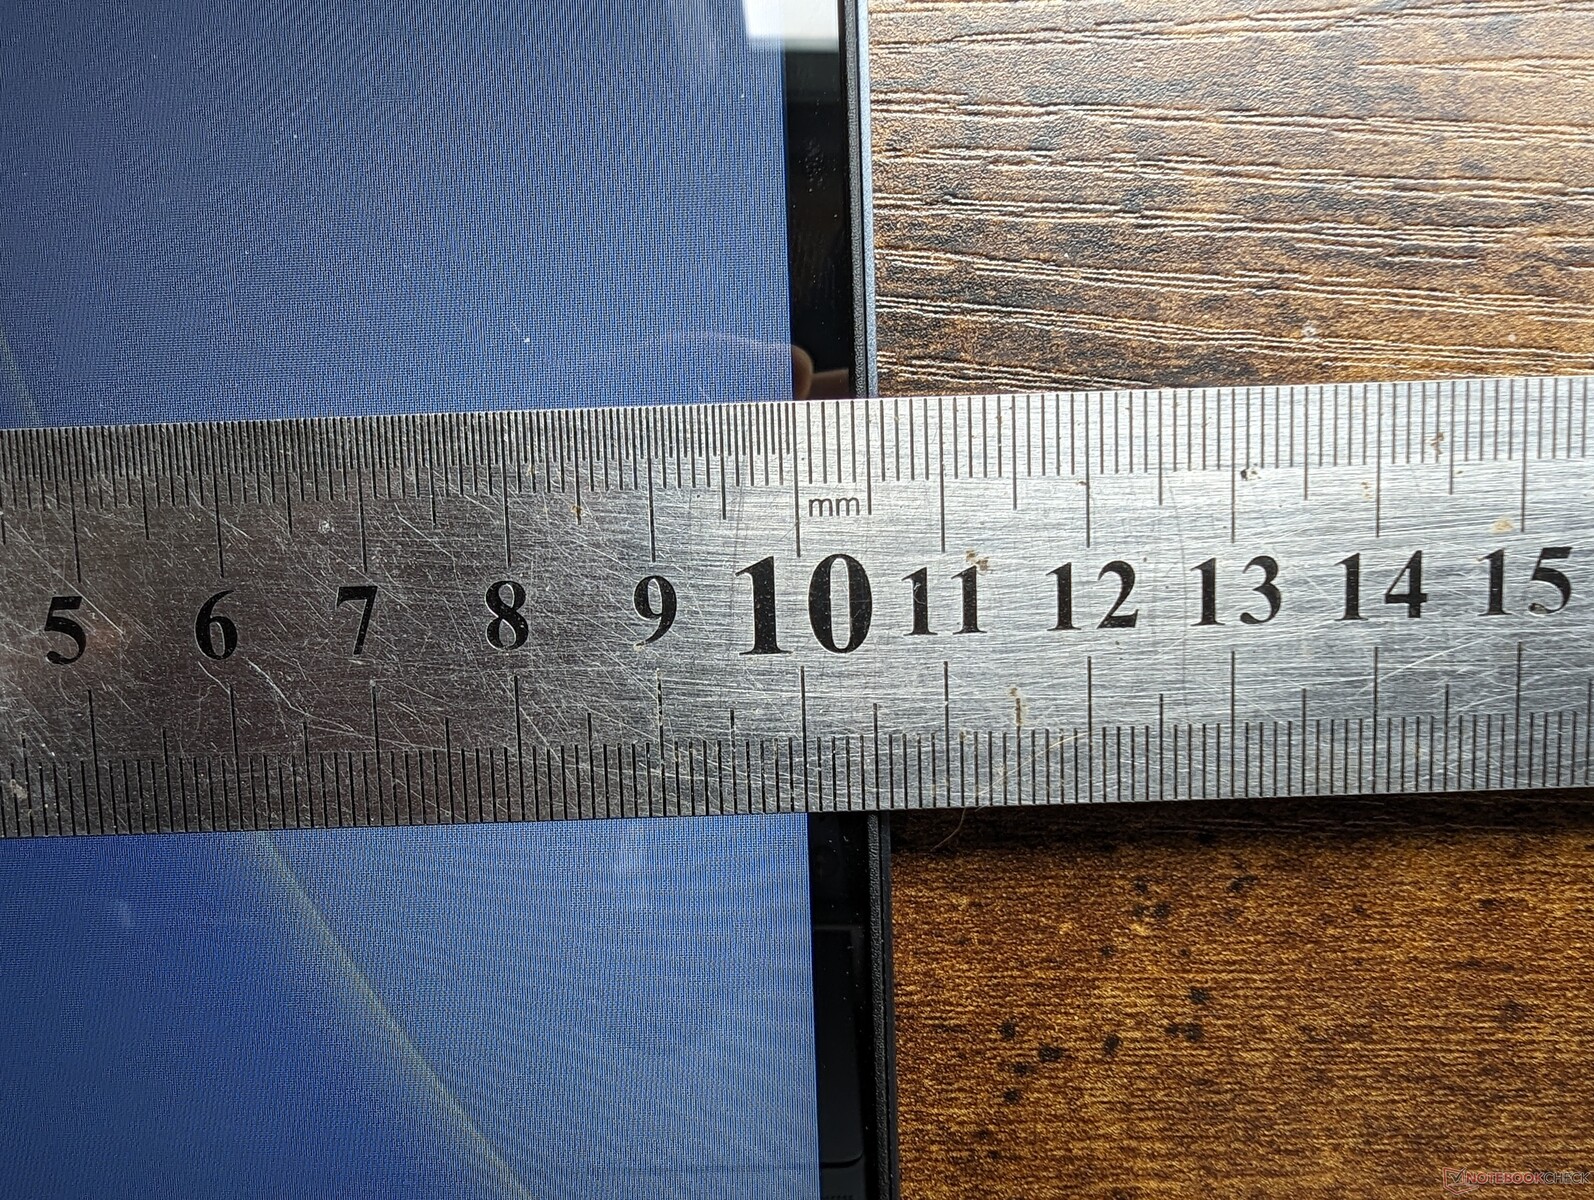
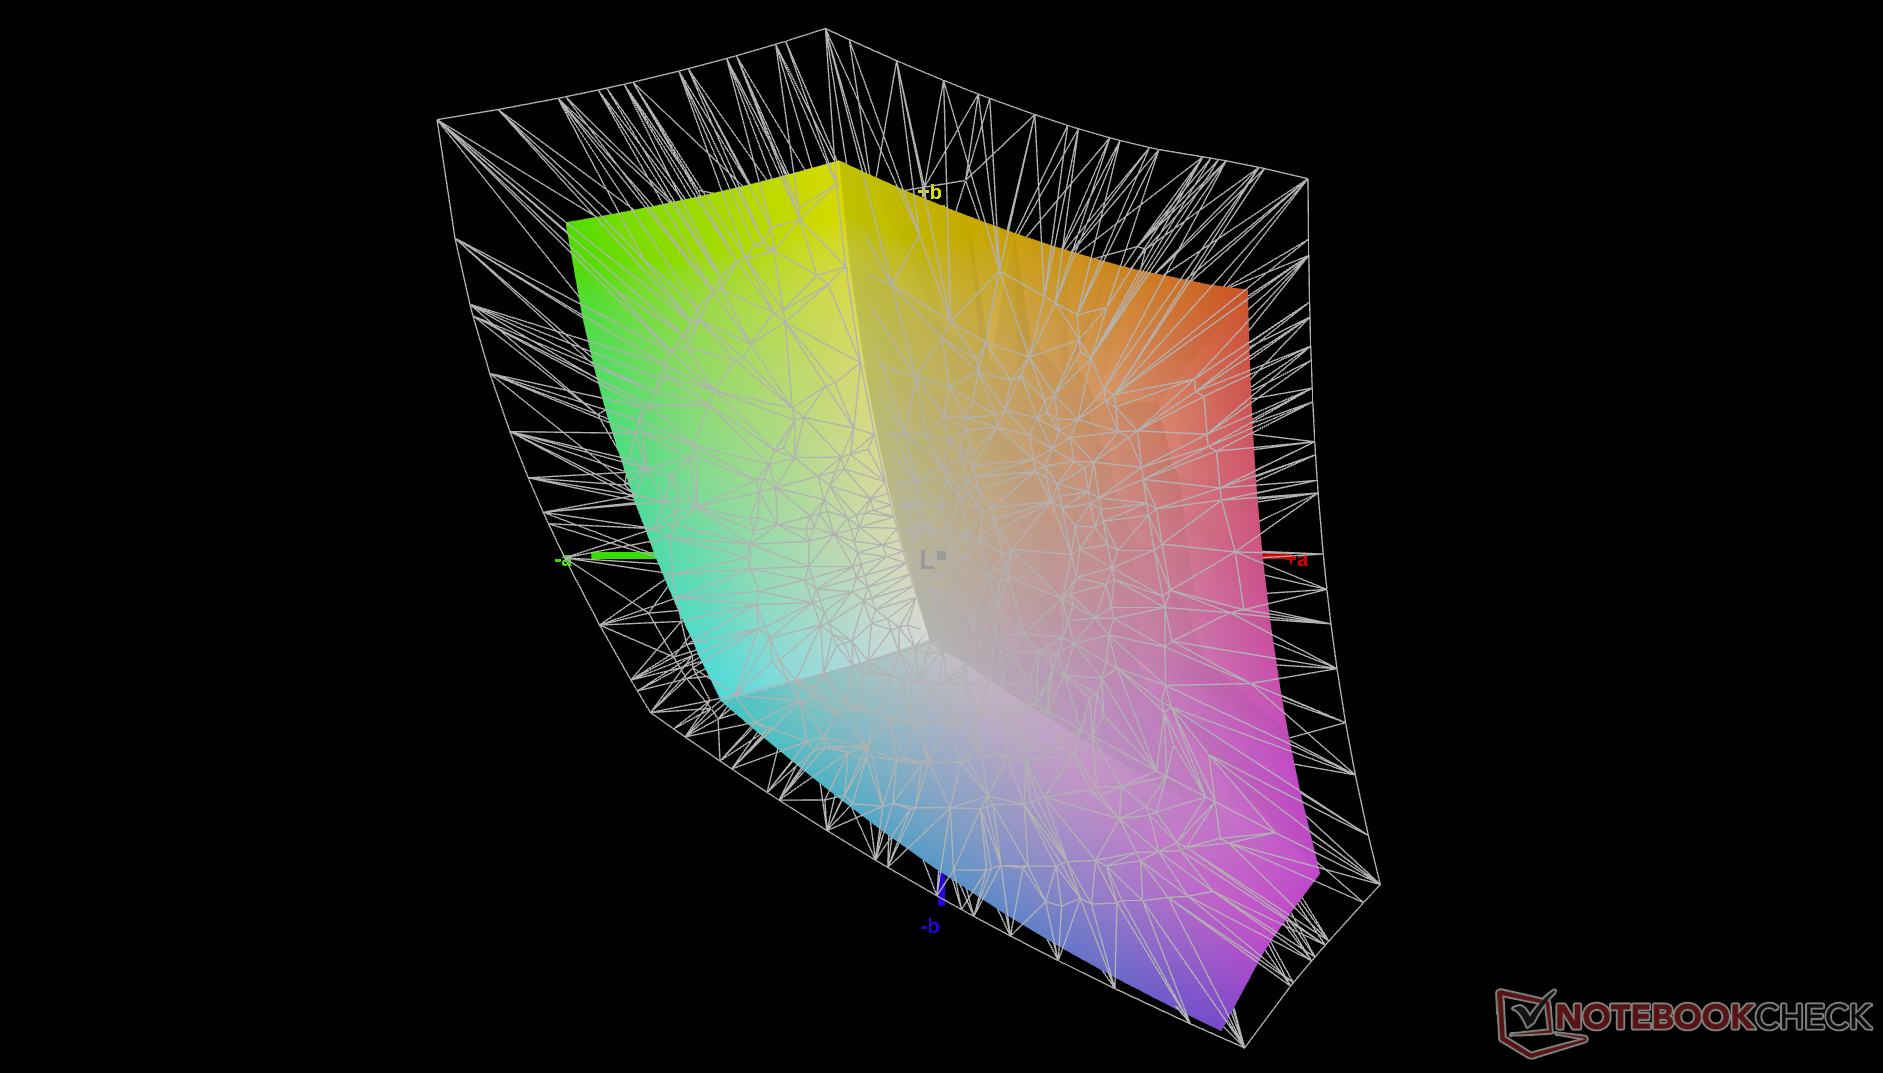
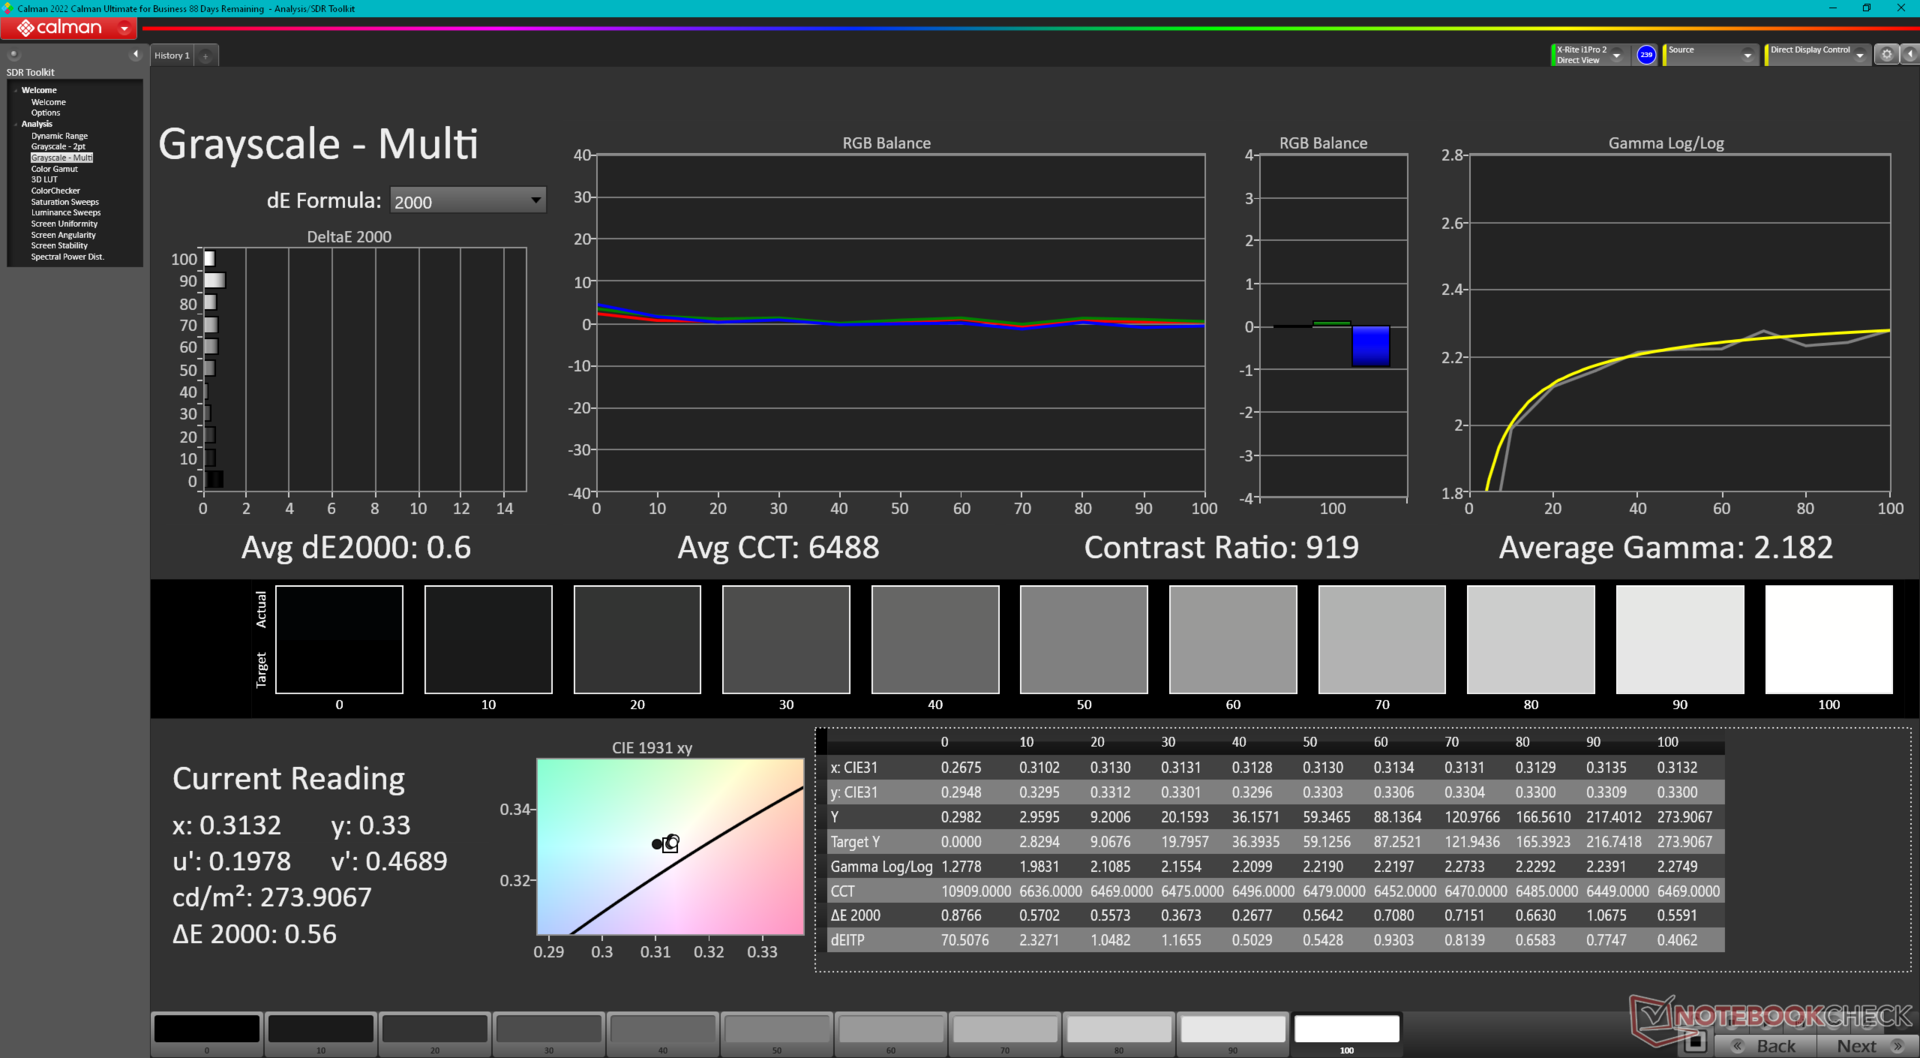
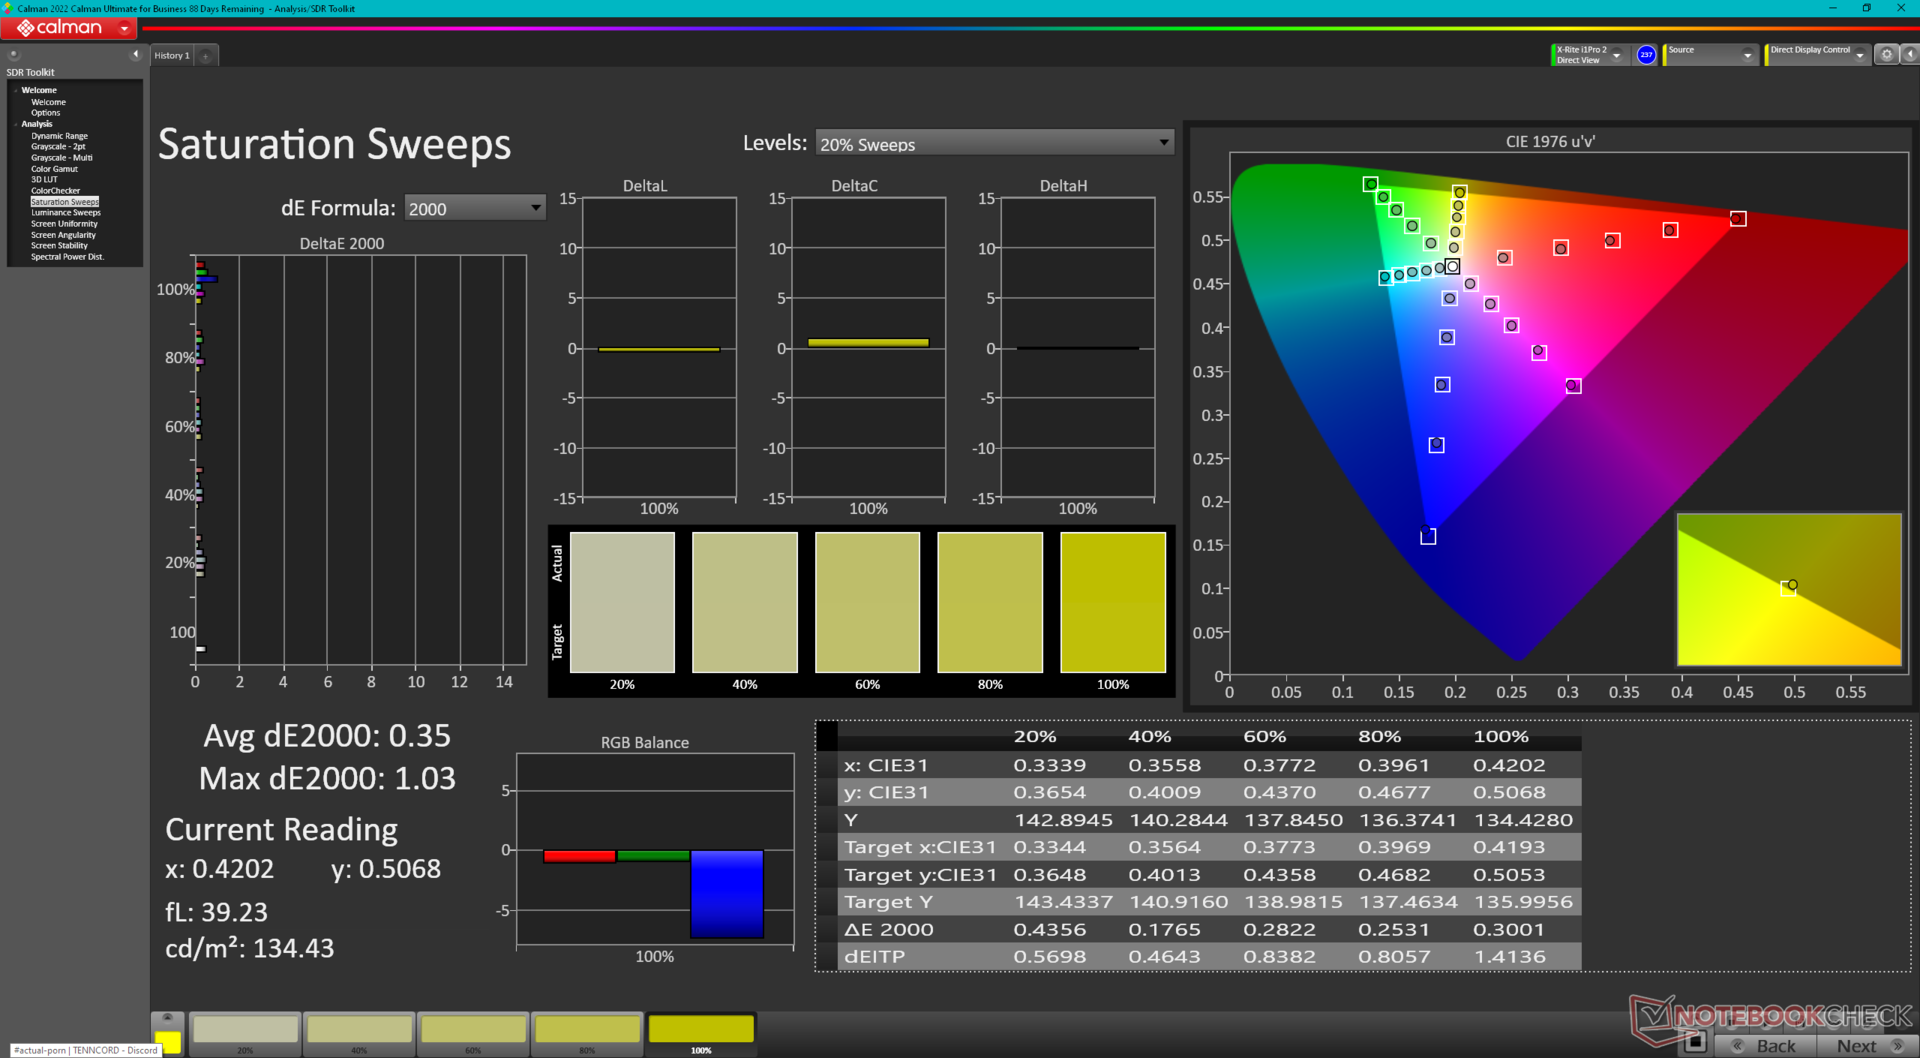
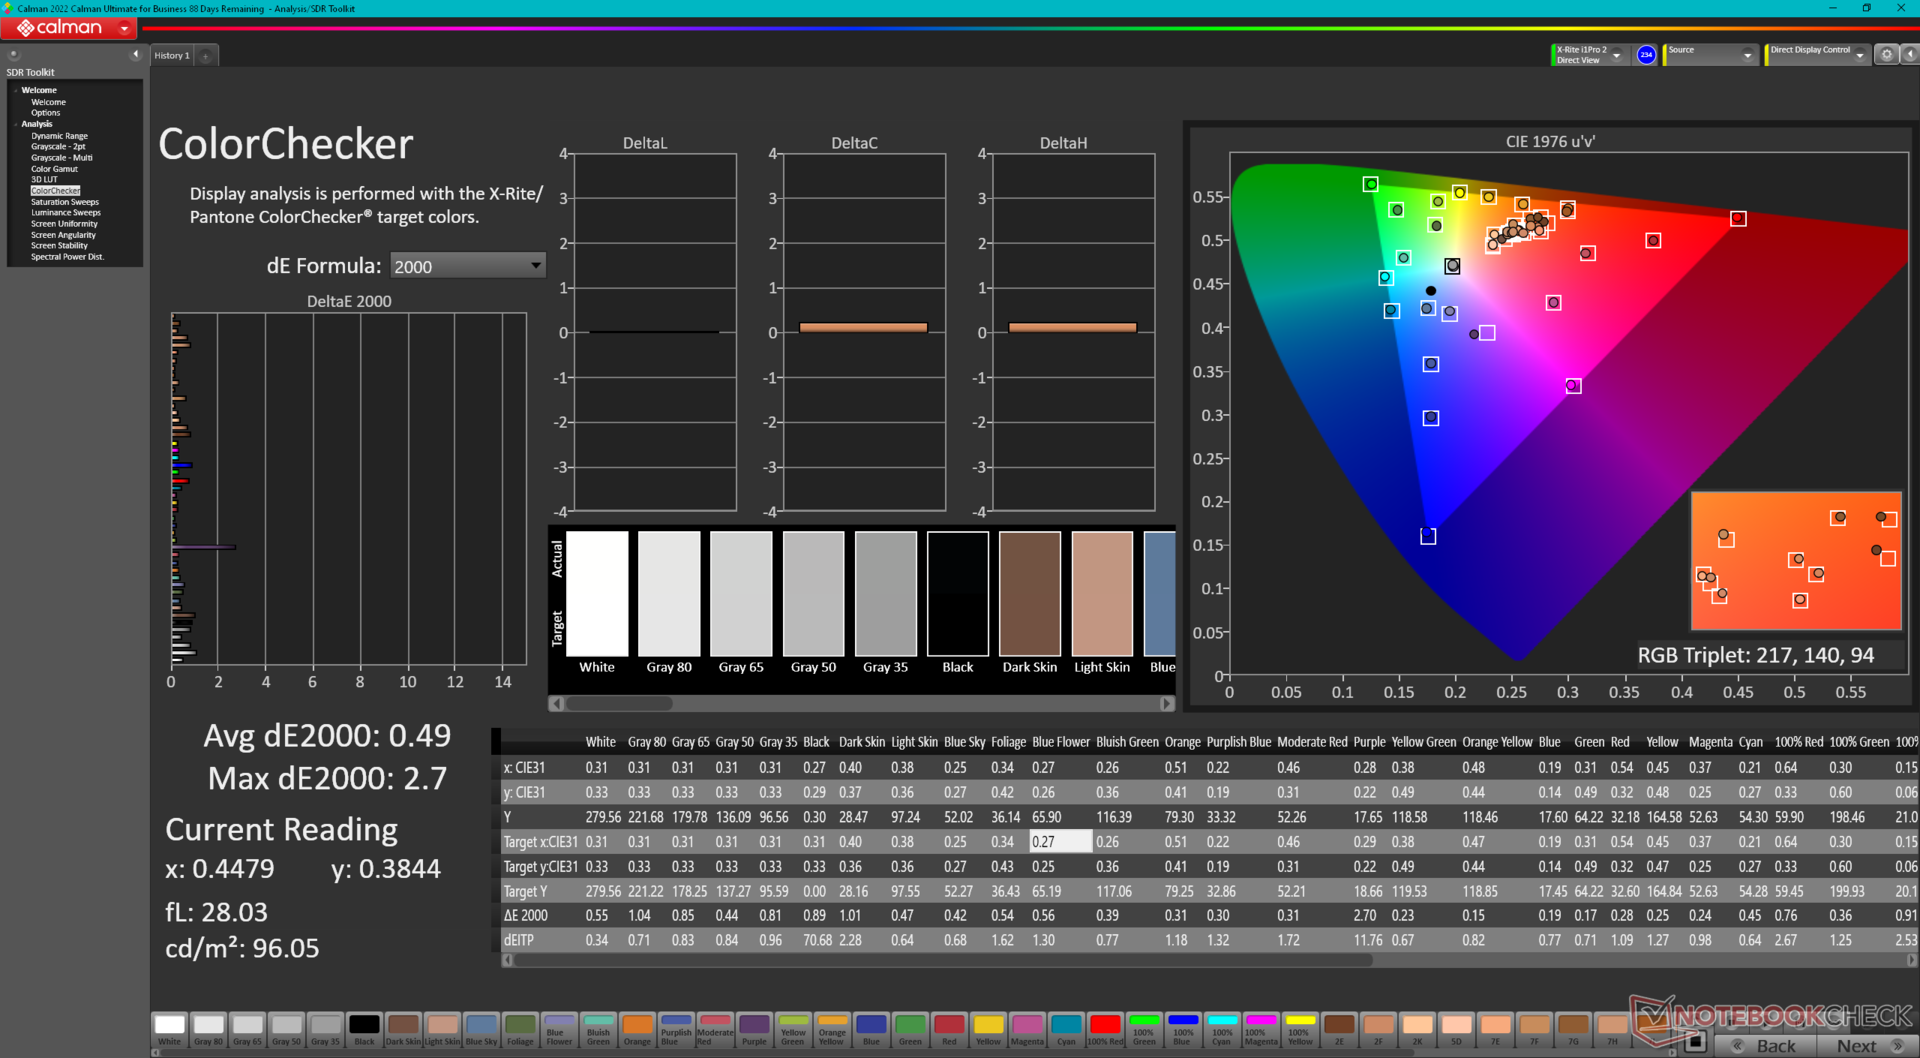
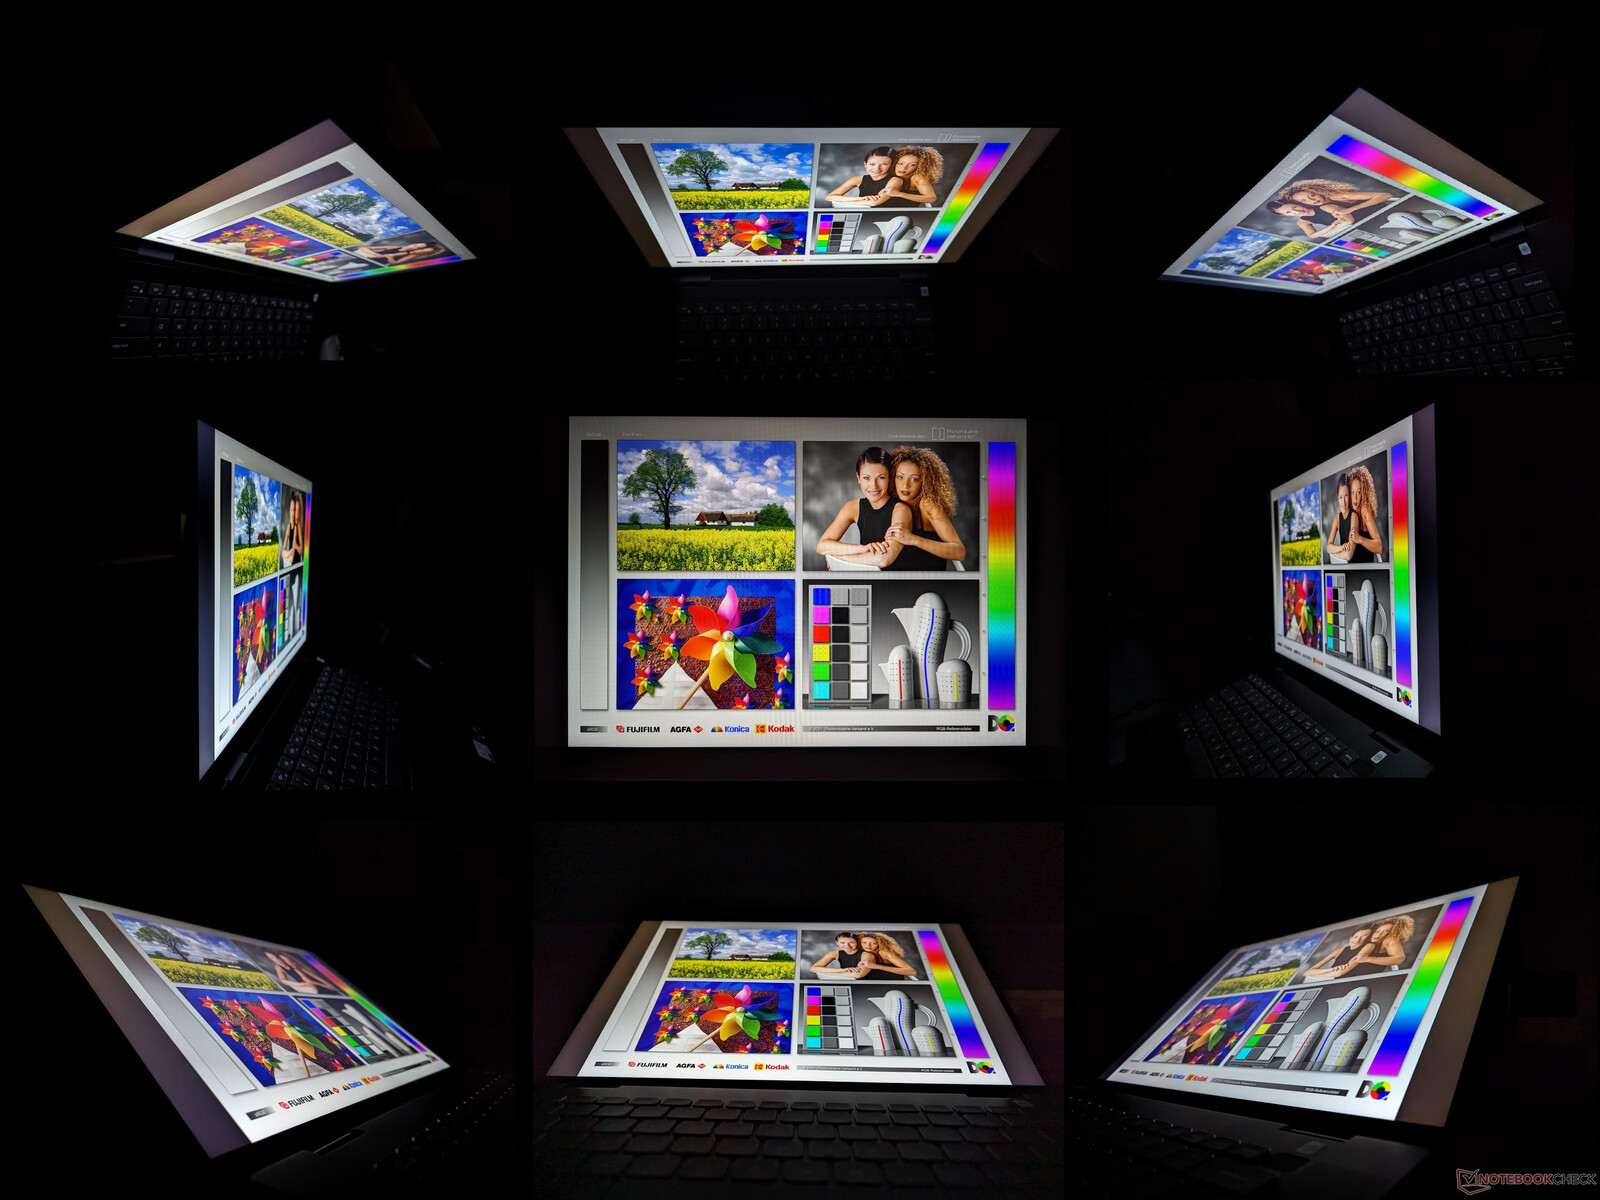
Display - Fullständiga sRGB-färger
Modellen är den första i vår databas som levereras med Chi Mei 160JCA IPS-panel, medan panelen på förra årets modell var BOE NV16N45. Kärnattributen är annars nästan identiska mellan de två panelerna, inklusive deras kontrastförhållande på ~1000:1, full sRGB-täckning, 60 Hz uppdateringsfrekvens och genomsnittliga svarstider. Den visuella upplevelsen är därför i princip densamma mellan 2022- och 2023-modellerna om de inte är konfigurerade med 2400p OLED-alternativet på den Intel-baserade Inspiron 16 7630 2-in-1.
Även om vår Chi Mei-panel är av högre kvalitet än LEN160WUXGA påIdeaPad Flex 5 16 när det gäller färger, skulle det ha varit trevligt att se Dell gå den extra milen i år genom att inkludera snabbare 90 Hz eller 120 Hz uppdateringsfrekvensalternativ för ett smidigare användargränssnitt.
| |||||||||||||||||||||||||
Distribution av ljusstyrkan: 79 %
Mitt på batteriet: 301.3 cd/m²
Kontrast: 1076:1 (Svärta: 0.28 cd/m²)
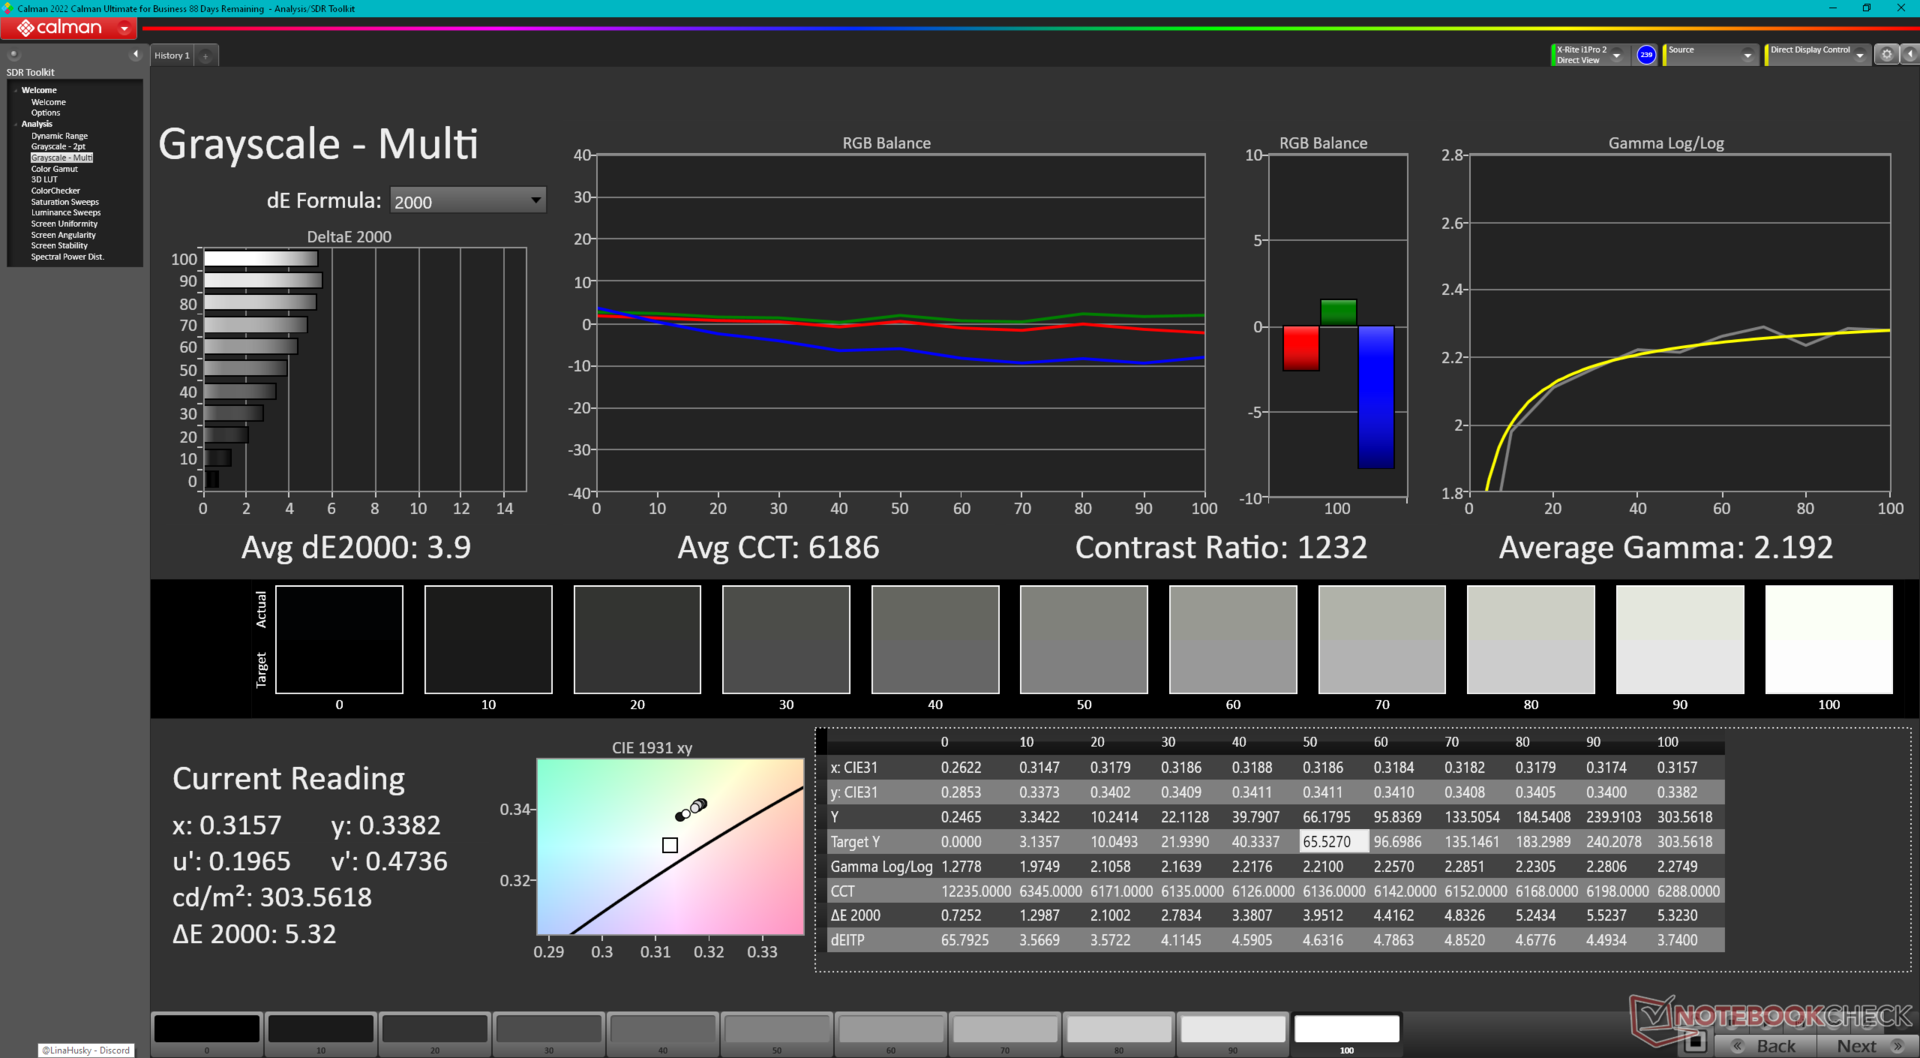
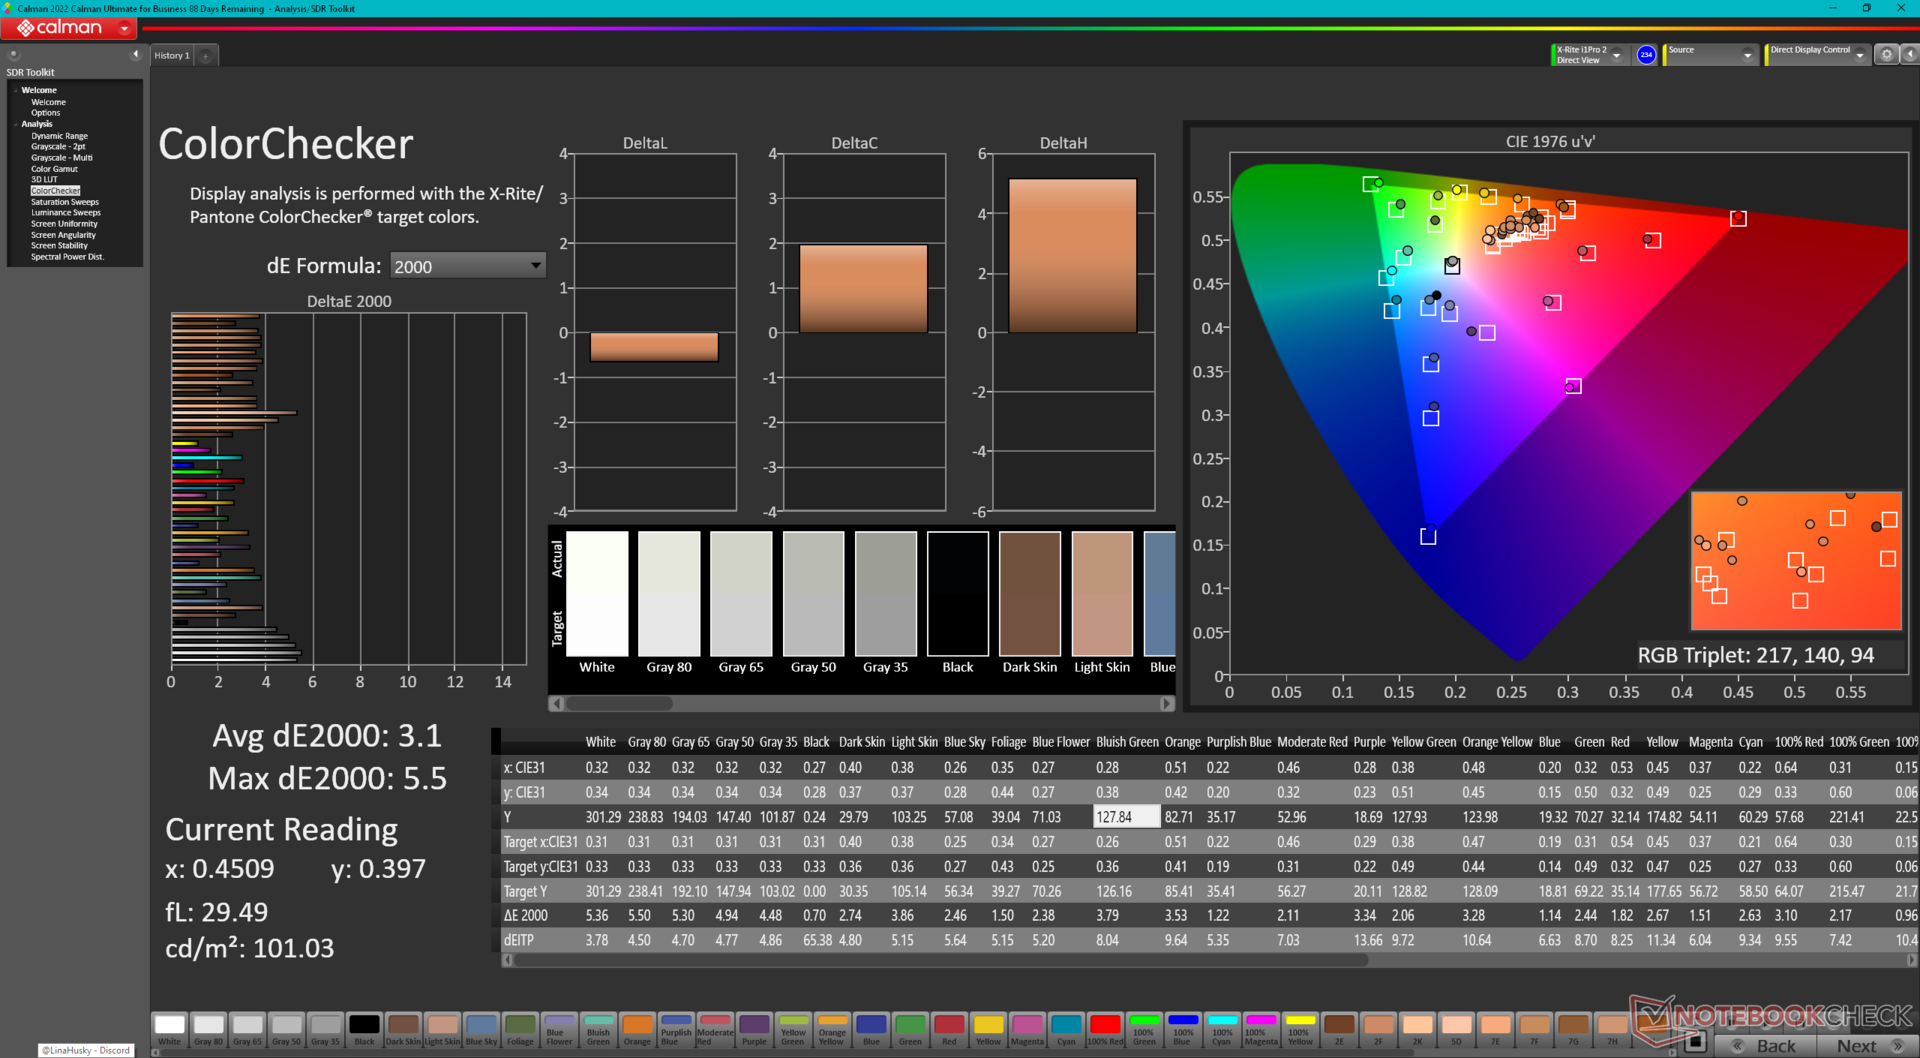
ΔE ColorChecker Calman: 3.1 | ∀{0.5-29.43 Ø4.71}
calibrated: 0.49
ΔE Greyscale Calman: 3.9 | ∀{0.09-98 Ø4.96}
69.5% AdobeRGB 1998 (Argyll 3D)
98.2% sRGB (Argyll 3D)
67.4% Display P3 (Argyll 3D)
Gamma: 2.19
CCT: 6186 K
| Dell Inspiron 16 7635 2-in-1 Chi Mei 160JCA, IPS, 1920x1200, 16" | Acer Swift Edge SFE16-42-R1GM Samsung SDC4168, OLED, 3840x2400, 16" | Lenovo Yoga 7 16IRL8 LEN160FHD, IPS, 1920x1200, 16" | Samsung Galaxy Book3 Pro 16 Samsung ATNA60CL03-0, AMOLED, 2880x1800, 16" | Lenovo IdeaPad Flex 5 16ABR G8 LEN160WUXGA, IPS, 1920x1200, 16" | Dell Inspiron 16 7620 2-in-1 BOE NV16N45, IPS, 1920x1200, 16" | |
|---|---|---|---|---|---|---|
| Display | 30% | -37% | 30% | -41% | -1% | |
| Display P3 Coverage (%) | 67.4 | 99.7 48% | 42 -38% | 99.7 48% | 40 -41% | 67 -1% |
| sRGB Coverage (%) | 98.2 | 100 2% | 62.8 -36% | 100 2% | 57.6 -41% | 95.9 -2% |
| AdobeRGB 1998 Coverage (%) | 69.5 | 97.2 40% | 43.5 -37% | 97 40% | 41.3 -41% | 69.3 0% |
| Response Times | 89% | -15% | 91% | -16% | -15% | |
| Response Time Grey 50% / Grey 80% * (ms) | 27.6 ? | 2 ? 93% | 31.8 ? -15% | 2 ? 93% | 33 ? -20% | 32 ? -16% |
| Response Time Black / White * (ms) | 18.2 ? | 3 ? 84% | 20.9 ? -15% | 2 ? 89% | 20.2 ? -11% | 20.8 ? -14% |
| PWM Frequency (Hz) | 239 ? | |||||
| Screen | -43% | -63% | 250% | -149% | -24% | |
| Brightness middle (cd/m²) | 301.3 | 369 22% | 279.4 -7% | 412 37% | 392 30% | 320.7 6% |
| Brightness (cd/m²) | 269 | 371 38% | 257 -4% | 412 53% | 371 38% | 309 15% |
| Brightness Distribution (%) | 79 | 97 23% | 81 3% | 98 24% | 89 13% | 90 14% |
| Black Level * (cd/m²) | 0.28 | 0.18 36% | 0.015 95% | 0.25 11% | 0.36 -29% | |
| Contrast (:1) | 1076 | 1552 44% | 27467 2453% | 1568 46% | 891 -17% | |
| Colorchecker dE 2000 * | 3.1 | 2.3 26% | 5.12 -65% | 2.34 25% | 7.3 -135% | 4.18 -35% |
| Colorchecker dE 2000 max. * | 5.5 | 4.37 21% | 19.42 -253% | 3.34 39% | 20.8 -278% | 8.48 -54% |
| Colorchecker dE 2000 calibrated * | 0.49 | 2.87 -486% | 1.84 -276% | 2.95 -502% | 5.4 -1002% | 0.77 -57% |
| Greyscale dE 2000 * | 3.9 | 1.83 53% | 5.5 -41% | 2.78 29% | 6.5 -67% | 6.3 -62% |
| Gamma | 2.19 100% | 2.39 92% | 2.22 99% | 2.5 88% | 2.29 96% | 2.21 100% |
| CCT | 6186 105% | 6392 102% | 6407 101% | 6879 94% | 5993 108% | 6258 104% |
| Totalt genomsnitt (program/inställningar) | 25% /
-3% | -38% /
-50% | 124% /
180% | -69% /
-107% | -13% /
-18% |
* ... mindre är bättre
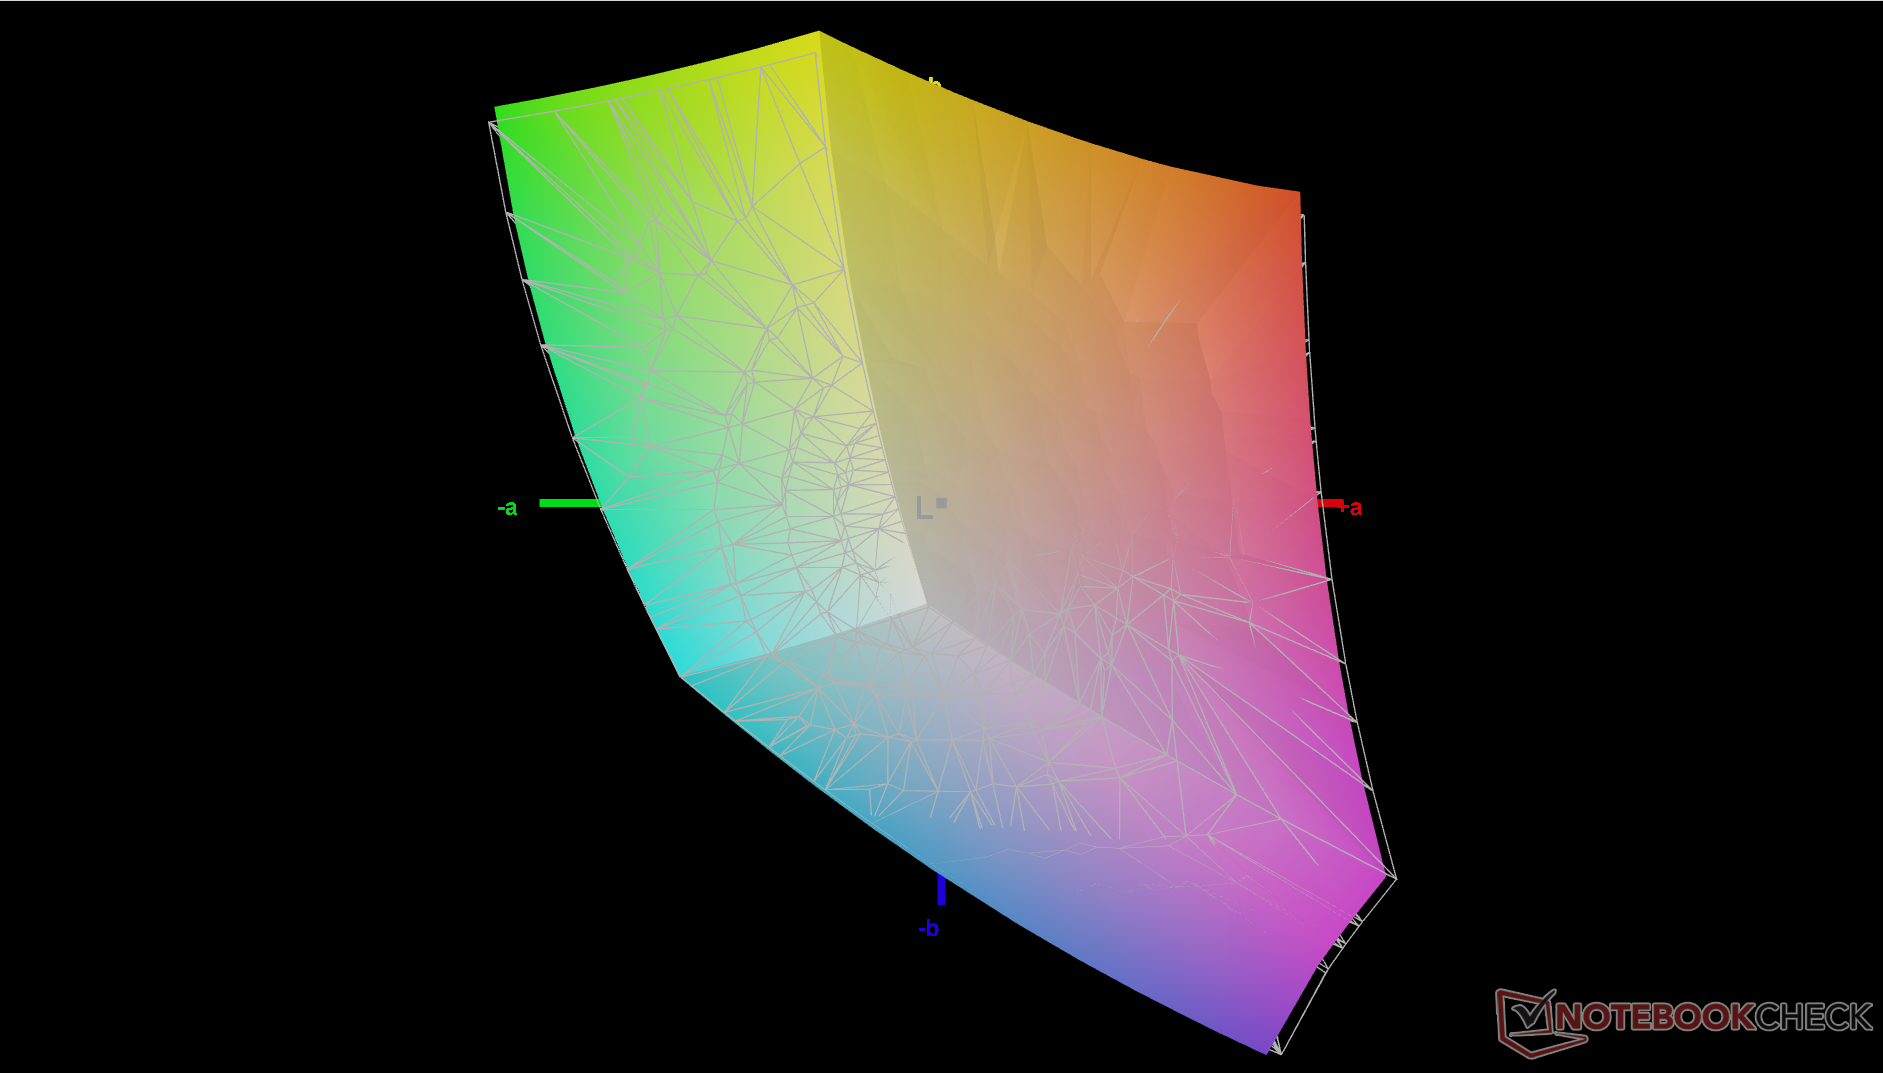
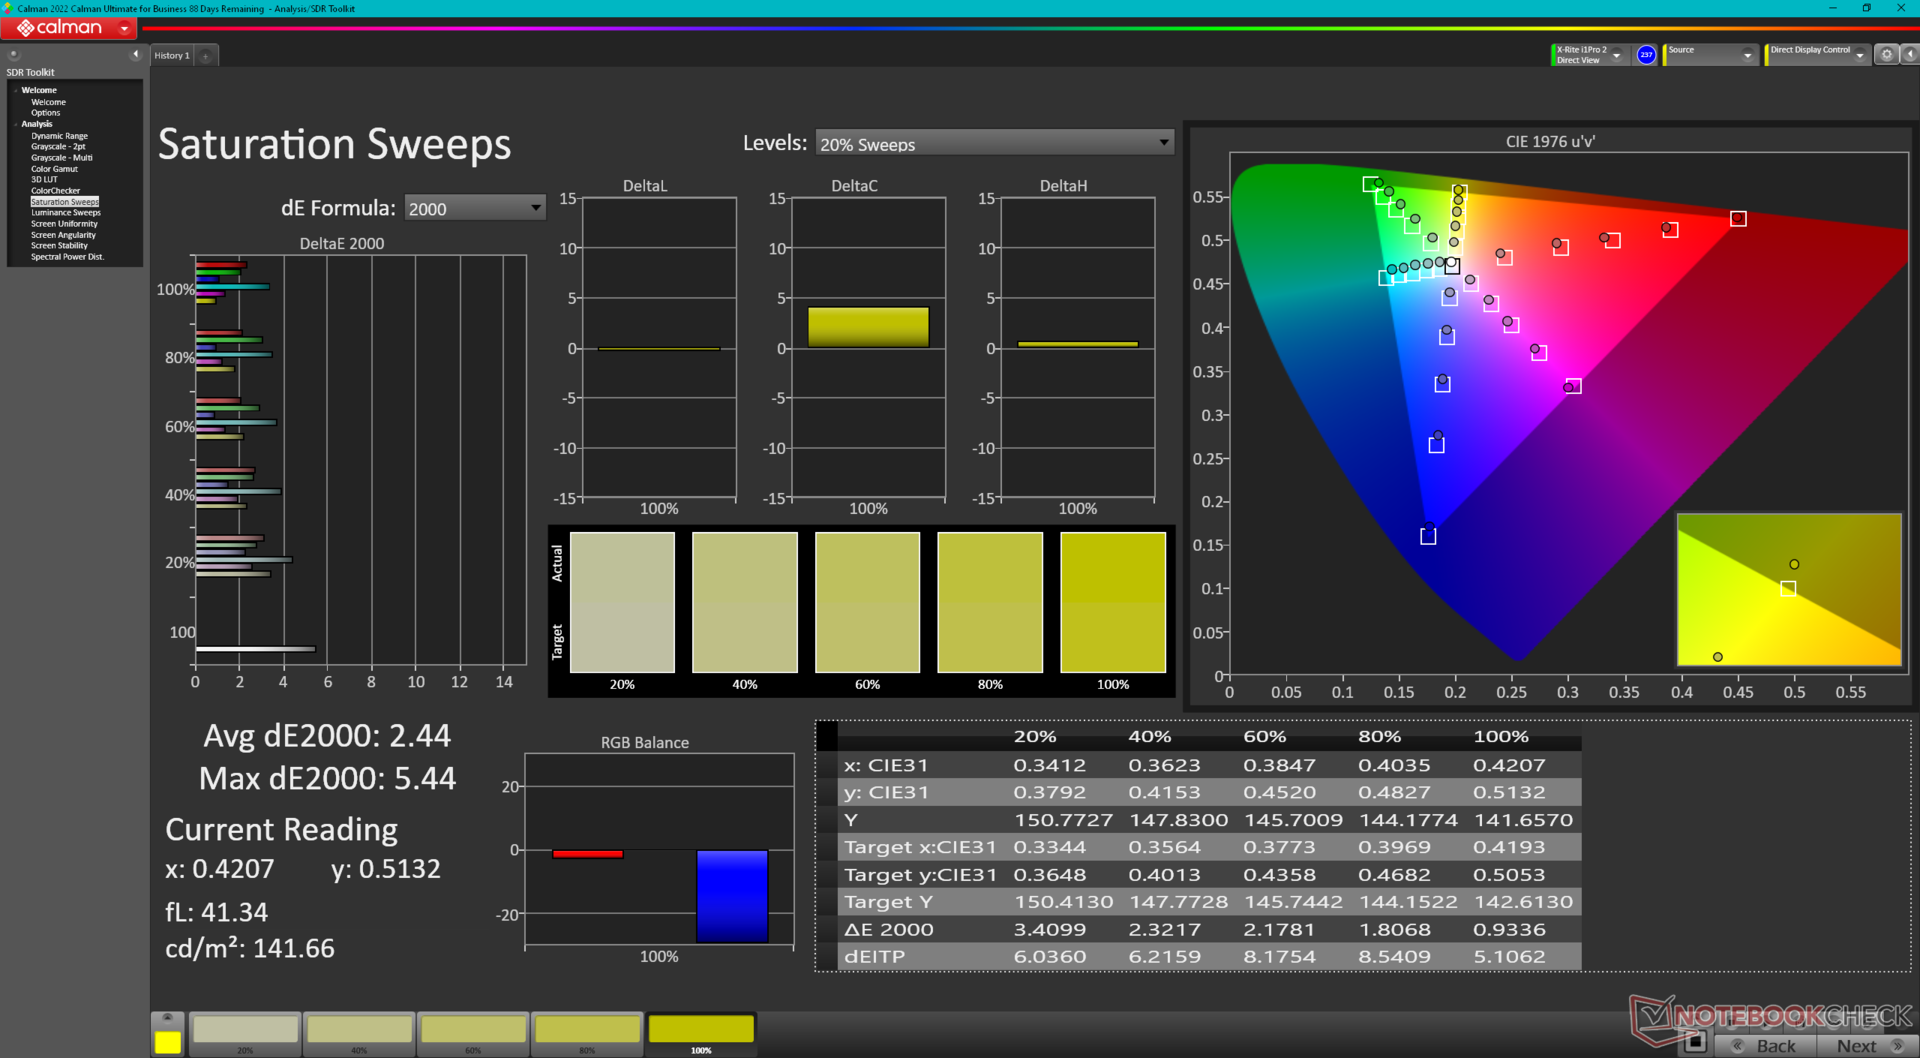
Skärmen levereras inte förkalibrerad, vilket är att förvänta sig av en budgetmaskin. Trots detta är de genomsnittliga deltaE-värdena för gråskala och färg inte dåliga med bara 3,9 respektive 3,1. En korrekt kalibrering skulle förbättra medelvärdena ytterligare till bara 0,6 och 0,49 och därför rekommenderar vi att du använder vår kalibrerade ICM-profil ovan för att bättre utnyttja panelens fullständiga sRGB-färger.
Visa svarstider
| ↔ Svarstid svart till vitt | ||
|---|---|---|
| 18.2 ms ... stiga ↗ och falla ↘ kombinerat | ↗ 9.6 ms stiga | 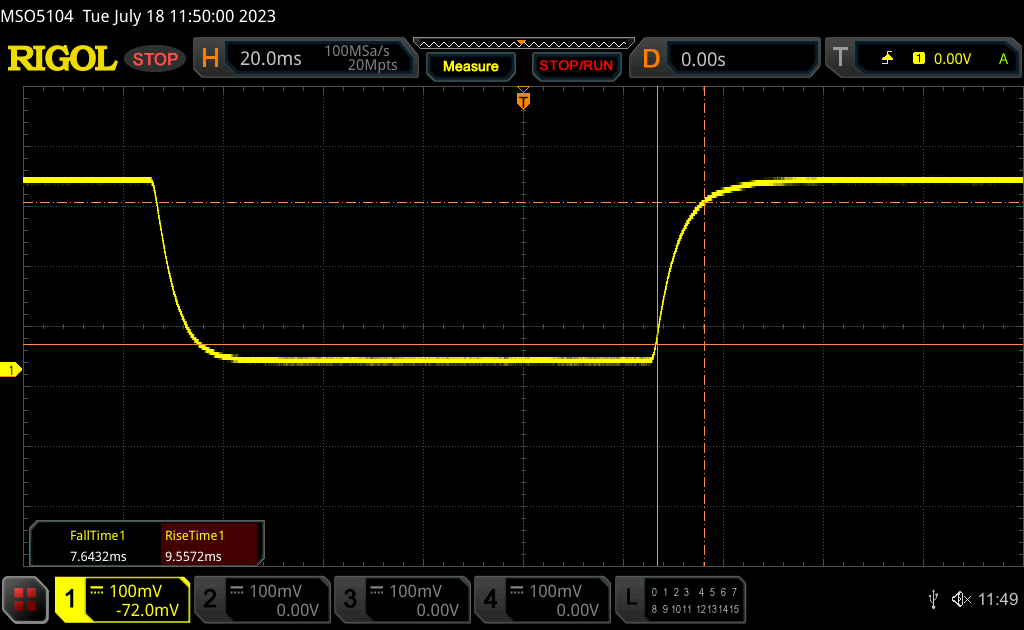 |
| ↘ 7.6 ms hösten | ||
| Skärmen visar bra svarsfrekvens i våra tester, men kan vara för långsam för konkurrenskraftiga spelare. I jämförelse sträcker sig alla testade enheter från 0.1 (minst) till 240 (maximalt) ms. » 41 % av alla enheter är bättre. Det betyder att den uppmätta svarstiden liknar genomsnittet av alla testade enheter (19.8 ms). | ||
| ↔ Svarstid 50 % grått till 80 % grått | ||
| 27.6 ms ... stiga ↗ och falla ↘ kombinerat | ↗ 13.2 ms stiga | 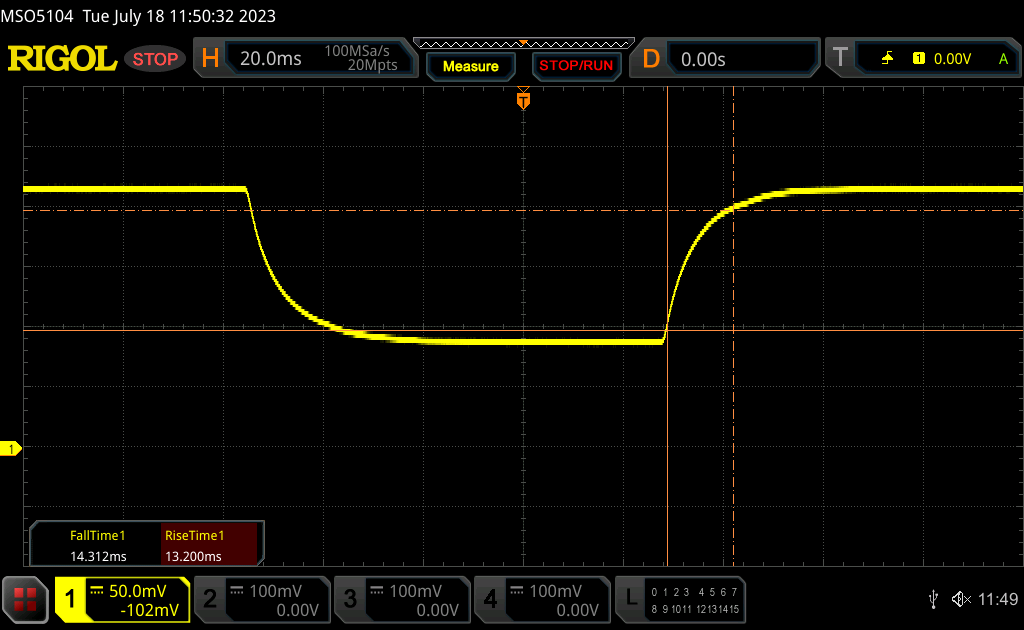 |
| ↘ 14.3 ms hösten | ||
| Skärmen visar relativt långsamma svarsfrekvenser i våra tester och kan vara för långsam för spelare. I jämförelse sträcker sig alla testade enheter från 0.165 (minst) till 636 (maximalt) ms. » 37 % av alla enheter är bättre. Det betyder att den uppmätta svarstiden är bättre än genomsnittet av alla testade enheter (31 ms). | ||
Skärmflimmer / PWM (Puls-Width Modulation)
| Skärmflimmer / PWM upptäcktes inte | 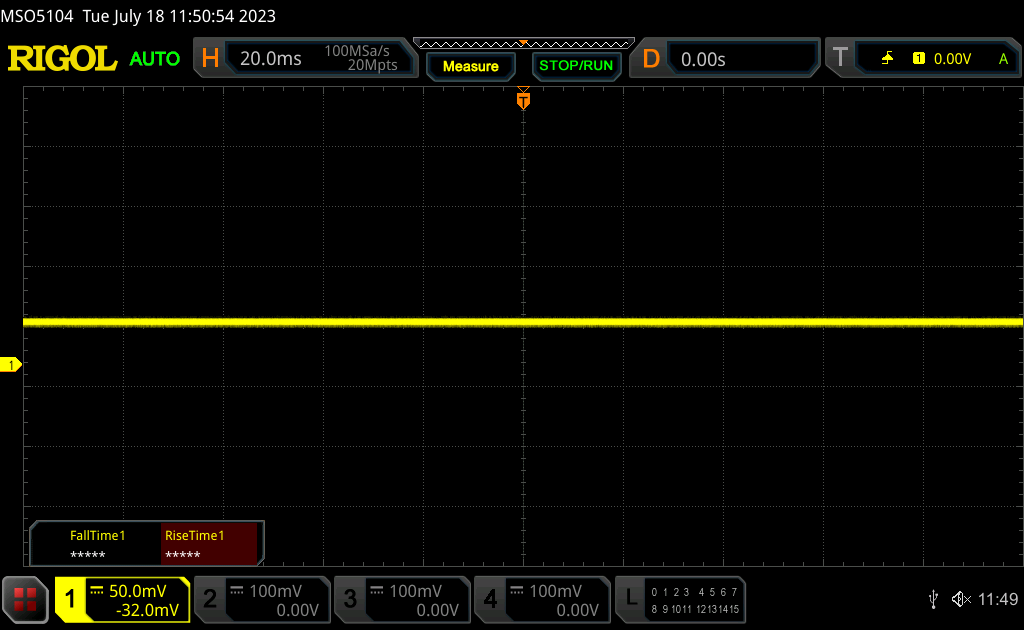 | ||
Som jämförelse: 52 % av alla testade enheter använder inte PWM för att dämpa skärmen. Om PWM upptäcktes mättes ett medelvärde av 7754 (minst: 5 - maximum: 343500) Hz. | |||
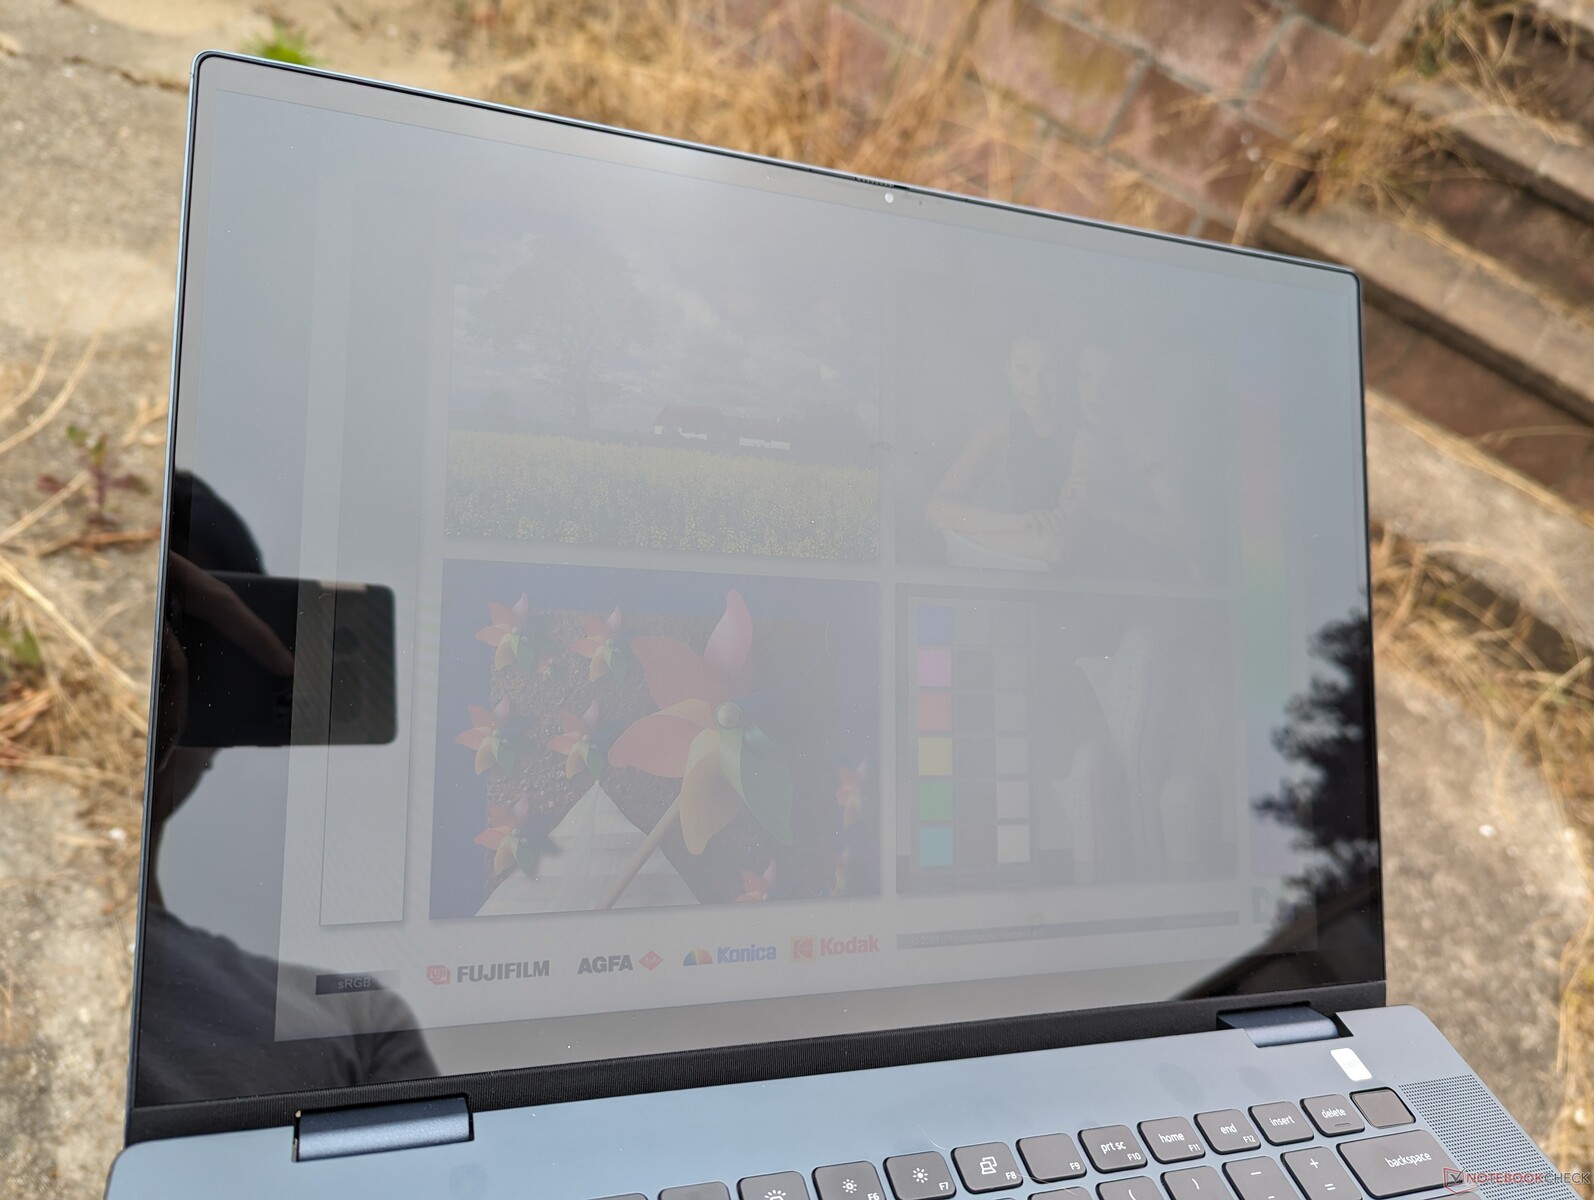
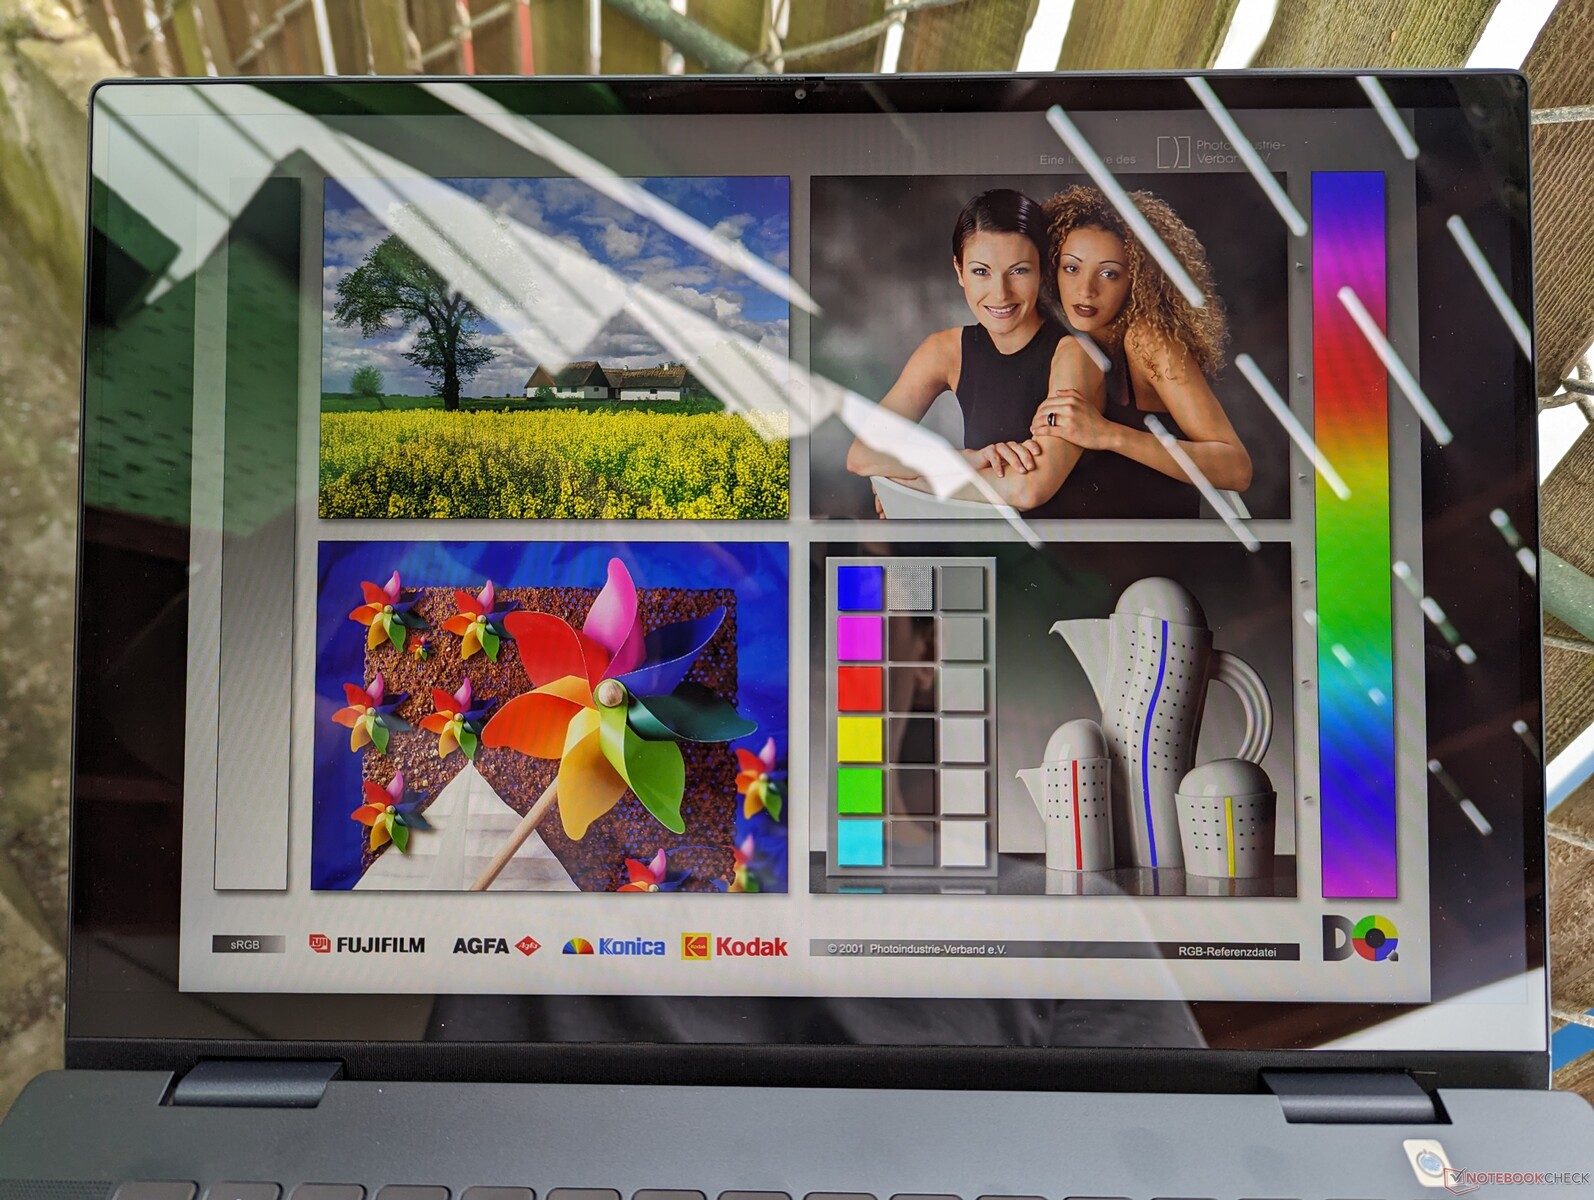
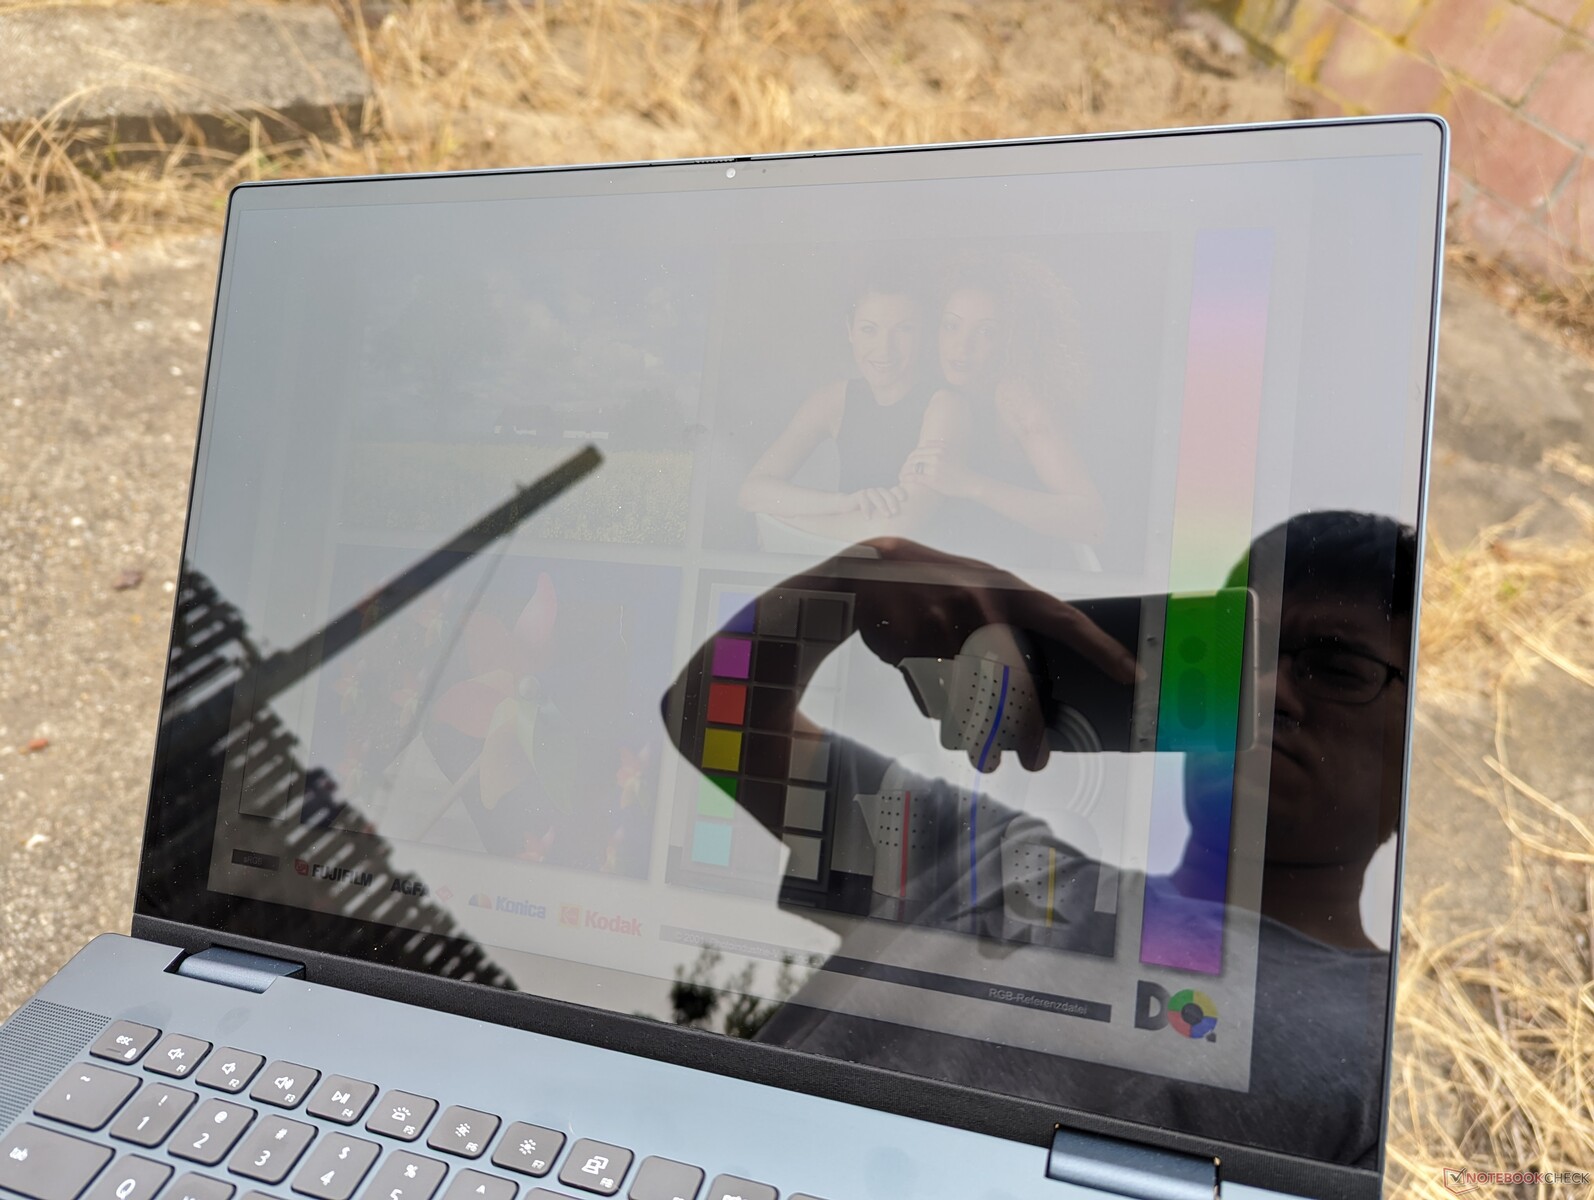
Sikten utomhus är i bästa fall genomsnittlig eftersom pekskärmen på 300 nit inte är tillräckligt ljusstark för att avsevärt minska eller motverka bländning. Surfplattor som iPad Pro 12,6 kan vara två gånger ljusstarkare eller mer. Dell är först och främst en konvertibel multimediadator för inomhusmiljöer.
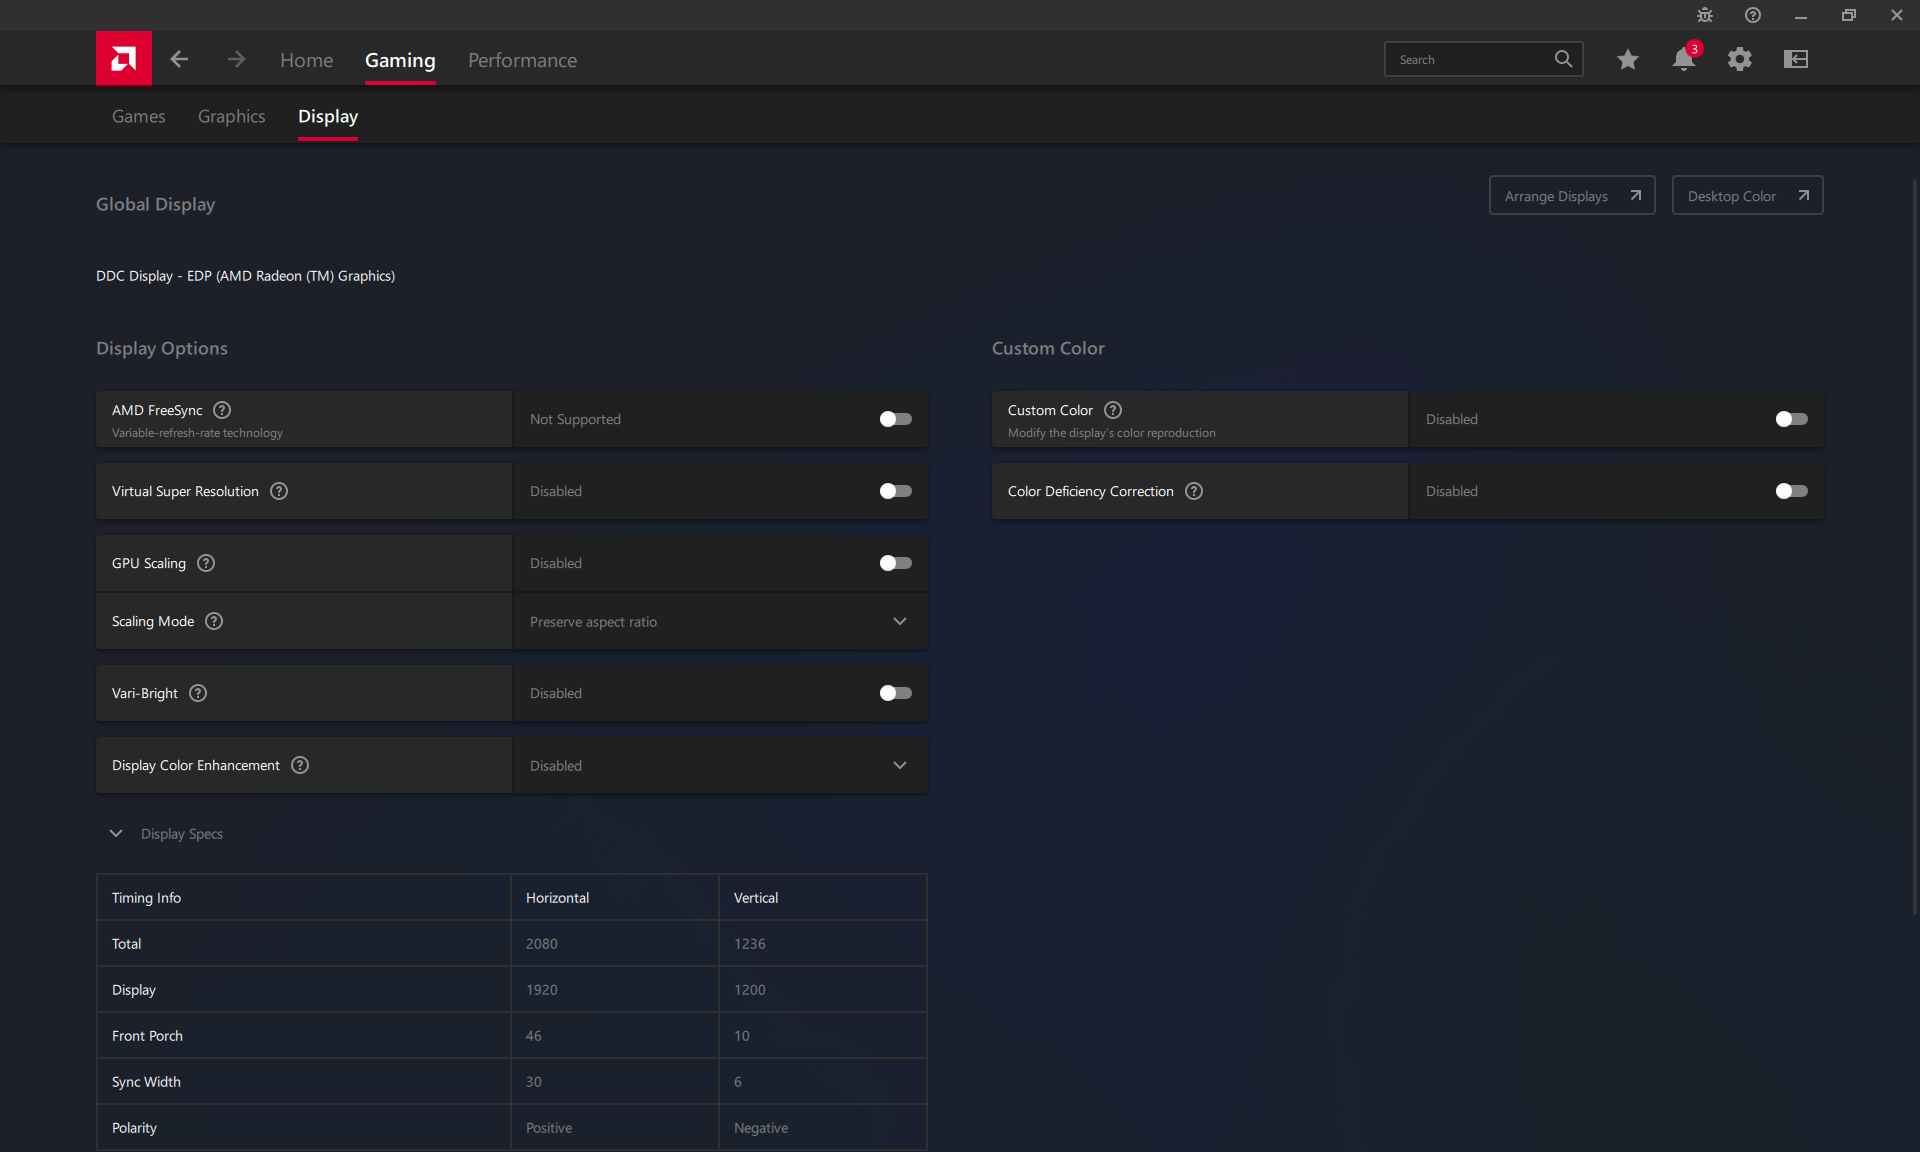
Se till att inaktivera AMD Vari-Bright via AMD Adrenalin, annars minskar den maximala ljusstyrkan när du kör på batteri.
Prestanda - Inte alla Ryzen 7000-processorer är Zen 4
Villkor för testning
Vi ställde in vår enhet till prestandaläge via Windows innan vi körde riktmärkena nedan. Ytterligare grafiska inställningar är tillgängliga på AMD Adrenalin som inte kom förinstallerad på vår enhet. Vi rekommenderar att du installerar AMD:s verktyg för automatisk detektering av Adrenalin och de senaste grafikdrivrutinerna.
Processor
Ryzen 5Ryzen 5 7530U presterar nästan identiskt med förra årets Ryzen 5 6600H om än med en lägre effektnivå för högre prestanda per watt. Det är därför en mellanklass-CPU som är jämförbar med den konkurrerande Core i5-1235U eller Core i7-1255U som finns i många Ultrabooks somhP Spectre x360 13.5. I typisk AMD-anda är dock single-thread-prestandan cirka 15 till 20 procent långsammare än hos de tidigare nämnda Intel-processorerna.
Uppgradering till 8-kärnig Ryzen 7 7730U från vår 6-kärniga Ryzen 5 7530U förväntas öka flertrådsprestandan med cirka 15 till 35 procent baserat på vår tid med IdeaPad Flex 5 16. Den Core i7-1360P på Intel Inspiron skulle prestera ännu snabbare.
Cinebench R15 Multi Loop
Cinebench R23: Multi Core | Single Core
Cinebench R20: CPU (Multi Core) | CPU (Single Core)
Cinebench R15: CPU Multi 64Bit | CPU Single 64Bit
Blender: v2.79 BMW27 CPU
7-Zip 18.03: 7z b 4 | 7z b 4 -mmt1
Geekbench 5.5: Multi-Core | Single-Core
HWBOT x265 Benchmark v2.2: 4k Preset
LibreOffice : 20 Documents To PDF
R Benchmark 2.5: Overall mean
* ... mindre är bättre
AIDA64: FP32 Ray-Trace | FPU Julia | CPU SHA3 | CPU Queen | FPU SinJulia | FPU Mandel | CPU AES | CPU ZLib | FP64 Ray-Trace | CPU PhotoWorxx
| Performance rating | |
| Acer Swift Edge SFE16-42-R1GM | |
| Lenovo IdeaPad Flex 5 16ABR G8 | |
| Samsung Galaxy Book3 Pro 16 | |
| Dell Inspiron 16 7635 2-in-1 | |
| Genomsnitt AMD Ryzen 5 7530U | |
| Lenovo Yoga 7 16IRL8 | |
| Dell Inspiron 16 7620 2-in-1 | |
| AIDA64 / FP32 Ray-Trace | |
| Lenovo IdeaPad Flex 5 16ABR G8 | |
| Acer Swift Edge SFE16-42-R1GM | |
| Dell Inspiron 16 7635 2-in-1 | |
| Genomsnitt AMD Ryzen 5 7530U (7609 - 10970, n=9) | |
| Samsung Galaxy Book3 Pro 16 | |
| Lenovo Yoga 7 16IRL8 | |
| Dell Inspiron 16 7620 2-in-1 | |
| AIDA64 / FPU Julia | |
| Lenovo IdeaPad Flex 5 16ABR G8 | |
| Acer Swift Edge SFE16-42-R1GM | |
| Dell Inspiron 16 7635 2-in-1 | |
| Genomsnitt AMD Ryzen 5 7530U (48473 - 68384, n=9) | |
| Samsung Galaxy Book3 Pro 16 | |
| Lenovo Yoga 7 16IRL8 | |
| Dell Inspiron 16 7620 2-in-1 | |
| AIDA64 / CPU SHA3 | |
| Samsung Galaxy Book3 Pro 16 | |
| Lenovo IdeaPad Flex 5 16ABR G8 | |
| Acer Swift Edge SFE16-42-R1GM | |
| Lenovo Yoga 7 16IRL8 | |
| Dell Inspiron 16 7635 2-in-1 | |
| Genomsnitt AMD Ryzen 5 7530U (1591 - 2323, n=9) | |
| Dell Inspiron 16 7620 2-in-1 | |
| AIDA64 / CPU Queen | |
| Lenovo IdeaPad Flex 5 16ABR G8 | |
| Acer Swift Edge SFE16-42-R1GM | |
| Samsung Galaxy Book3 Pro 16 | |
| Dell Inspiron 16 7620 2-in-1 | |
| Dell Inspiron 16 7635 2-in-1 | |
| Genomsnitt AMD Ryzen 5 7530U (66646 - 78105, n=8) | |
| Lenovo Yoga 7 16IRL8 | |
| AIDA64 / FPU SinJulia | |
| Acer Swift Edge SFE16-42-R1GM | |
| Lenovo IdeaPad Flex 5 16ABR G8 | |
| Dell Inspiron 16 7635 2-in-1 | |
| Genomsnitt AMD Ryzen 5 7530U (7611 - 9248, n=9) | |
| Samsung Galaxy Book3 Pro 16 | |
| Dell Inspiron 16 7620 2-in-1 | |
| Lenovo Yoga 7 16IRL8 | |
| AIDA64 / FPU Mandel | |
| Lenovo IdeaPad Flex 5 16ABR G8 | |
| Acer Swift Edge SFE16-42-R1GM | |
| Dell Inspiron 16 7635 2-in-1 | |
| Genomsnitt AMD Ryzen 5 7530U (26912 - 37624, n=9) | |
| Samsung Galaxy Book3 Pro 16 | |
| Lenovo Yoga 7 16IRL8 | |
| Dell Inspiron 16 7620 2-in-1 | |
| AIDA64 / CPU AES | |
| Samsung Galaxy Book3 Pro 16 | |
| Genomsnitt AMD Ryzen 5 7530U (33314 - 92360, n=9) | |
| Lenovo Yoga 7 16IRL8 | |
| Lenovo IdeaPad Flex 5 16ABR G8 | |
| Acer Swift Edge SFE16-42-R1GM | |
| Dell Inspiron 16 7620 2-in-1 | |
| Dell Inspiron 16 7635 2-in-1 | |
| AIDA64 / CPU ZLib | |
| Samsung Galaxy Book3 Pro 16 | |
| Lenovo Yoga 7 16IRL8 | |
| Acer Swift Edge SFE16-42-R1GM | |
| Lenovo IdeaPad Flex 5 16ABR G8 | |
| Dell Inspiron 16 7620 2-in-1 | |
| Dell Inspiron 16 7635 2-in-1 | |
| Genomsnitt AMD Ryzen 5 7530U (443 - 612, n=9) | |
| AIDA64 / FP64 Ray-Trace | |
| Lenovo IdeaPad Flex 5 16ABR G8 | |
| Acer Swift Edge SFE16-42-R1GM | |
| Dell Inspiron 16 7635 2-in-1 | |
| Genomsnitt AMD Ryzen 5 7530U (4008 - 5738, n=9) | |
| Samsung Galaxy Book3 Pro 16 | |
| Lenovo Yoga 7 16IRL8 | |
| Dell Inspiron 16 7620 2-in-1 | |
| AIDA64 / CPU PhotoWorxx | |
| Samsung Galaxy Book3 Pro 16 | |
| Lenovo Yoga 7 16IRL8 | |
| Acer Swift Edge SFE16-42-R1GM | |
| Dell Inspiron 16 7635 2-in-1 | |
| Lenovo IdeaPad Flex 5 16ABR G8 | |
| Dell Inspiron 16 7620 2-in-1 | |
| Genomsnitt AMD Ryzen 5 7530U (9832 - 19525, n=9) | |
Systemets prestanda
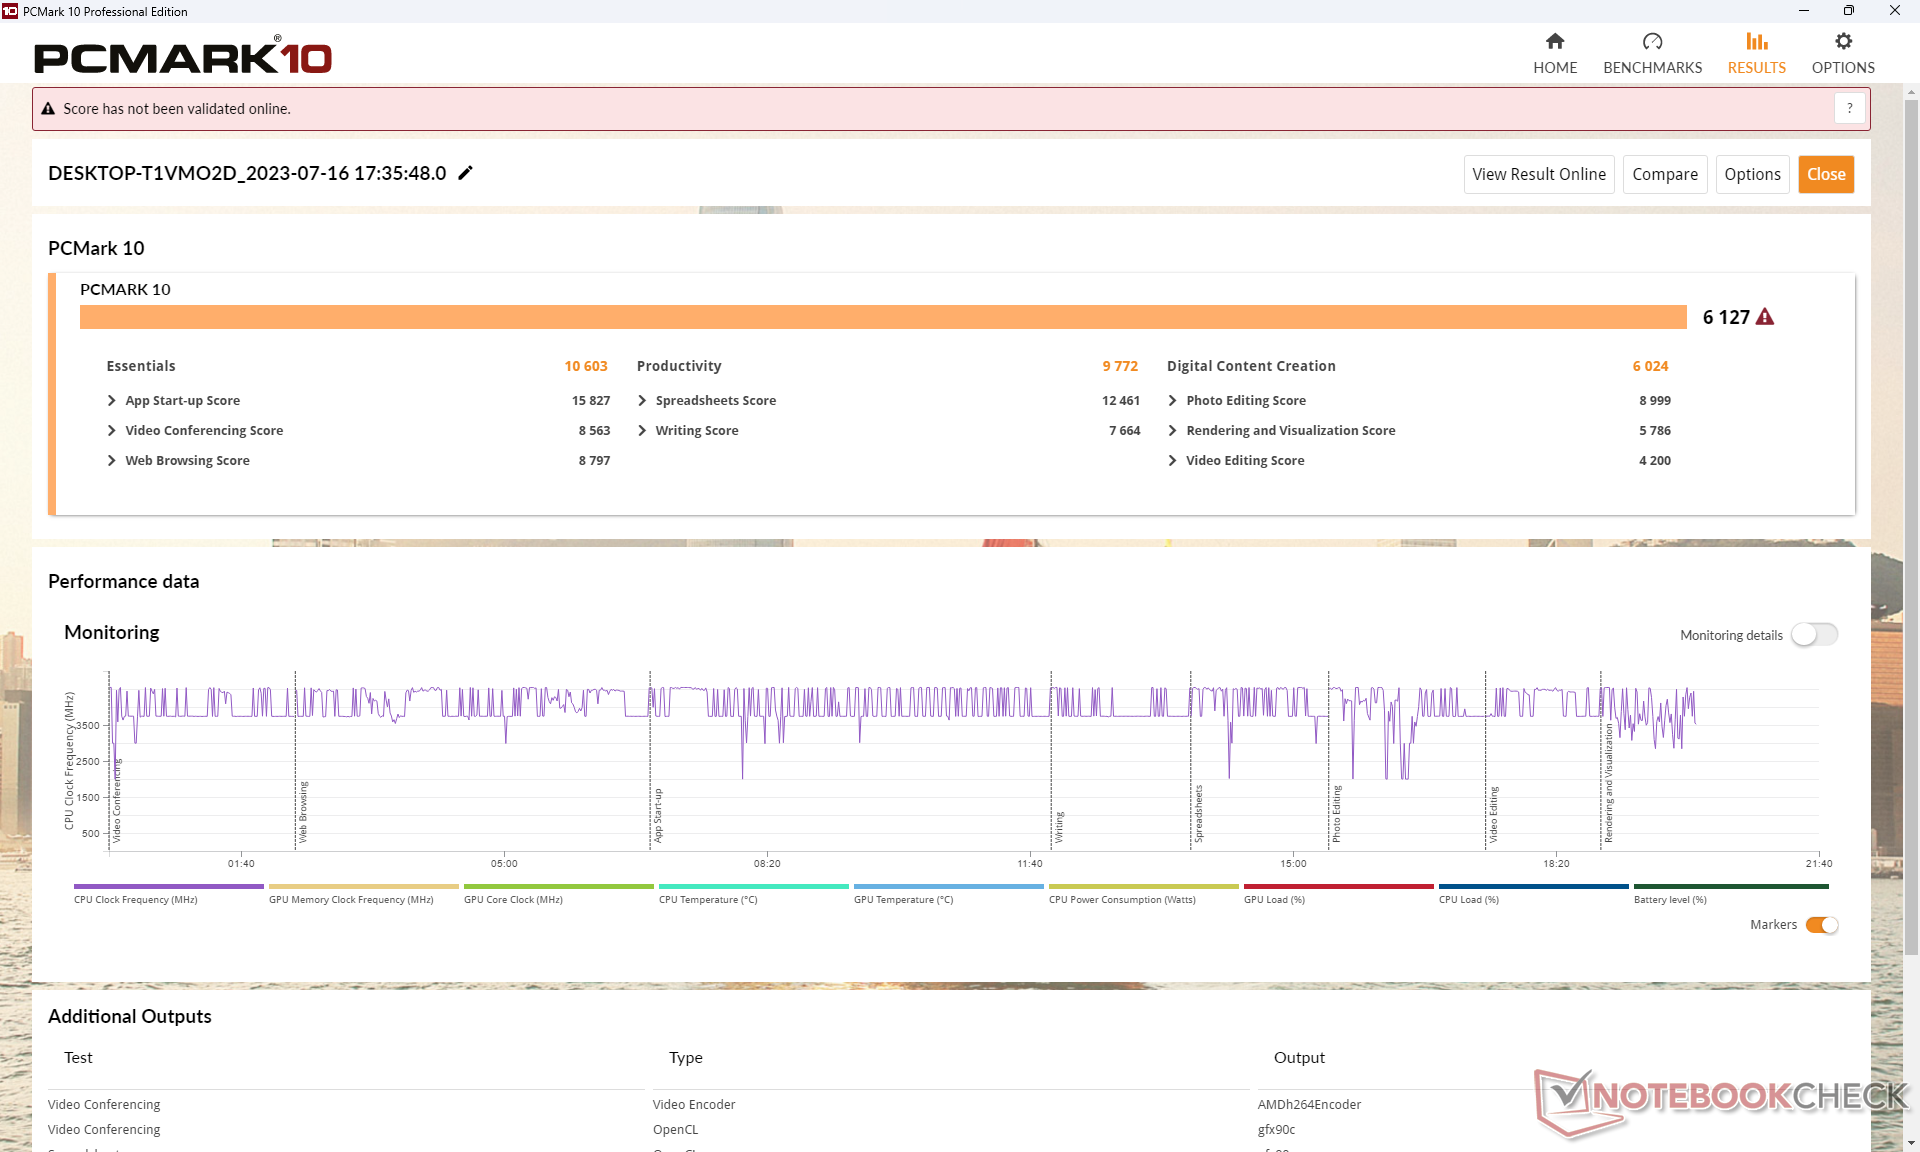
PCMark-resultaten är jämförbara med alternativ som körs med Core-U- och till och med Core-P-processorer som Samsung Galaxy Book3 Pro 16 eller förra årets Dell Inspiron 16 7620 2-in-1. Intressant nog gynnar deltestet Produktivitet vårt Dell-system med större marginaler.
CrossMark: Overall | Productivity | Creativity | Responsiveness
| PCMark 10 / Score | |
| Lenovo IdeaPad Flex 5 16ABR G8 | |
| Acer Swift Edge SFE16-42-R1GM | |
| Dell Inspiron 16 7635 2-in-1 | |
| Genomsnitt AMD Ryzen 5 7530U, AMD Radeon RX Vega 7 (5686 - 6209, n=8) | |
| Lenovo Yoga 7 16IRL8 | |
| Samsung Galaxy Book3 Pro 16 | |
| Dell Inspiron 16 7620 2-in-1 | |
| PCMark 10 / Essentials | |
| Lenovo Yoga 7 16IRL8 | |
| Lenovo IdeaPad Flex 5 16ABR G8 | |
| Dell Inspiron 16 7635 2-in-1 | |
| Samsung Galaxy Book3 Pro 16 | |
| Genomsnitt AMD Ryzen 5 7530U, AMD Radeon RX Vega 7 (9183 - 11242, n=8) | |
| Dell Inspiron 16 7620 2-in-1 | |
| Acer Swift Edge SFE16-42-R1GM | |
| PCMark 10 / Productivity | |
| Genomsnitt AMD Ryzen 5 7530U, AMD Radeon RX Vega 7 (8983 - 14037, n=8) | |
| Dell Inspiron 16 7635 2-in-1 | |
| Lenovo IdeaPad Flex 5 16ABR G8 | |
| Acer Swift Edge SFE16-42-R1GM | |
| Lenovo Yoga 7 16IRL8 | |
| Samsung Galaxy Book3 Pro 16 | |
| Dell Inspiron 16 7620 2-in-1 | |
| PCMark 10 / Digital Content Creation | |
| Acer Swift Edge SFE16-42-R1GM | |
| Lenovo Yoga 7 16IRL8 | |
| Samsung Galaxy Book3 Pro 16 | |
| Lenovo IdeaPad Flex 5 16ABR G8 | |
| Dell Inspiron 16 7635 2-in-1 | |
| Dell Inspiron 16 7620 2-in-1 | |
| Genomsnitt AMD Ryzen 5 7530U, AMD Radeon RX Vega 7 (4941 - 6093, n=8) | |
| CrossMark / Overall | |
| Lenovo Yoga 7 16IRL8 | |
| Samsung Galaxy Book3 Pro 16 | |
| Dell Inspiron 16 7620 2-in-1 | |
| Acer Swift Edge SFE16-42-R1GM | |
| Lenovo IdeaPad Flex 5 16ABR G8 | |
| Genomsnitt AMD Ryzen 5 7530U, AMD Radeon RX Vega 7 (1029 - 1336, n=7) | |
| Dell Inspiron 16 7635 2-in-1 | |
| CrossMark / Productivity | |
| Lenovo Yoga 7 16IRL8 | |
| Samsung Galaxy Book3 Pro 16 | |
| Dell Inspiron 16 7620 2-in-1 | |
| Acer Swift Edge SFE16-42-R1GM | |
| Lenovo IdeaPad Flex 5 16ABR G8 | |
| Genomsnitt AMD Ryzen 5 7530U, AMD Radeon RX Vega 7 (1115 - 1370, n=7) | |
| Dell Inspiron 16 7635 2-in-1 | |
| CrossMark / Creativity | |
| Lenovo Yoga 7 16IRL8 | |
| Samsung Galaxy Book3 Pro 16 | |
| Dell Inspiron 16 7620 2-in-1 | |
| Lenovo IdeaPad Flex 5 16ABR G8 | |
| Acer Swift Edge SFE16-42-R1GM | |
| Dell Inspiron 16 7635 2-in-1 | |
| Genomsnitt AMD Ryzen 5 7530U, AMD Radeon RX Vega 7 (992 - 1390, n=7) | |
| CrossMark / Responsiveness | |
| Samsung Galaxy Book3 Pro 16 | |
| Lenovo Yoga 7 16IRL8 | |
| Dell Inspiron 16 7620 2-in-1 | |
| Acer Swift Edge SFE16-42-R1GM | |
| Genomsnitt AMD Ryzen 5 7530U, AMD Radeon RX Vega 7 (900 - 1096, n=7) | |
| Lenovo IdeaPad Flex 5 16ABR G8 | |
| Dell Inspiron 16 7635 2-in-1 | |
| PCMark 10 Score | 6127 poäng | |
Hjälp | ||
| AIDA64 / Memory Copy | |
| Samsung Galaxy Book3 Pro 16 | |
| Lenovo Yoga 7 16IRL8 | |
| Acer Swift Edge SFE16-42-R1GM | |
| Dell Inspiron 16 7635 2-in-1 | |
| Lenovo IdeaPad Flex 5 16ABR G8 | |
| Dell Inspiron 16 7620 2-in-1 | |
| Genomsnitt AMD Ryzen 5 7530U (20155 - 42853, n=9) | |
| AIDA64 / Memory Read | |
| Samsung Galaxy Book3 Pro 16 | |
| Lenovo Yoga 7 16IRL8 | |
| Acer Swift Edge SFE16-42-R1GM | |
| Dell Inspiron 16 7620 2-in-1 | |
| Dell Inspiron 16 7635 2-in-1 | |
| Lenovo IdeaPad Flex 5 16ABR G8 | |
| Genomsnitt AMD Ryzen 5 7530U (23068 - 40270, n=9) | |
| AIDA64 / Memory Write | |
| Samsung Galaxy Book3 Pro 16 | |
| Lenovo Yoga 7 16IRL8 | |
| Acer Swift Edge SFE16-42-R1GM | |
| Dell Inspiron 16 7620 2-in-1 | |
| Dell Inspiron 16 7635 2-in-1 | |
| Lenovo IdeaPad Flex 5 16ABR G8 | |
| Genomsnitt AMD Ryzen 5 7530U (22954 - 41838, n=9) | |
| AIDA64 / Memory Latency | |
| Lenovo IdeaPad Flex 5 16ABR G8 | |
| Dell Inspiron 16 7635 2-in-1 | |
| Acer Swift Edge SFE16-42-R1GM | |
| Genomsnitt AMD Ryzen 5 7530U (88.1 - 110.8, n=9) | |
| Lenovo Yoga 7 16IRL8 | |
| Samsung Galaxy Book3 Pro 16 | |
* ... mindre är bättre
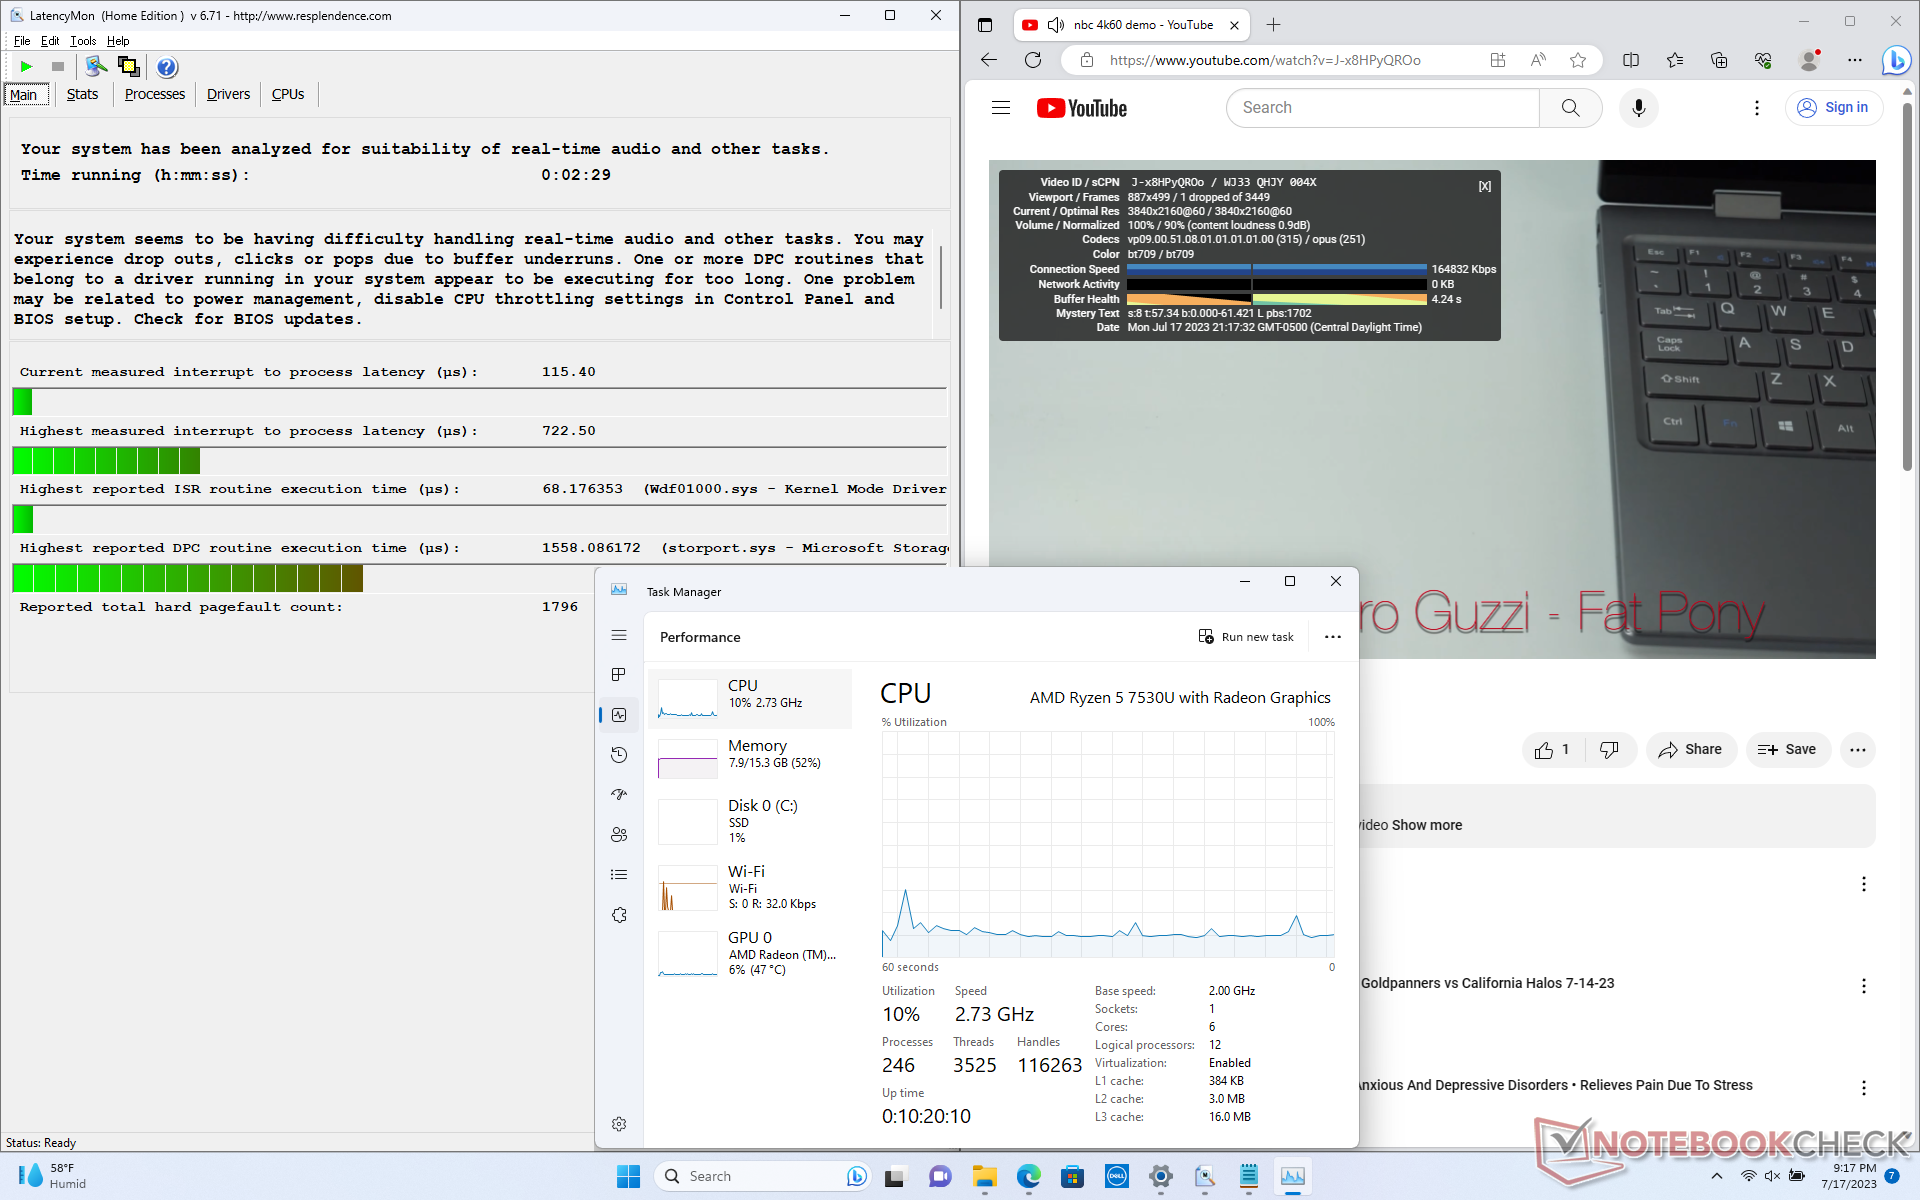
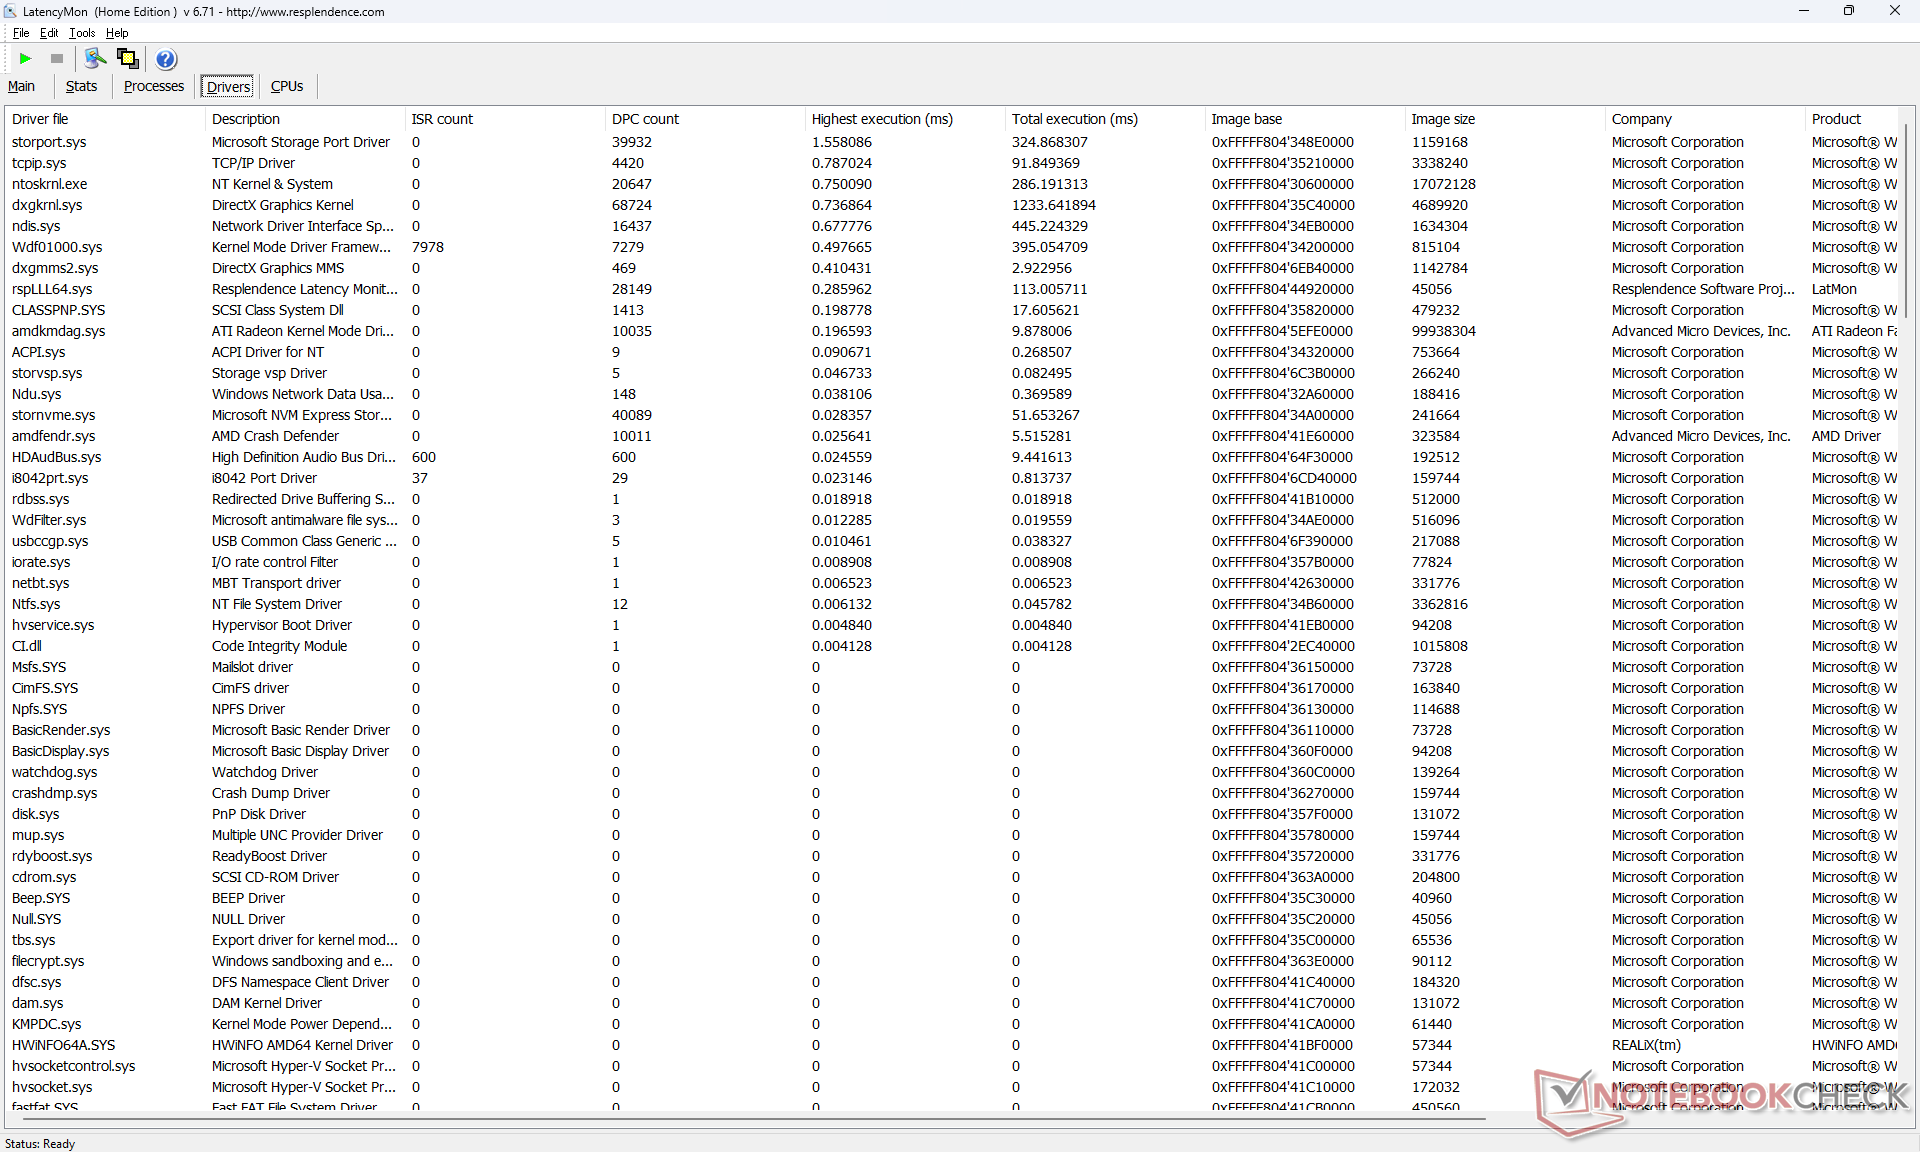
DPC-fördröjning
LatencyMon rapporterar endast mindre DPC-problem när vi öppnar flera flikar på vår hemsida. 4K-videouppspelning vid 60 FPS är annars utmärkt med bara en tappad bildruta registrerad under vår minutlånga testvideo.
| DPC Latencies / LatencyMon - interrupt to process latency (max), Web, Youtube, Prime95 | |
| Acer Swift Edge SFE16-42-R1GM | |
| Lenovo IdeaPad Flex 5 16ABR G8 | |
| Lenovo Yoga 7 16IRL8 | |
| Dell Inspiron 16 7635 2-in-1 | |
| Dell Inspiron 16 7620 2-in-1 | |
| Samsung Galaxy Book3 Pro 16 | |
* ... mindre är bättre
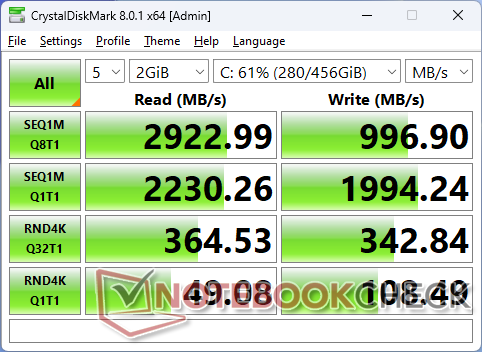
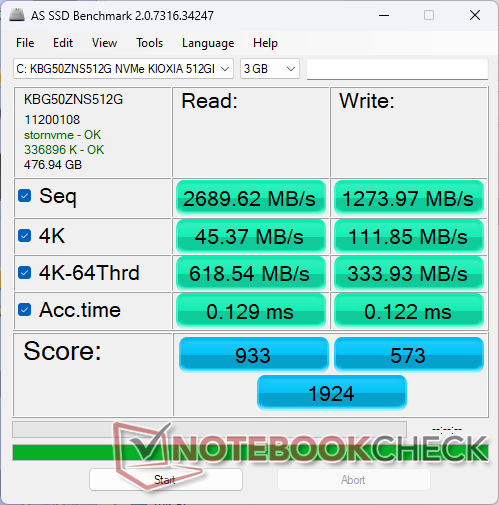
Lagringsenheter
Vår testenhet levereras med en budget Kioxia KBG50ZNS512G PCIe4 x4 NVMe SSD som erbjuder maximala sekventiella läs- och skrivhastigheter på upp till 3500 MB/s respektive 2700 MB/s, enligt tillverkaren. I våra stresstester kan vi dock bara nå drygt 2200 MB/s även efter flera omtester, vilket tyder på att enheten kan ha problem med att upprätthålla maximala överföringshastigheter under längre perioder. Detta är dock inget problem för de flesta multimediescenarier och dagliga webbläsarbelastningar.

| Drive Performance rating - Percent | |
| Acer Swift Edge SFE16-42-R1GM | |
| Lenovo Yoga 7 16IRL8 | |
| Samsung Galaxy Book3 Pro 16 | |
| Lenovo IdeaPad Flex 5 16ABR G8 | |
| Dell Inspiron 16 7635 2-in-1 | |
| Dell Inspiron 16 7620 2-in-1 | |
* ... mindre är bättre
Disk Throttling: DiskSpd Read Loop, Queue Depth 8
GPU-prestanda
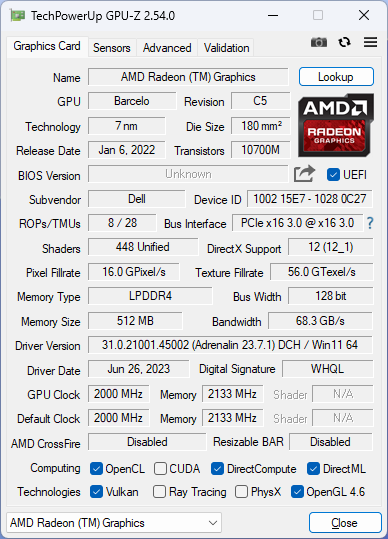
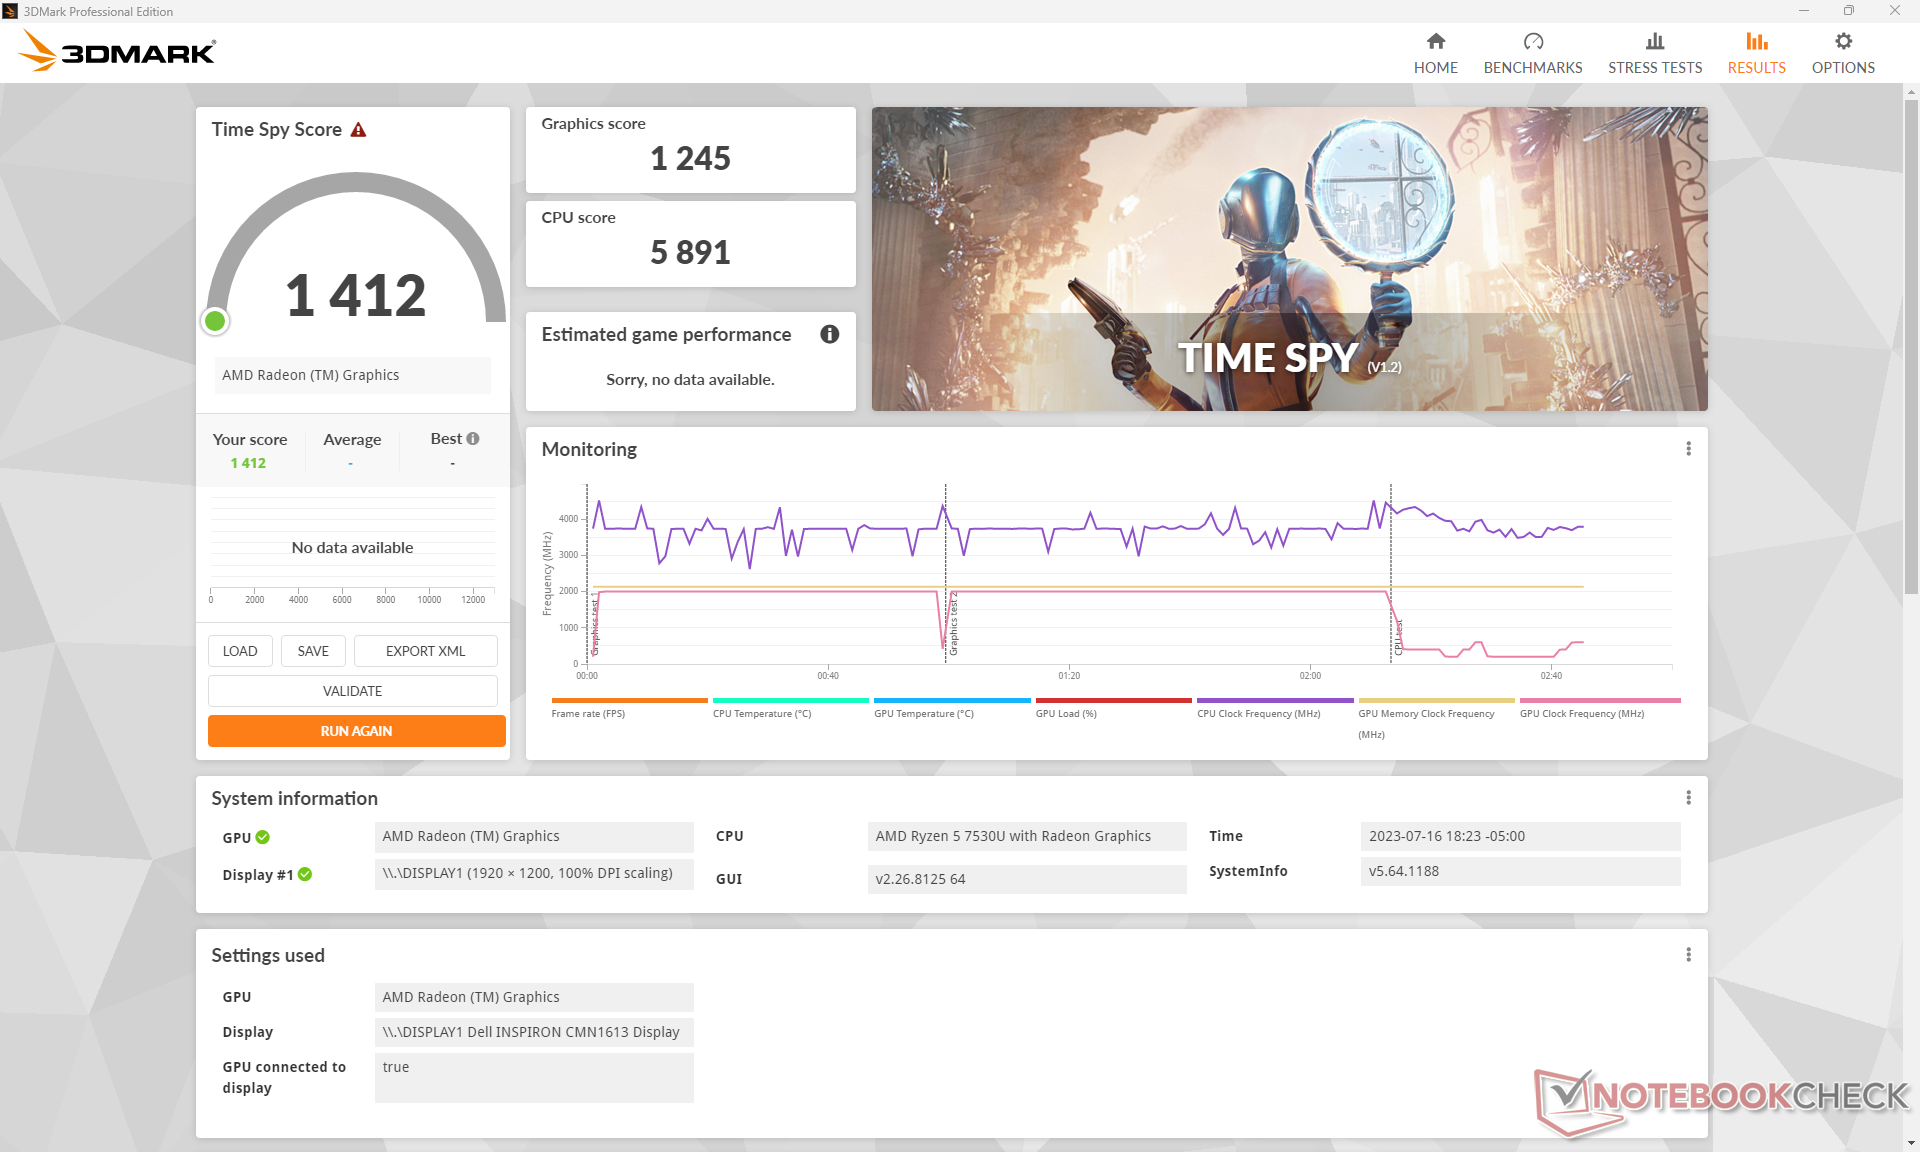
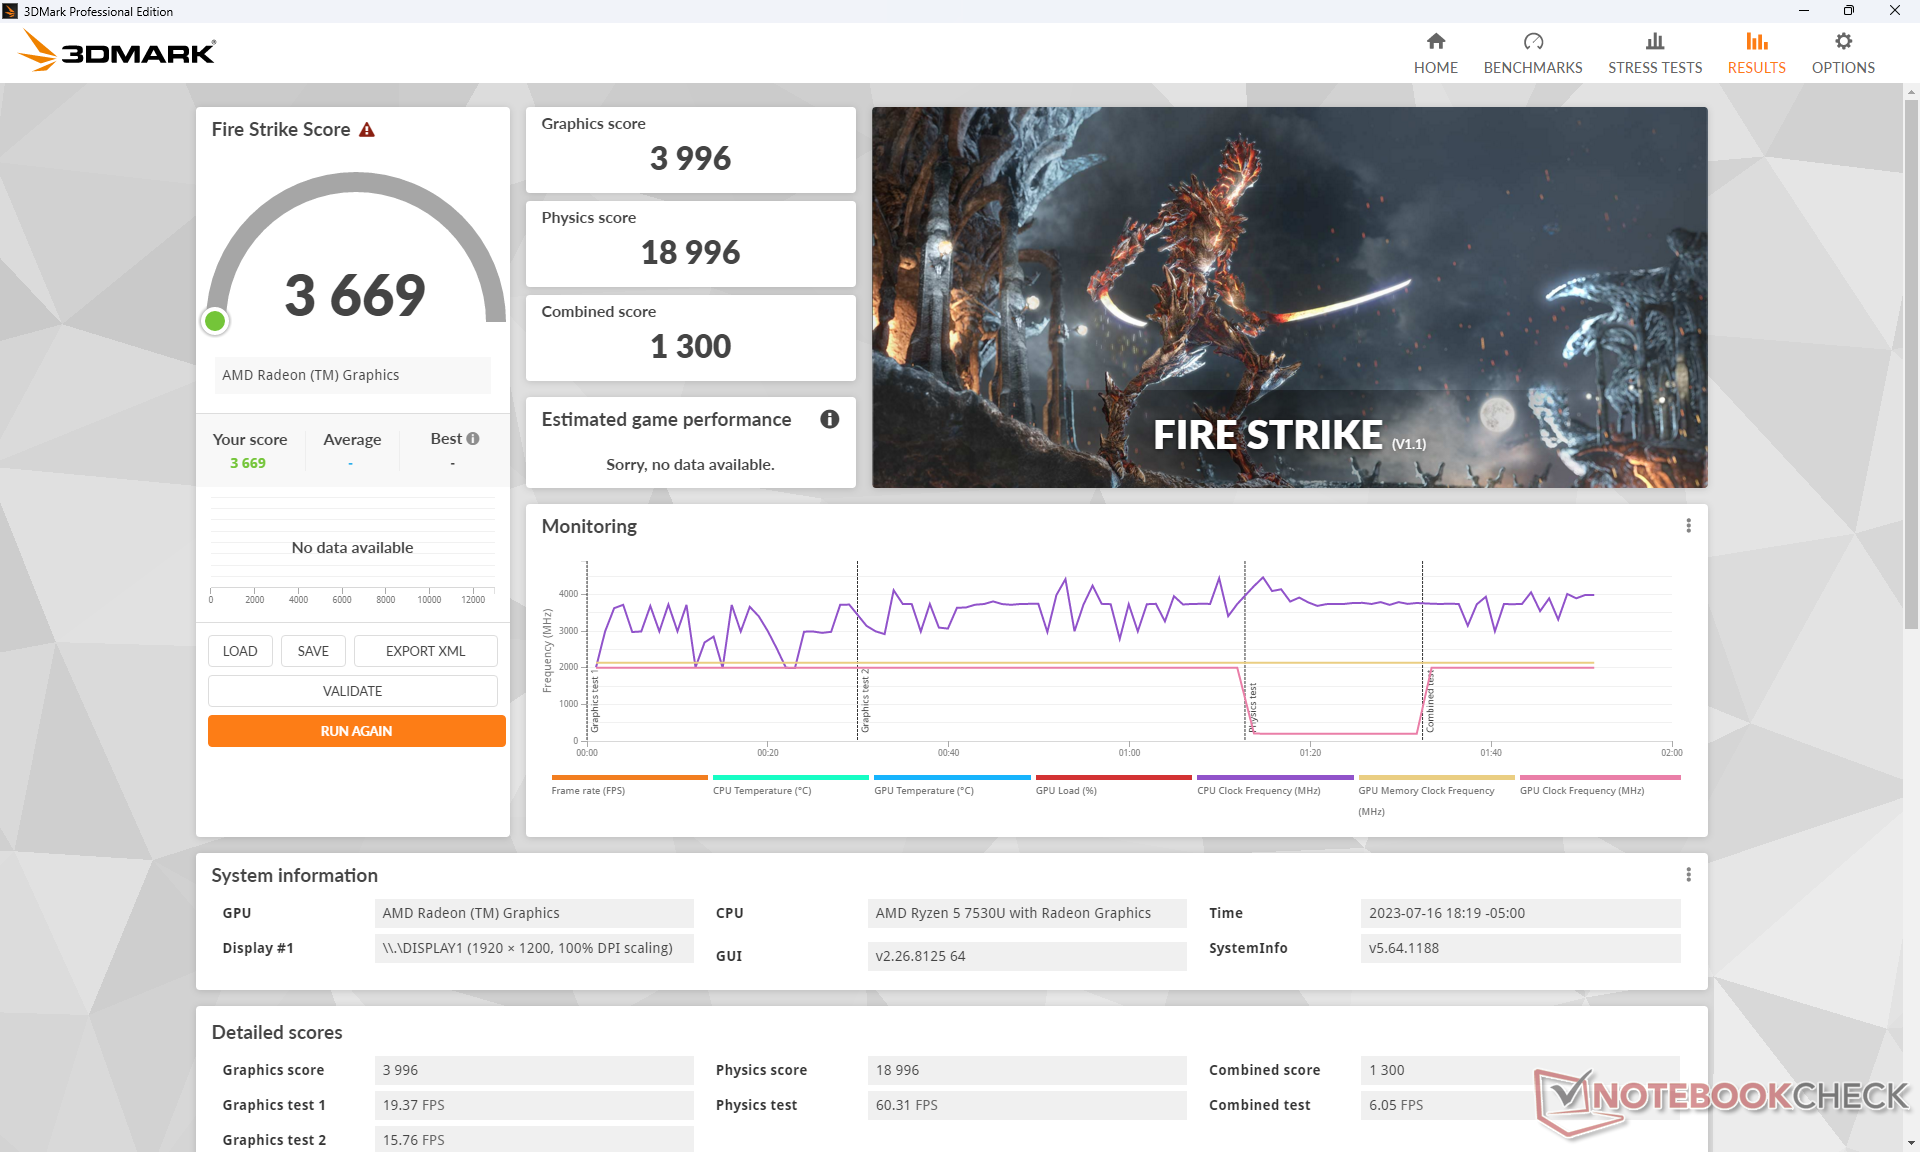
Som en Zen 3-processor använder Ryzen 5 7530U den äldre Radeon RX Vega 7 istället för den nyare Radeon 680M eller 780M som återfinns i Zen 3+ respektive Zen 4-processorer. Detta är olyckligt eftersom Radeon 680M skulle ha ökat grafikprestandan avsevärt med 70 till 80 procent för att vara snabbare än alla nuvarande Intel Iris Xe-lösningar. Istället ligger den totala grafikprestandan ungefär 25 procent efter den åldrande Iris Xe 96 EUs. Vi förväntar oss att prestandan blir ännu lägre om den konfigureras med bara 8 GB lödd system-RAM.
Uppgradering till Radeon RX Vega 8 i den mer avancerade Ryzen 7 7730U-konfigurationen förväntas öka grafikprestandan marginellt med 5 procent.
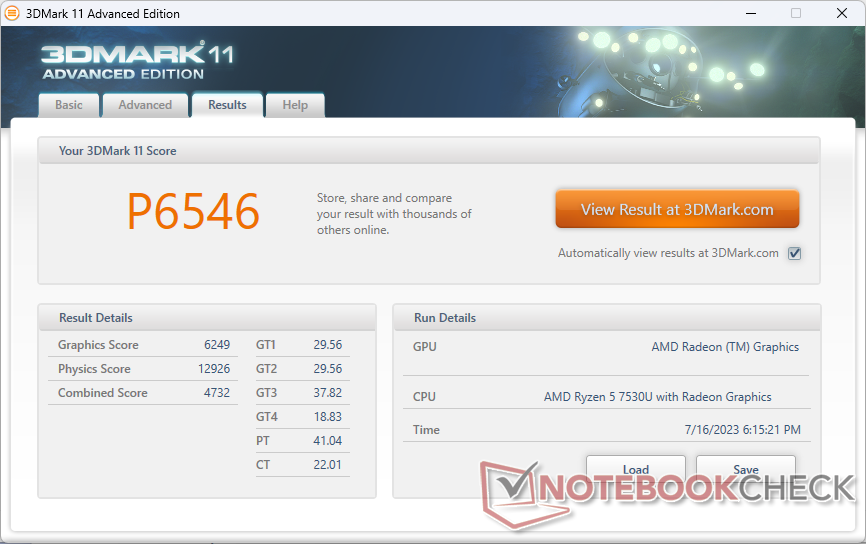
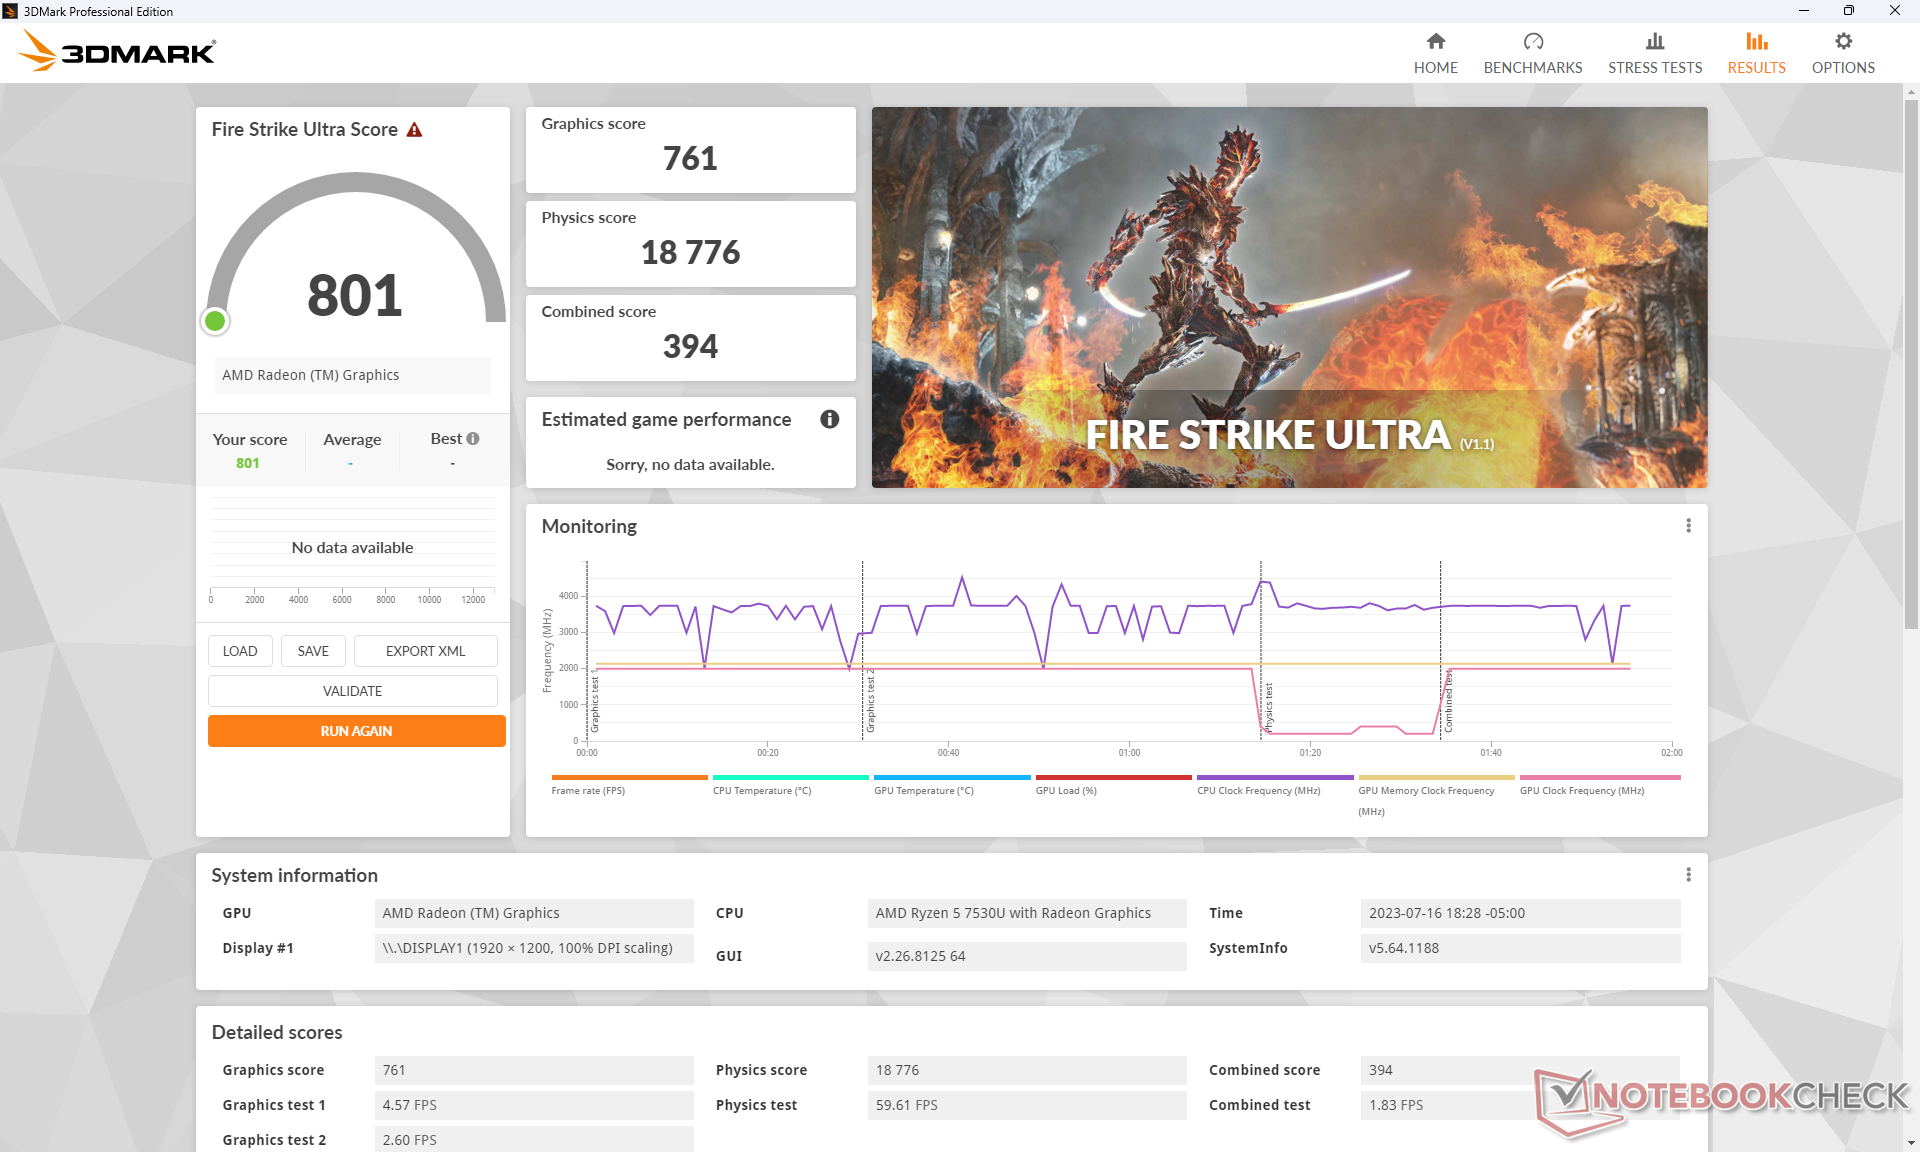
| 3DMark 11 Performance | 6546 poäng | |
| 3DMark Fire Strike Score | 3669 poäng | |
| 3DMark Time Spy Score | 1412 poäng | |
Hjälp | ||
* ... mindre är bättre
| Returnal | |
| 1280x720 Low Preset | |
| Beelink GTR7 7840HS | |
| Dell Inspiron 16 7635 2-in-1 | |
| Genomsnitt AMD Radeon RX Vega 7 (18 - 18, n=2) | |
| 1920x1080 Low Preset | |
| Beelink GTR7 7840HS | |
| Dell Inspiron 16 7635 2-in-1 | |
| Genomsnitt AMD Radeon RX Vega 7 (12 - 13, n=2) | |
| 1920x1080 Medium Preset | |
| Beelink GTR7 7840HS | |
| Dell Inspiron 16 7635 2-in-1 | |
| Genomsnitt AMD Radeon RX Vega 7 (11 - 12, n=2) | |
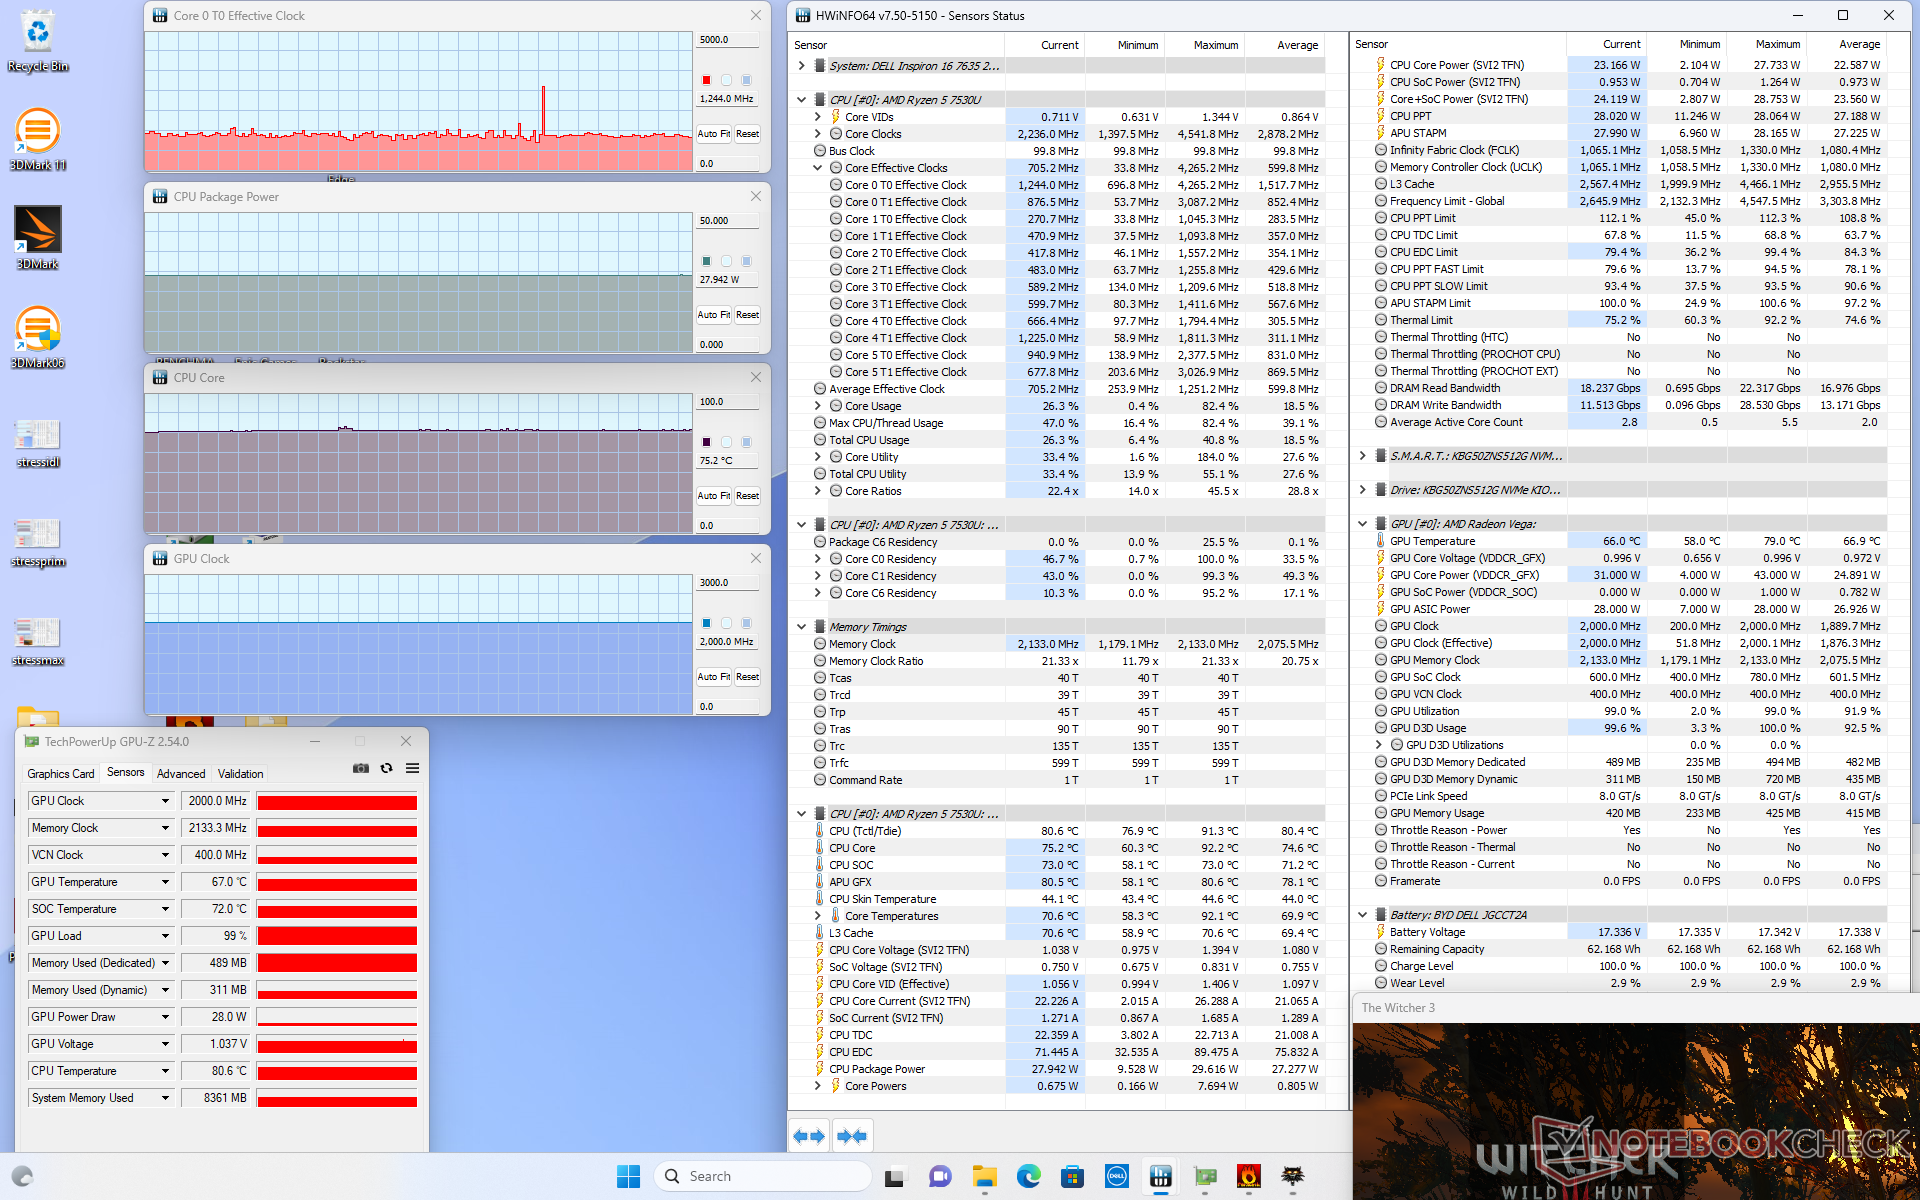
Bildfrekvensen vid tomgångskörning på Witcher 3 kunde ibland men konsekvent sjunka med nästan 15 FPS under korta perioder innan de återgick till det normala. Detta beteende är ogynnsamt eftersom det tyder på problem med grafikdrivrutinen eller avbruten bakgrundsaktivitet på operativsystemsnivå.
Witcher 3 FPS Chart
| låg | med. | hög | ultra | |
|---|---|---|---|---|
| GTA V (2015) | 24.1 | 9.55 | ||
| The Witcher 3 (2015) | 79.6 | 24.5 | 15.7 | |
| Dota 2 Reborn (2015) | 109 | 90.7 | 55.4 | 52.4 |
| Final Fantasy XV Benchmark (2018) | 37.5 | 18.8 | 12.9 | |
| X-Plane 11.11 (2018) | 38.4 | 30.4 | 26.3 | |
| Strange Brigade (2018) | 86.8 | 33.8 | 28.1 | 23.2 |
| Cyberpunk 2077 1.6 (2022) | 20.3 | 15.3 | 10.5 | 8.5 |
| Tiny Tina's Wonderlands (2022) | 28.8 | 21.2 | 12.9 | 9.2 |
| F1 22 (2022) | 36.2 | 32.3 | 23.9 | 17.1 |
| Returnal (2023) | 13 | 12 |
Utsläpp
Buller från systemet
Fläkten är i allmänhet tyst vid låg belastning som surfning eller videostreaming där den tenderar att ligga i intervallet 27 dB(A) mot en tyst bakgrund på 23,6 dB(A). Vid tyngre belastning som 3DMark 06 ökar dock fläktljudet snabbt till strax över 40 dB(A), även med strömprofilen Balanserad. Vi kan registrera ett maximalt fläktljud på strax över 44 dB(A) när vi kör höga belastningar som spel för att vara ännu högre än vad vi registrerade på den äldreInspiron 16 7620 2-i-1.
Ljudnivå
| Låg belastning |
| 23.6 / 23.6 / 23.6 dB(A) |
| Hög belastning |
| 40.3 / 44.2 dB(A) |
 | ||
30 dB tyst 40 dB(A) hörbar 50 dB(A) högt ljud |
||
min: | ||
| Dell Inspiron 16 7635 2-in-1 Vega 7, R5 7530U, Kioxia BG5 KBG50ZNS512G | Acer Swift Edge SFE16-42-R1GM Radeon 680M, R7 7735U, Micron 3400 1TB MTFDKBA1T0TFH | Lenovo Yoga 7 16IRL8 Iris Xe G7 96EUs, i7-1355U, WD PC SN740 512GB SDDPMQD-512G-1101 | Samsung Galaxy Book3 Pro 16 Iris Xe G7 80EUs, i5-1340P, WD PC SN740 256GB SDDPNQD-256G | Lenovo IdeaPad Flex 5 16ABR G8 Vega 8, R7 7730U, Samsung PM9B1 1024GB MZAL41T0HBLB | Dell Inspiron 16 7620 2-in-1 Iris Xe G7 96EUs, i7-1260P, Toshiba KBG40ZNS512G NVMe | |
|---|---|---|---|---|---|---|
| Noise | -10% | -0% | -11% | -0% | 8% | |
| av / miljö * (dB) | 23.6 | 25.7 -9% | 22.8 3% | 25.2 -7% | 24.2 -3% | 23.2 2% |
| Idle Minimum * (dB) | 23.6 | 25.7 -9% | 22.9 3% | 25.2 -7% | 24.2 -3% | 23.5 -0% |
| Idle Average * (dB) | 23.6 | 27 -14% | 22.9 3% | 25.2 -7% | 24.2 -3% | 23.5 -0% |
| Idle Maximum * (dB) | 23.6 | 29.3 -24% | 26.9 -14% | 29.3 -24% | 28.7 -22% | 23.5 -0% |
| Load Average * (dB) | 40.3 | 42.3 -5% | 41.7 -3% | 46.4 -15% | 33.1 18% | 29.4 27% |
| Witcher 3 ultra * (dB) | 44.2 | 41.5 6% | 41.8 5% | 35.6 19% | ||
| Load Maximum * (dB) | 44.2 | 42.7 3% | 43.6 1% | 46.4 -5% | 41.8 5% | 39.7 10% |
* ... mindre är bättre
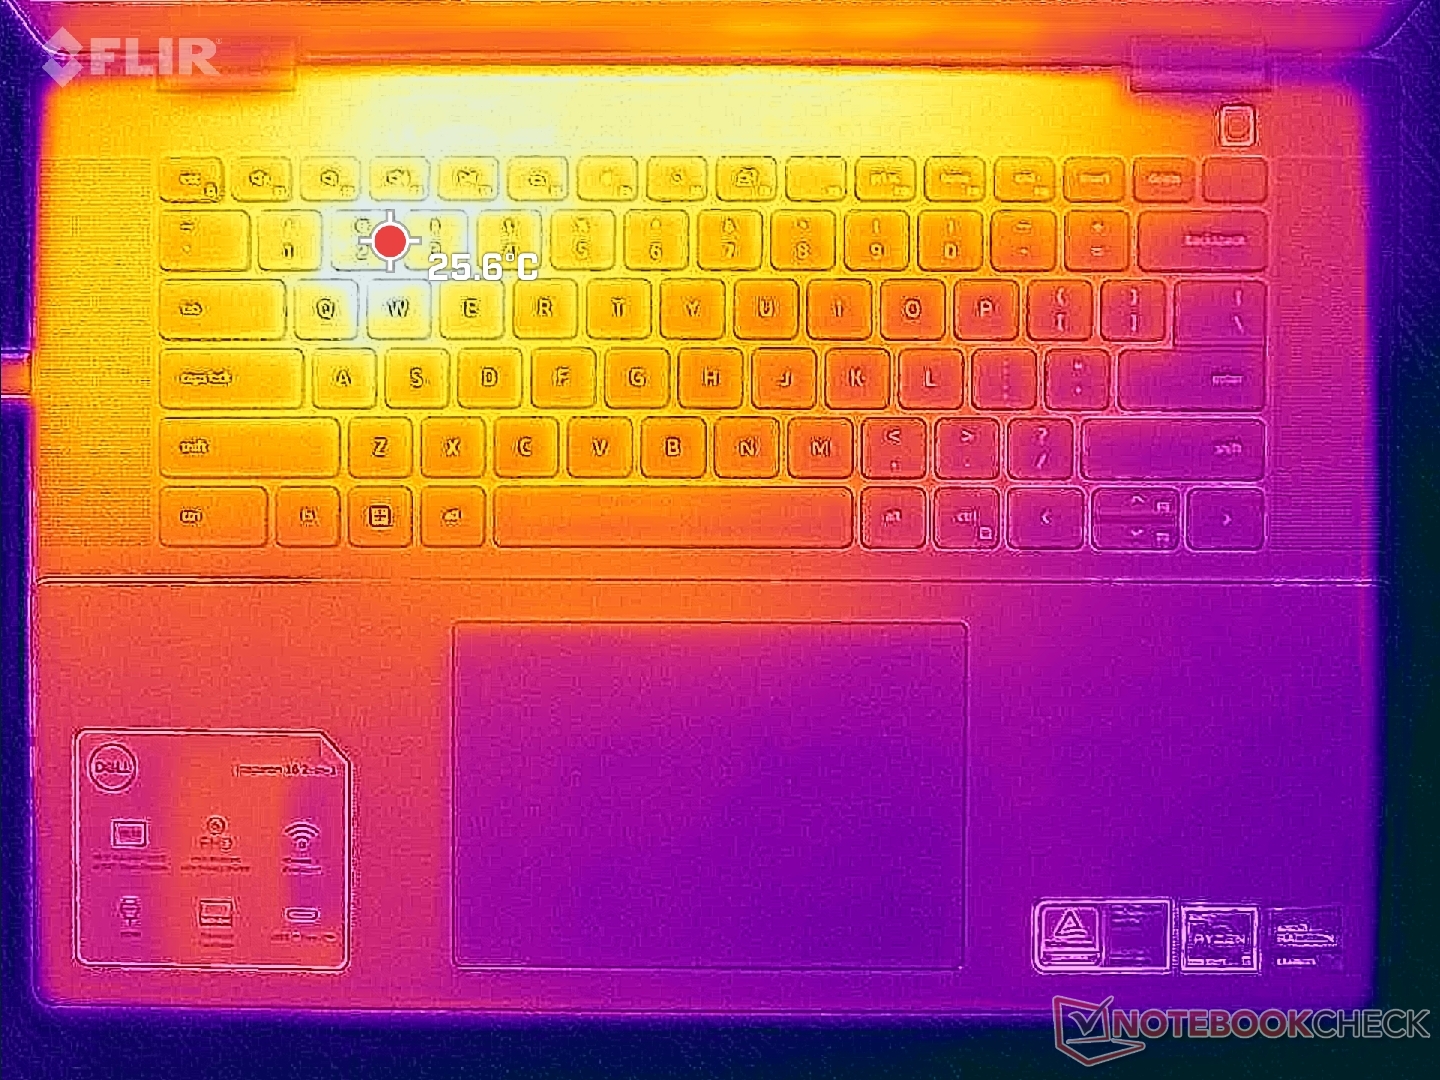
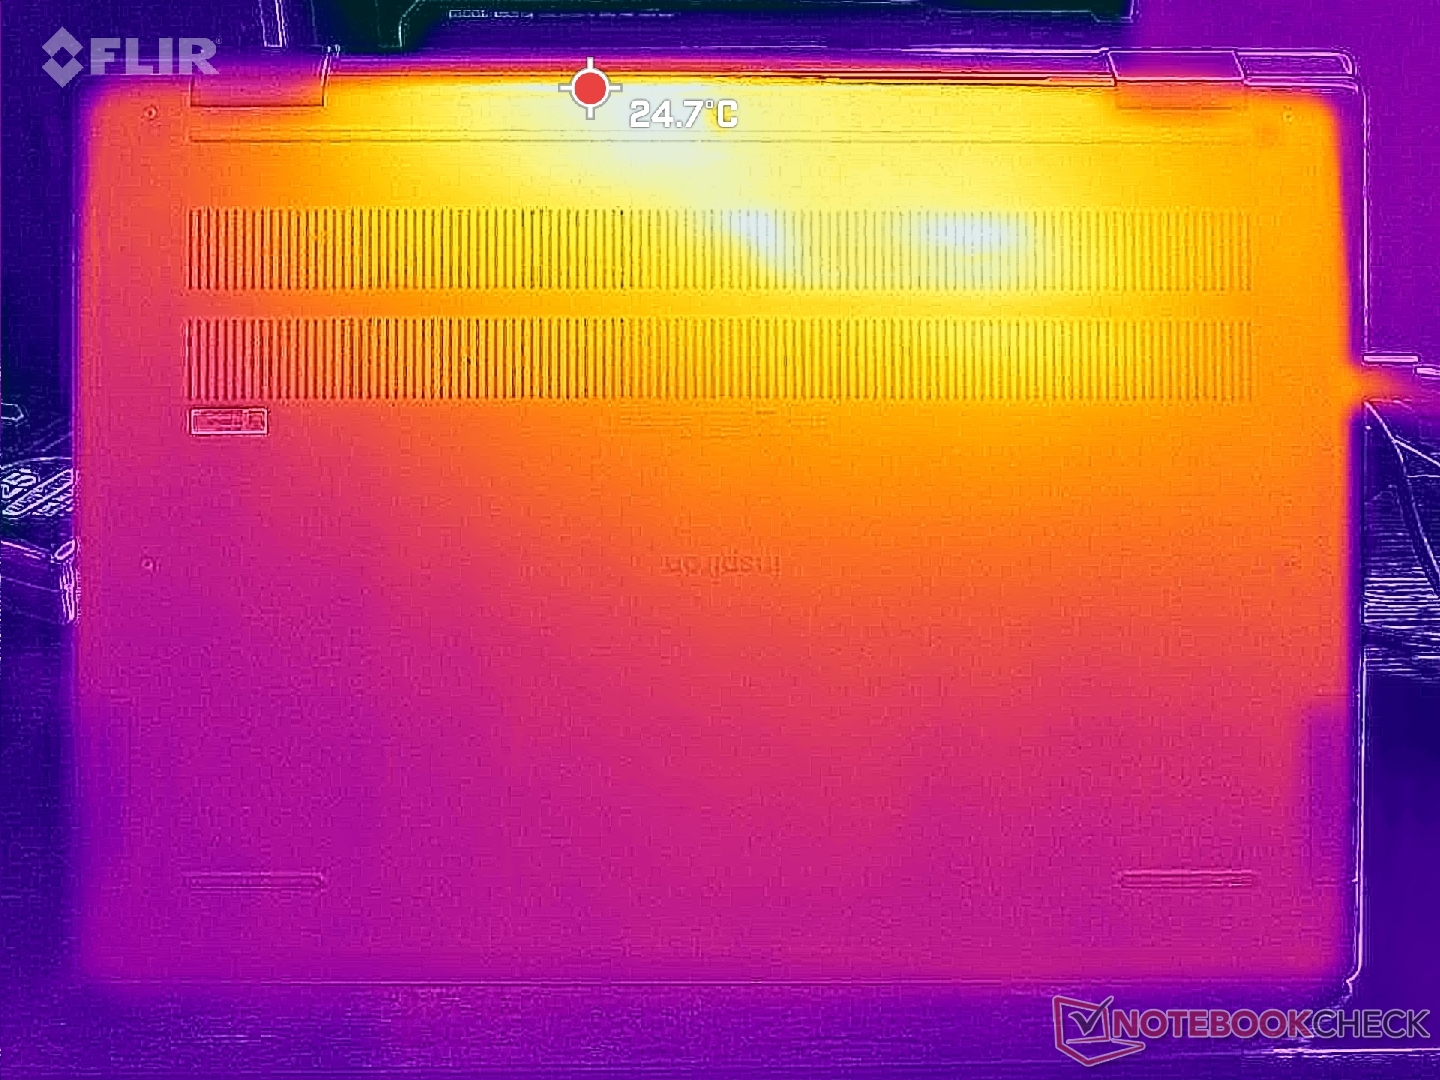
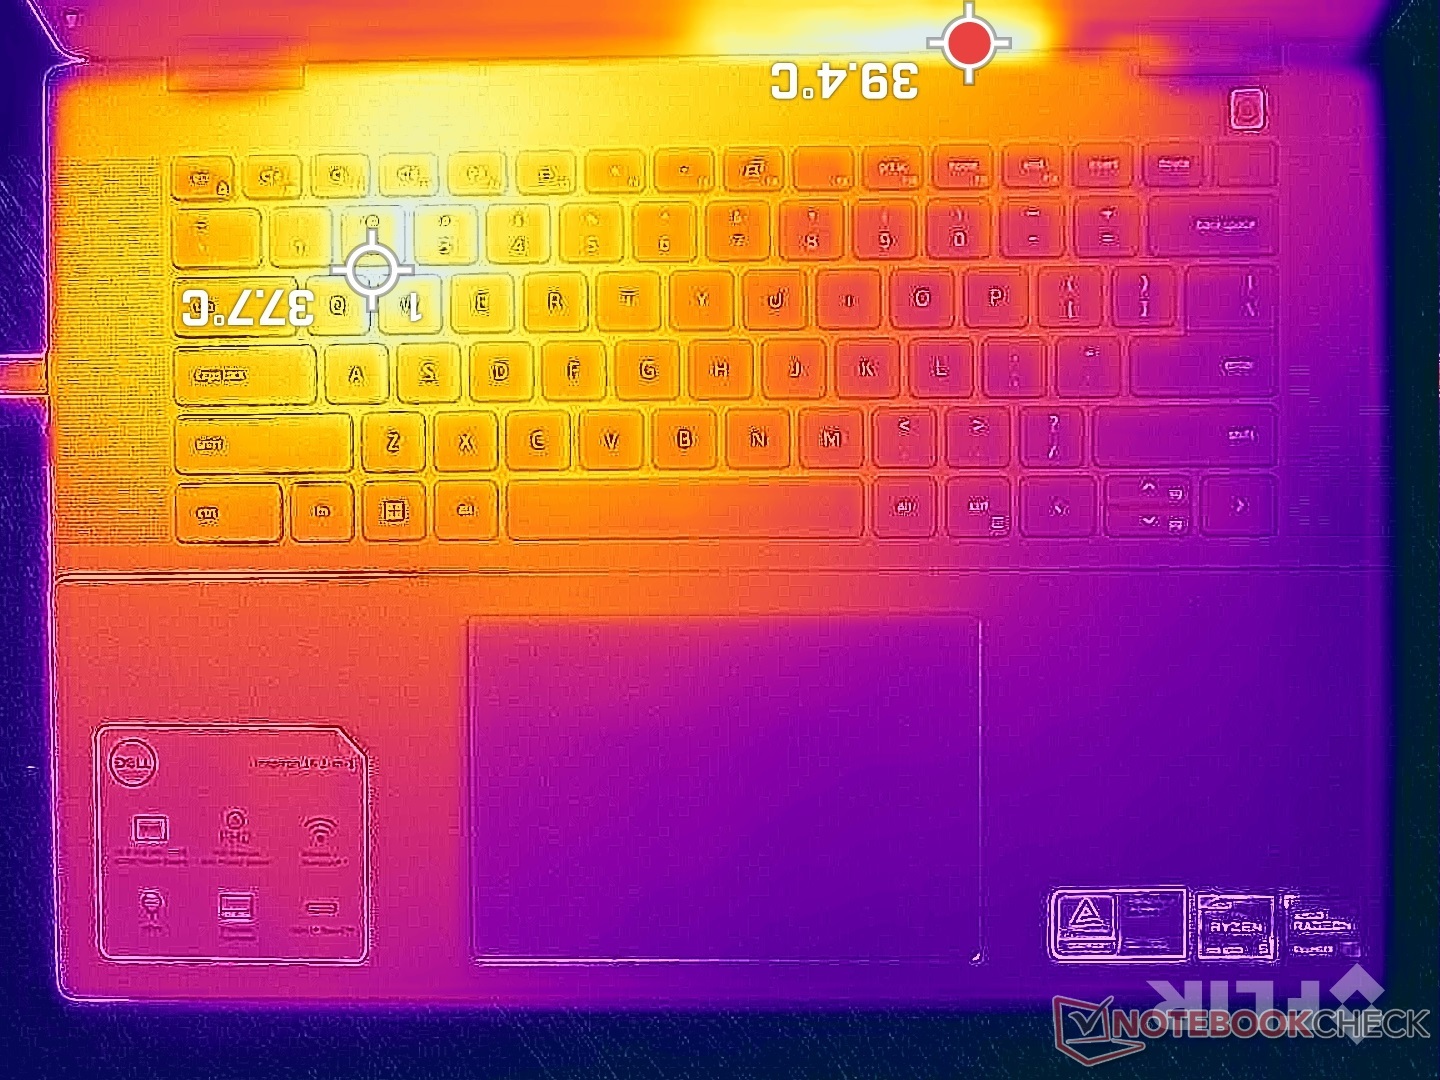
Temperatur
Yttemperaturerna är varmast på den vänstra halvan av tangentbordet istället för i mitten eftersom positioneringen av processorn har ändrats från förra årets design. Hot spots kan nå strax över 40 C på den övre och nedre ytan, vilket fortfarande är märkbart svalare än påIdeaPad Flex 5 16 eller äldre Inspiron 16 7620 2-i-1 där yttemperaturerna kan nå närmare 50 C under belastning. Det generellt högre fläktljudet på Inspiron 16 7635 2-in-1 kan delvis vara orsaken till dess svalare yttemperaturer.

(±) Den maximala temperaturen på ovansidan är 41.6 °C / 107 F, jämfört med genomsnittet av 35.4 °C / 96 F , allt från 19.6 till 60 °C för klassen Convertible.
(+) Botten värms upp till maximalt 39 °C / 102 F, jämfört med genomsnittet av 36.9 °C / 98 F
(+) Vid tomgångsbruk är medeltemperaturen för ovansidan 25.8 °C / 78 F, jämfört med enhetsgenomsnittet på 30.3 °C / ### class_avg_f### F.
(+) Handledsstöden och pekplattan är kallare än hudtemperaturen med maximalt 31.4 °C / 88.5 F och är därför svala att ta på.
(-) Medeltemperaturen för handledsstödsområdet på liknande enheter var 28 °C / 82.4 F (-3.4 °C / -6.1 F).

| Dell Inspiron 16 7635 2-in-1 AMD Ryzen 5 7530U, AMD Radeon RX Vega 7 | Acer Swift Edge SFE16-42-R1GM AMD Ryzen 7 7735U, AMD Radeon 680M | Lenovo Yoga 7 16IRL8 Intel Core i7-1355U, Intel Iris Xe Graphics G7 96EUs | Samsung Galaxy Book3 Pro 16 Intel Core i5-1340P, Intel Iris Xe Graphics G7 80EUs | Lenovo IdeaPad Flex 5 16ABR G8 AMD Ryzen 7 7730U, AMD Radeon RX Vega 8 (Ryzen 4000/5000) | Dell Inspiron 16 7620 2-in-1 Intel Core i7-1260P, Intel Iris Xe Graphics G7 96EUs | |
|---|---|---|---|---|---|---|
| Heat | -15% | -1% | -9% | -5% | -13% | |
| Maximum Upper Side * (°C) | 41.6 | 49.4 -19% | 37.6 10% | 41.6 -0% | 51.4 -24% | 42.2 -1% |
| Maximum Bottom * (°C) | 39 | 44.7 -15% | 40 -3% | 45 -15% | 47.8 -23% | 47.4 -22% |
| Idle Upper Side * (°C) | 29.4 | 34 -16% | 30.4 -3% | 31 -5% | 24.8 16% | 32.2 -10% |
| Idle Bottom * (°C) | 28.6 | 31.6 -10% | 30.6 -7% | 33.6 -17% | 24.9 13% | 33.6 -17% |
* ... mindre är bättre
Stresstest
Processorns klockfrekvens, kortets strömförbrukning och temperatur vid körning av Prime95 steg till 3,4 GHz, 35 W respektive 81 C. Processorn stabiliserades till 3 GHz, 28 W och 90 C efter bara någon minut, jämfört med 81 C på förra årets Intel-drivna Inspiron 16 7620 2-in-1.
Att köra på batteri minskar prestandan något. Ett 3DMark 11-test på batterier skulle ge fysik- och grafikpoäng på 12497 respektive 5935 poäng, jämfört med 12926 och 6249 poäng när datorn är på elnätet.
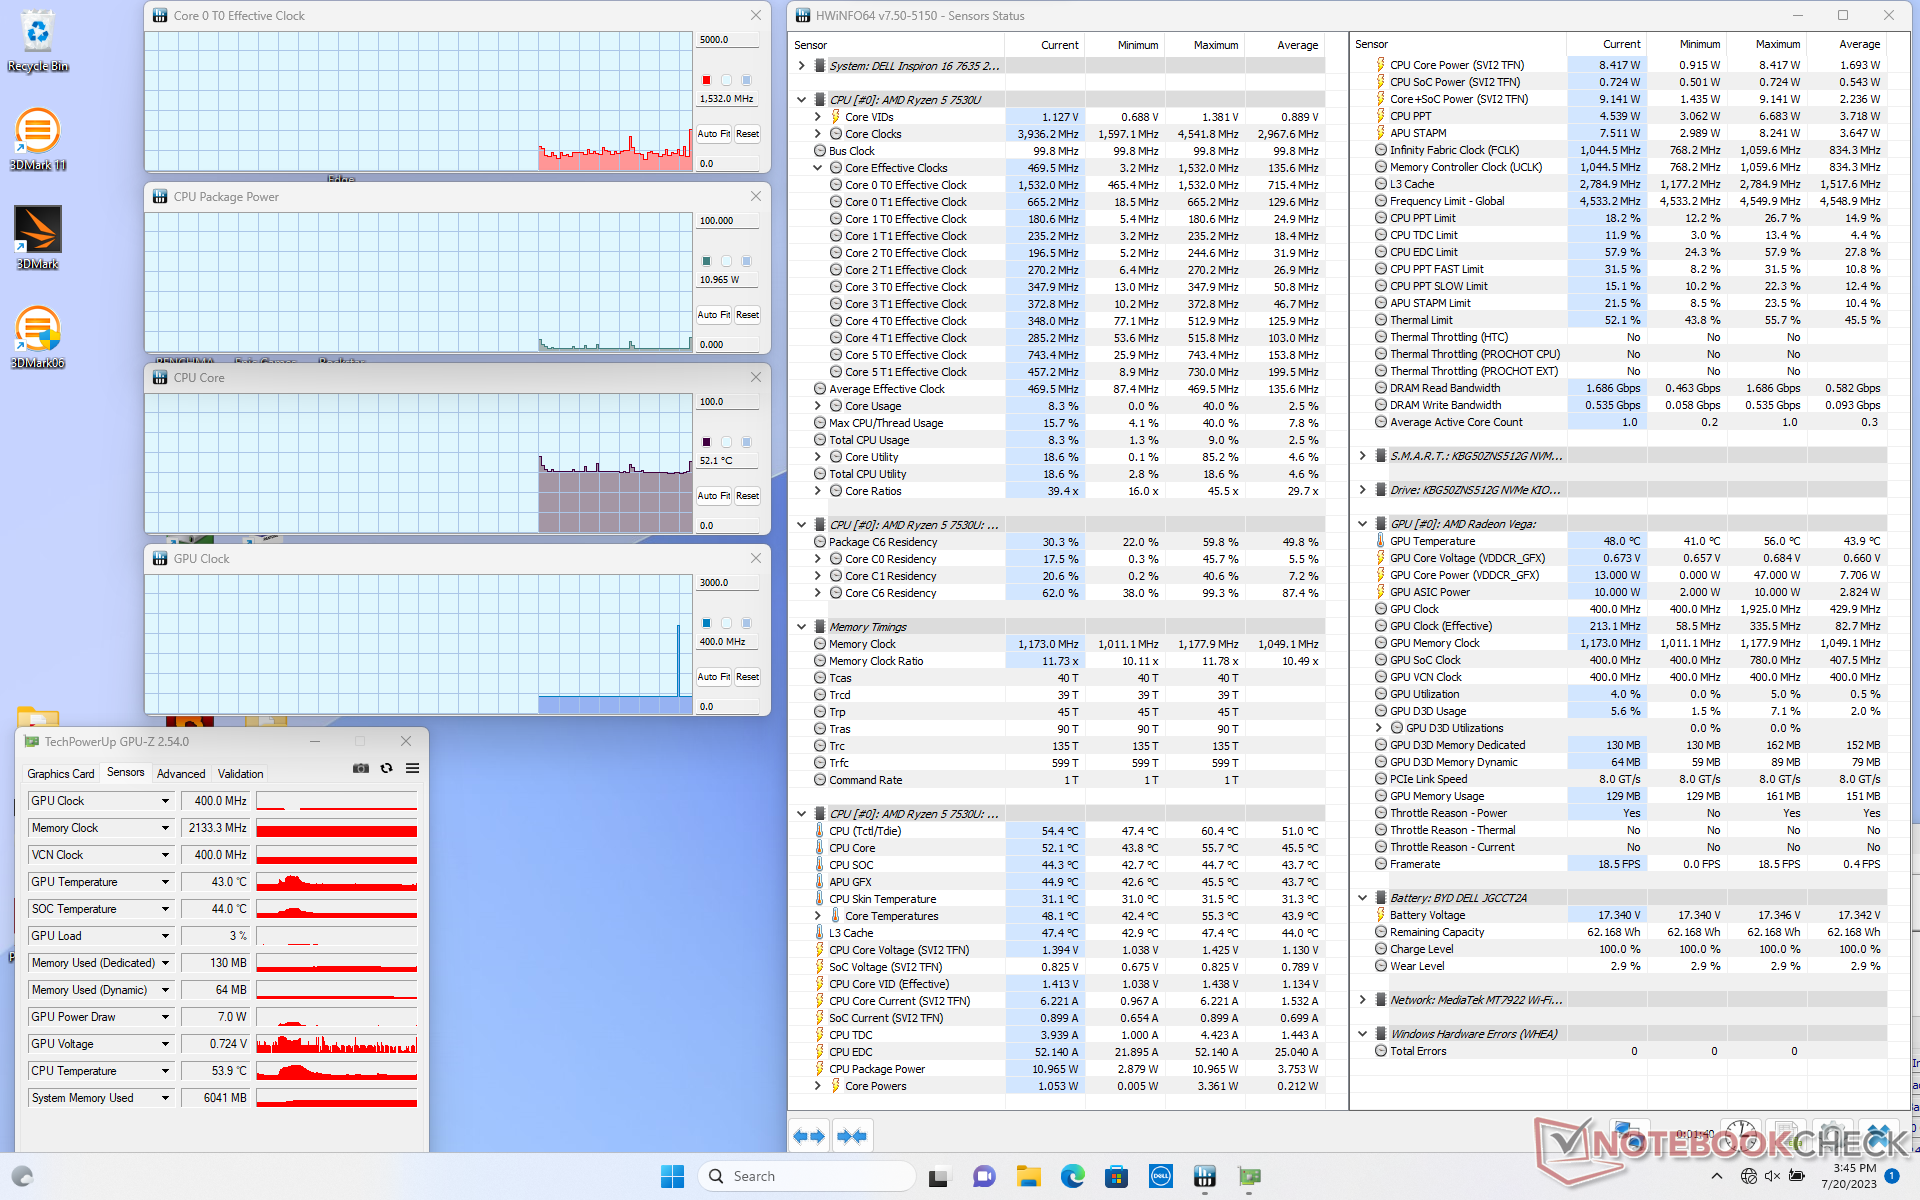
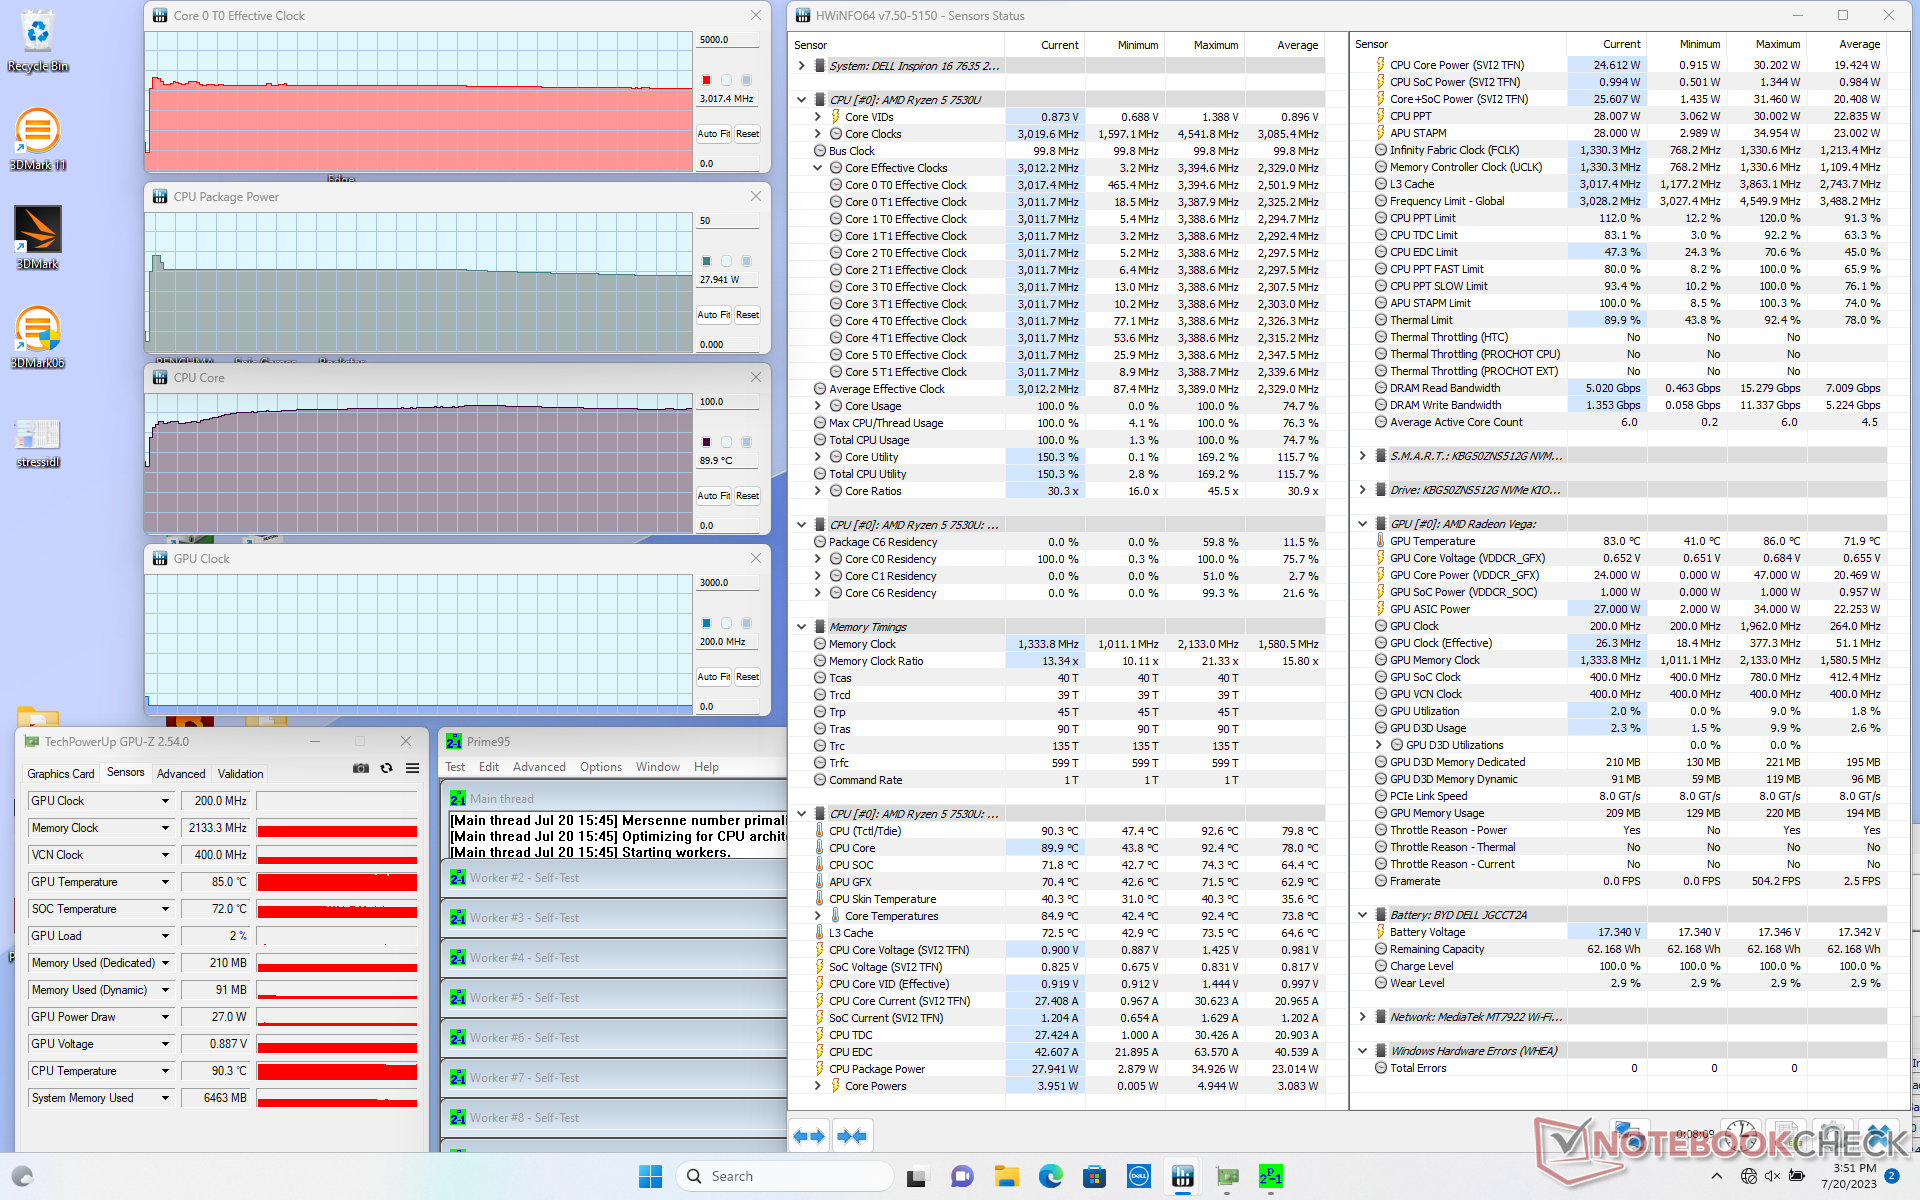
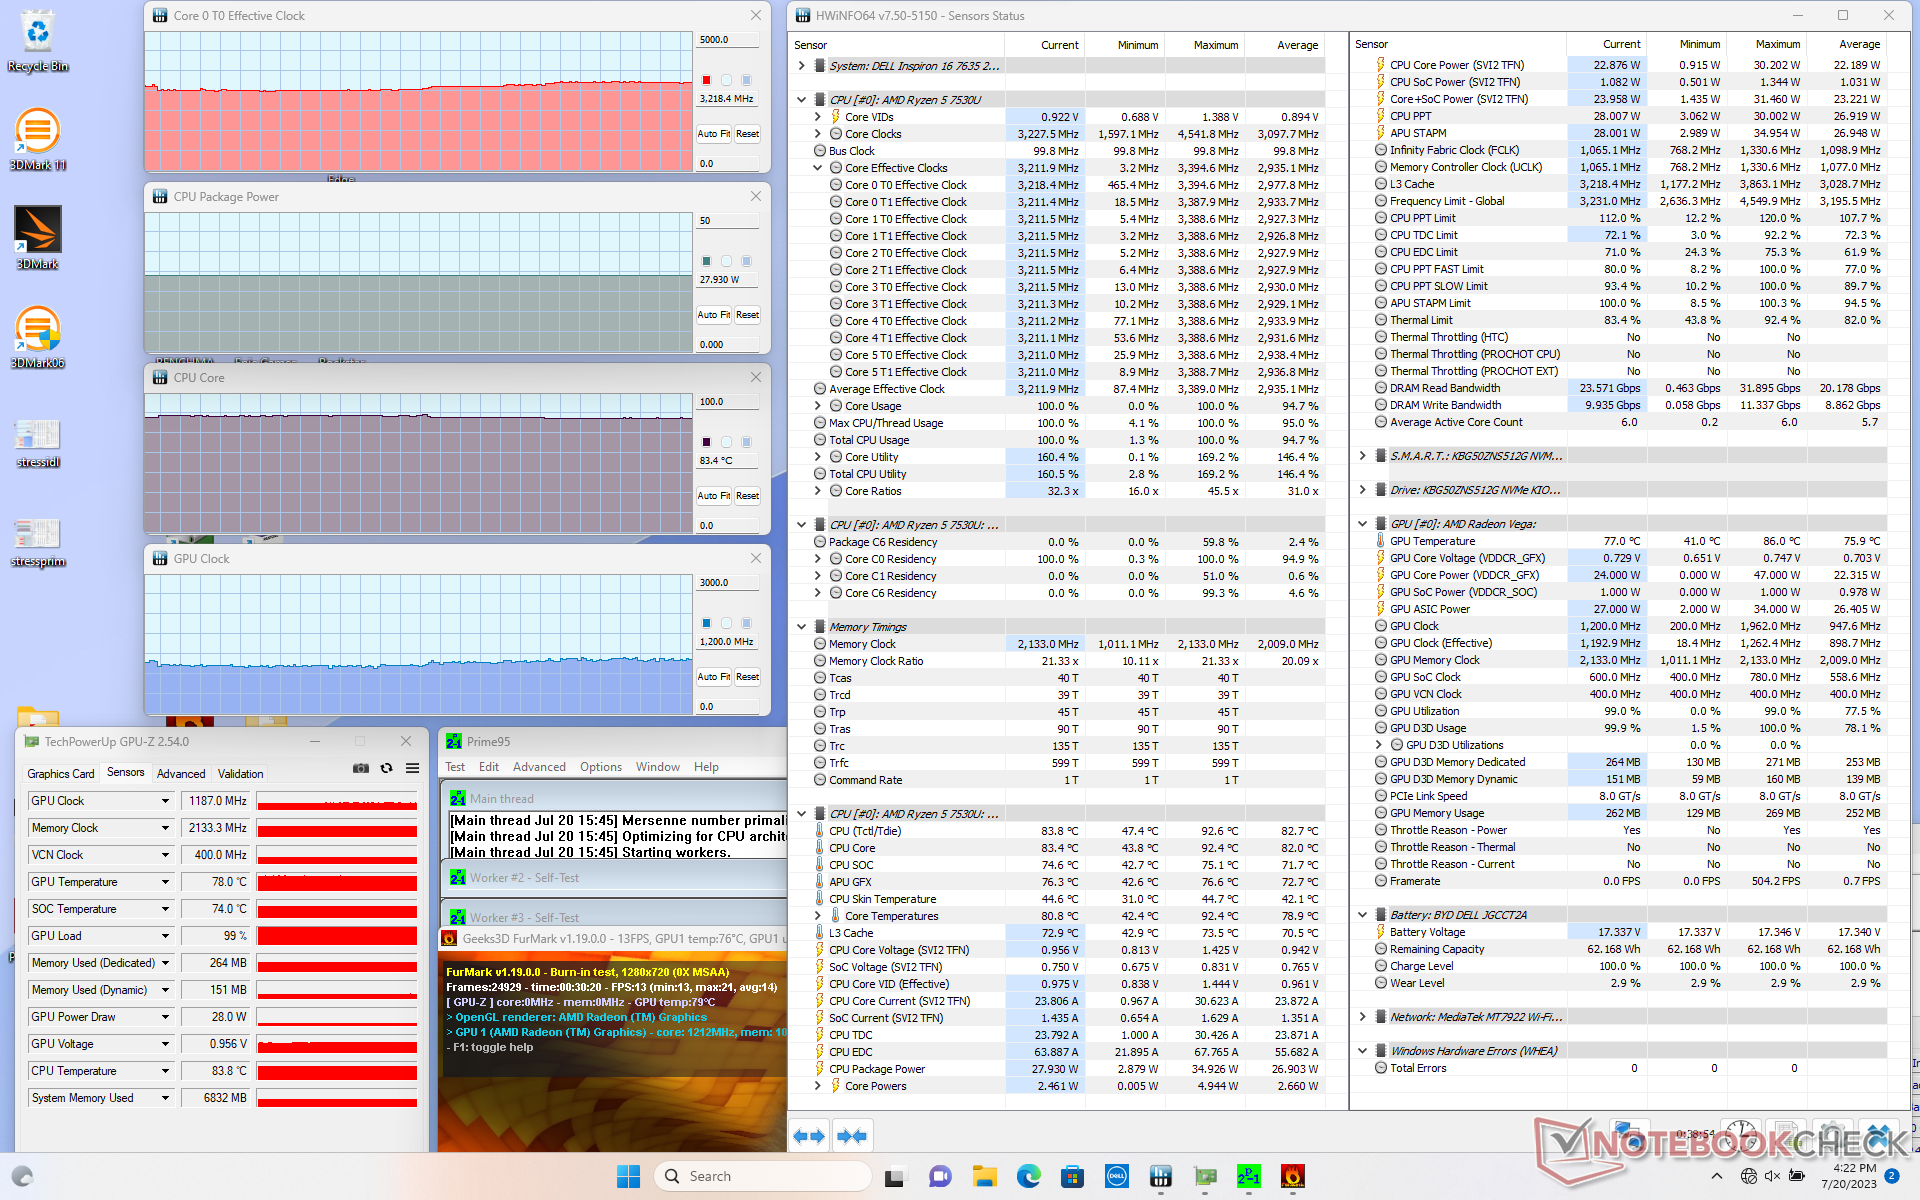
| CPU-klocka (GHz) | GPU-klocka (MHz) | Genomsnittlig CPU-temperatur (°C) | |
| System i viloläge | -- | -- | 52 |
| Prime95 Stress | 3.0 | -- | 90 |
| Prime95 + FurMark Stress | 3.1 - 3.2 | 1187 | 83 |
| Witcher 3 Stress | 1.2 | 2000 | 75 |
Högtalare
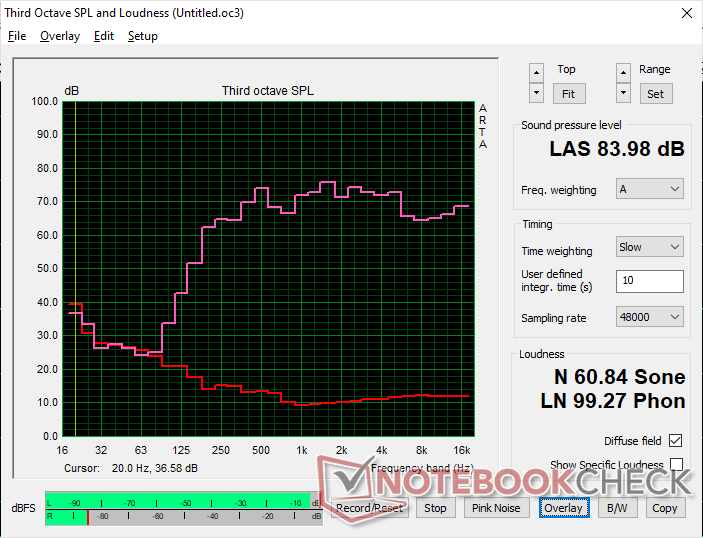
Dell Inspiron 16 7635 2-in-1 ljudanalys
(+) | högtalare kan spela relativt högt (84 dB)
Bas 100 - 315 Hz
(±) | reducerad bas - i genomsnitt 14.9% lägre än medianen
(±) | linjäriteten för basen är genomsnittlig (11.9% delta till föregående frekvens)
Mellan 400 - 2000 Hz
(+) | balanserad mellan - endast 3.5% från medianen
(+) | mids är linjära (6.9% delta till föregående frekvens)
Högsta 2 - 16 kHz
(+) | balanserade toppar - endast 4.1% från medianen
(+) | toppar är linjära (3.7% delta till föregående frekvens)
Totalt 100 - 16 000 Hz
(+) | det totala ljudet är linjärt (12.2% skillnad mot median)
Jämfört med samma klass
» 12% av alla testade enheter i den här klassen var bättre, 4% liknande, 84% sämre
» Den bästa hade ett delta på 6%, genomsnittet var 20%, sämst var 57%
Jämfört med alla testade enheter
» 10% av alla testade enheter var bättre, 3% liknande, 88% sämre
» Den bästa hade ett delta på 4%, genomsnittet var 23%, sämst var 134%
Apple MacBook Pro 16 2021 M1 Pro ljudanalys
(+) | högtalare kan spela relativt högt (84.7 dB)
Bas 100 - 315 Hz
(+) | bra bas - bara 3.8% från medianen
(+) | basen är linjär (5.2% delta till föregående frekvens)
Mellan 400 - 2000 Hz
(+) | balanserad mellan - endast 1.3% från medianen
(+) | mids är linjära (2.1% delta till föregående frekvens)
Högsta 2 - 16 kHz
(+) | balanserade toppar - endast 1.9% från medianen
(+) | toppar är linjära (2.7% delta till föregående frekvens)
Totalt 100 - 16 000 Hz
(+) | det totala ljudet är linjärt (4.6% skillnad mot median)
Jämfört med samma klass
» 0% av alla testade enheter i den här klassen var bättre, 0% liknande, 100% sämre
» Den bästa hade ett delta på 5%, genomsnittet var 17%, sämst var 45%
Jämfört med alla testade enheter
» 0% av alla testade enheter var bättre, 0% liknande, 100% sämre
» Den bästa hade ett delta på 4%, genomsnittet var 23%, sämst var 134%
Energiförvaltning
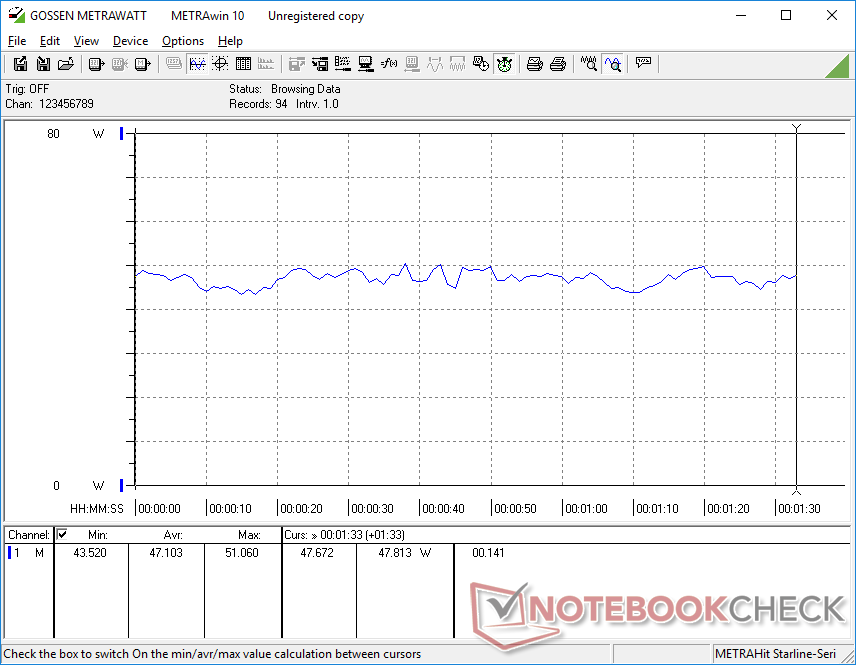
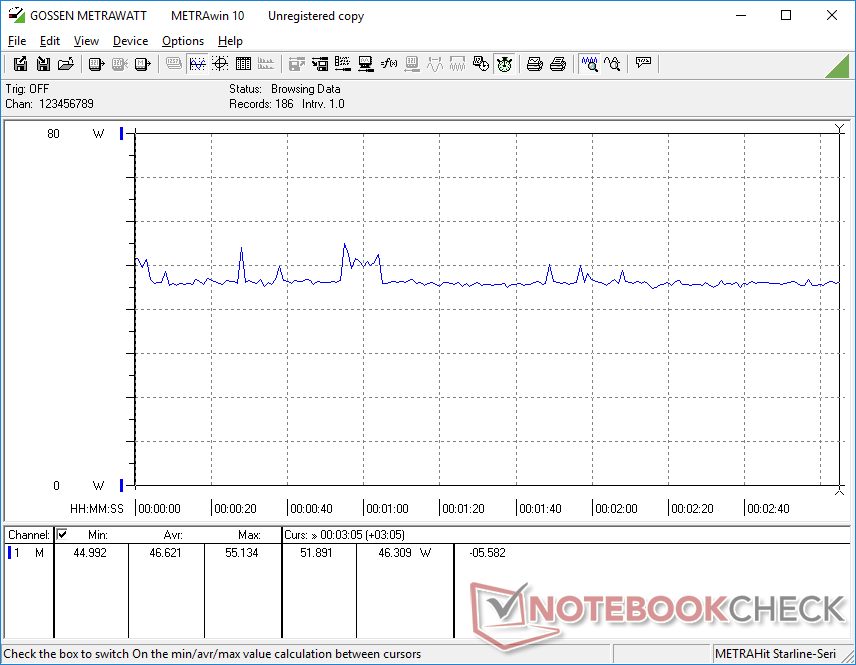
Strömförbrukning
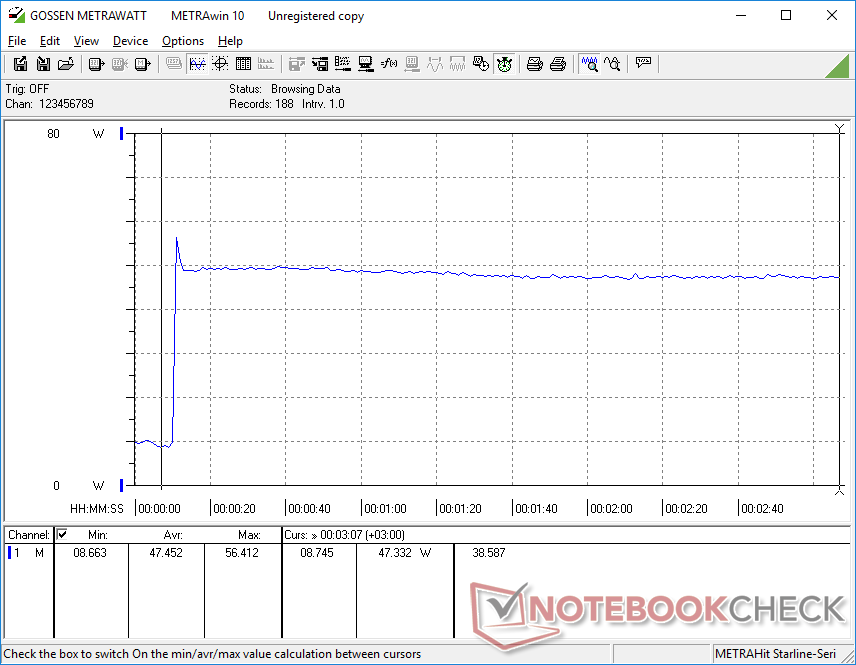
Strömförbrukningen under de flesta förhållanden är genomgående lägre än på förra årets Core-P-drivna Inspiron 16 7620 2-in-1, vilket kan vara orsaken till den goda batteritiden i nästa avsnitt. Den är också lägre än den Core-U-drivna Yoga 7 16IRL8 i genomsnitt för att visa utmärkt prestanda per watt mot konkurrenterna.
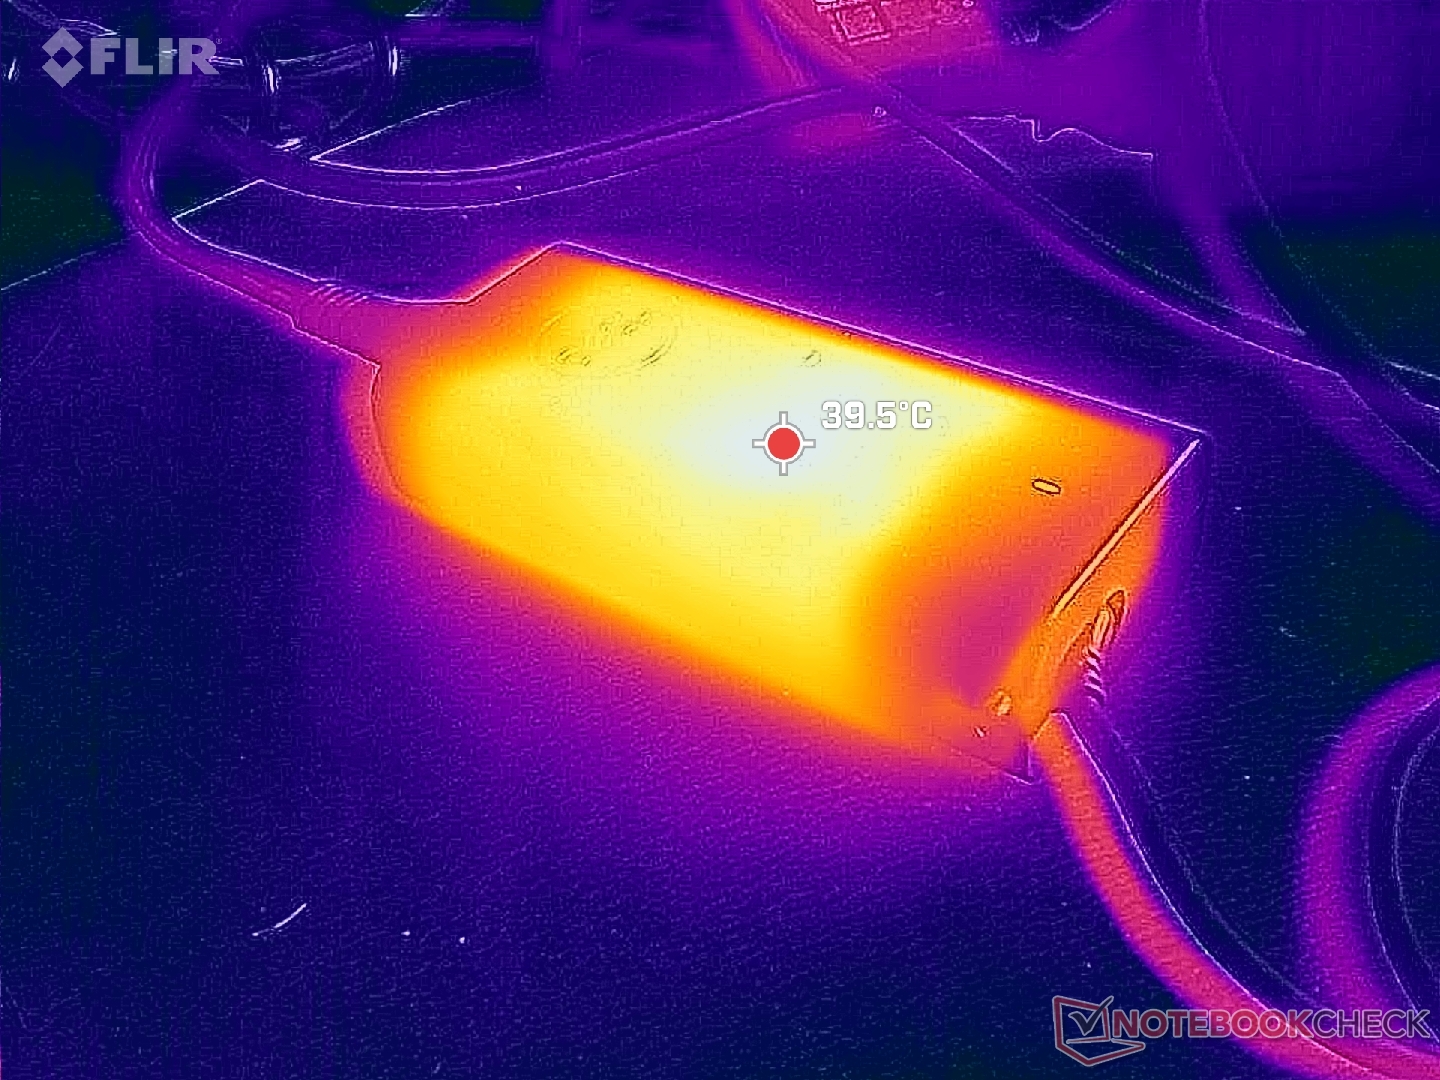
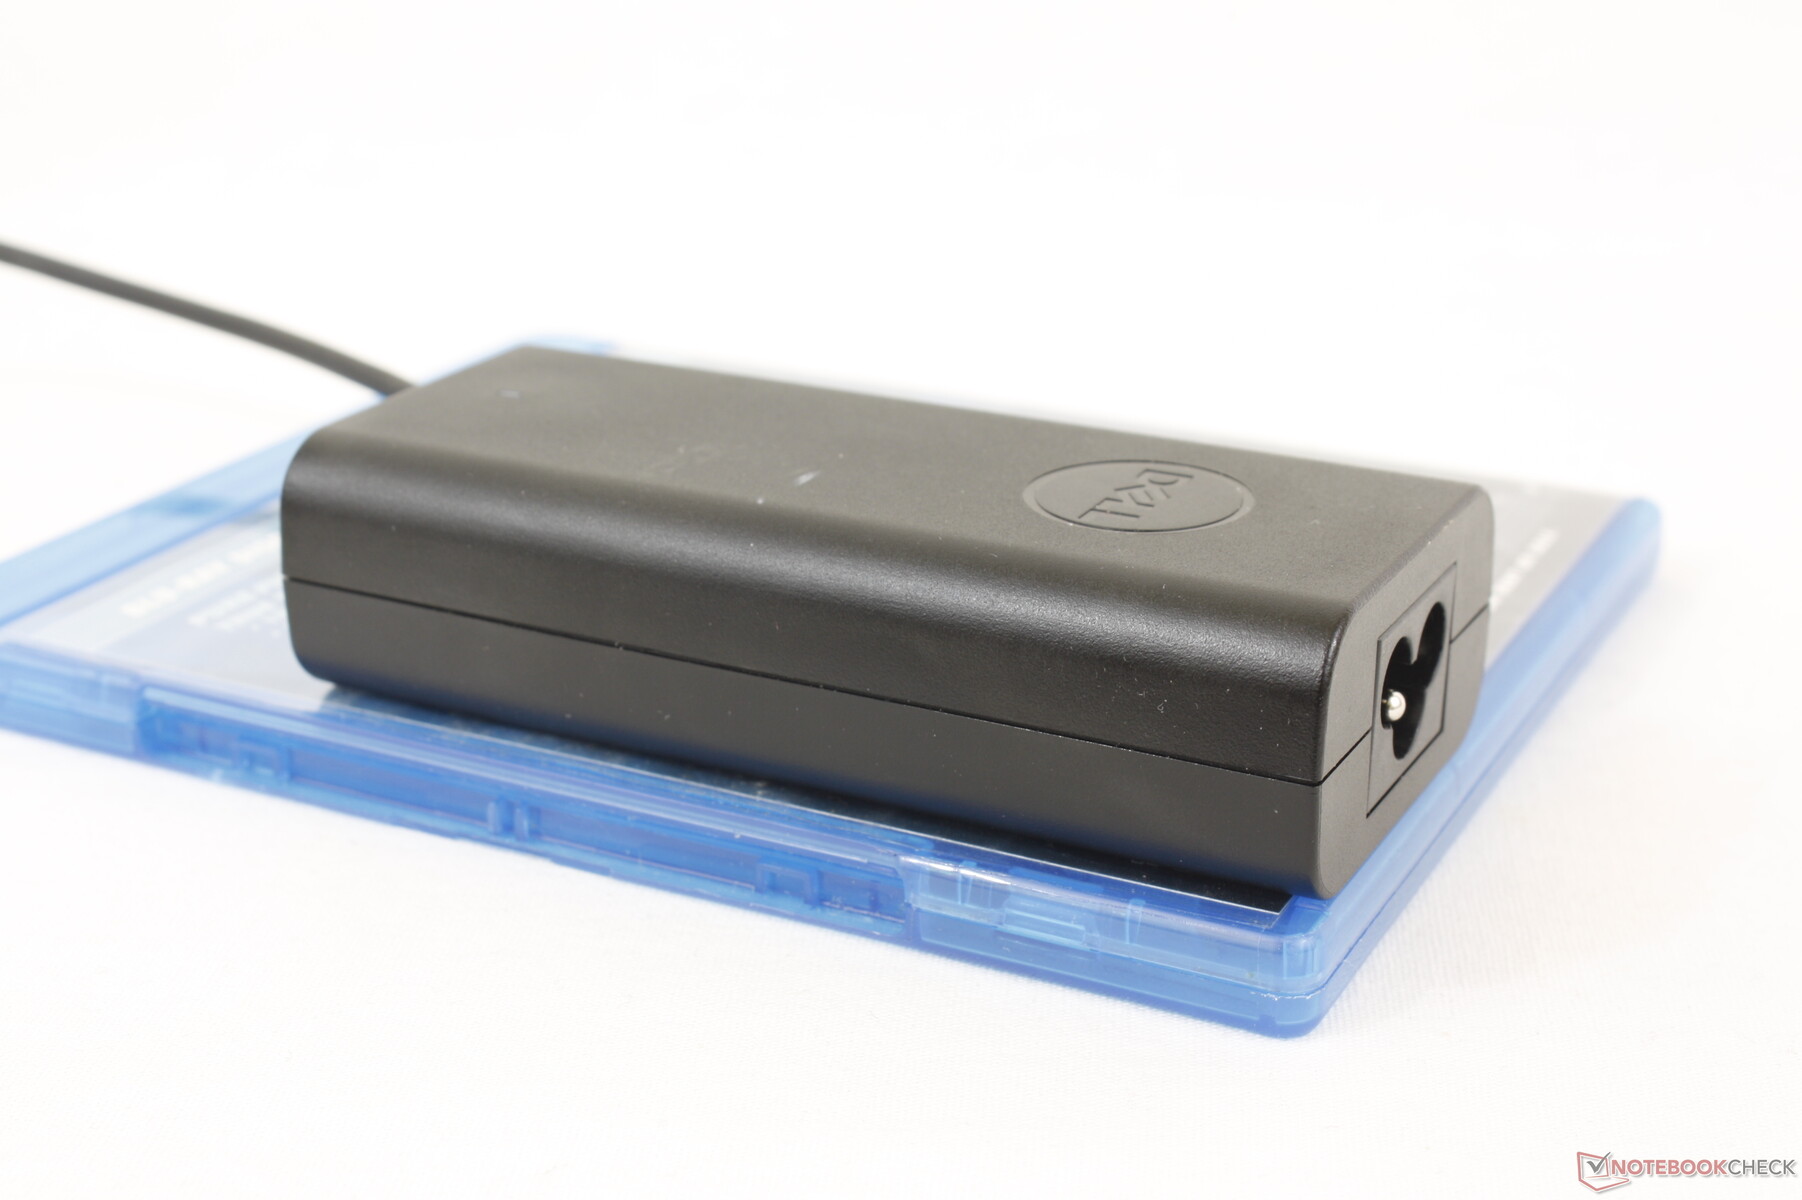
Vi kan mäta ett maximalt uttag på 57 W från den lilla-medium (~11,2 x 5 x 2,8 cm) 65 W AC-adaptern när CPU:n utnyttjas till 100 procent. Det rymliga overheadet säkerställer att systemet fortfarande kan laddas vid krävande belastning även om det går långsammare och att processorn inte flaskhalsas av en otillräcklig storlek på nätadaptern.
| Av/Standby | |
| Låg belastning | |
| Hög belastning |
|
Förklaring:
min: | |
| Dell Inspiron 16 7635 2-in-1 R5 7530U, Vega 7, Kioxia BG5 KBG50ZNS512G, IPS, 1920x1200, 16" | Acer Swift Edge SFE16-42-R1GM R7 7735U, Radeon 680M, Micron 3400 1TB MTFDKBA1T0TFH, OLED, 3840x2400, 16" | Lenovo Yoga 7 16IRL8 i7-1355U, Iris Xe G7 96EUs, WD PC SN740 512GB SDDPMQD-512G-1101, IPS, 1920x1200, 16" | Samsung Galaxy Book3 Pro 16 i5-1340P, Iris Xe G7 80EUs, WD PC SN740 256GB SDDPNQD-256G, AMOLED, 2880x1800, 16" | Lenovo IdeaPad Flex 5 16ABR G8 R7 7730U, Vega 8, Samsung PM9B1 1024GB MZAL41T0HBLB, IPS, 1920x1200, 16" | Dell Inspiron 16 7620 2-in-1 i7-1260P, Iris Xe G7 96EUs, Toshiba KBG40ZNS512G NVMe, IPS, 1920x1200, 16" | |
|---|---|---|---|---|---|---|
| Power Consumption | -15% | -8% | 8% | -21% | -10% | |
| Idle Minimum * (Watt) | 4.8 | 8.6 -79% | 3.3 31% | 3.9 19% | 5.4 -13% | 5.3 -10% |
| Idle Average * (Watt) | 7.6 | 7.7 -1% | 10.2 -34% | 4.8 37% | 11.1 -46% | 8.3 -9% |
| Idle Maximum * (Watt) | 8.7 | 9.3 -7% | 10.3 -18% | 10 -15% | 11.6 -33% | 9.6 -10% |
| Load Average * (Watt) | 47.1 | 47.9 -2% | 55.2 -17% | 44 7% | 52.7 -12% | 54.3 -15% |
| Witcher 3 ultra * (Watt) | 46.6 | 46.3 1% | 43.8 6% | 42.3 9% | 47.6 -2% | 43.9 6% |
| Load Maximum * (Watt) | 56.4 | 56 1% | 65.7 -16% | 63 -12% | 67 -19% | 70 -24% |
* ... mindre är bättre
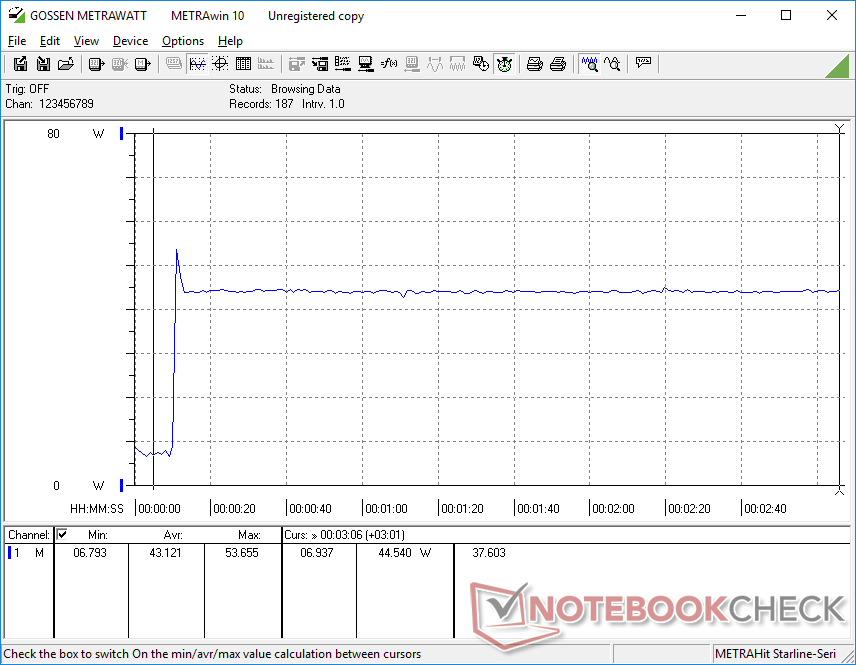
Power Consumption Witcher 3 / Stresstest
Power Consumption external Monitor
Batteritid
Inspiron 16 7635 2-in-1 levereras med ett 64 Wh-batteripaket jämfört med det större 86 Wh-paketet för Inspiron 16 7630 2-in-1 eller 7620 2-in-1. AMD-användare får därför den korta änden av pinnen eftersom det större batteriet för närvarande är exklusivt för Intel-konfigurationerna.
Batteritiden är dock fortfarande mycket bra trots det mindre batteripaketet på vår AMD-enhet. Vi kan registrera 14,5 timmars verklig användning av WLAN-surfning, vilket är nästan samma som vad vi registrerade på förra årets Intel-drivna Inspiron 16 7620 2-i-1. Det är längre än den likadant utrustade IdeaPad Flex 5 16 med flera timmar.
Laddning från tom till full kapacitet med den medföljande nätadaptern tar cirka 2 timmar.
| Dell Inspiron 16 7635 2-in-1 R5 7530U, Vega 7, 64 Wh | Acer Swift Edge SFE16-42-R1GM R7 7735U, Radeon 680M, 54 Wh | Lenovo Yoga 7 16IRL8 i7-1355U, Iris Xe G7 96EUs, 71 Wh | Samsung Galaxy Book3 Pro 16 i5-1340P, Iris Xe G7 80EUs, 76 Wh | Lenovo IdeaPad Flex 5 16ABR G8 R7 7730U, Vega 8, 52.5 Wh | Dell Inspiron 16 7620 2-in-1 i7-1260P, Iris Xe G7 96EUs, 87 Wh | |
|---|---|---|---|---|---|---|
| Batteridrifttid | -43% | -17% | -3% | -37% | 11% | |
| Reader / Idle (h) | 26 | 10.9 -58% | 19 -27% | 30.4 17% | 17 -35% | |
| WiFi v1.3 (h) | 14.5 | 7.3 -50% | 9.4 -35% | 10.2 -30% | 9.8 -32% | 14.6 1% |
| Load (h) | 1.9 | 1.5 -21% | 2.1 11% | 2 5% | 1.1 -42% | 3.2 68% |
| H.264 (h) | 8.6 | 14.4 | 13.1 |
För
Emot
Omdöme - Många avskurna hörn jämfört med Inspiron 16 7630 2-in-1
Den AMD-drivna Inspiron 16 7635 2-i-1 är mer än bara ett processorbyte jämfört med den Intel-drivna Inspiron 16 7630 2-i-1. Den saknar alternativ för en OLED-pekskärm med högre upplösning, IR-sensor, diskreta grafikalternativ, större batteripaket och Thunderbolt-stöd, allt för att vara lite billigare. Om du är villig att betala bara 100 USD mer rekommenderar vi att du överväger Core i7-1360P Inspiron 16 7630 2-i-1 istället för vår Ryzen 5-konfiguration eftersom den ger både snabbare CPU- och GPU-prestanda och dubbelt så stor lagringskapacitet. Den är lite tyngre med 100 g, men båda versionerna av modellen är redan ganska tunga i första hand och börjar på 2 kg vardera.
De djupare sRGB-färgerna i Inspiron 16 7635 2-i-1 ger Dell övertaget mot den konkurrerande Lenovo Flex 5 16.
För framtida revisioner skulle vi definitivt vilja se Zen 4 eller åtminstone Zen 3+ processoralternativ för att öka den mediokra grafikprestandan. Ryzen 7 7730U-alternativet rekommenderas inte eftersom det är dyrare, långsammare och har färre funktioner än Core i7-1360P-konfigurationen. Förra årets Inspiron 16 7620 2-in-1 skulle fortfarande vara värt att överväga, särskilt eftersom den senaste versionen inte är lättare eller mer portabel
.Pris och tillgänglighet
Inspiron 16 7635 2-in-1 och Inspiron 16 7630 2-in-1 levereras nu direkt från Dell och kostar 650 USD respektive 800 USD. Vår specifika konfiguration kostar 900 USD.
Dell Inspiron 16 7635 2-in-1
- 07/23/2023 v7 (old)
Allen Ngo
Genomskinlighet
Valet av enheter som ska granskas görs av vår redaktion. Testprovet gavs till författaren som ett lån av tillverkaren eller återförsäljaren för denna recension. Långivaren hade inget inflytande på denna recension och inte heller fick tillverkaren en kopia av denna recension innan publiceringen. Det fanns ingen skyldighet att publicera denna recension. Som ett oberoende medieföretag är Notebookcheck inte föremål för auktoritet från tillverkare, återförsäljare eller förlag.
This is how Notebookcheck is testingEvery year, Notebookcheck independently reviews hundreds of laptops and smartphones using standardized procedures to ensure that all results are comparable. We have continuously developed our test methods for around 20 years and set industry standards in the process. In our test labs, high-quality measuring equipment is utilized by experienced technicians and editors. These tests involve a multi-stage validation process. Our complex rating system is based on hundreds of well-founded measurements and benchmarks, which maintains objectivity.
Price comparison

