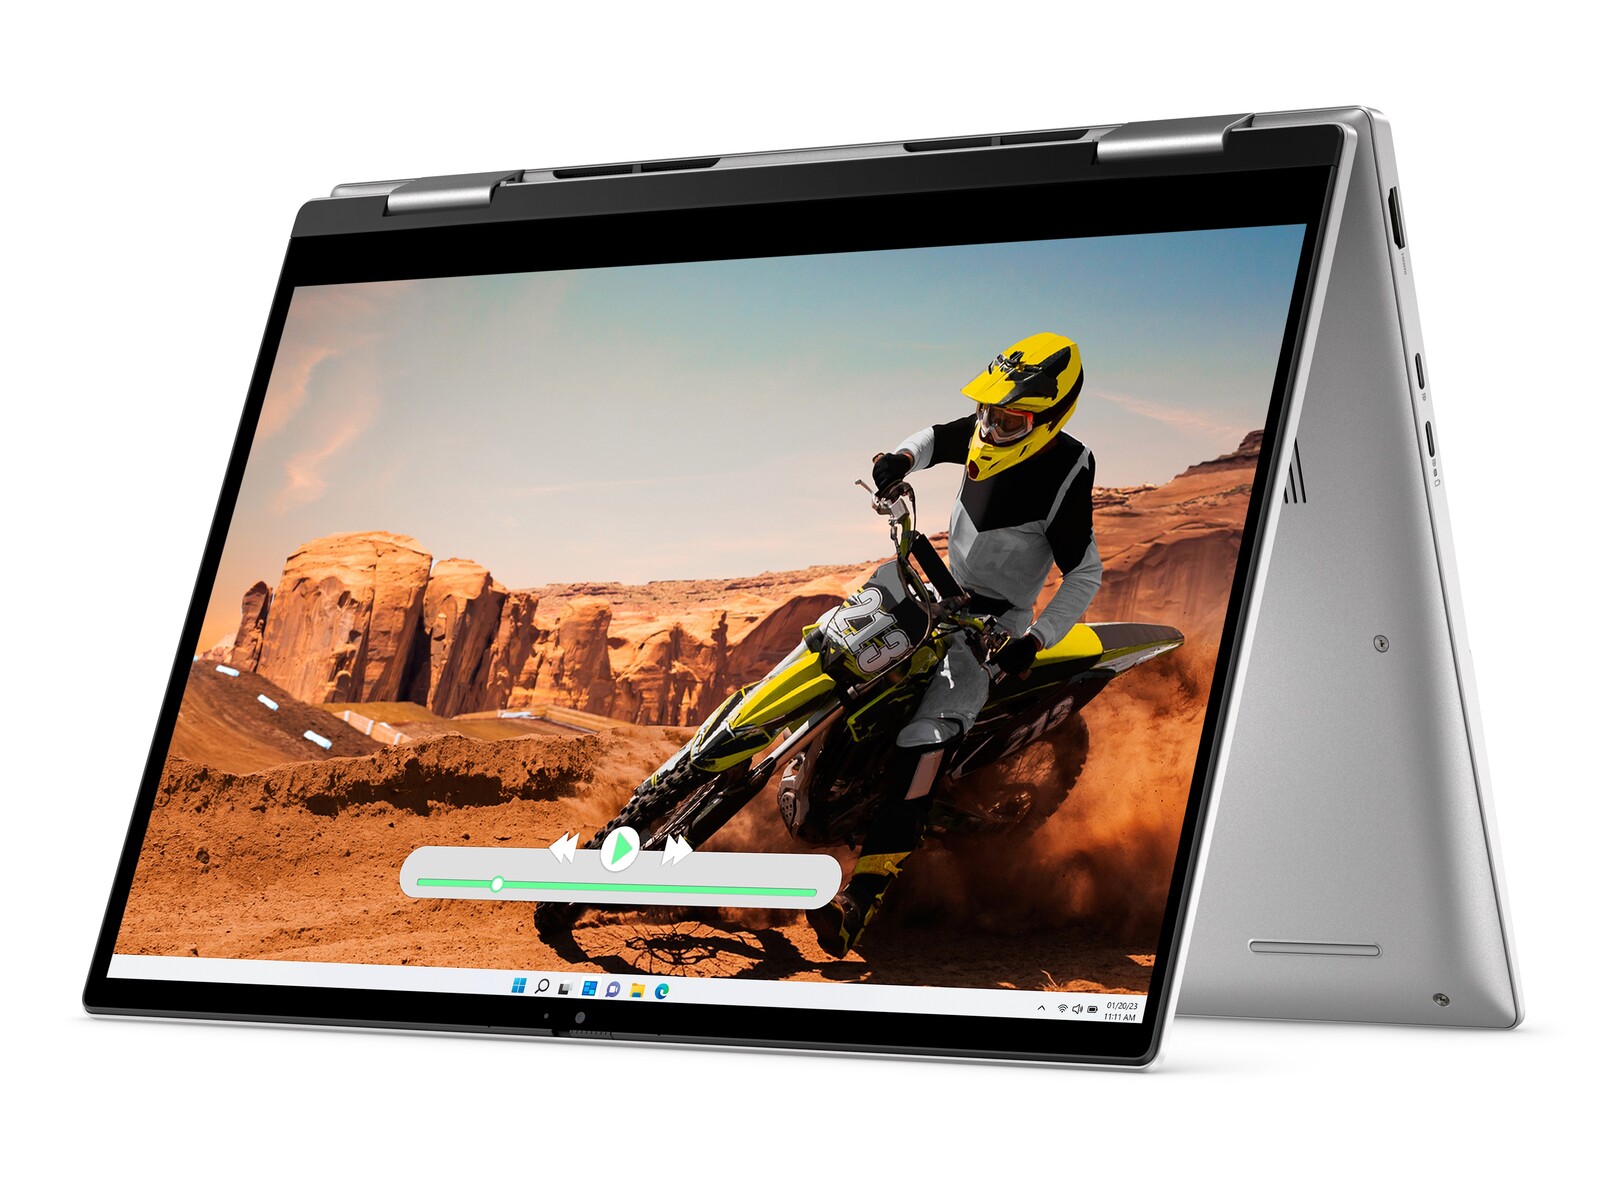
Dell Inspiron 14 7435 2-i-1 konvertibel recension: Ryzen 5 7530U för budgetanvändare

Inspiron 14 7435 2-in-1 är AMD-versionen av den Intel-baserade Inspiron 14 7430 2-in-1. Den ersätter direkt förra årets Inspiron 14 7420 2-i-1 med både uppgraderad intern och extern utrustning.
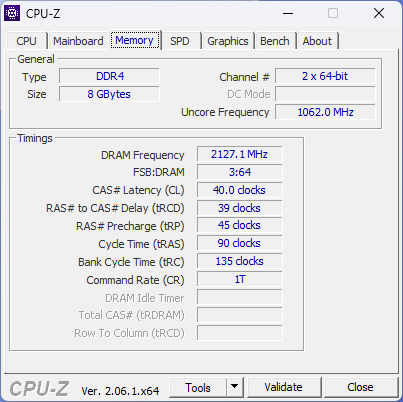
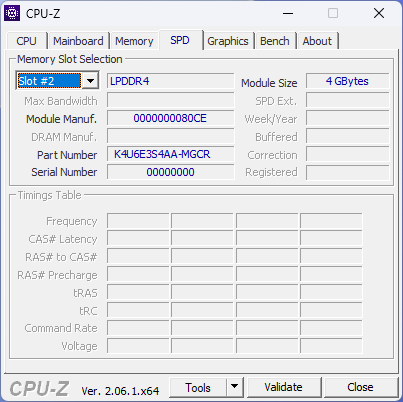
Vår specifika recensionskonfiguration är en lägre SKU med Ryzen 5 7530U CPU och 8 GB lödd LPDDR4x-4266 RAM för endast 550 USD. En mer avancerad version med dubbelt så mycket RAM och Ryzen 7 7730U CPU finns också tillgänglig, men alla konfigurationer kommer annars med samma 1200p IPS-pekskärm och integrerad Radeon Vega-grafik.
Konkurrenterna inkluderar andra budgetorienterade konvertibler som Acer Aspire 5 Spin 14,Lenovo IdeaPad Flex 7ieller HP Pavilion x360 14. Det finns en 16-tumsversion av denna modell som heter Inspiron 16 7635 2-i-1.
Fler recensioner av Dell:
Potentiella konkurrenter i jämförelse
Gradering | Datum | Modell | Vikt | Höjd | Storlek | Upplösning | Pris |
|---|---|---|---|---|---|---|---|
| 84.5 % v7 (old) | 08/2023 | Dell Inspiron 14 7435 2-in-1 R5 7530U, Vega 7 | 1.6 kg | 18.6 mm | 14.00" | 1920x1200 | |
| 83.7 % v7 (old) | 06/2022 | Dell Inspiron 14 7420 2-in-1 i7-1255U, Iris Xe G7 96EUs | 1.6 kg | 17.86 mm | 14.00" | 1920x1200 | |
| 83.2 % v7 (old) | 12/2022 | Lenovo IdeaPad Flex 7i 14IAU7 i7-1255U, Iris Xe G7 96EUs | 1.5 kg | 18.9 mm | 14.00" | 2240x1400 | |
| 82.2 % v7 (old) | 06/2023 | Acer Aspire 5 Spin 14 i5-1335U, Iris Xe G7 80EUs | 1.6 kg | 17.99 mm | 14.00" | 1920x1200 | |
| 87.5 % v7 (old) | 05/2022 | LG Gram 14T90P i5-1135G7, Iris Xe G7 80EUs | 1.2 kg | 17 mm | 14.00" | 1900x1200 | |
| 81.8 % v7 (old) | 07/2021 | HP Pavilion x360 14-dy0157ng i5-1135G7, Iris Xe G7 80EUs | 1.5 kg | 19.9 mm | 14.00" | 1920x1080 |
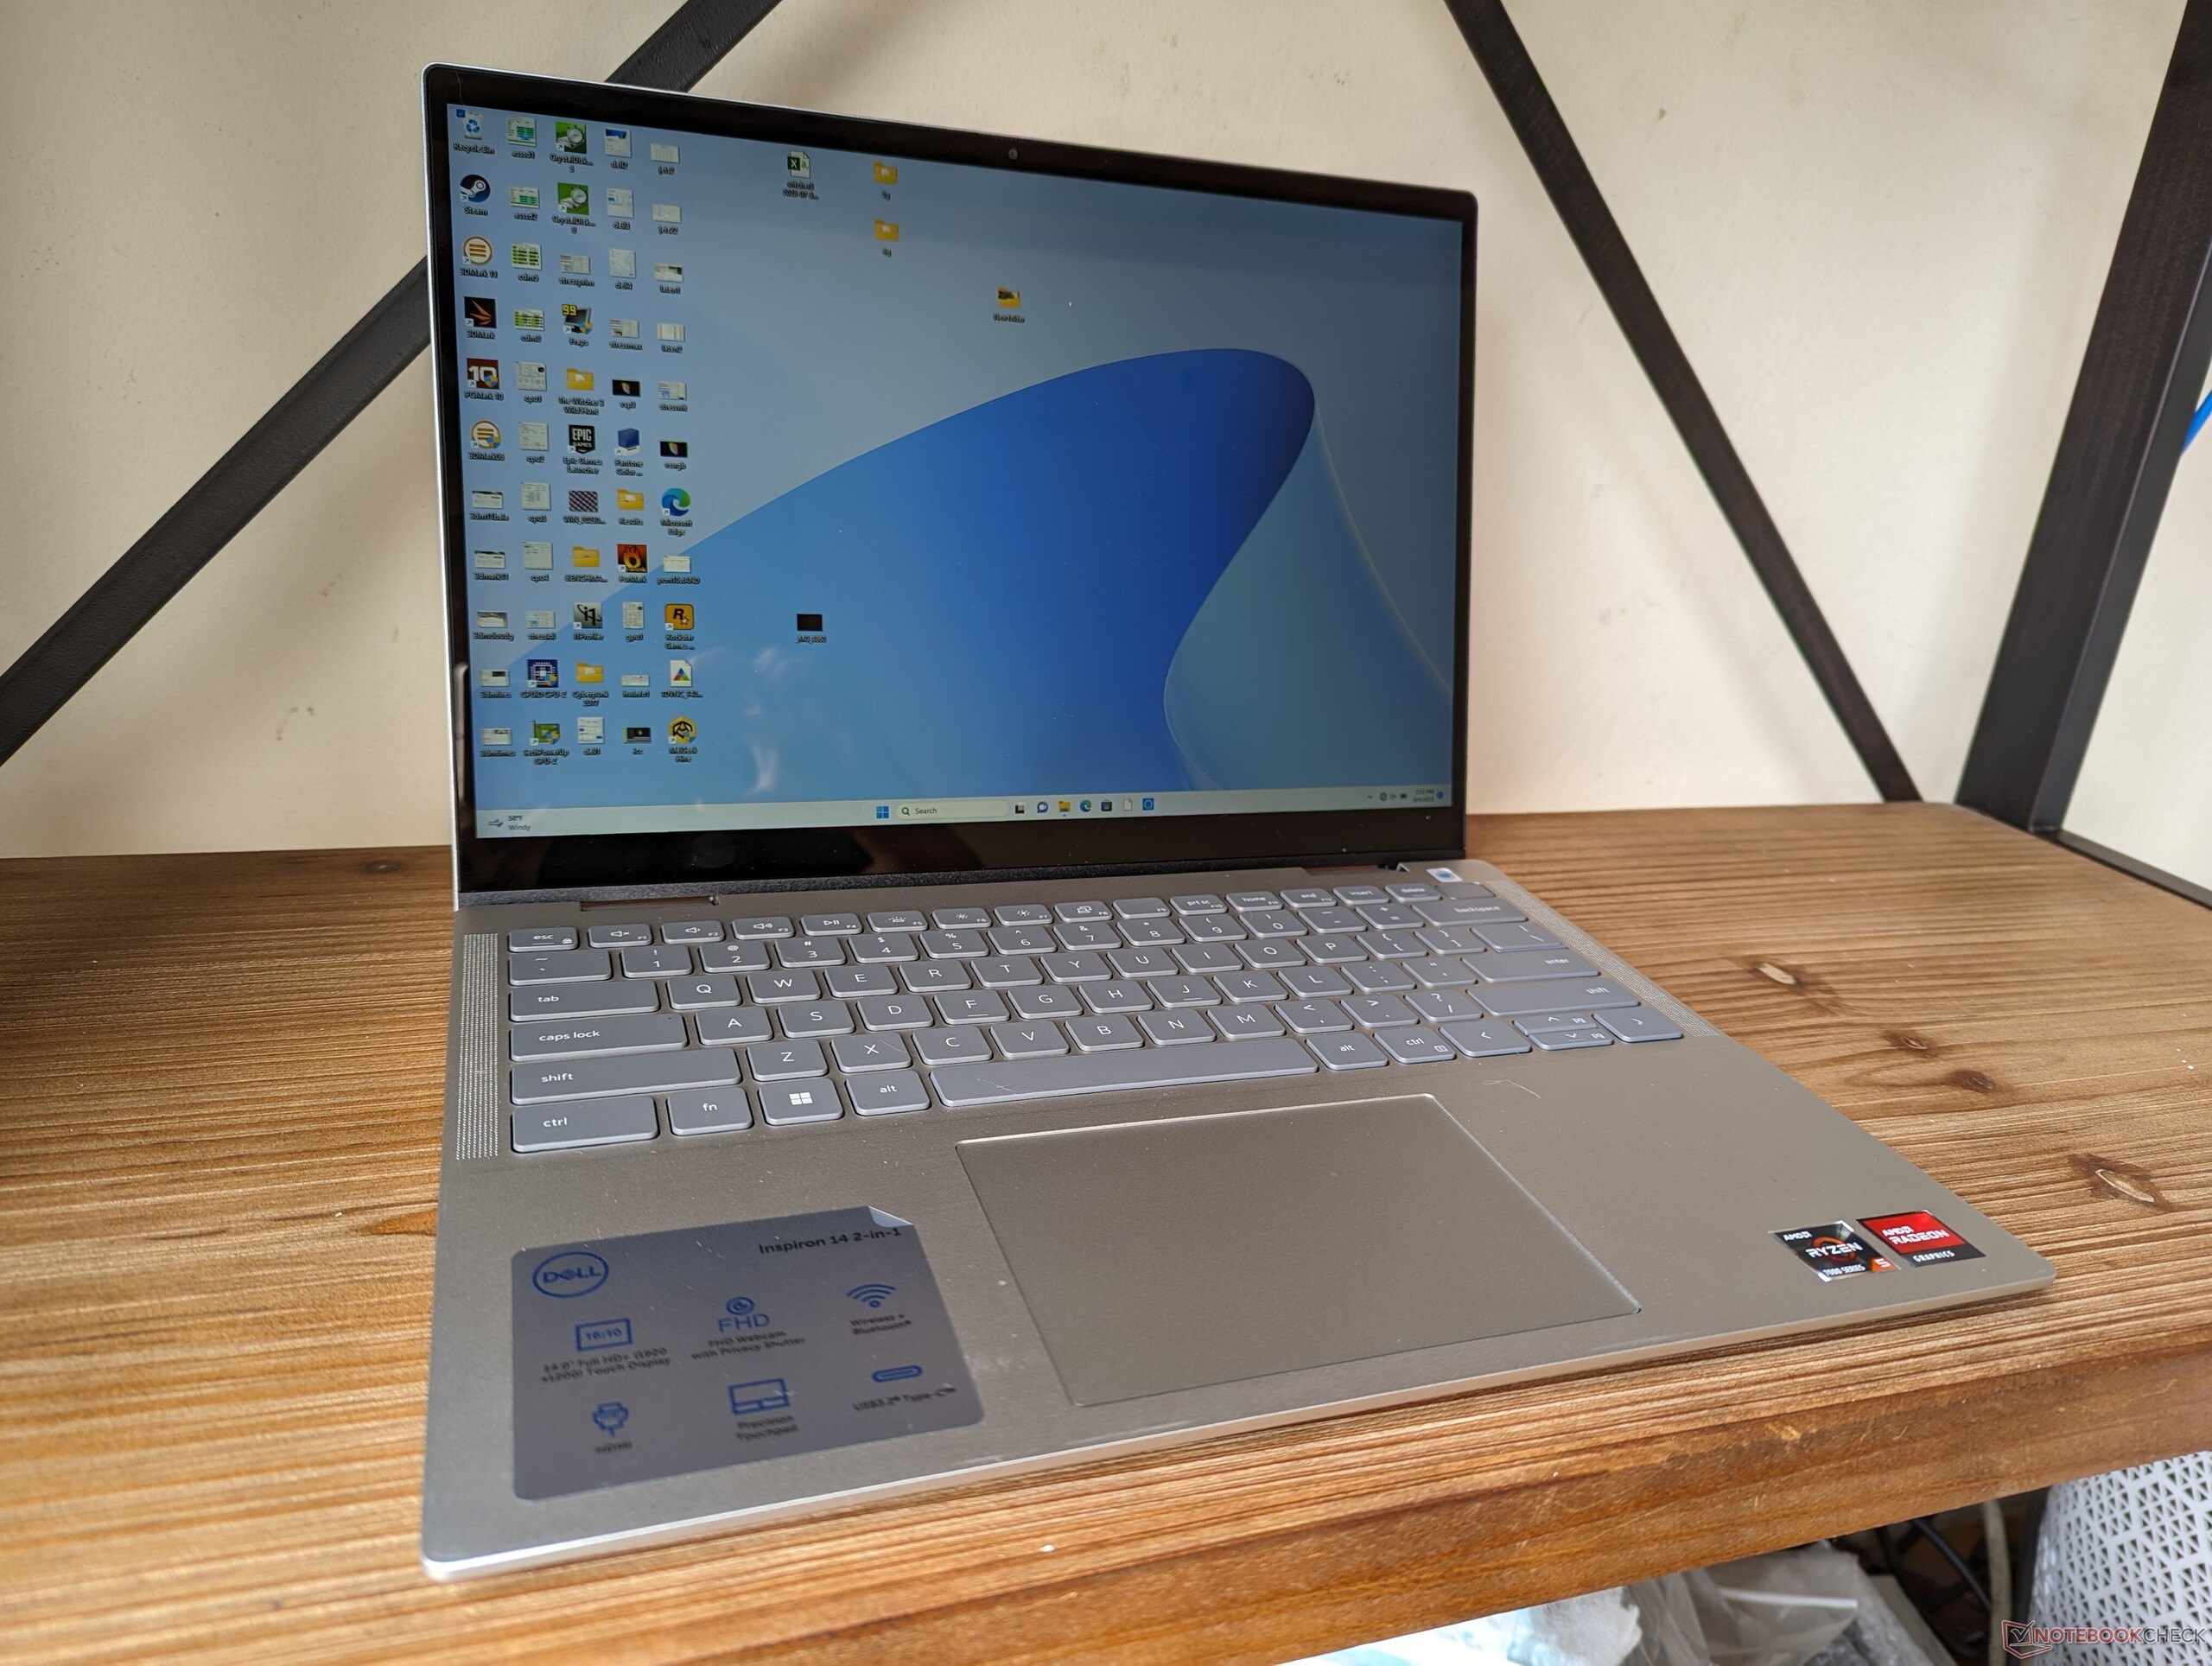
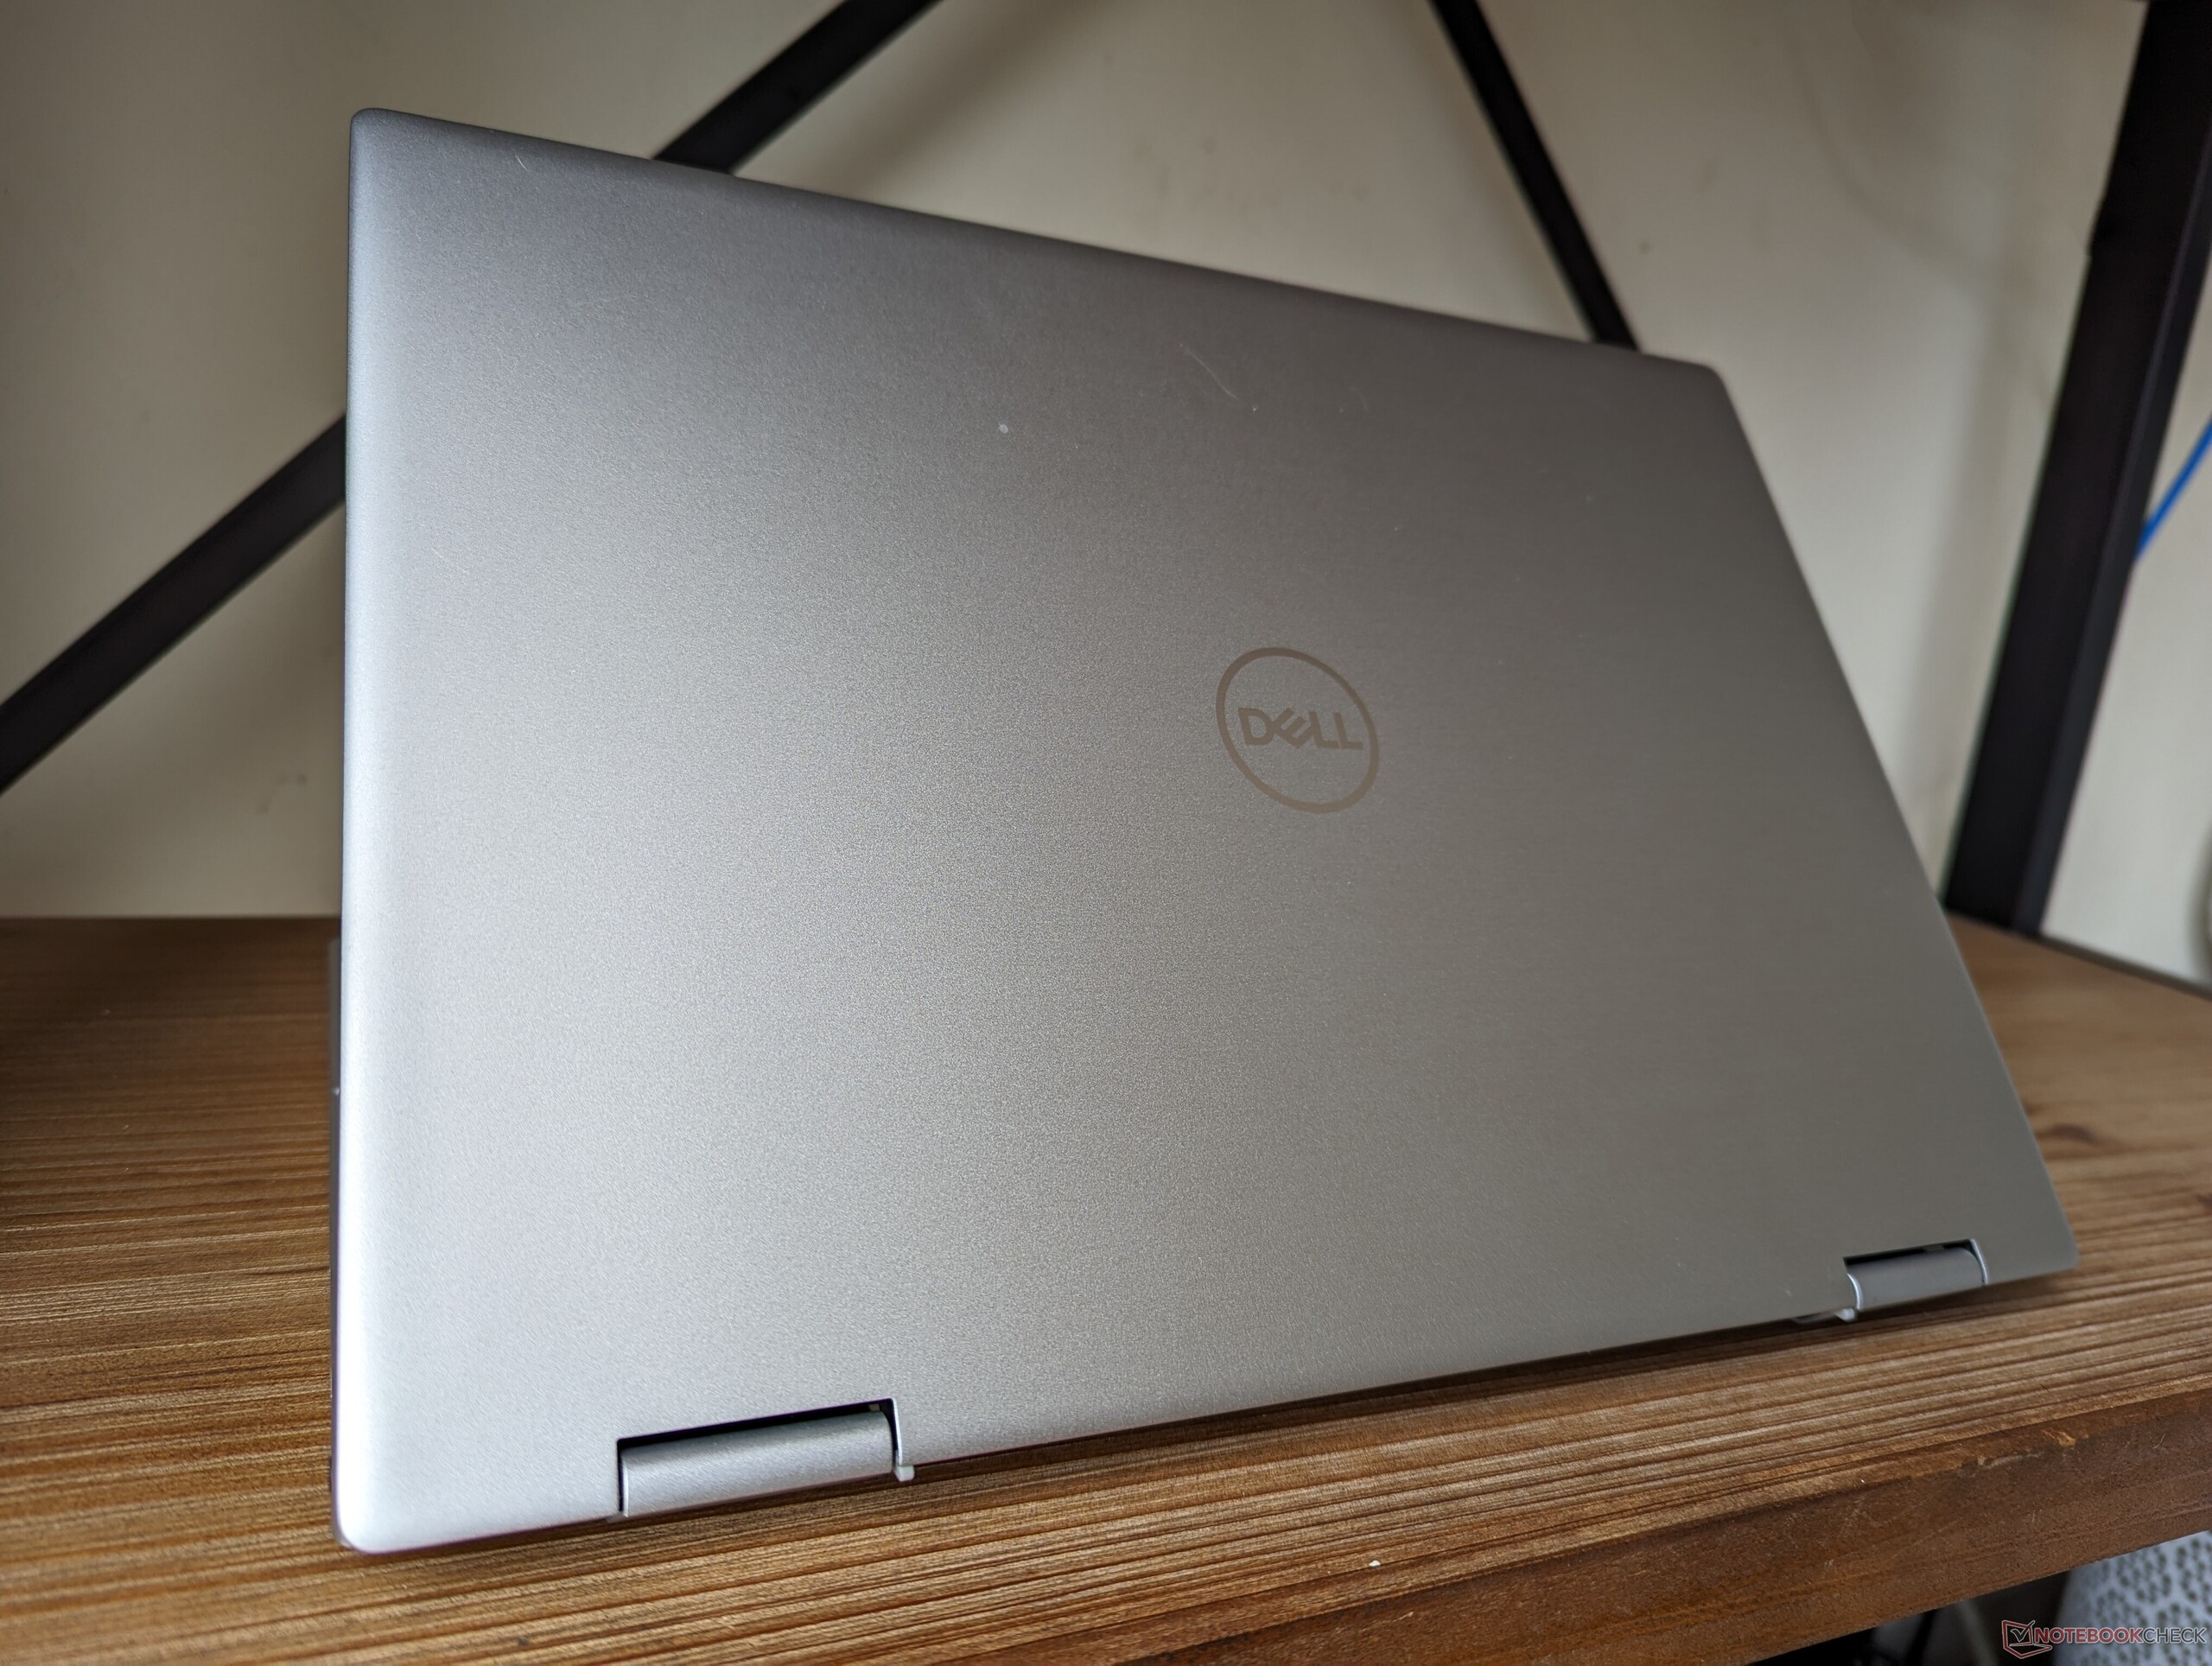
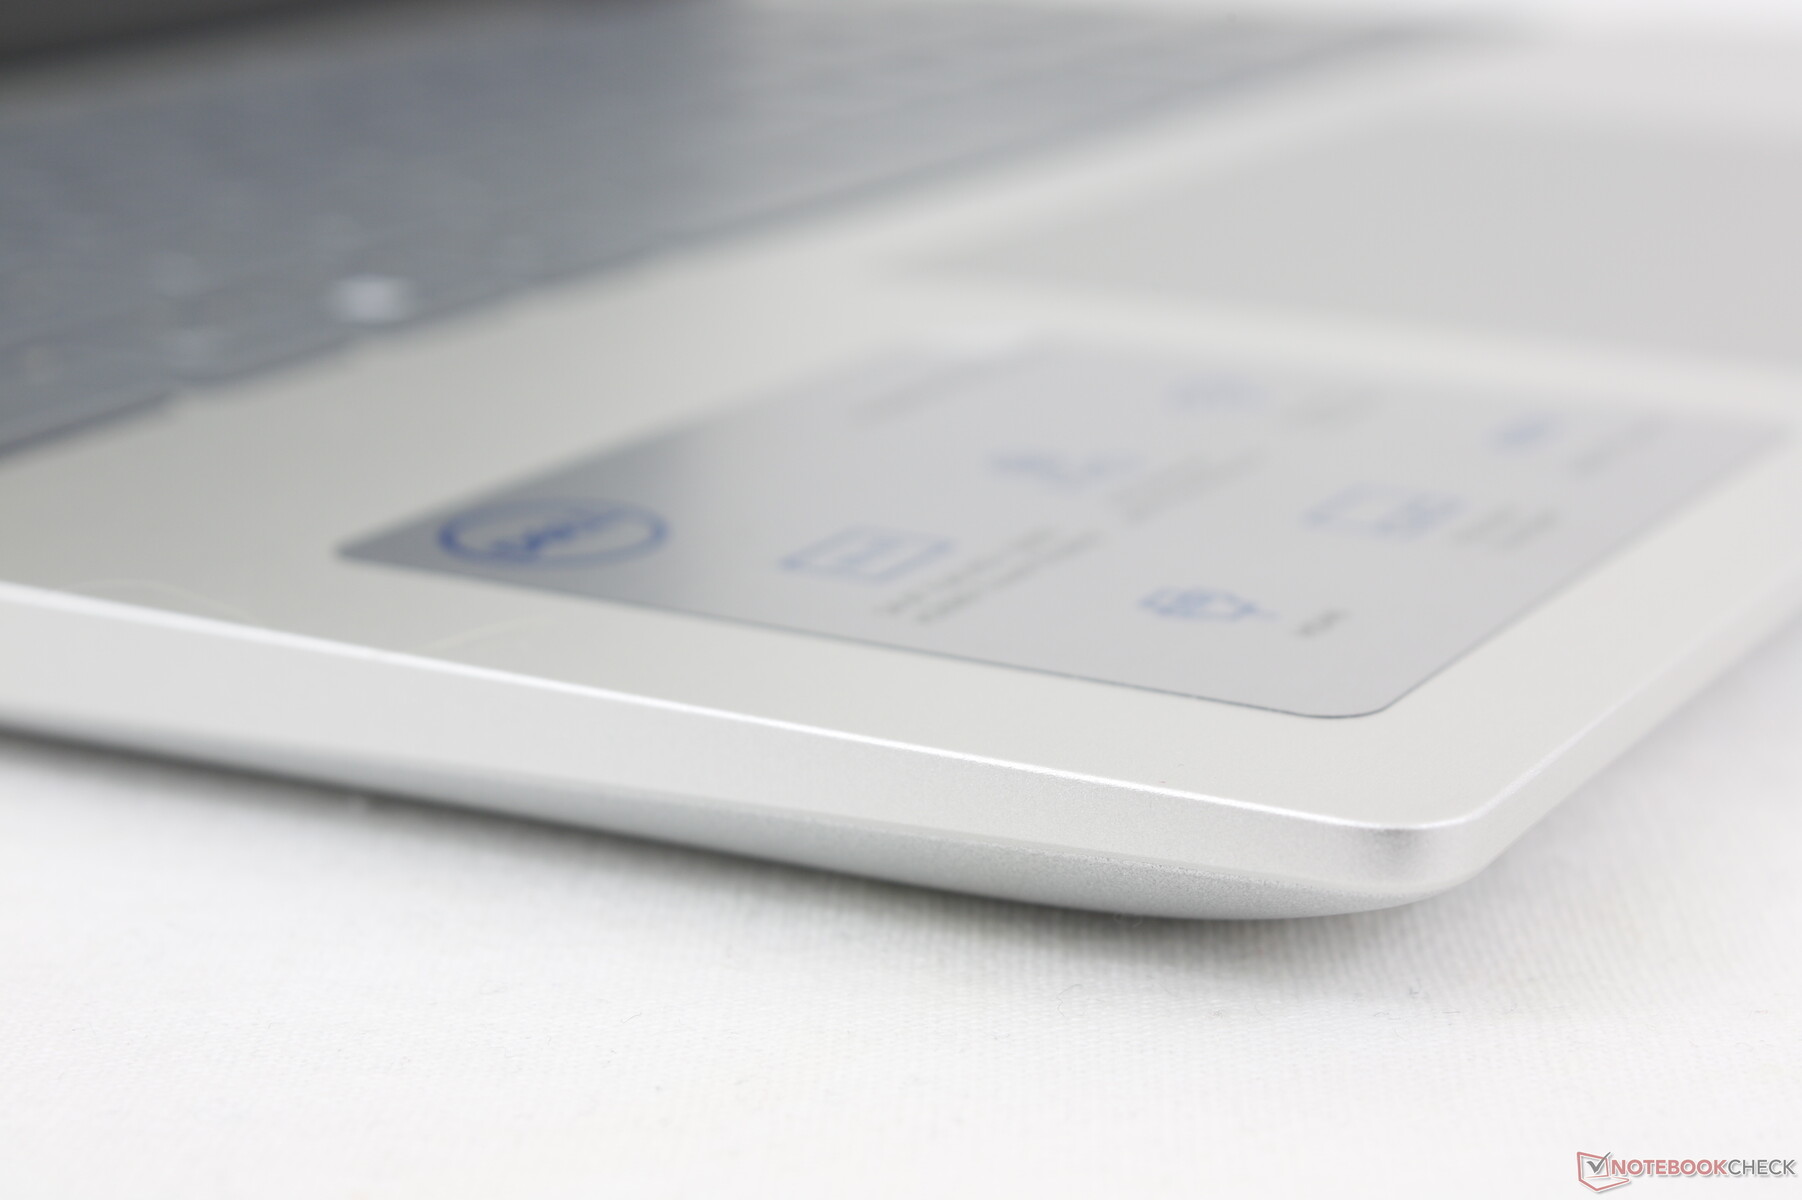
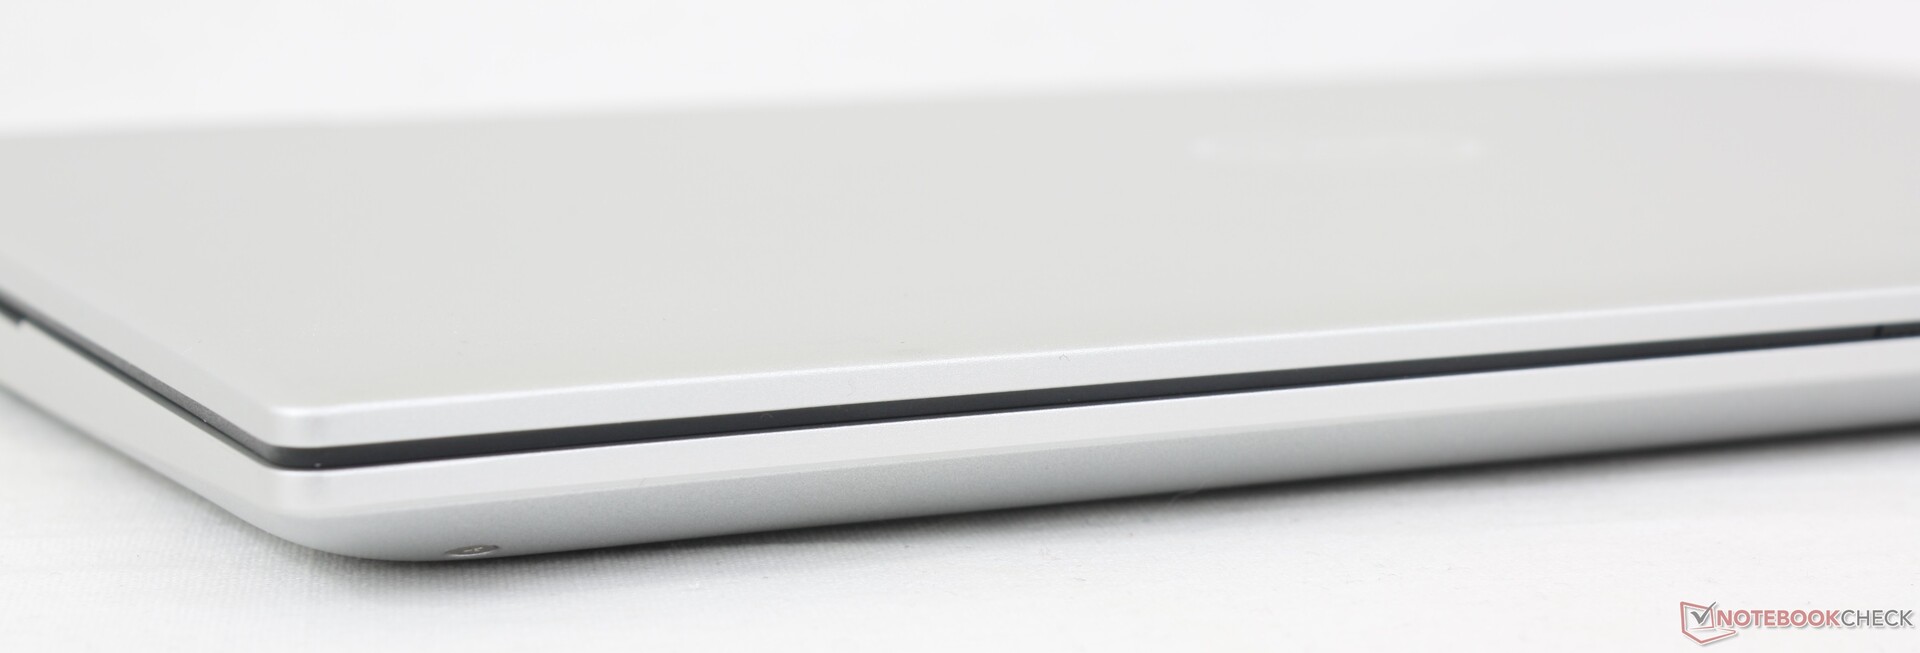
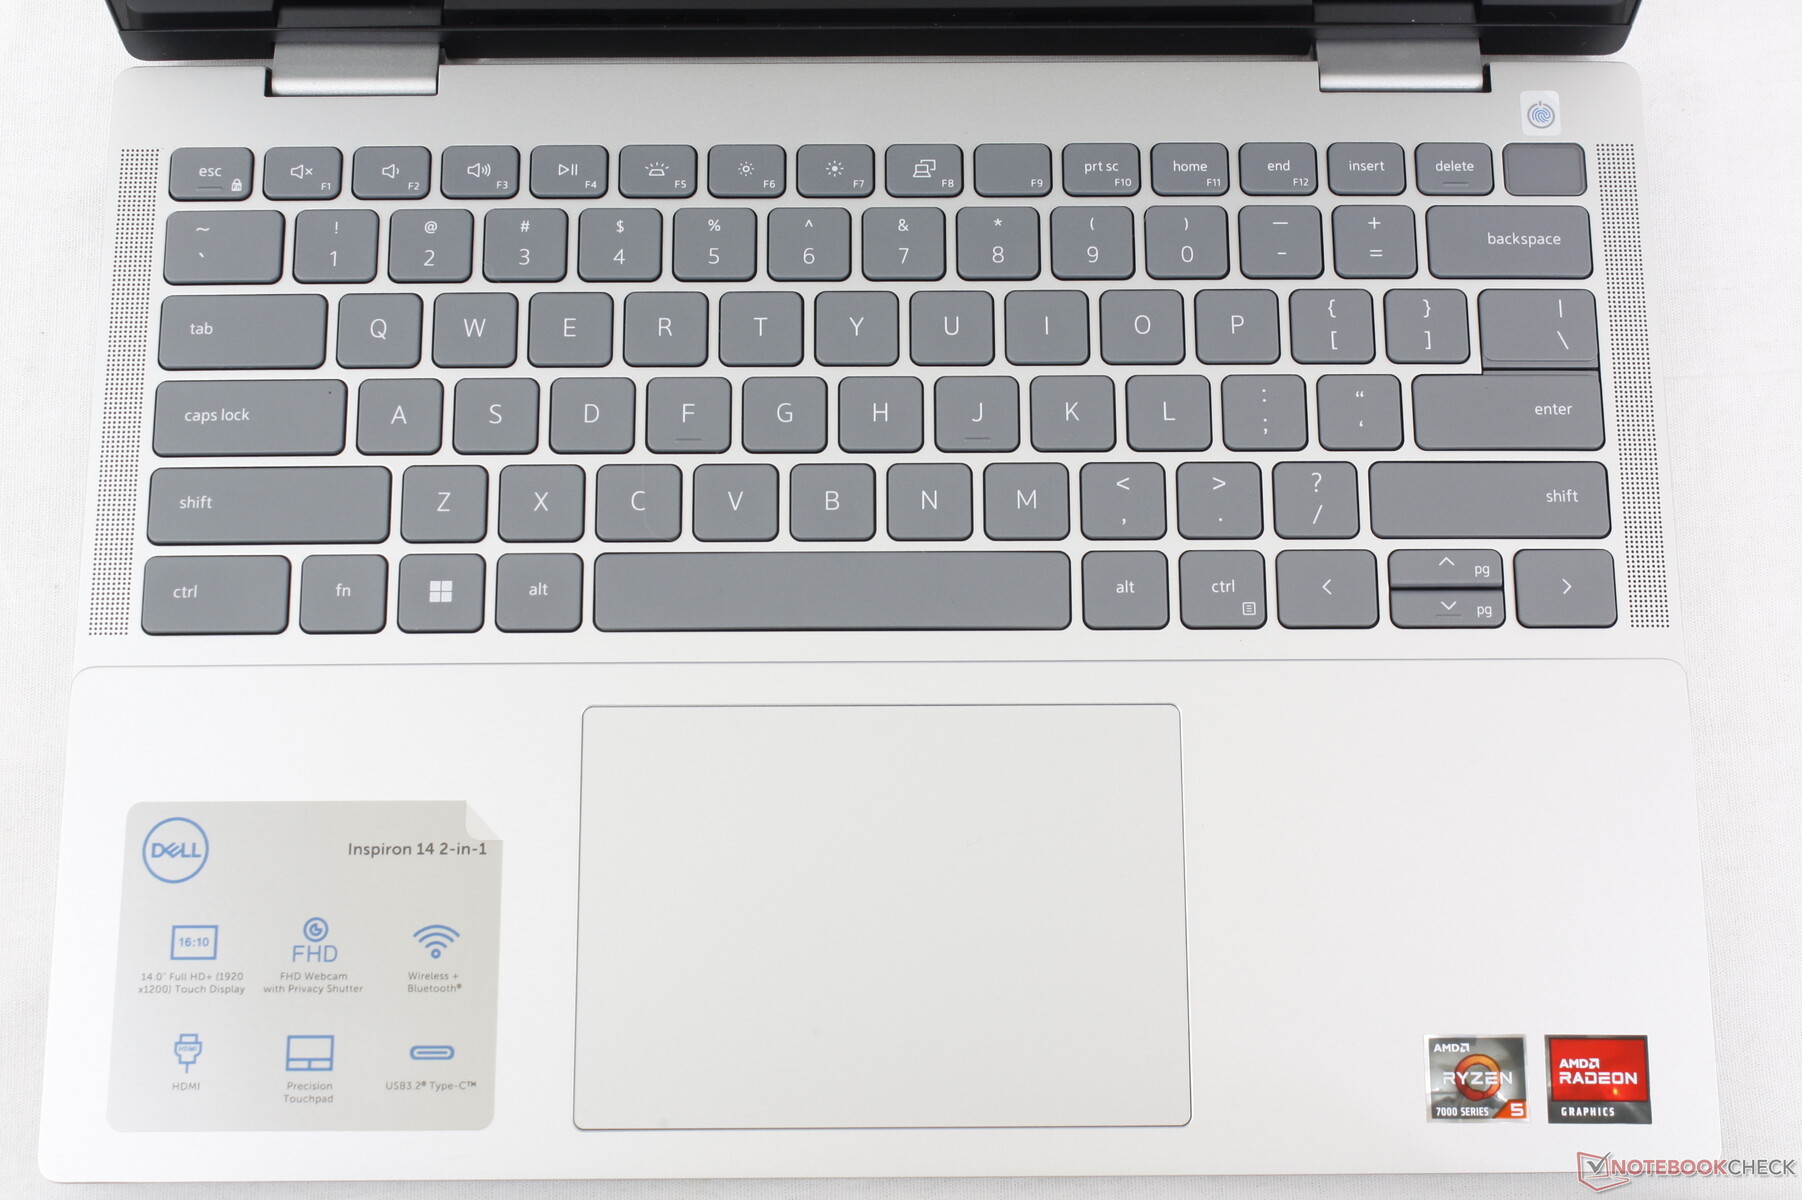
Hölje - Reviderade högtalare och gångjärn
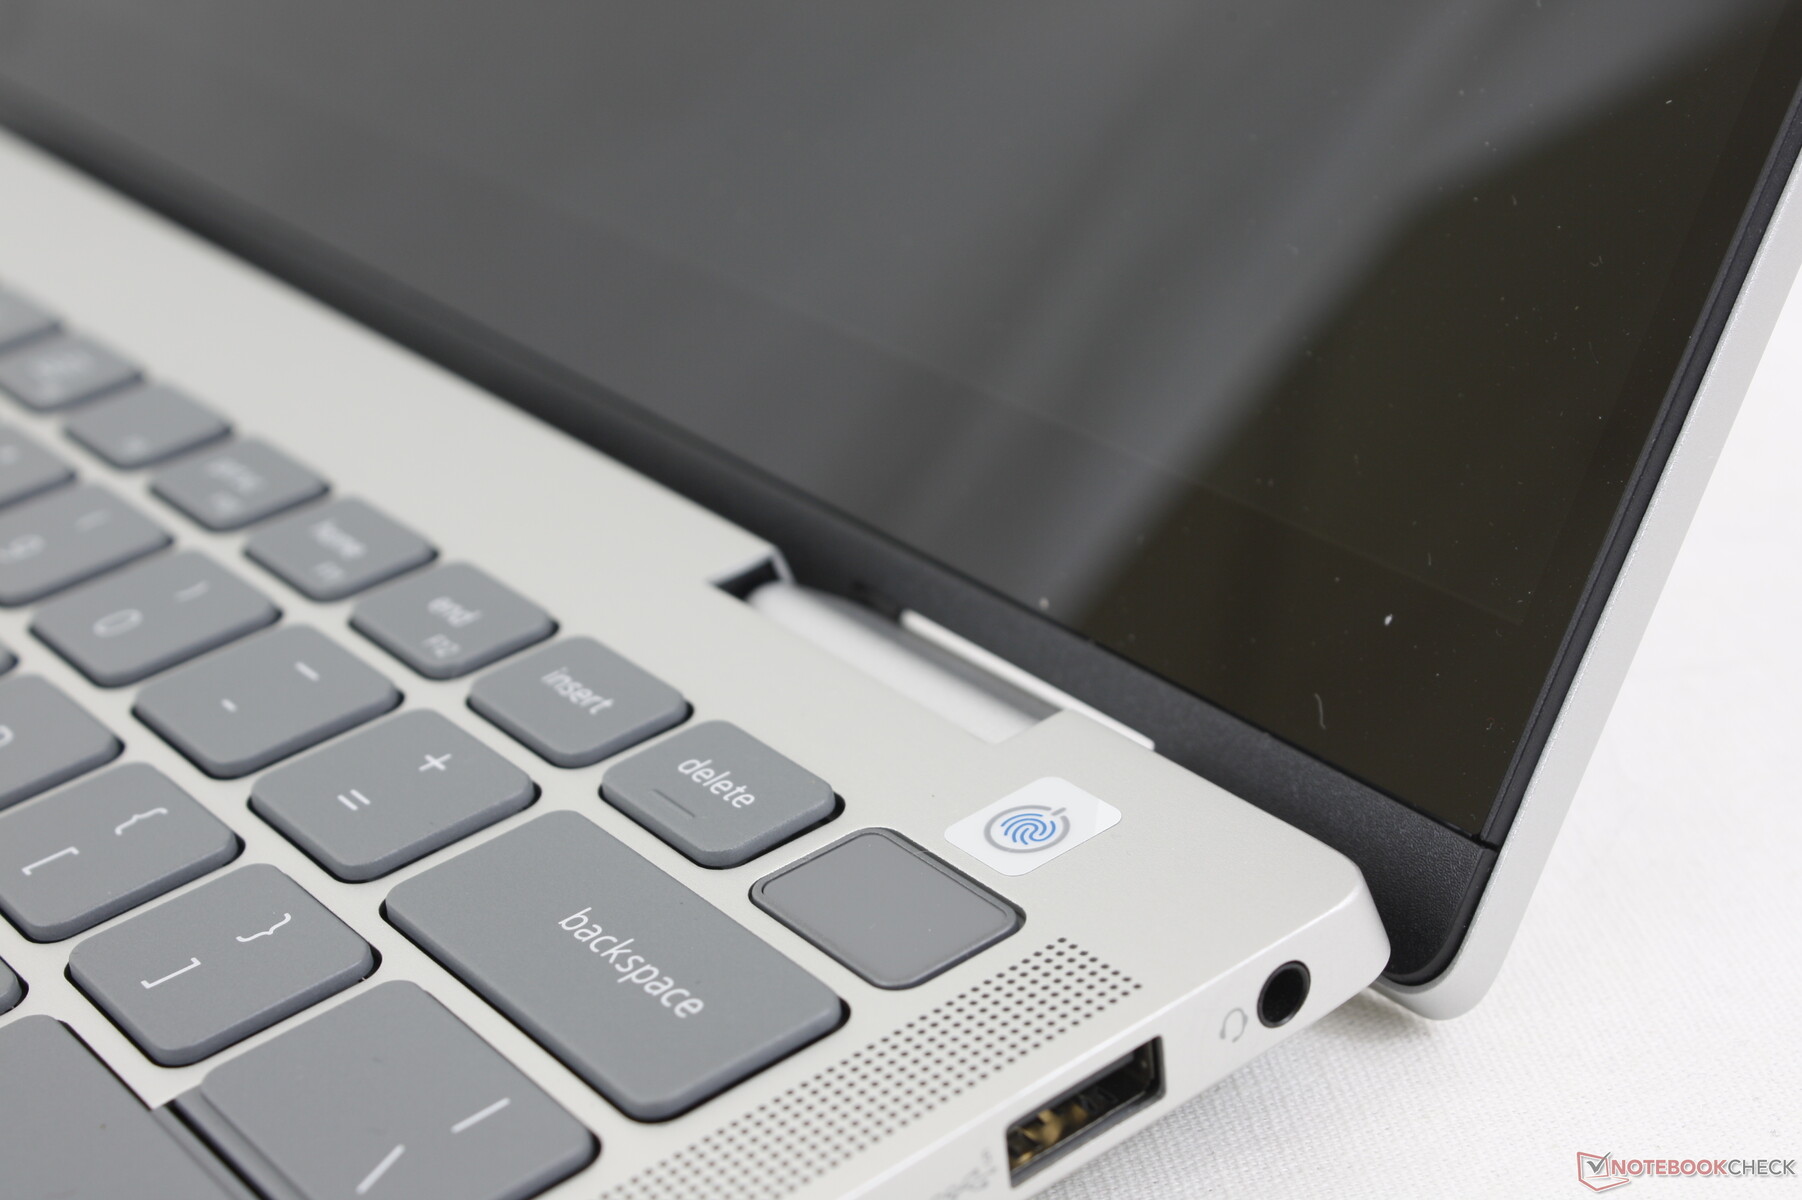
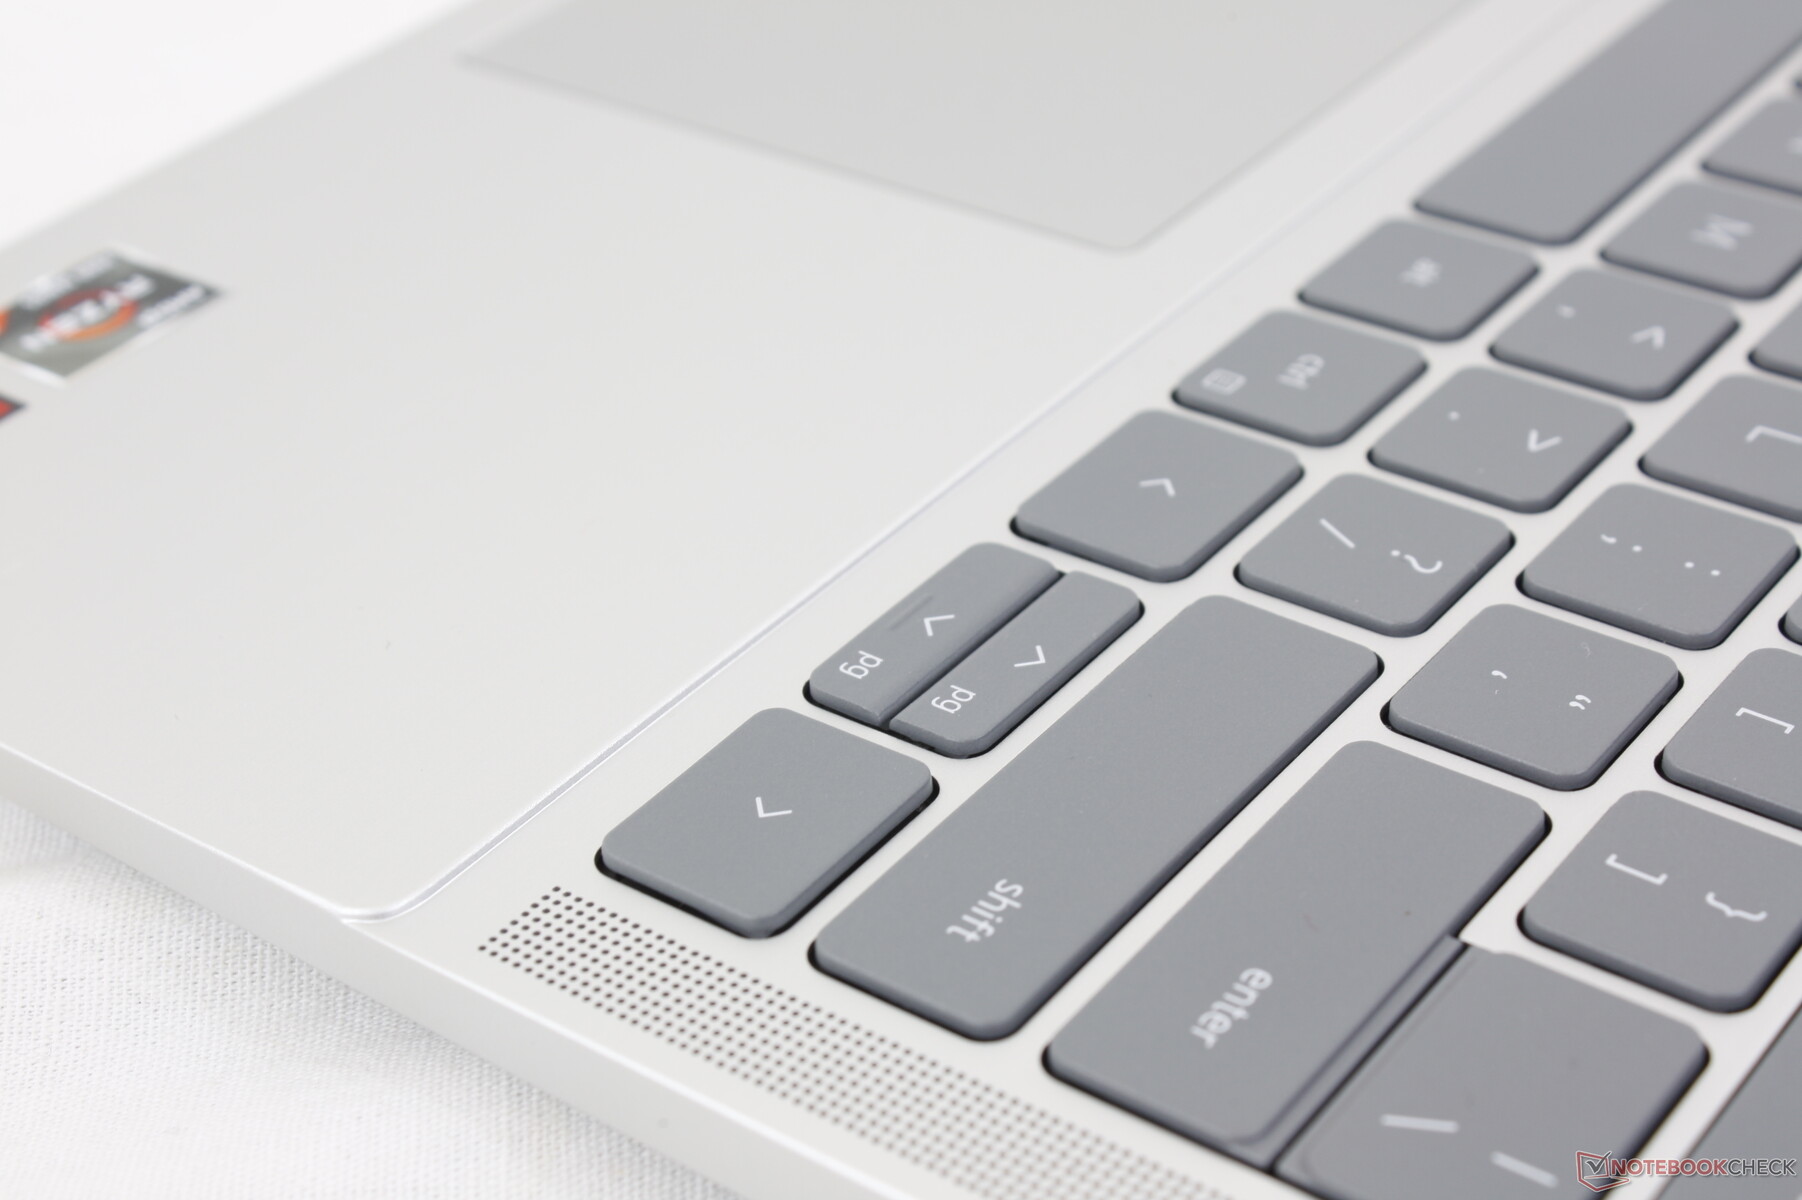
Även om den ser identisk ut med 2022 Inspiron 14 7620 2-i-1 vid första anblicken, märks flera skillnader vid en närmare granskning. För det första har de mycket omtalade handledsstöden i Mylar tagits bort till förmån för mer ABS-plast. Det speciella materialet var tänkt att skydda handledsstöden och klickplattan från fett, men det visade sig i slutändan vara onödigt på en budgetlaptop som denna. För det andra har gångjärnen designats om till att vara något större och plattare, vilket förhoppningsvis kommer att förbättra livslängden. Och slutligen har högtalarna flyttats från chassits främre hörn till tangentbordets kanter, så att de nu är vända uppåt direkt mot användaren.
Chassiets styvhet är ungefär densamma som tidigare på grund av deras liknande skelett och val av plastmaterial.
Mått och vikt är nästan identiska med förra årets modell trots alla yttre och inre förändringar. Detta är inte nödvändigtvis en dålig sak eftersom modellen fortfarande är jämförbar med alternativ som Pavilion x360 14 eller IdeaPad Flex 14 7i, men Dell kunde ha gått den extra milen för att göra Inspiron ännu mer bärbar och lukrativ för potentiella köpare.
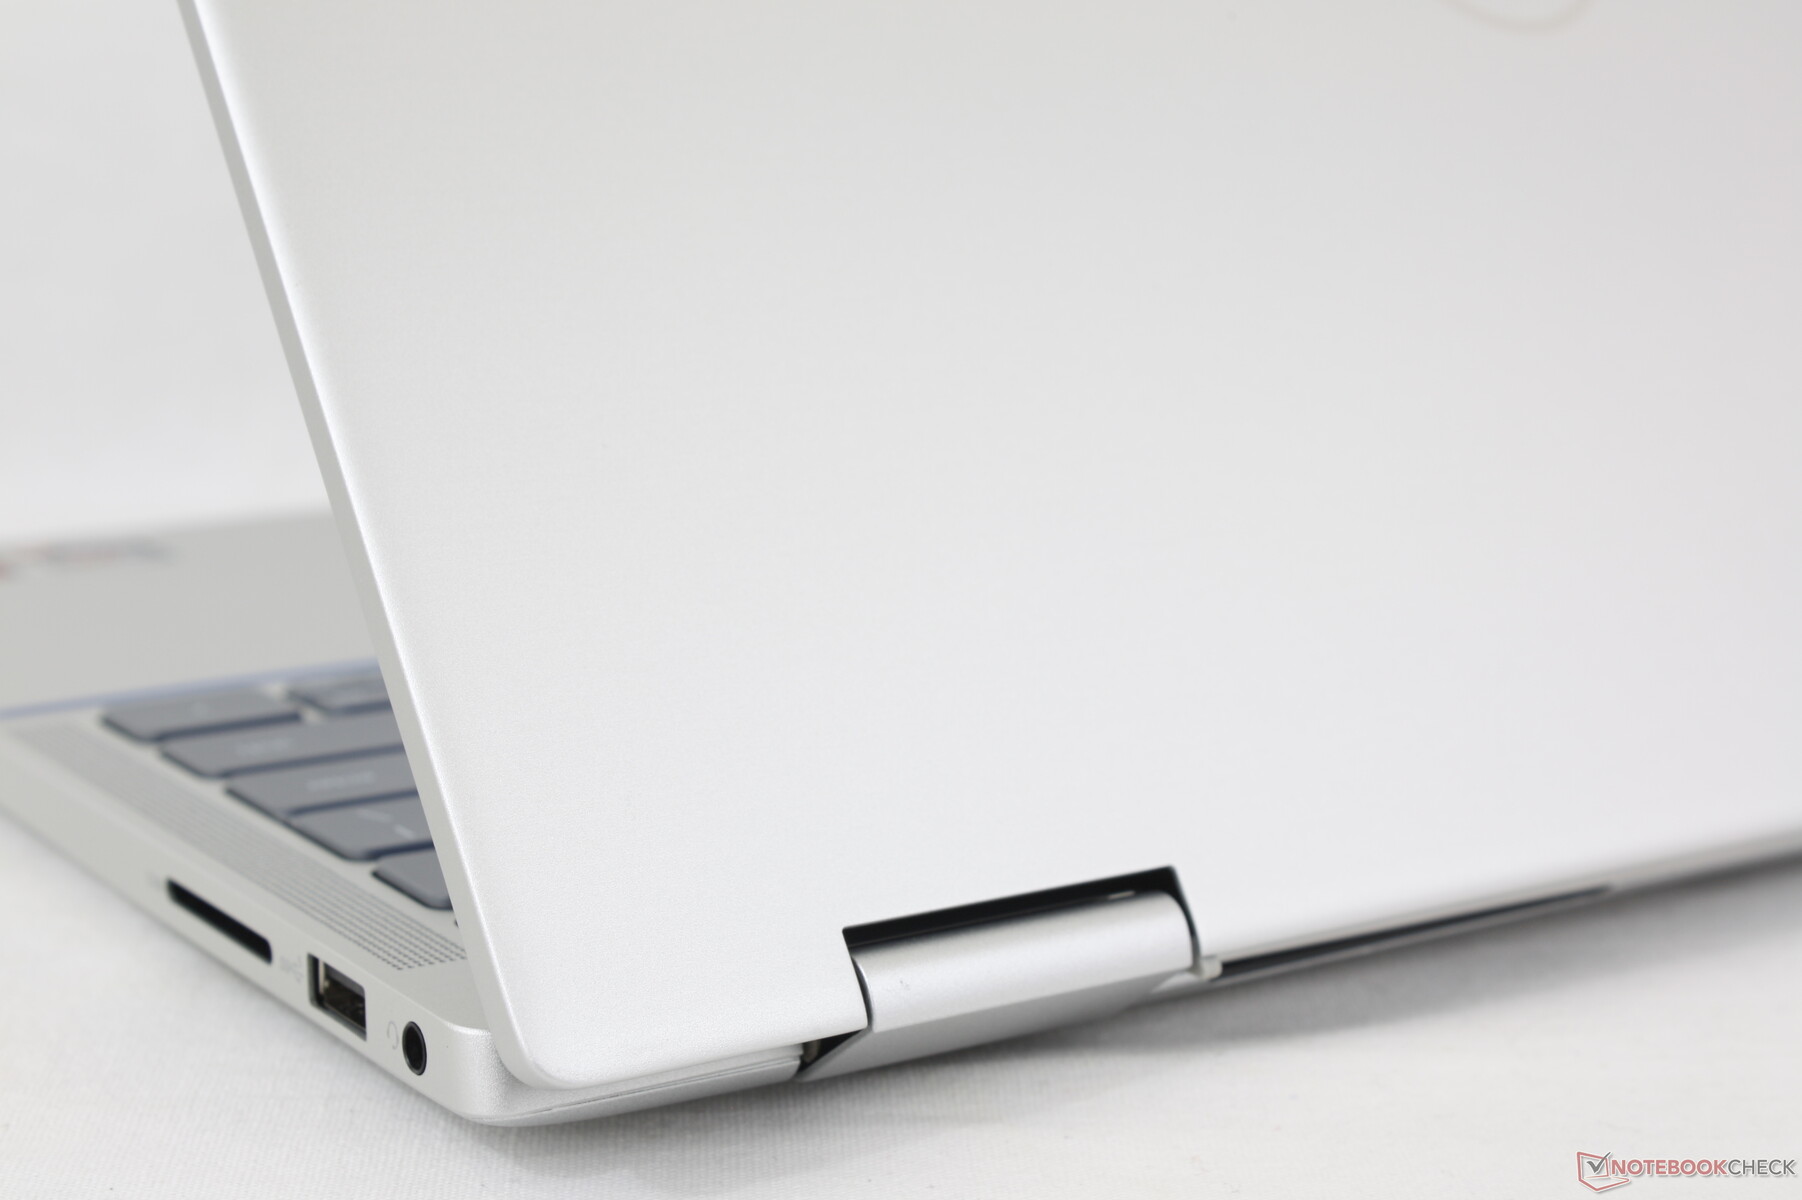
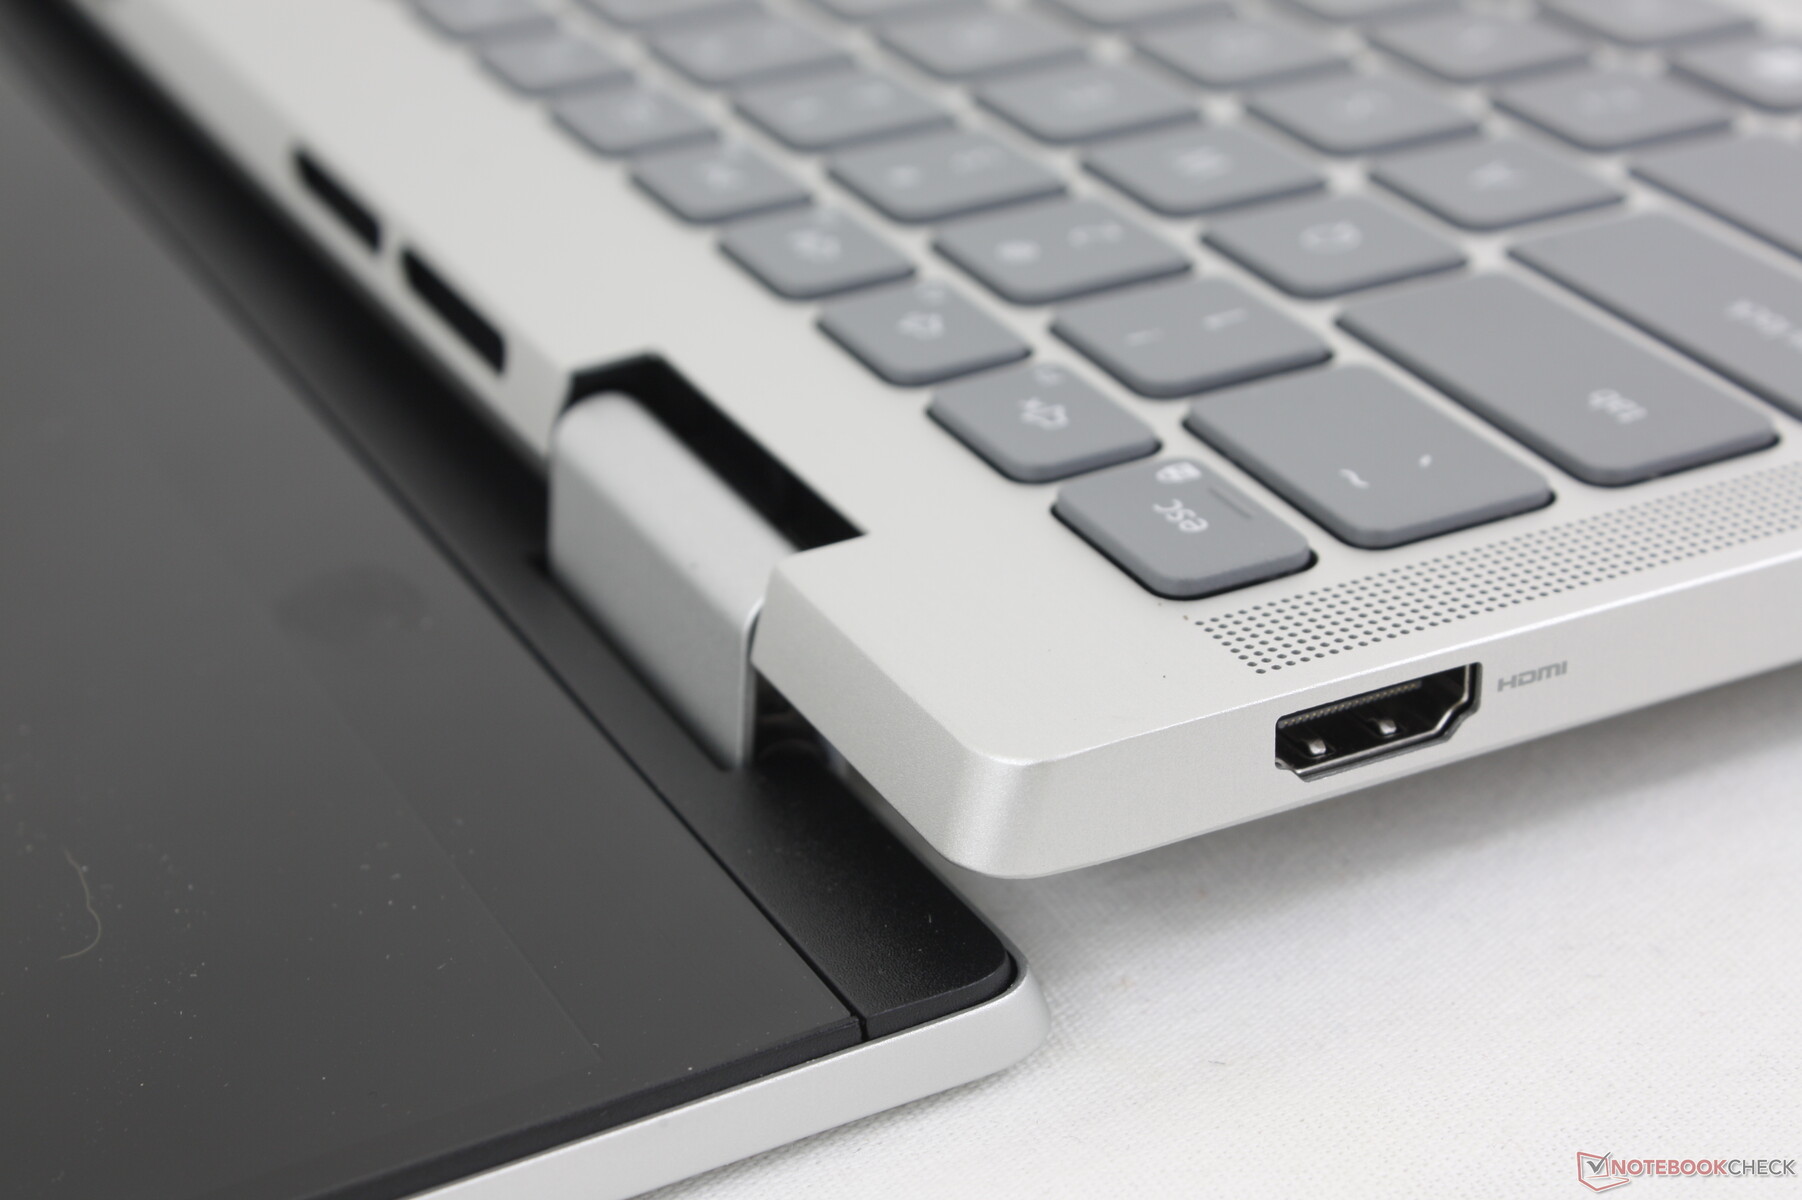
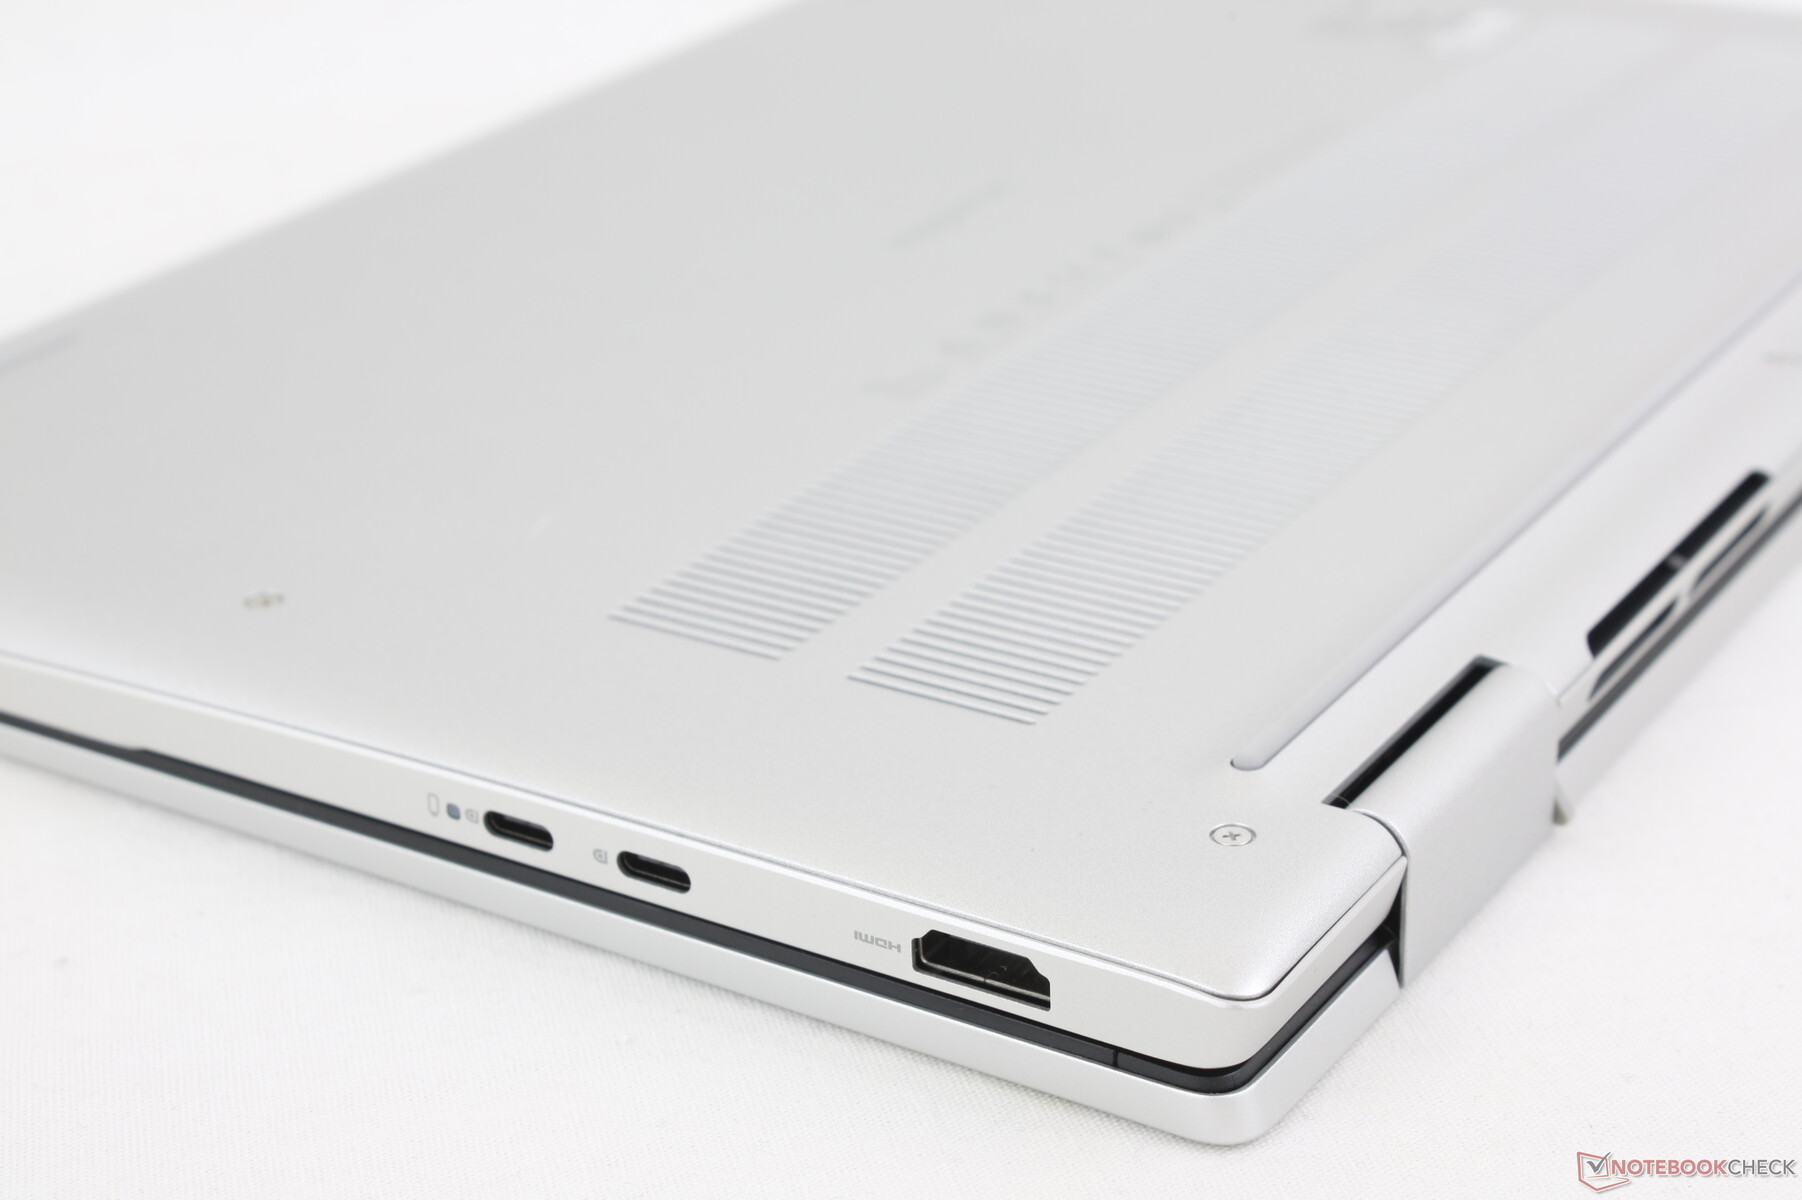
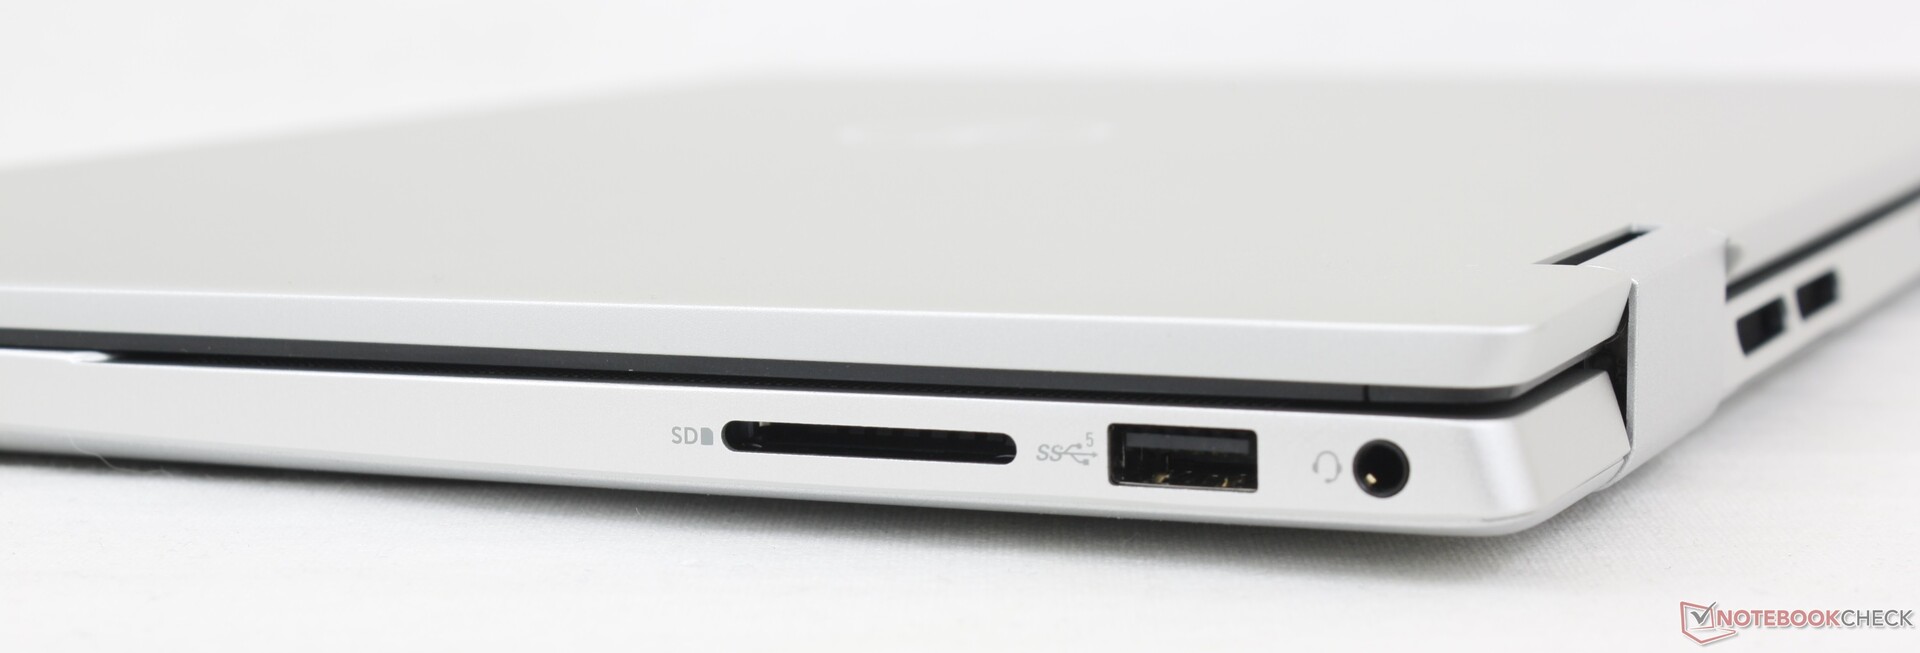
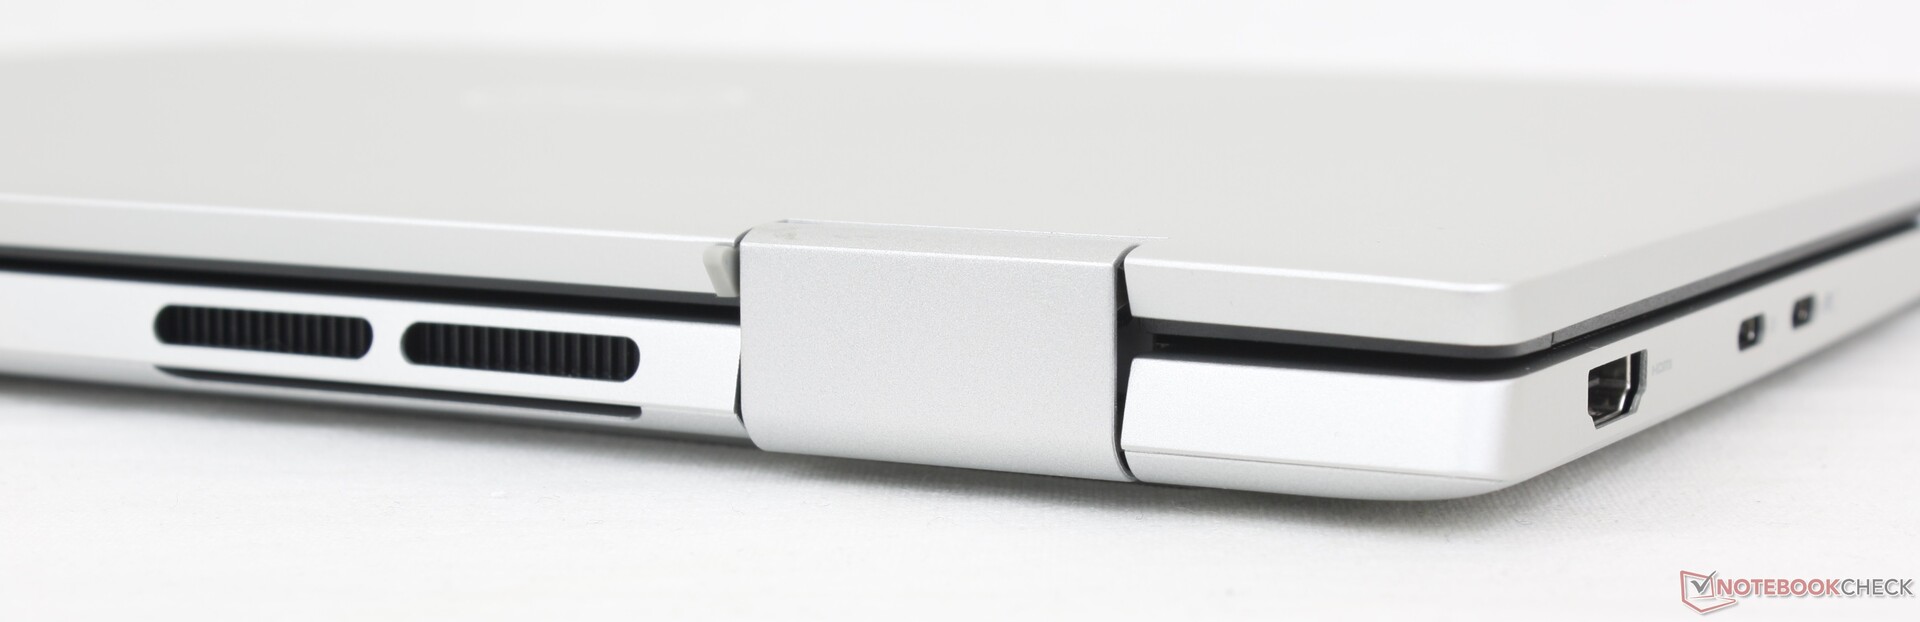
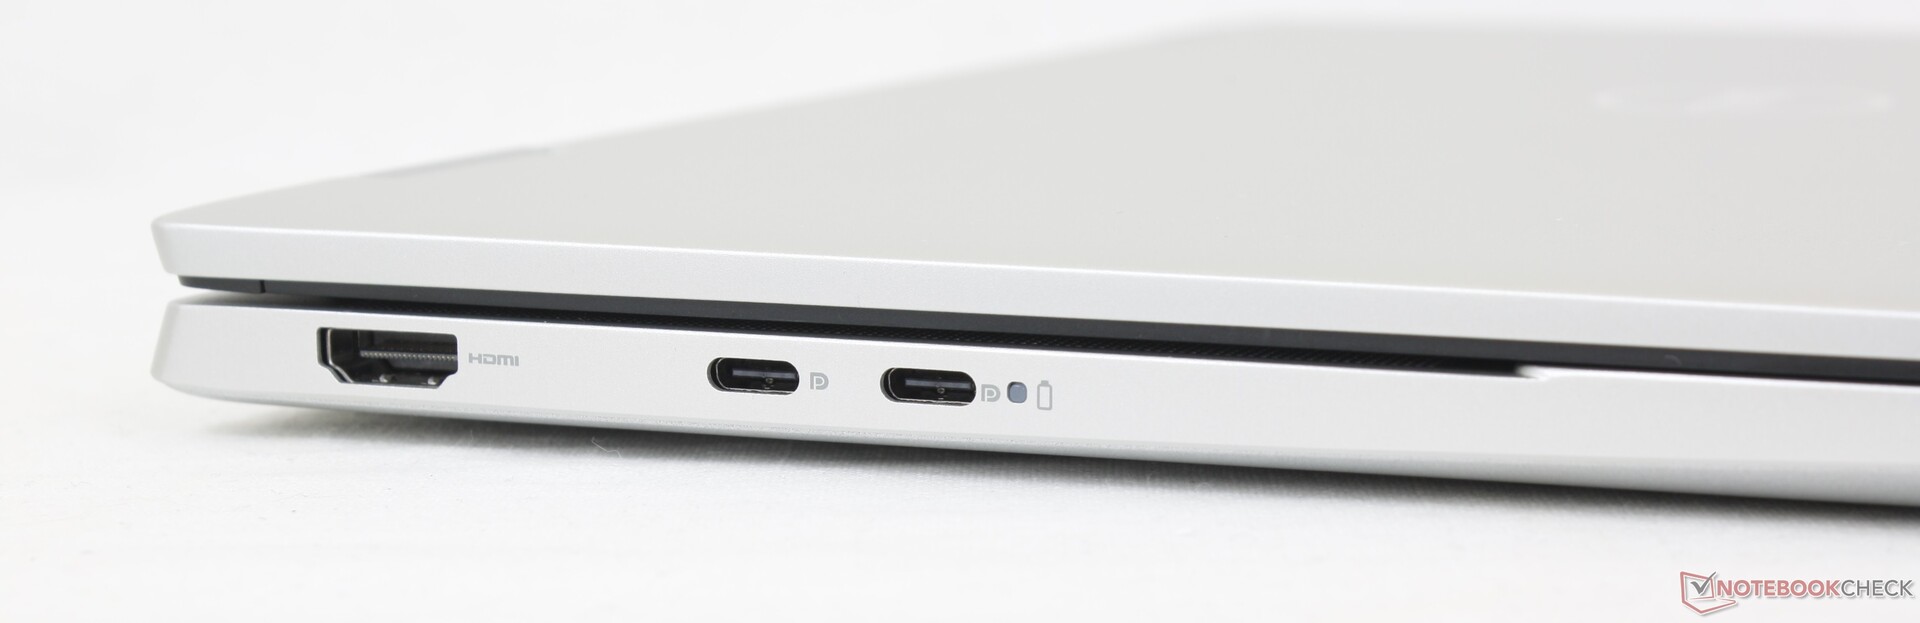
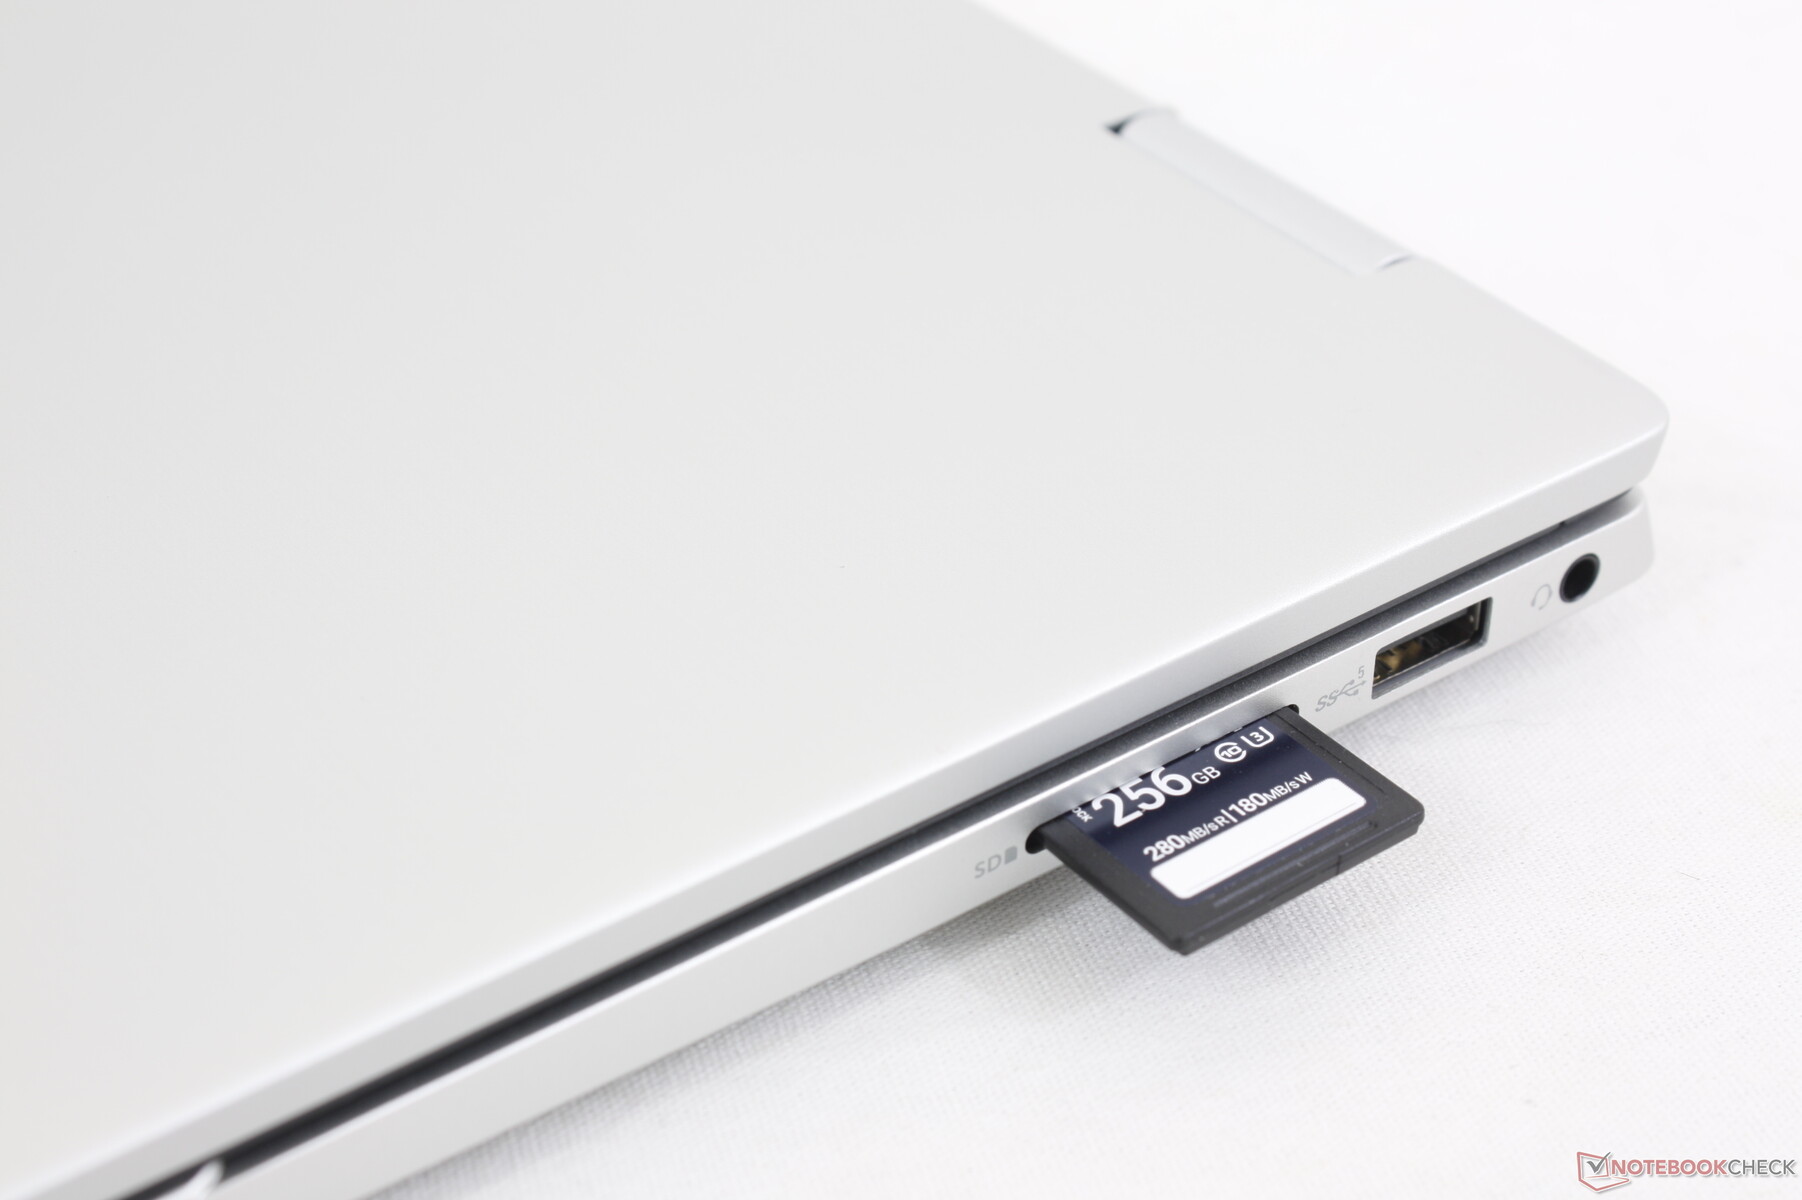
Anslutningsmöjligheter
Portalternativen är jämförbara med IdeaPad Flex 5i 14 och Pavilion x360 14 med bara små skillnader i antalet USB-portar. Tänk på att USB-C-portarna på vår AMD-konfiguration saknar Thunderbolt-stöd till skillnad från den Intel-drivna Inspiron 7430 2-in-1.
SD-kortläsare
Överföringshastigheten från den integrerade SD-kortläsaren har förbättrats något från ~20 MB/s på förra årets Inspiron 7420 till ~35 MB/s på vår senaste modell. Trots detta är SD-läsarna på konkurrerande modeller som IdeaPad Flex 7i eller Pavilion x360 14 är mycket snabbare, över 2x.
| SD Card Reader | |
| average JPG Copy Test (av. of 3 runs) | |
| Lenovo IdeaPad Flex 7i 14IAU7 (Toshiba Exceria Pro SDXC 64 GB UHS-II) | |
| HP Pavilion x360 14-dy0157ng (Toshiba Exceria Pro M501 microSDXC 64GB) | |
| LG Gram 14T90P (AV Pro V60) | |
| Dell Inspiron 14 7435 2-in-1 (PNY EliteX-Pro60 V60 256 GB) | |
| Dell Inspiron 14 7420 2-in-1 (Toshiba Exceria Pro SDXC 64 GB UHS-II) | |
| maximum AS SSD Seq Read Test (1GB) | |
| Lenovo IdeaPad Flex 7i 14IAU7 (Toshiba Exceria Pro SDXC 64 GB UHS-II) | |
| LG Gram 14T90P (AV Pro V60) | |
| HP Pavilion x360 14-dy0157ng (Toshiba Exceria Pro M501 microSDXC 64GB) | |
| Dell Inspiron 14 7435 2-in-1 (PNY EliteX-Pro60 V60 256 GB) | |
| Dell Inspiron 14 7420 2-in-1 (Toshiba Exceria Pro SDXC 64 GB UHS-II) | |
Kommunikation
Vi är förvånade över att se Wi-Fi6E-stöd i vår baskonfiguration. Överföringshastigheterna är stabila när de kopplas till vårt Asus AXE11000 6 GHz-nätverk, men mottagningshastigheterna är definitivt långsammare än väntat med nästan hälften jämfört med bärbara datorer med Intel AX211.
| Networking | |
| iperf3 transmit AX12 | |
| HP Pavilion x360 14-dy0157ng | |
| iperf3 receive AX12 | |
| HP Pavilion x360 14-dy0157ng | |
| iperf3 transmit AXE11000 | |
| Acer Aspire 5 Spin 14 | |
| Dell Inspiron 14 7435 2-in-1 | |
| Lenovo IdeaPad Flex 7i 14IAU7 | |
| LG Gram 14T90P | |
| iperf3 receive AXE11000 | |
| Acer Aspire 5 Spin 14 | |
| LG Gram 14T90P | |
| Lenovo IdeaPad Flex 7i 14IAU7 | |
| Dell Inspiron 14 7435 2-in-1 | |
| iperf3 transmit AXE11000 6GHz | |
| Dell Inspiron 14 7435 2-in-1 | |
| Acer Aspire 5 Spin 14 | |
| Lenovo IdeaPad Flex 7i 14IAU7 | |
| Dell Inspiron 14 7420 2-in-1 | |
| iperf3 receive AXE11000 6GHz | |
| Acer Aspire 5 Spin 14 | |
| Dell Inspiron 14 7420 2-in-1 | |
| Lenovo IdeaPad Flex 7i 14IAU7 | |
| Dell Inspiron 14 7435 2-in-1 | |
Webbkamera
Dell har inte gjort några ändringar av webbkameran på 2 MP eller 1080p. En sekretesslucka ingår medan IR fortsätter att utelämnas för att spara på kostnader.


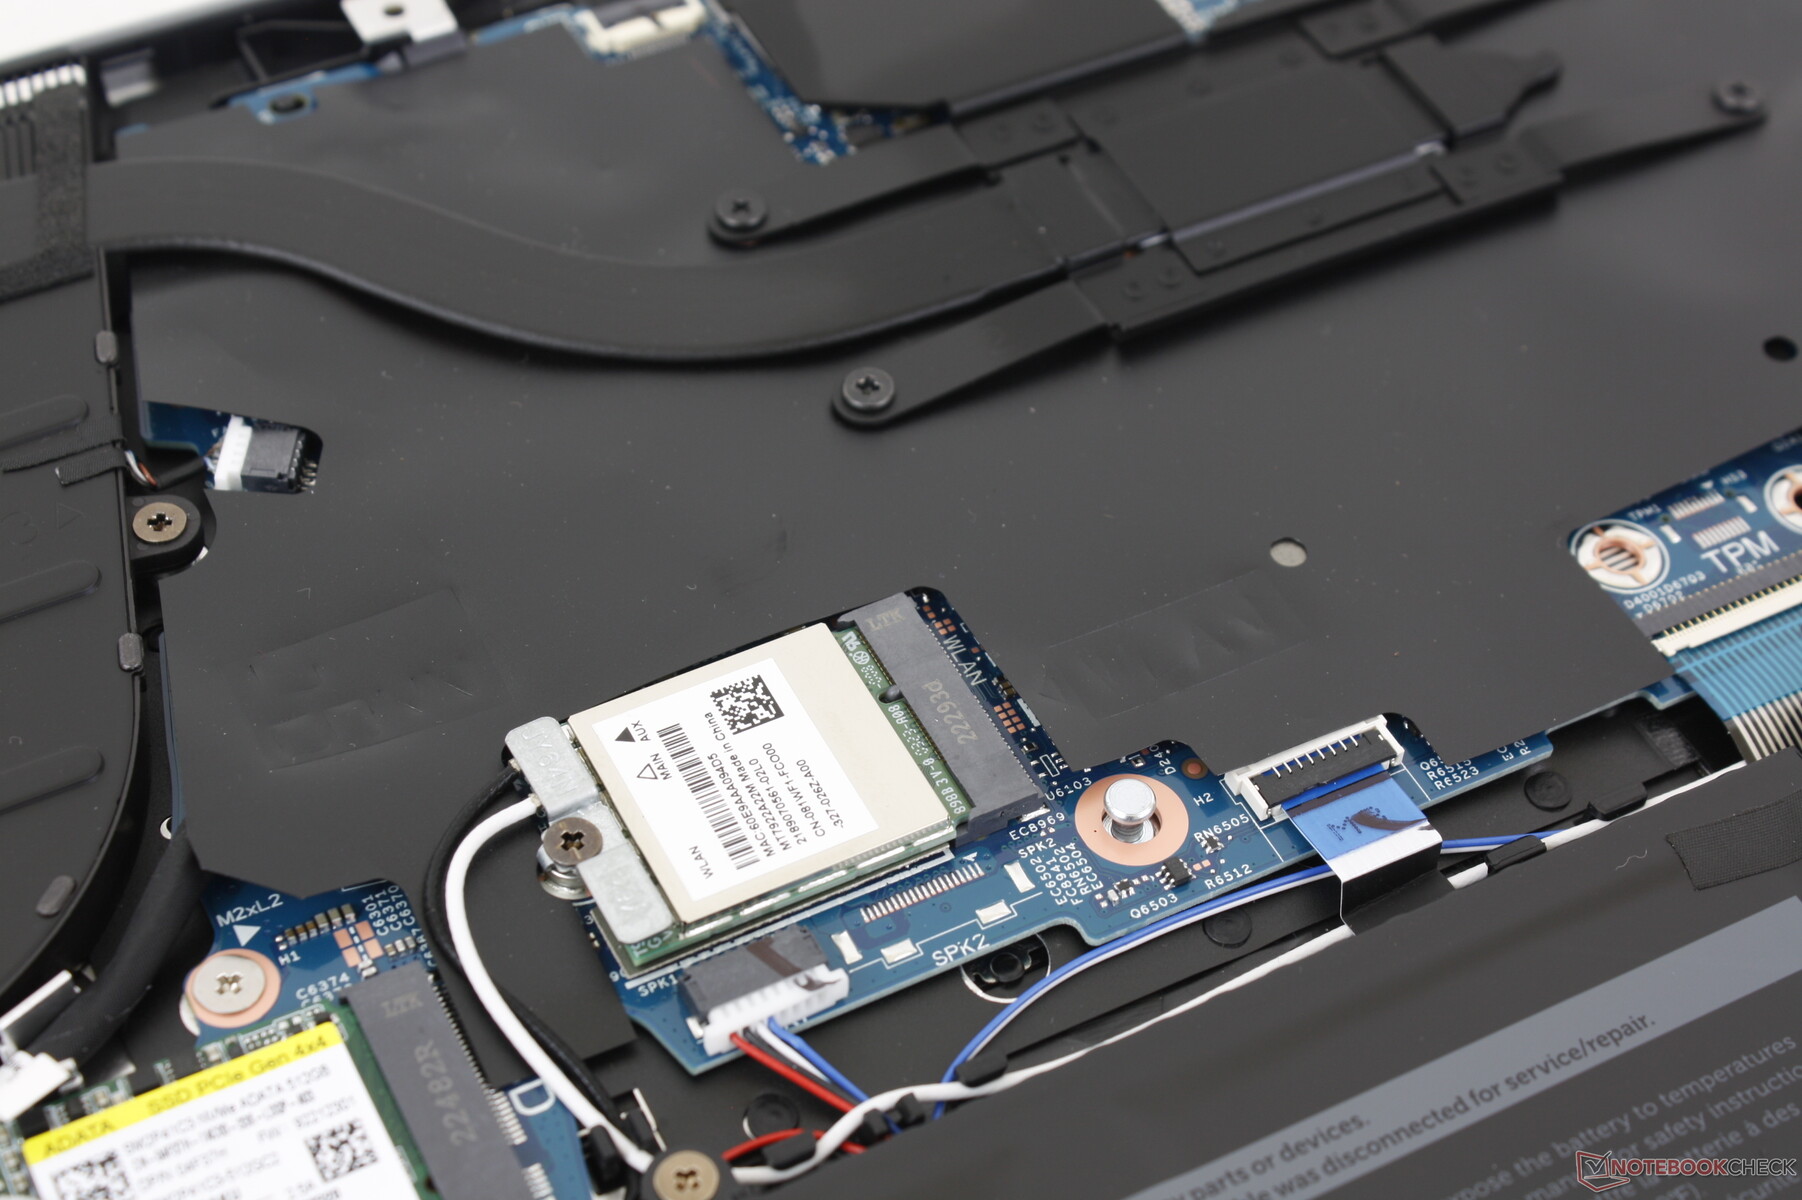
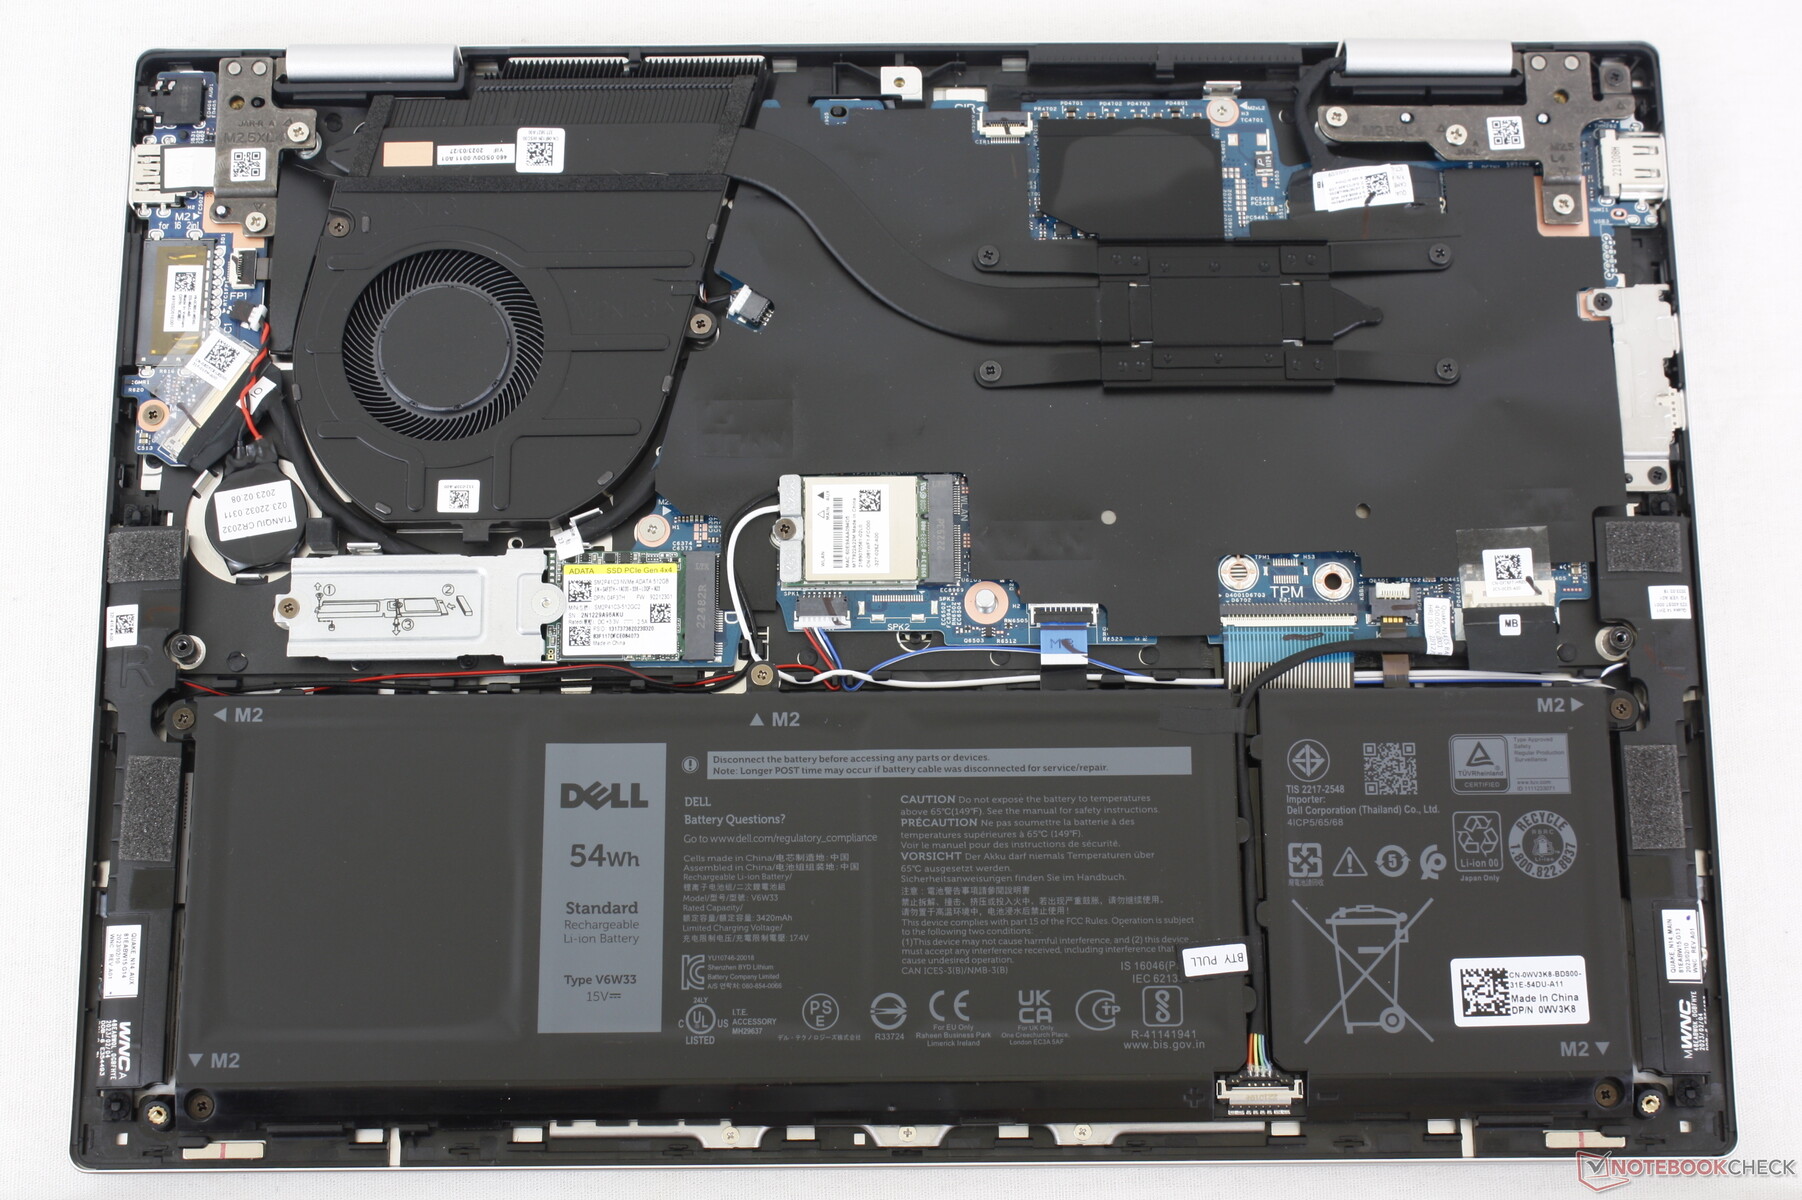
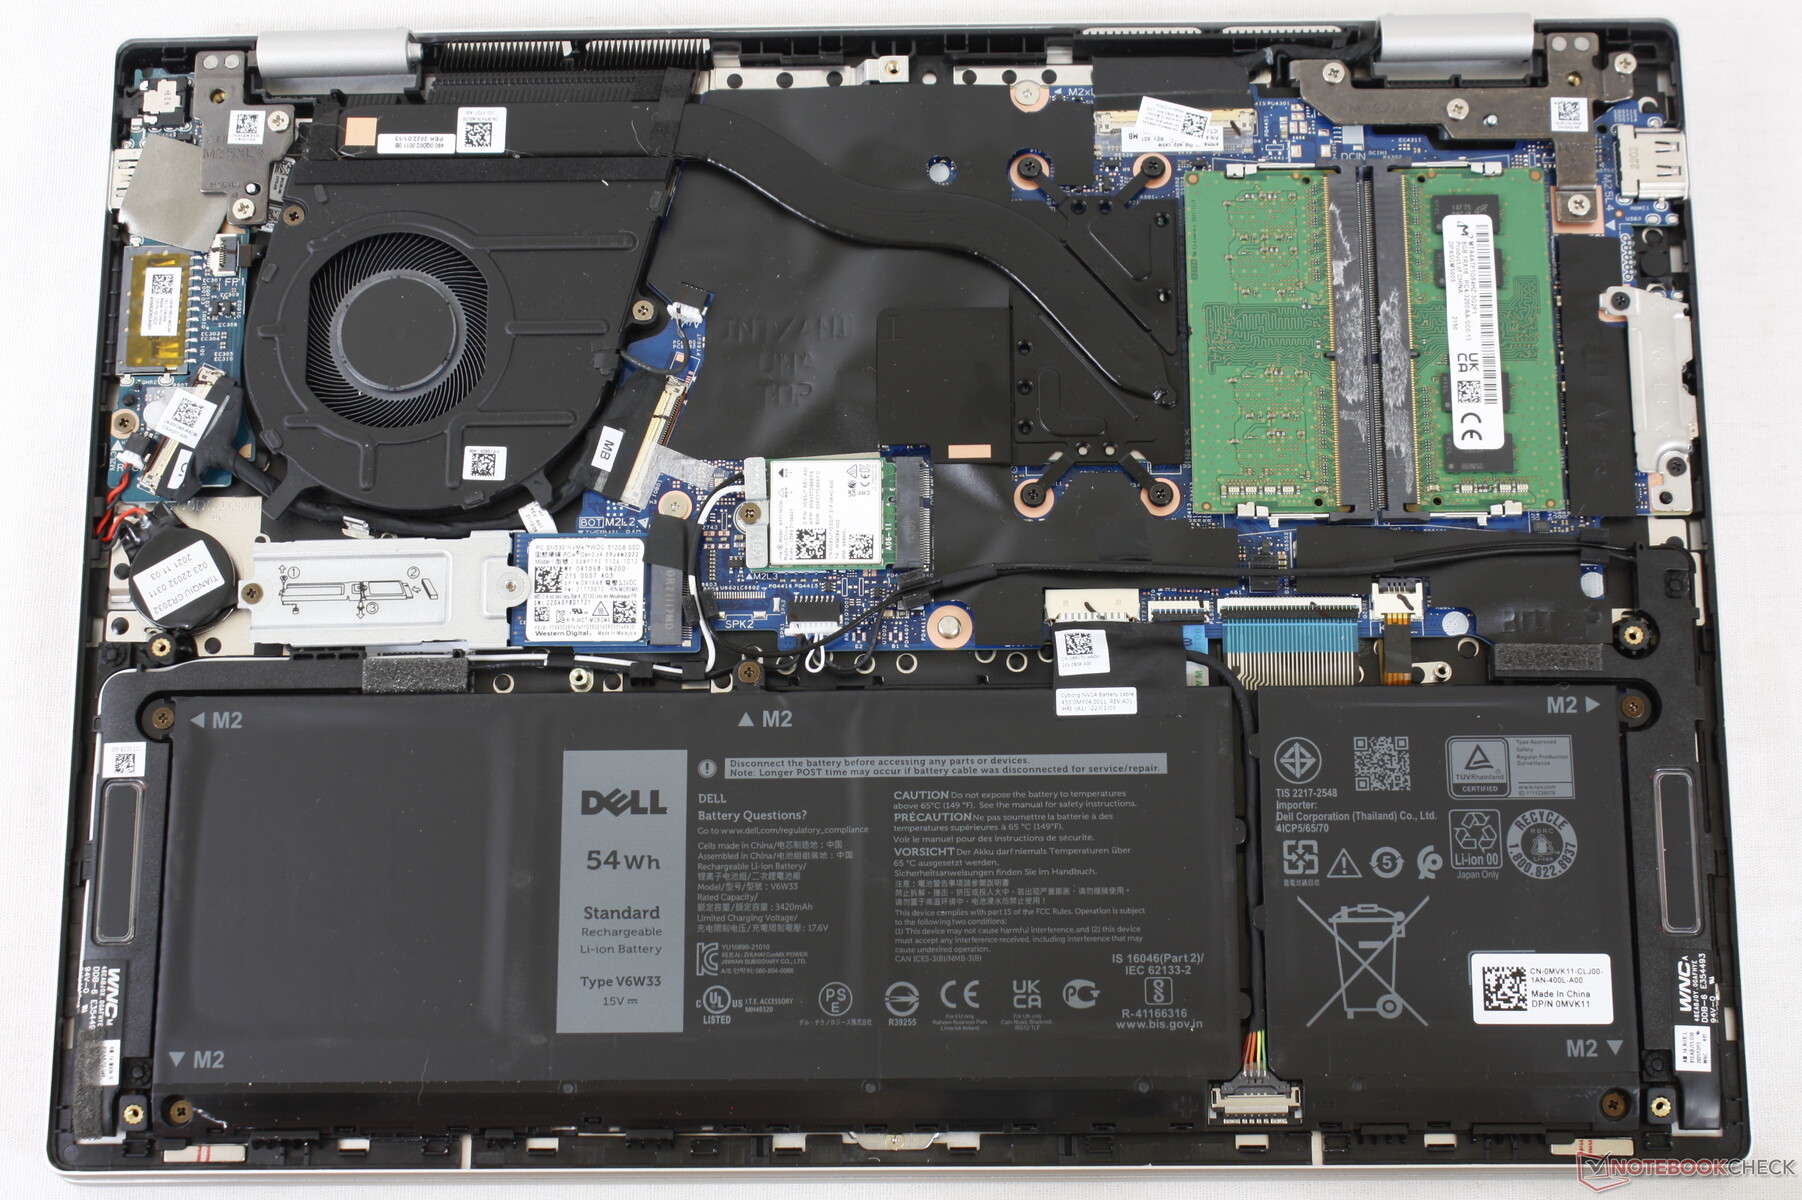
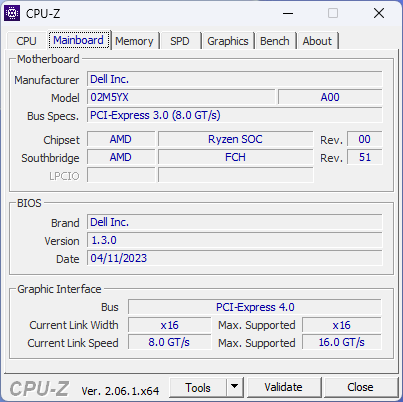
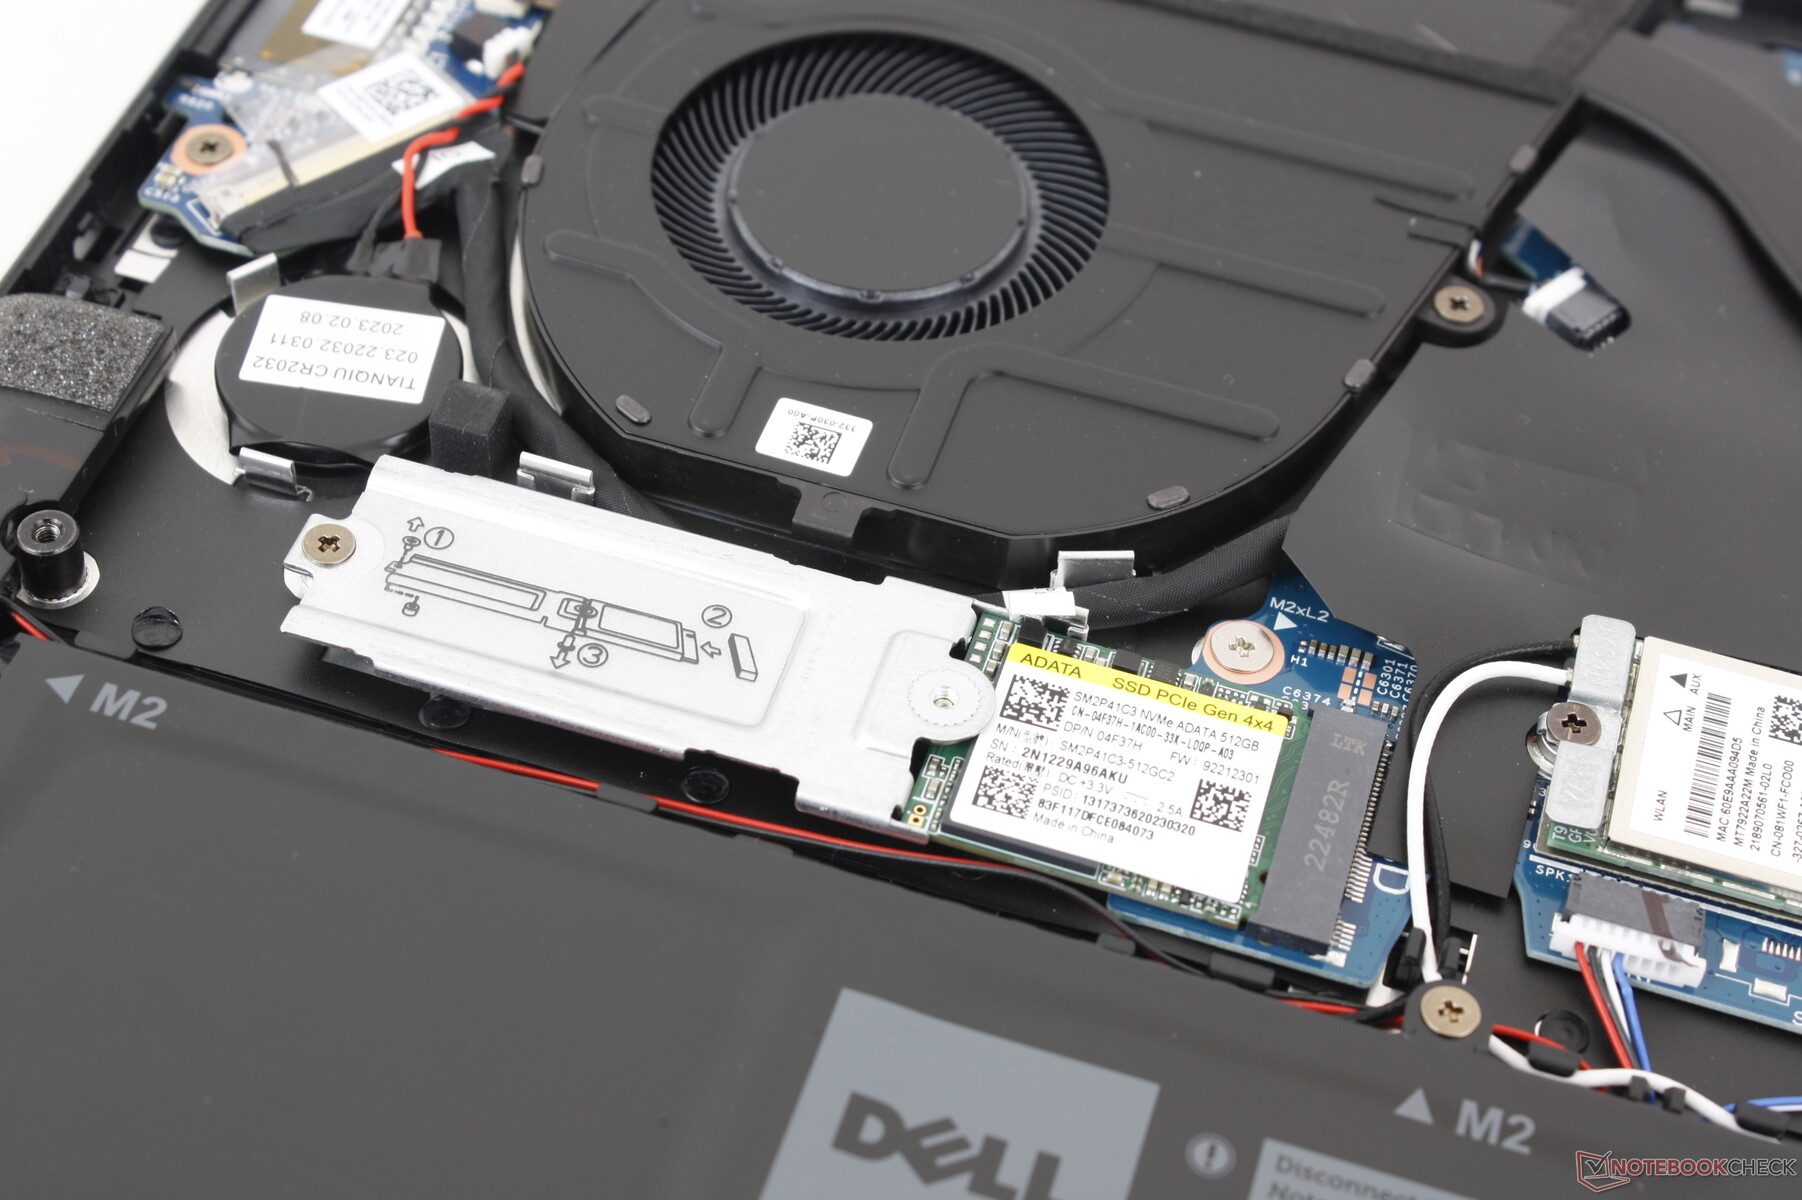
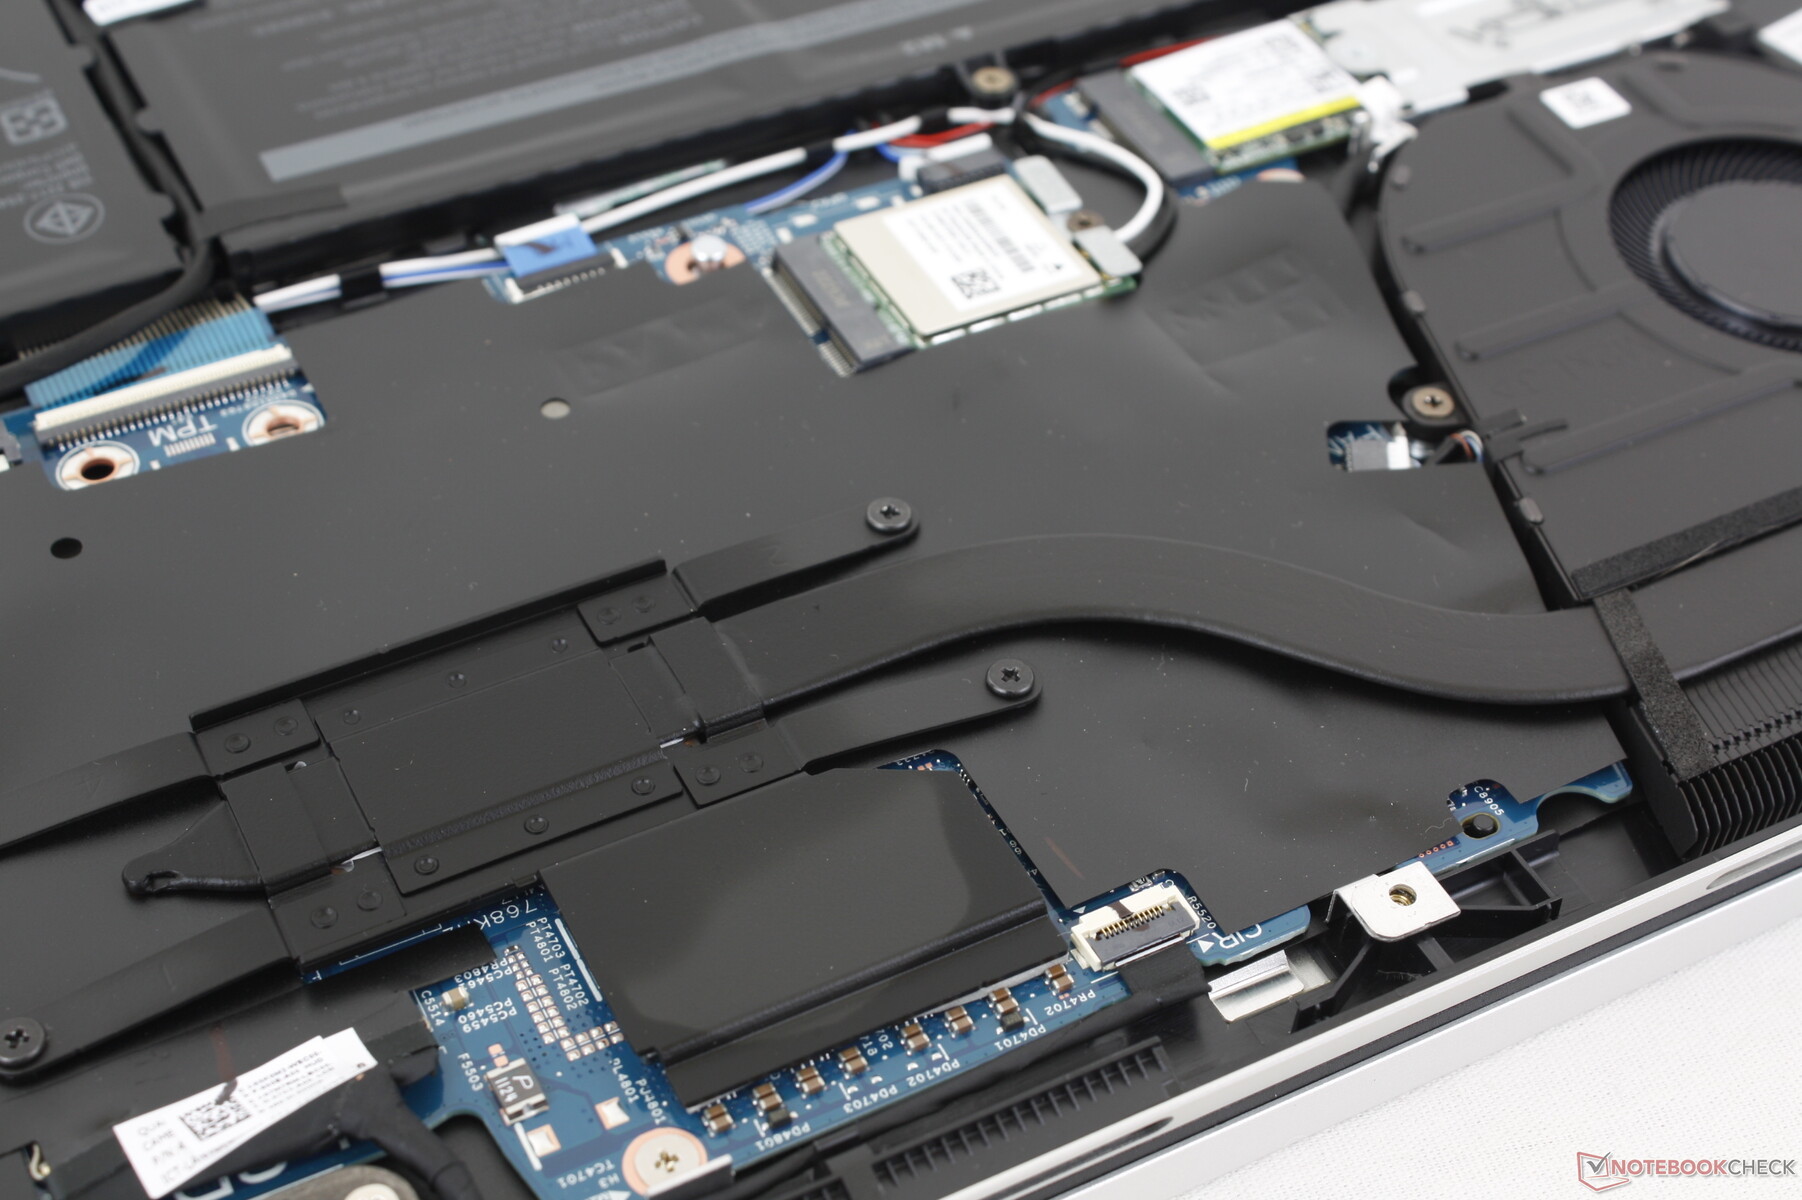
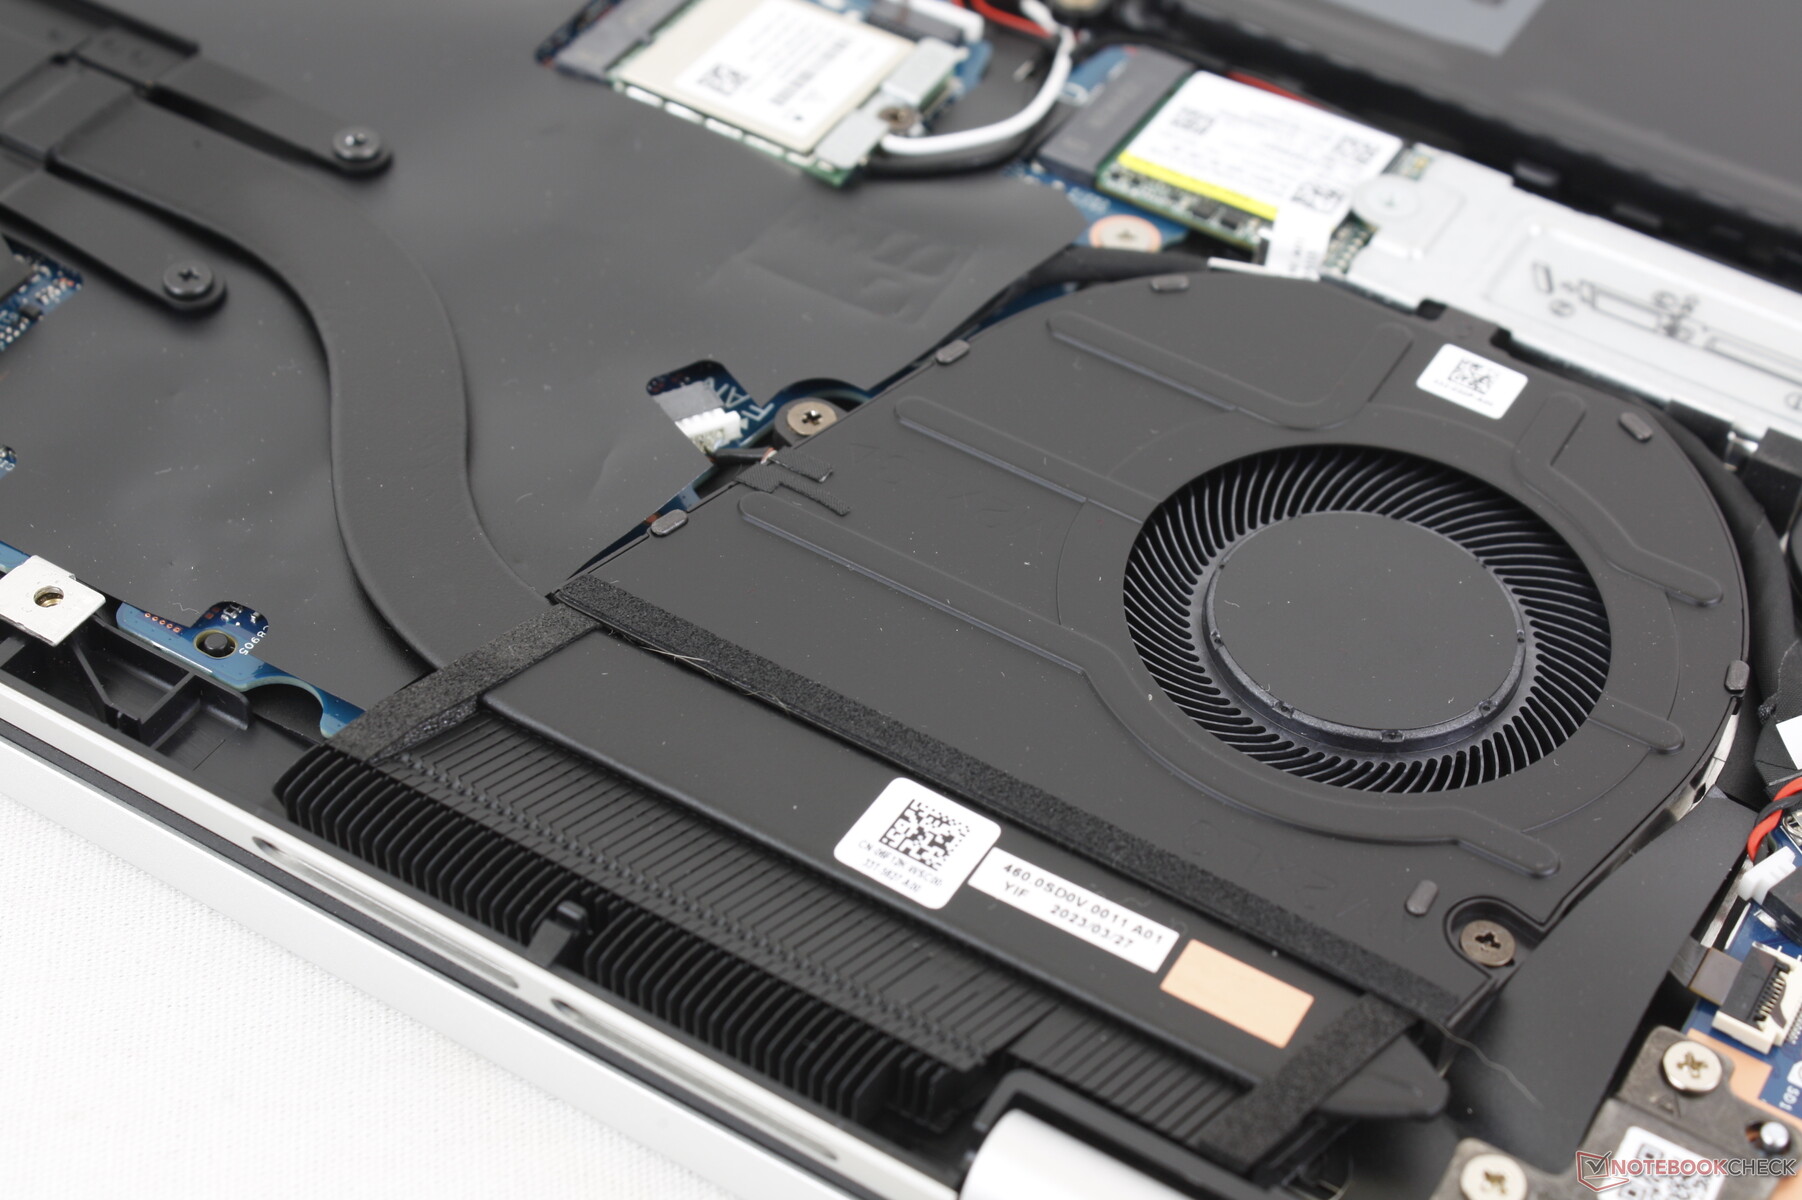
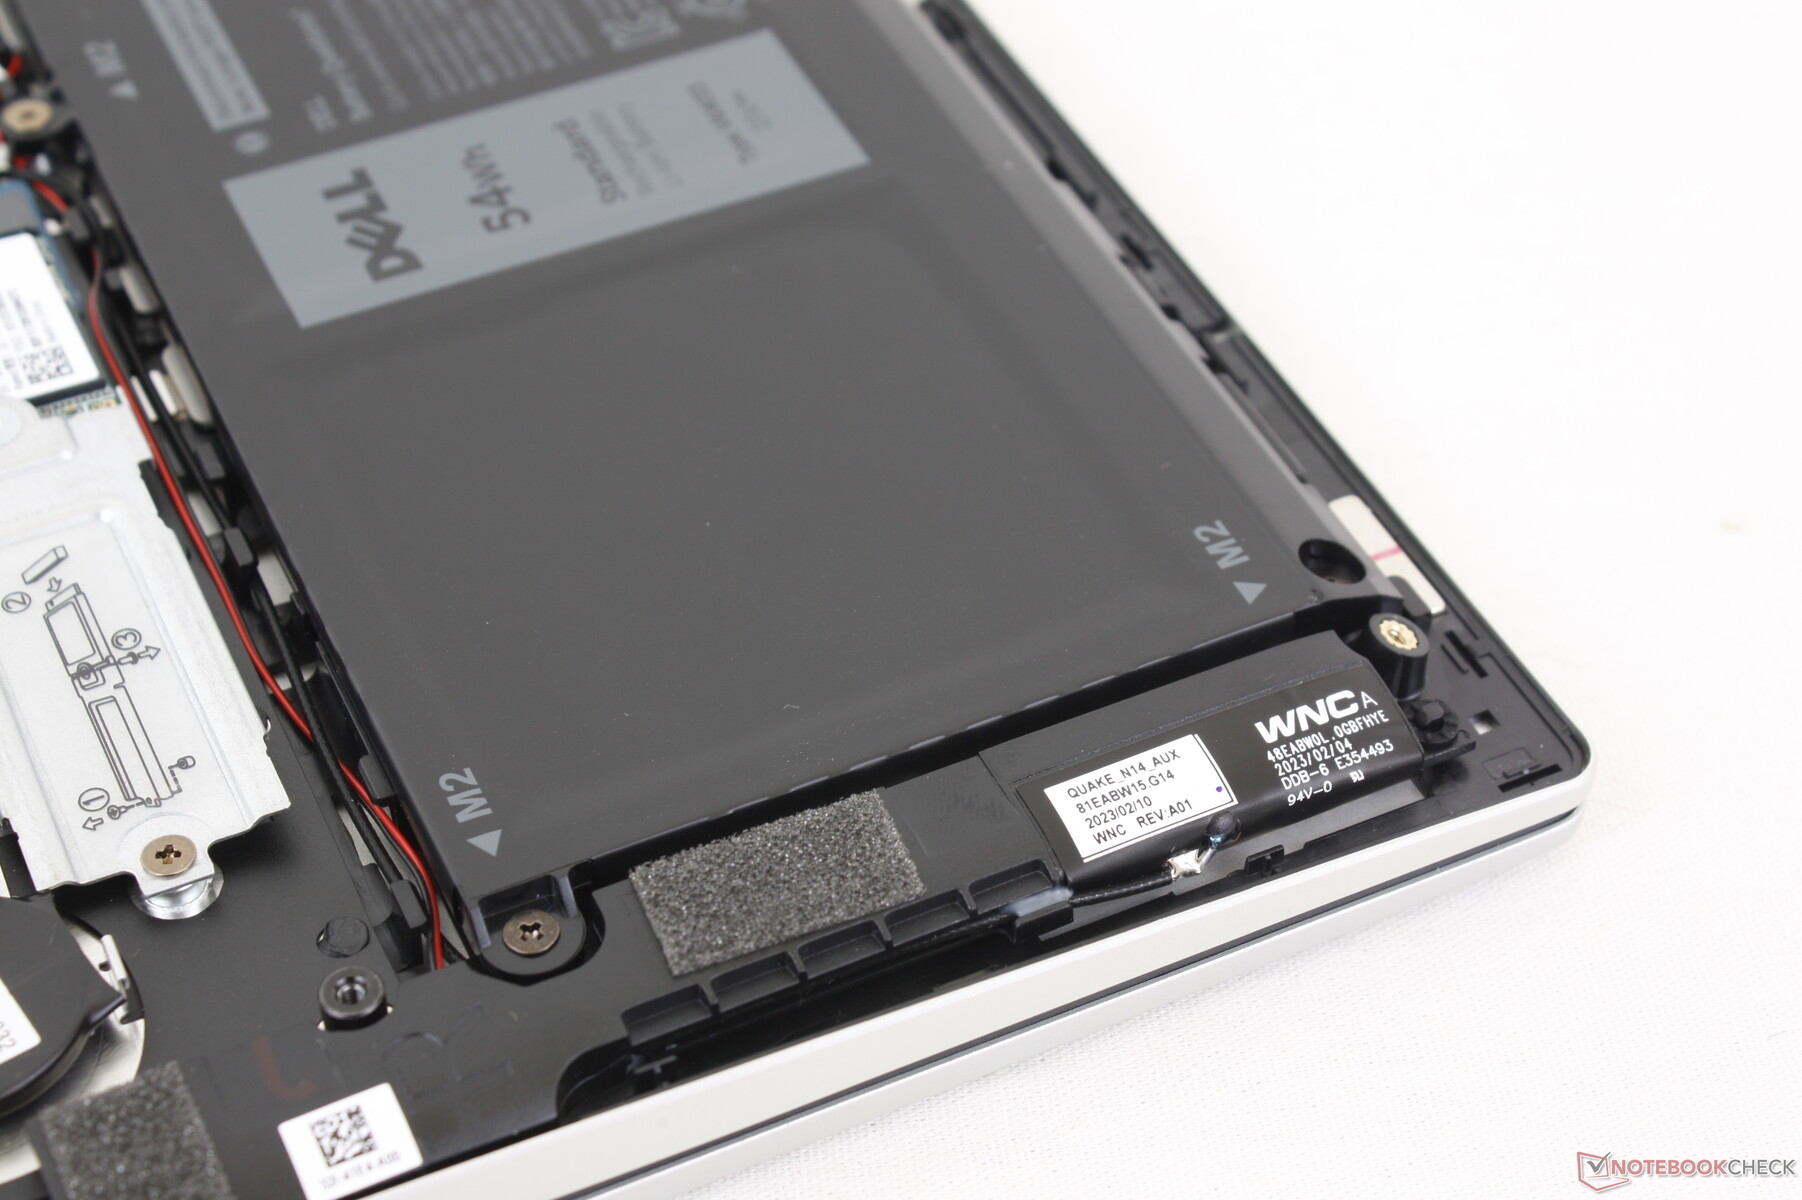
Underhåll
Dell har gjort en stor förändring på moderkortet jämfört med förra årets design: RAM-minnet är nu lödat istället för socklat, vilket framgår av bilderna nedan. Även om det är tråkigt att se, är lödd RAM vanligt på andra budgetkonvertibler som IdeaPad Flex 7 ellerAcer Aspire 5 Spin 14.
Tillbehör och garanti
Det finns inget extra i förpackningen förutom nätadapter och pappersarbete. Den vanliga ettåriga begränsade tillverkargarantin gäller.
Input Devices - No More Mylar
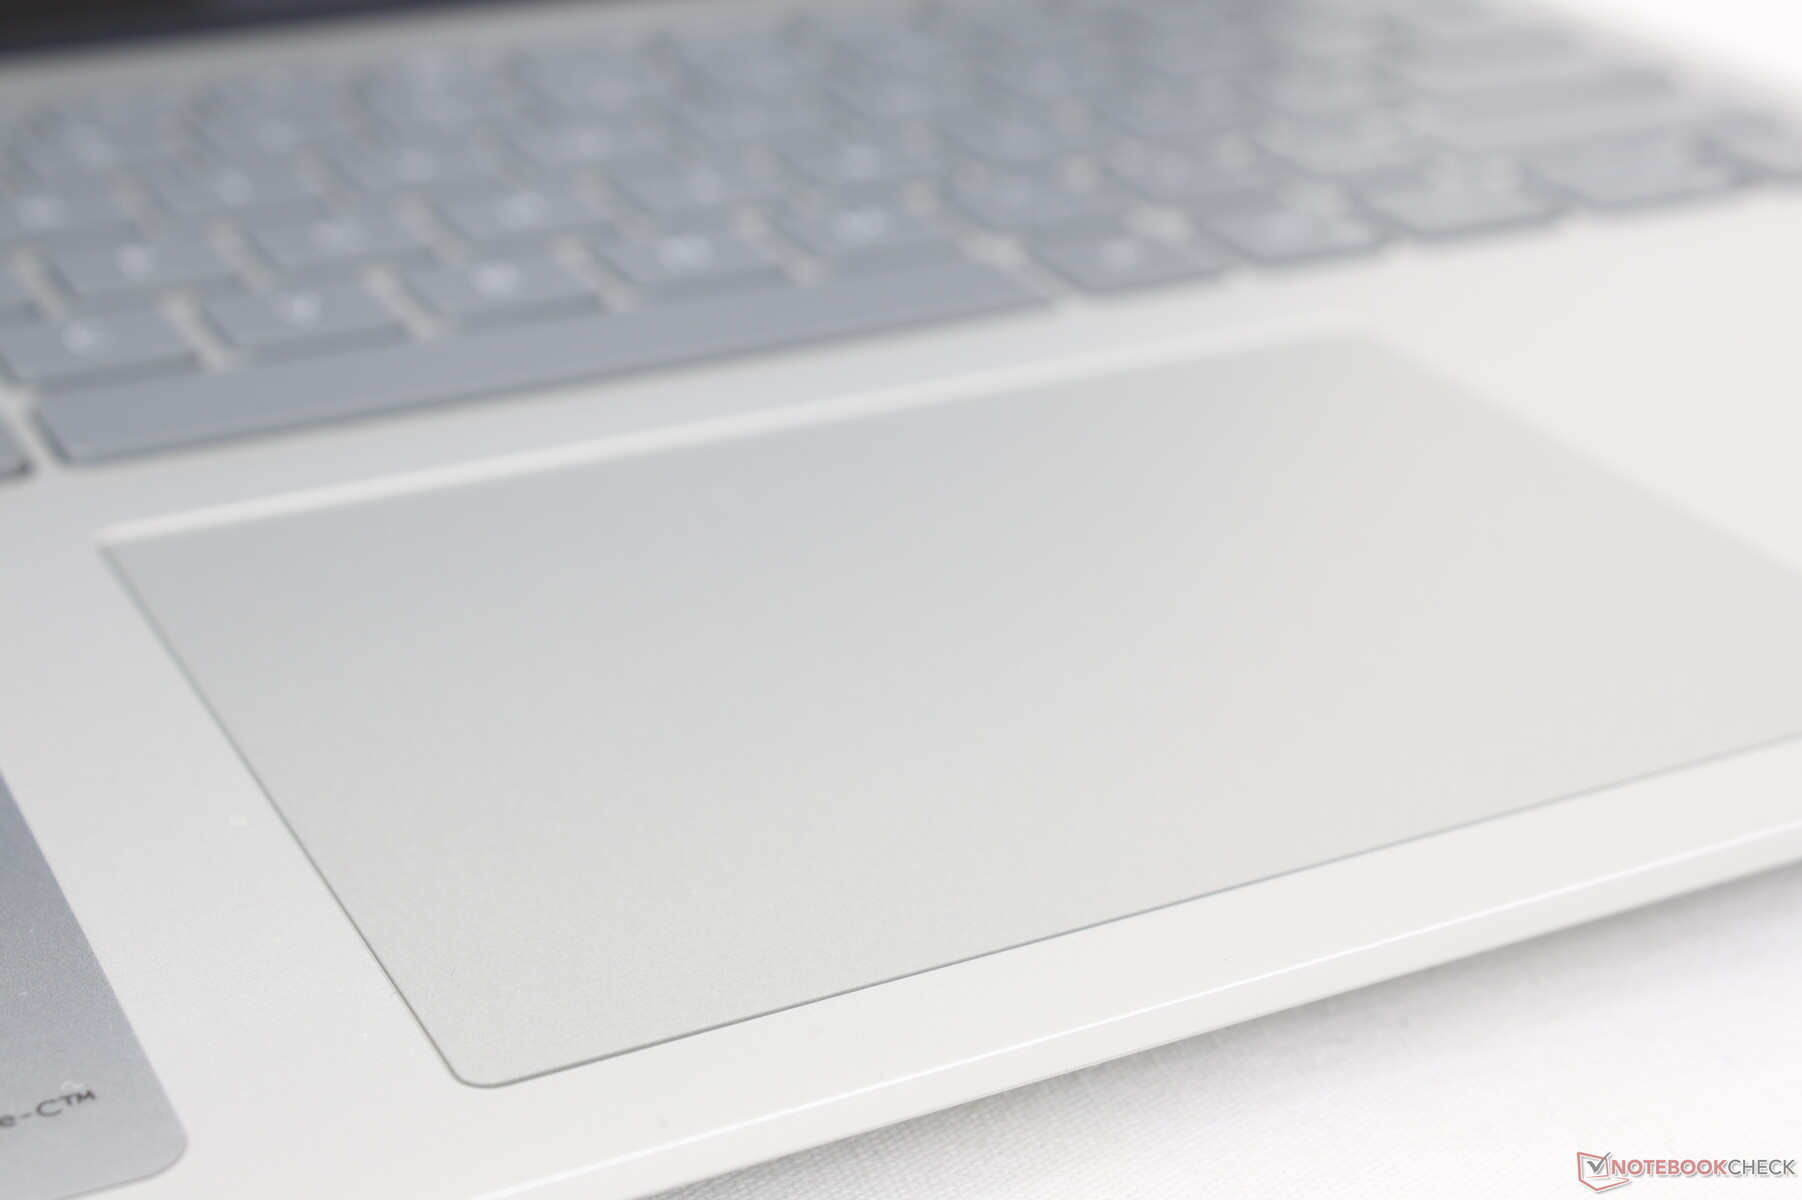
Tangentbord och pekplatta
Tangentbordsupplevelsen är densamma som på förra årets Inspiron 14 7420har klickplattans design förändrats på grund av att Mylar-skiktet har tagits bort. Den har nu ett mer traditionellt utseende samtidigt som den ursprungliga ytan på 11,5 x 8 cm har bibehållits. Tyvärr har återkopplingen när du klickar inte förbättrats eftersom den fortfarande känns svampig och lite för ytlig.

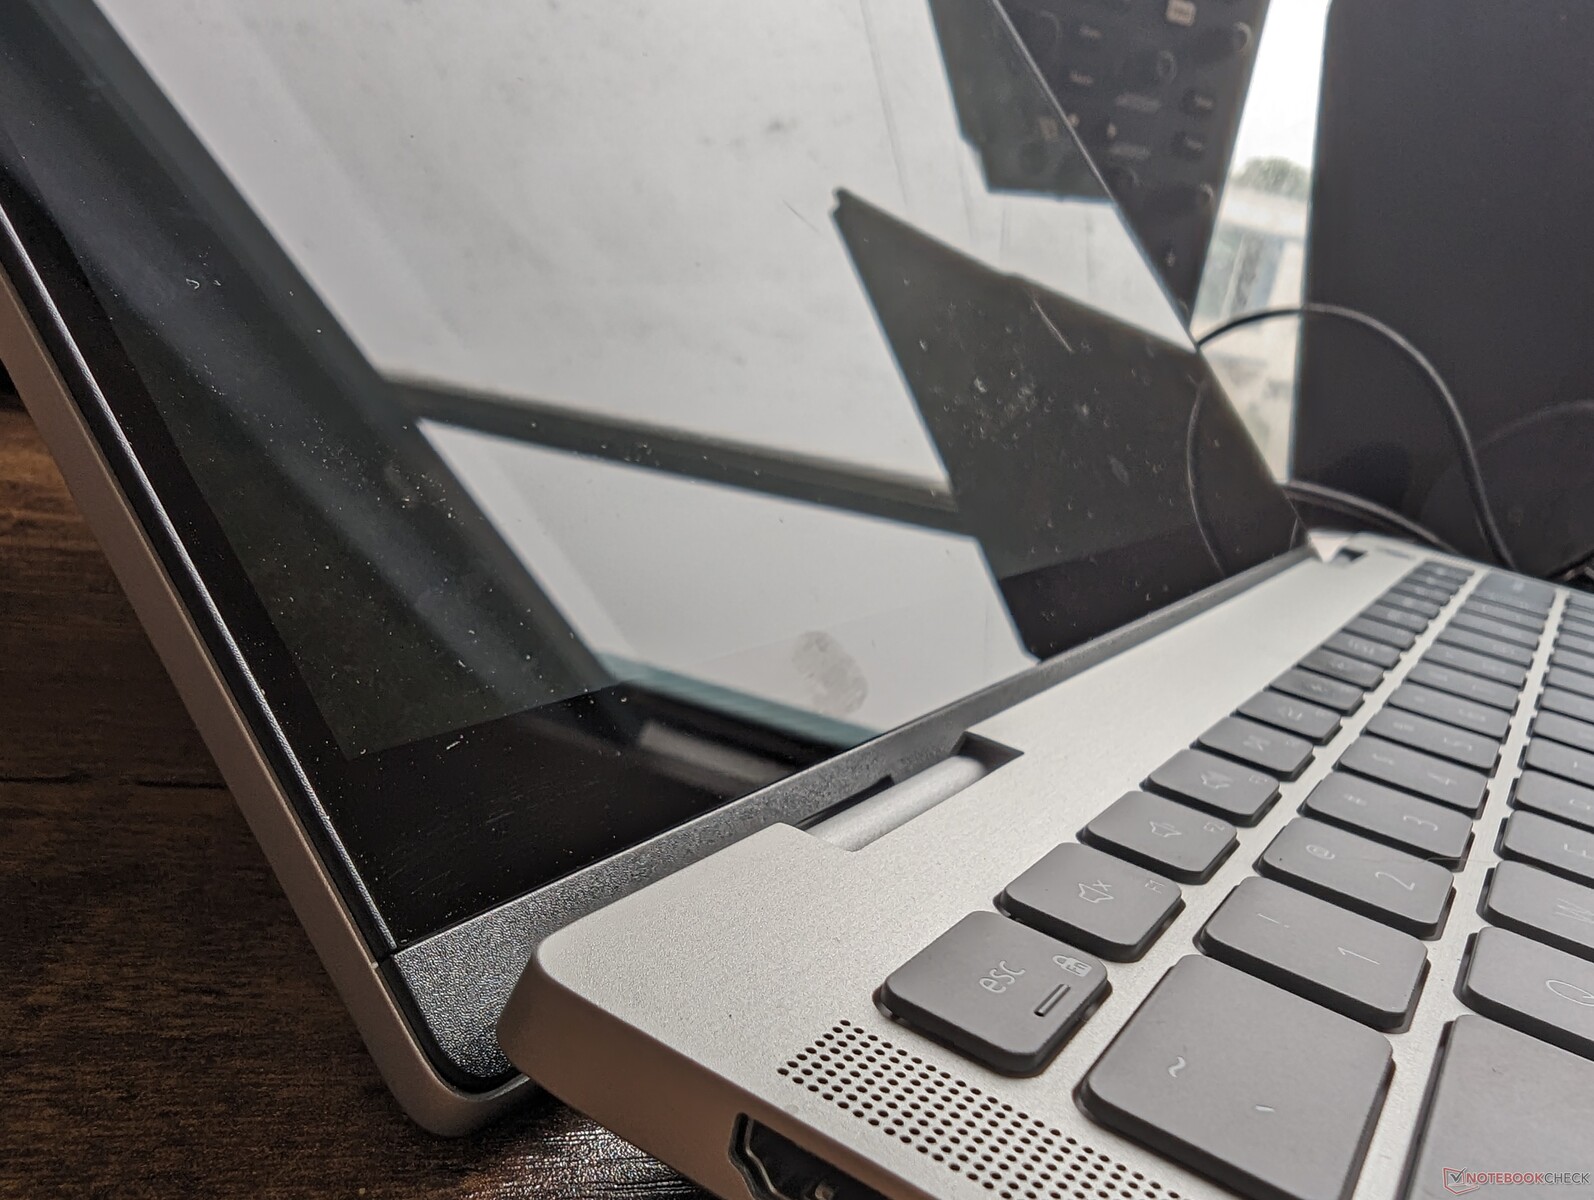
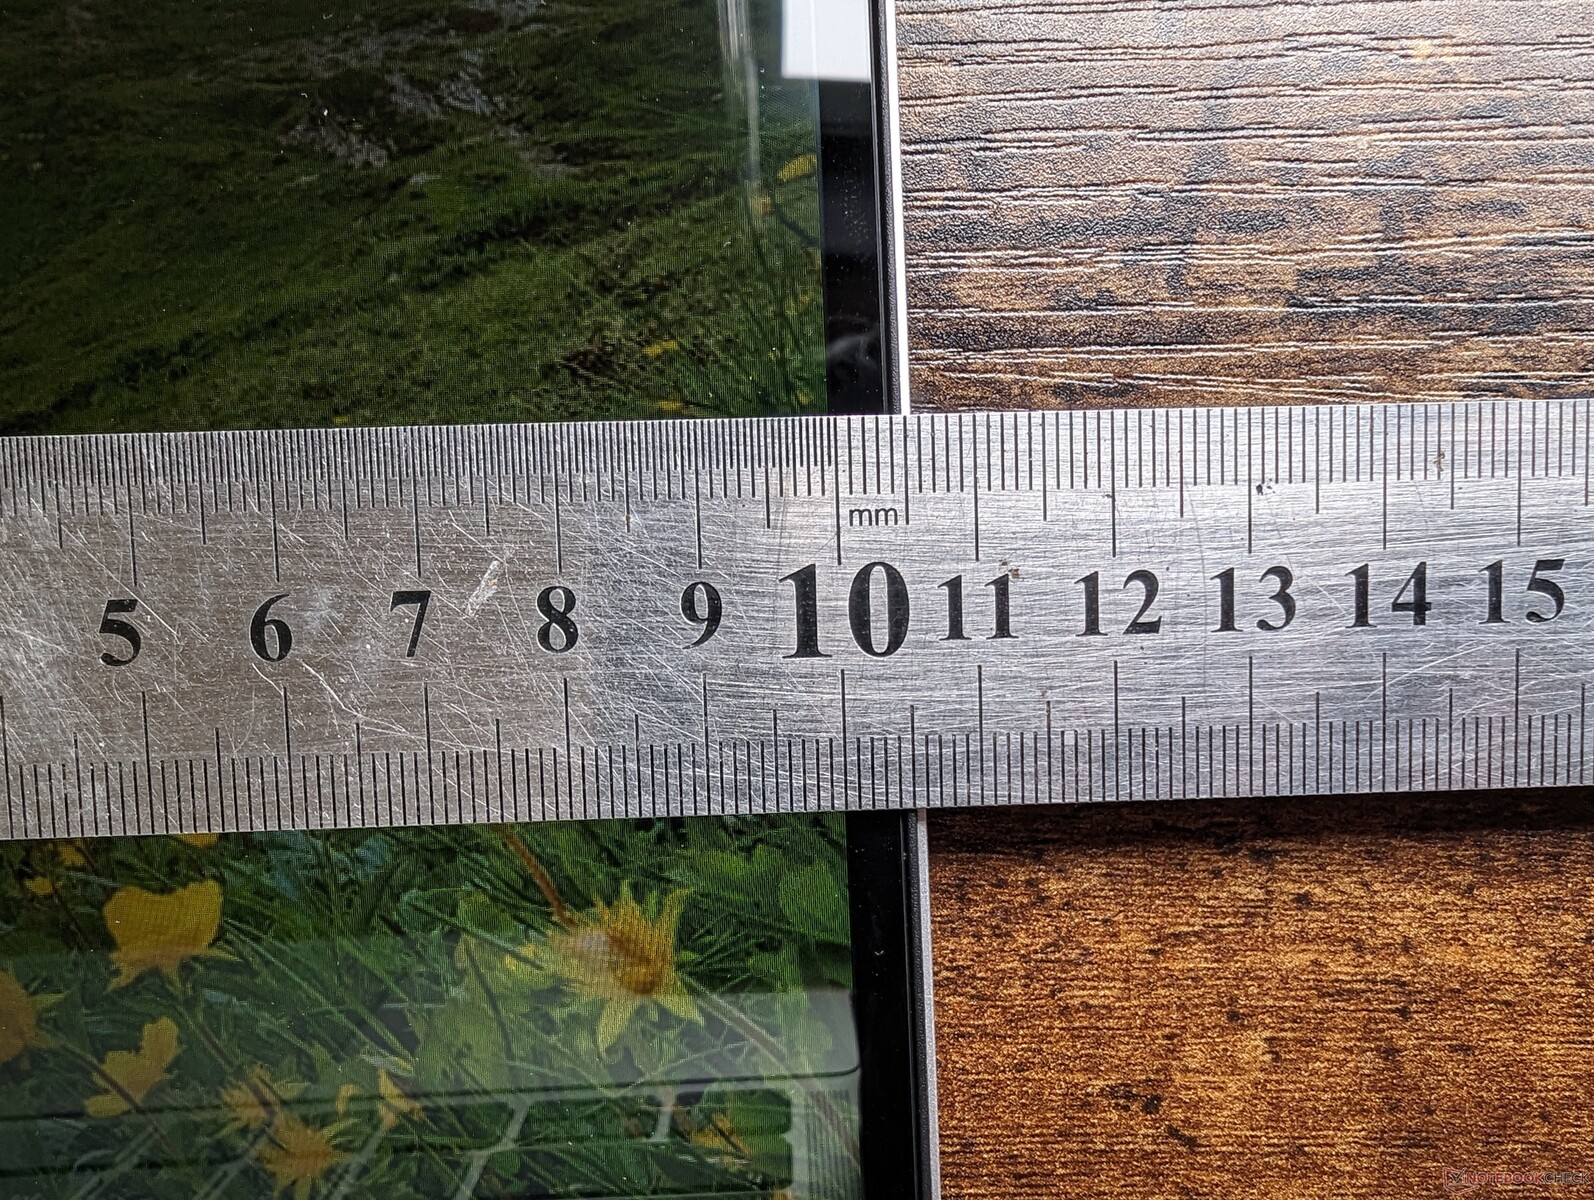
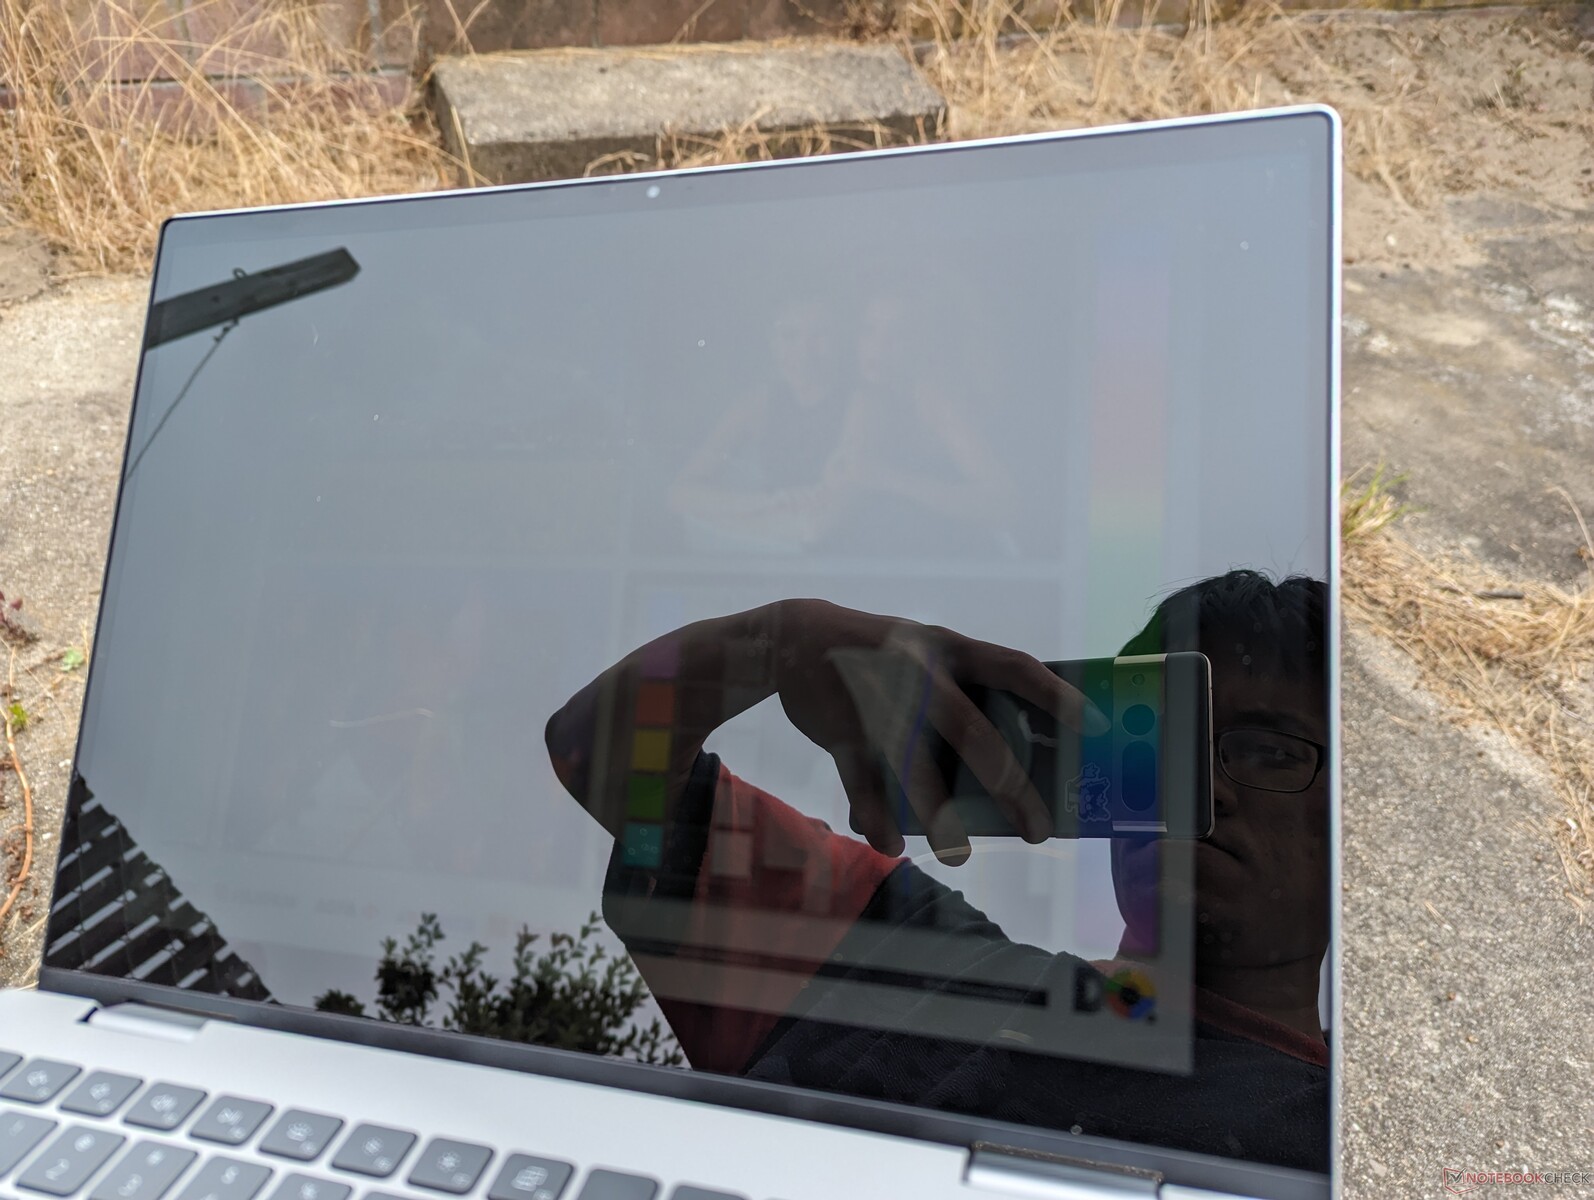
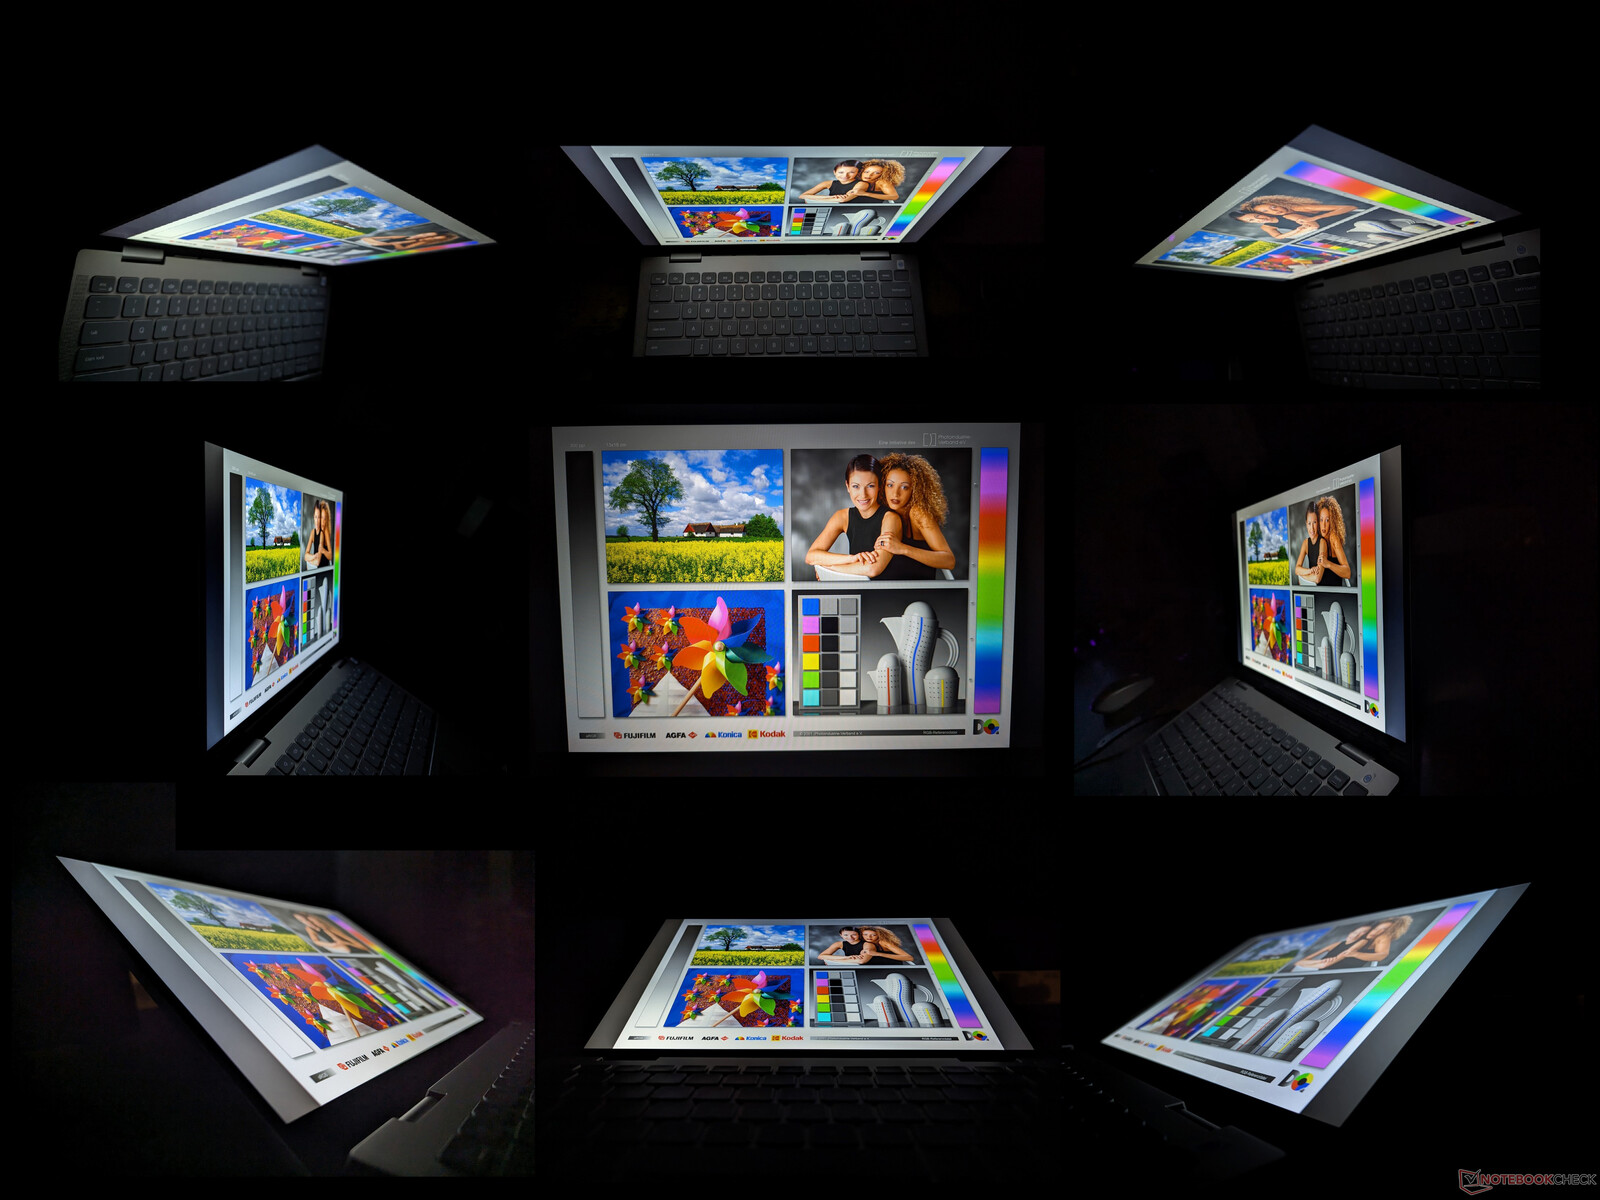
Bildskärm - 60 Hz, 45% NTSC, 1200p, 16:10
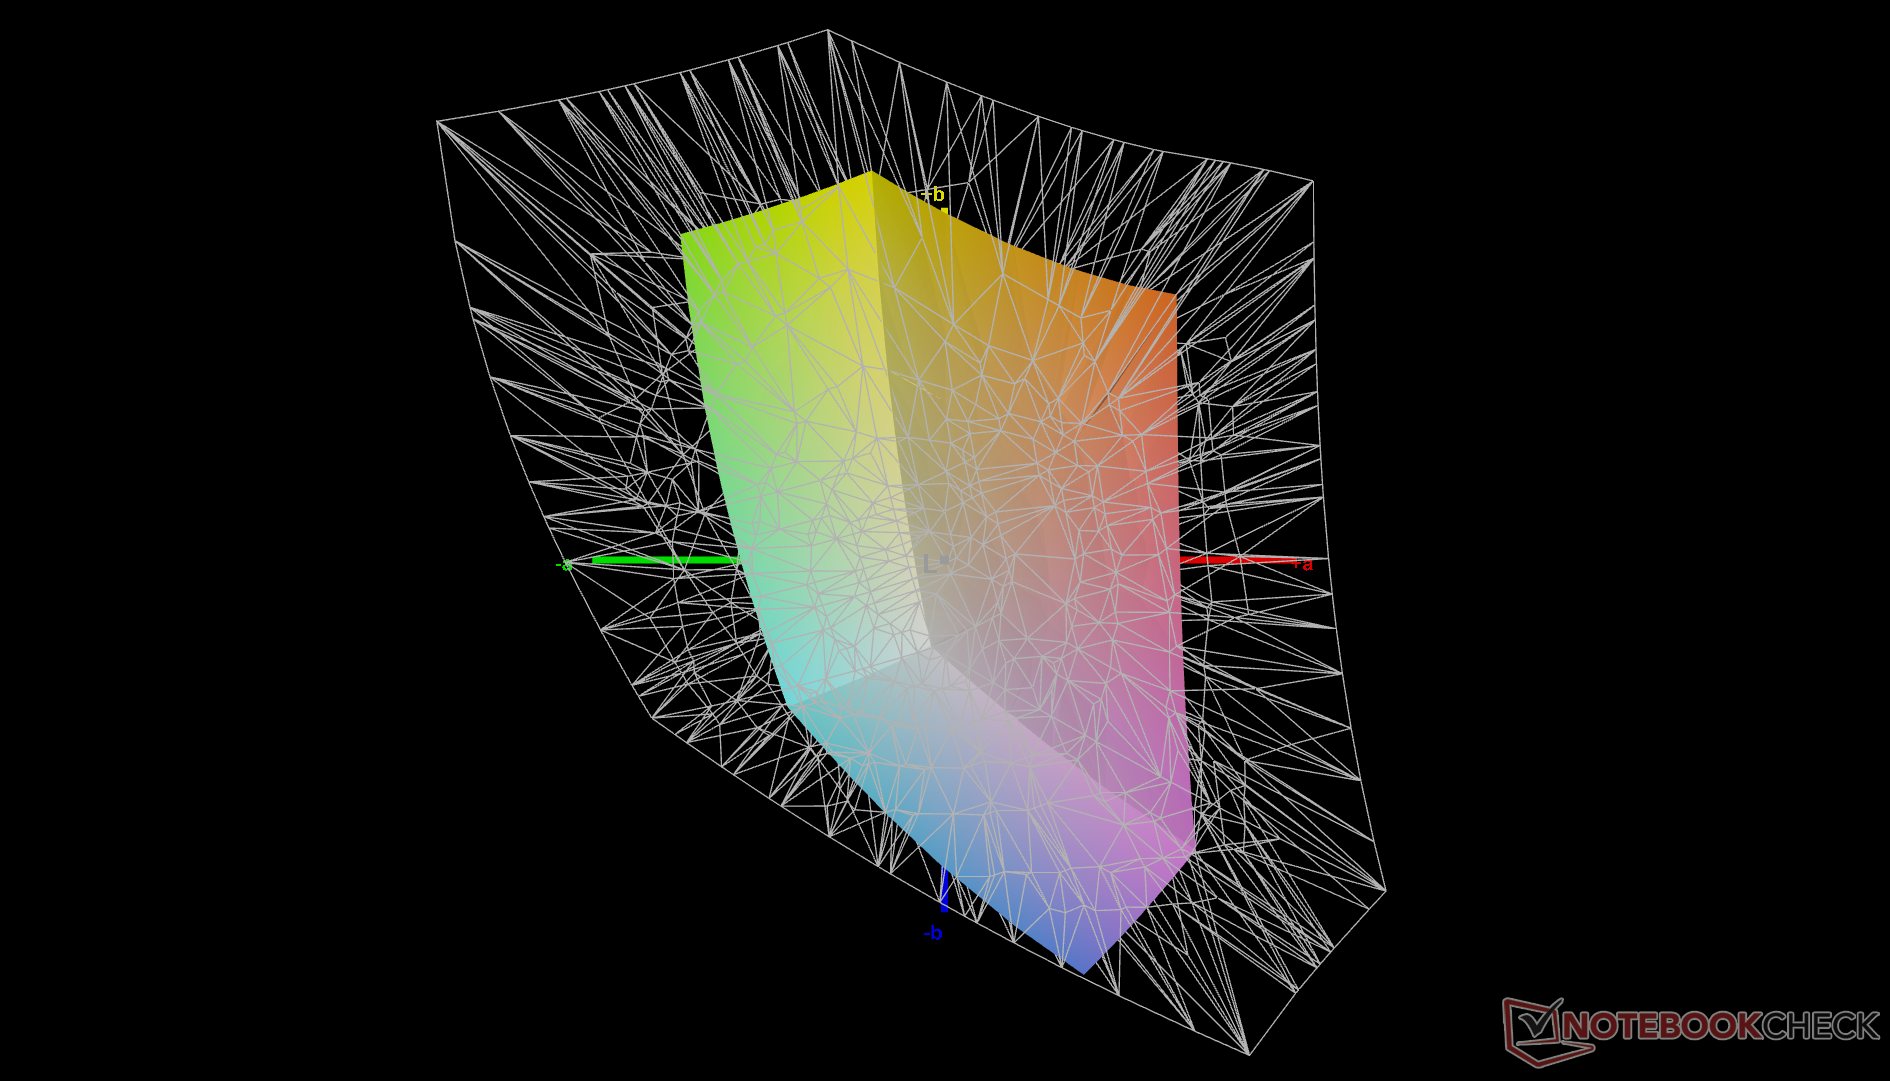
Årets modell levereras med LG Philips 140WU2 IPS-panel som ersätter BOE NV14N42-panelen på förra årets Inspiron 14 9420 2-in-1. Kärnattributen är annars nästan identiska för en liknande tittarupplevelse mellan dem. Det smala färgomfånget, de genomsnittliga svarstiderna och det mediokra kontrastförhållandet är standard i den här prisklassen.
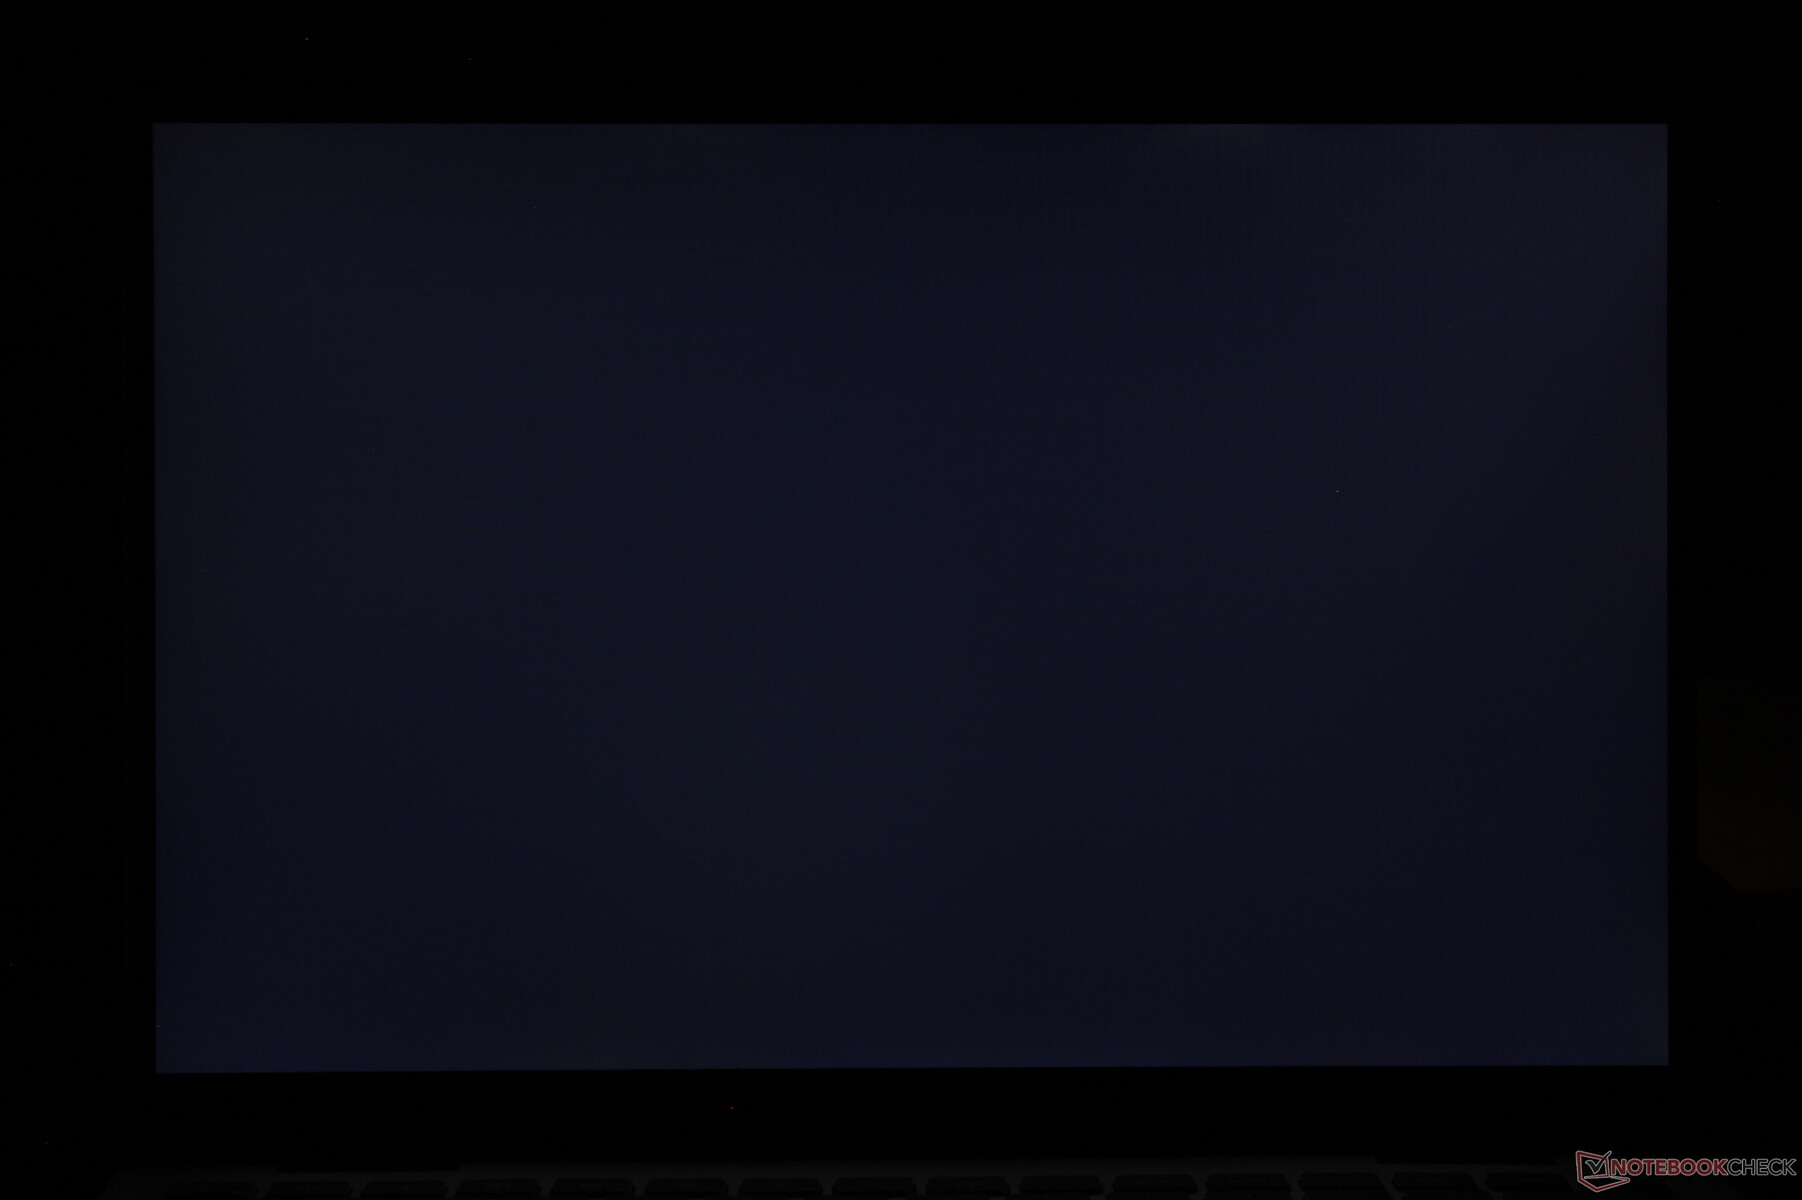
En aspekt som förtjänar mer uppmärksamhet är pekskärmens svaga ljusstyrka. Det låga ljusstyrkan på 200 nit är tillräcklig för inomhusmiljöer, men våra förväntningar är högre för cabrioleter eftersom ägarna är mer benägna att använda dem när de reser eller i ljusare utomhusförhållanden. Om synlighet utomhus är ett problem bör potentiella köpare överväga den dyrare XPS 13 9315 2-i-1 som är 2x ljusstarkare än vår Inspiron.
| |||||||||||||||||||||||||
Distribution av ljusstyrkan: 87 %
Mitt på batteriet: 231.8 cd/m²
Kontrast: 859:1 (Svärta: 0.27 cd/m²)
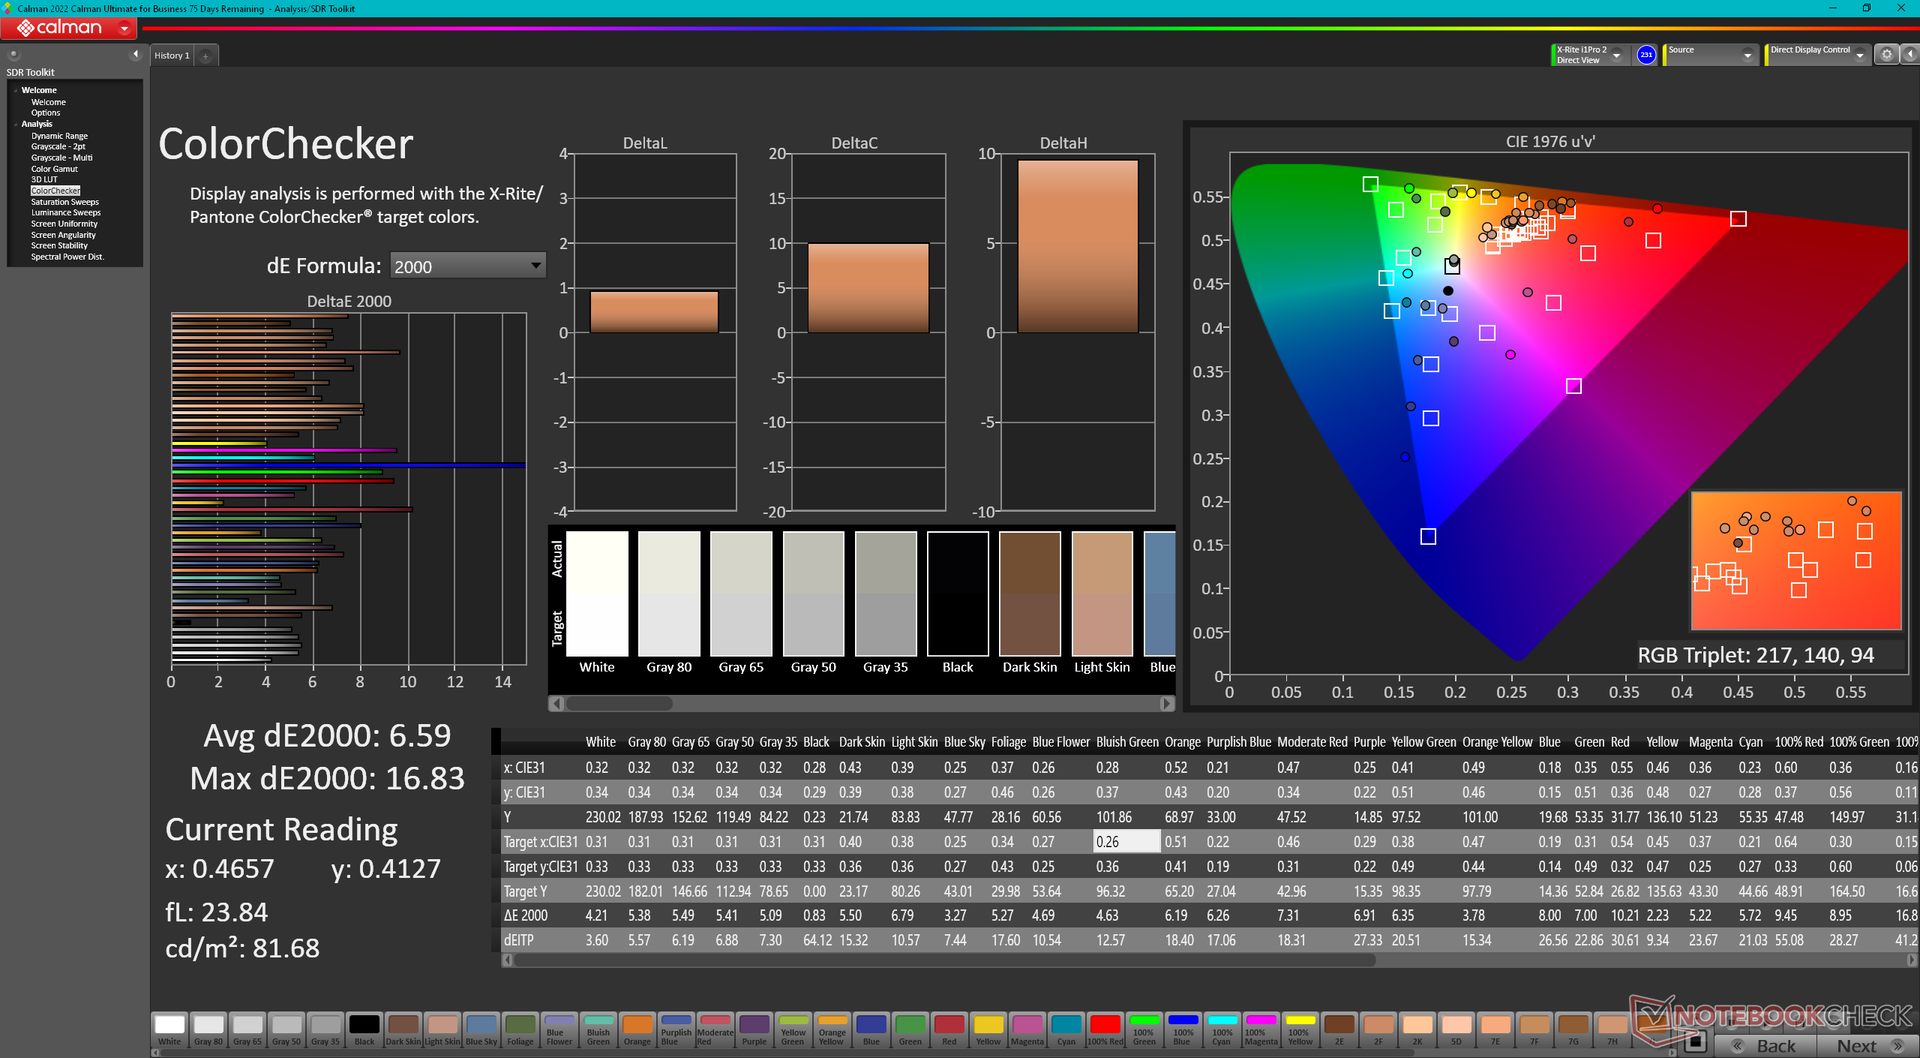
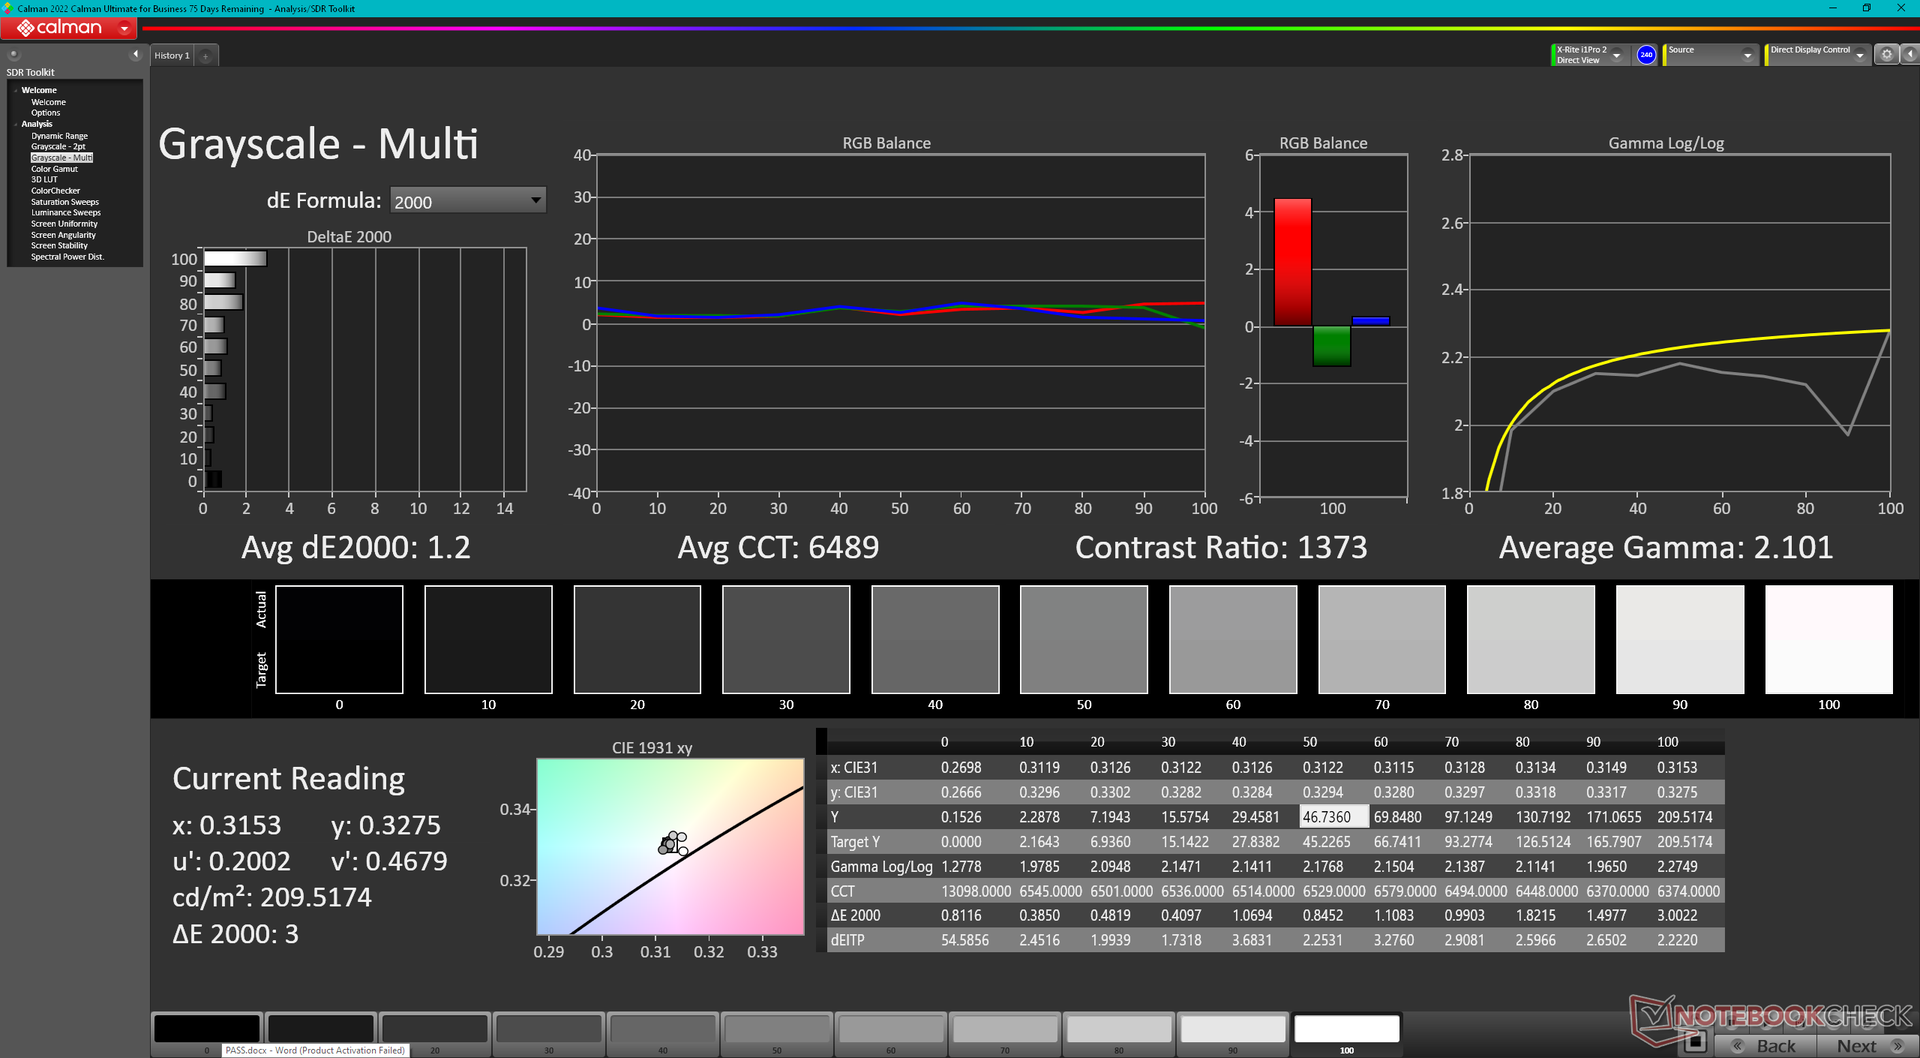
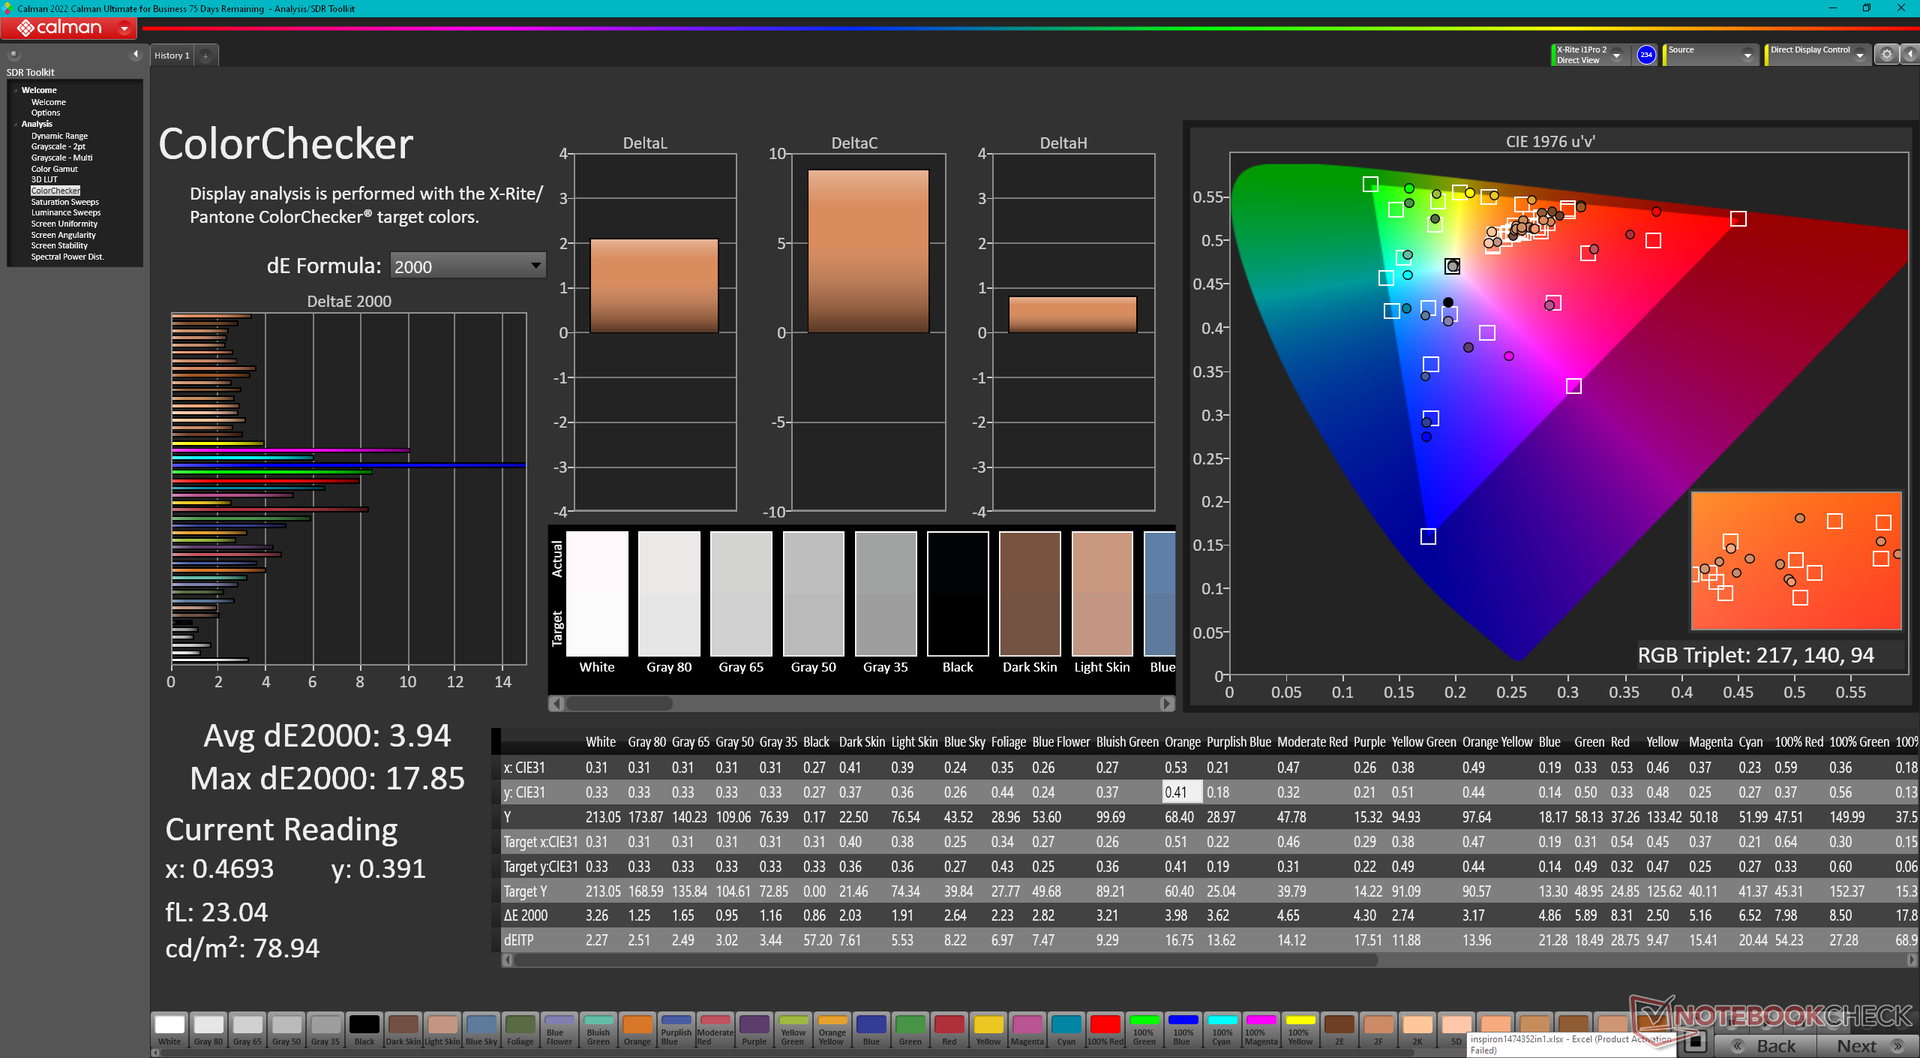
ΔE ColorChecker Calman: 6.59 | ∀{0.5-29.43 Ø4.71}
calibrated: 3.94
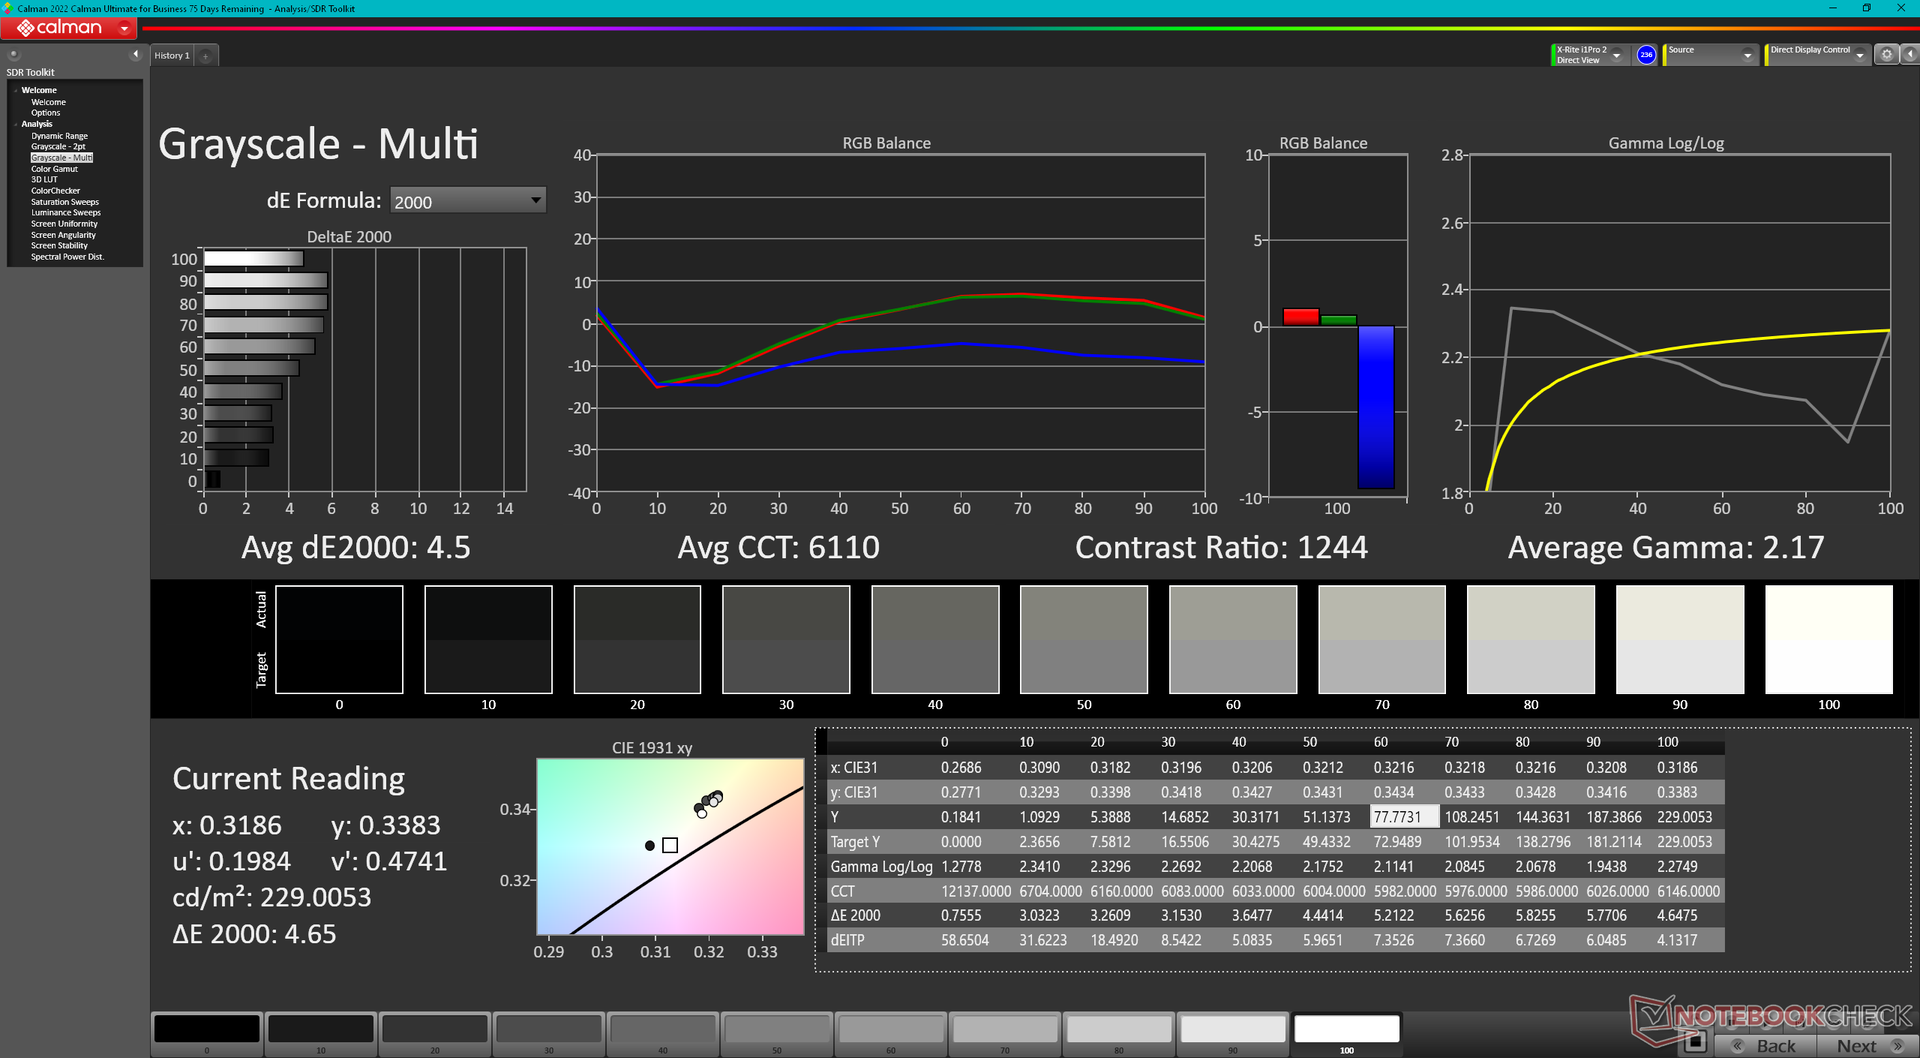
ΔE Greyscale Calman: 4.5 | ∀{0.09-98 Ø4.96}
45.8% AdobeRGB 1998 (Argyll 3D)
64.4% sRGB (Argyll 3D)
44.4% Display P3 (Argyll 3D)
Gamma: 2.17
CCT: 6110 K
| Dell Inspiron 14 7435 2-in-1 LG Philips 140WU2, IPS, 1920x1200, 14" | Dell Inspiron 14 7420 2-in-1 BOE NV14N42, IPS, 1920x1200, 14" | Lenovo IdeaPad Flex 7i 14IAU7 BOE CQ NV140DRM-162, IPS, 2240x1400, 14" | Acer Aspire 5 Spin 14 BOE CQ NV140WUM-N41, IPS, 1920x1200, 14" | LG Gram 14T90P LG Philips LP140WU1-SPA1, IPS, 1900x1200, 14" | HP Pavilion x360 14-dy0157ng Chi Mei N140HCA-E5B, IPS, 1920x1080, 14" | |
|---|---|---|---|---|---|---|
| Display | -13% | 56% | -12% | 89% | -3% | |
| Display P3 Coverage (%) | 44.4 | 38.6 -13% | 69.8 57% | 38.5 -13% | 98.8 123% | 42.7 -4% |
| sRGB Coverage (%) | 64.4 | 56.2 -13% | 98 52% | 57.3 -11% | 100 55% | 63.7 -1% |
| AdobeRGB 1998 Coverage (%) | 45.8 | 39.9 -13% | 72.2 58% | 39.8 -13% | 44.2 -3% | |
| Response Times | -24% | -101% | -23% | -90% | -39% | |
| Response Time Grey 50% / Grey 80% * (ms) | 19.6 ? | 27.2 ? -39% | 44.4 ? -127% | 29 ? -48% | 44 ? -124% | 32 ? -63% |
| Response Time Black / White * (ms) | 19.3 ? | 20.8 ? -8% | 33.6 ? -74% | 19 ? 2% | 30 ? -55% | 22 ? -14% |
| PWM Frequency (Hz) | ||||||
| Screen | -6% | 31% | 12% | 34% | 39% | |
| Brightness middle (cd/m²) | 231.8 | 269.4 16% | 317.3 37% | 249 7% | 305.5 32% | 269 16% |
| Brightness (cd/m²) | 216 | 260 20% | 301 39% | 235 9% | 289 34% | 241 12% |
| Brightness Distribution (%) | 87 | 89 2% | 90 3% | 85 -2% | 87 0% | 82 -6% |
| Black Level * (cd/m²) | 0.27 | 0.41 -52% | 0.22 19% | 0.27 -0% | 0.27 -0% | 0.11 59% |
| Contrast (:1) | 859 | 657 -24% | 1442 68% | 922 7% | 1131 32% | 2445 185% |
| Colorchecker dE 2000 * | 6.59 | 6.53 1% | 3.99 39% | 5 24% | 3.31 50% | 5.68 14% |
| Colorchecker dE 2000 max. * | 16.83 | 19.76 -17% | 9.34 45% | 8.32 51% | 6.12 64% | 9.61 43% |
| Colorchecker dE 2000 calibrated * | 3.94 | 3.13 21% | 0.6 85% | 5.06 -28% | ||
| Greyscale dE 2000 * | 4.5 | 5.4 -20% | 6.9 -53% | 2.86 36% | 1.9 58% | 4.95 -10% |
| Gamma | 2.17 101% | 2.05 107% | 2.19 100% | 2.19 100% | 2.04 108% | 2.17 101% |
| CCT | 6110 106% | 6007 108% | 6161 106% | 6419 101% | 6706 97% | 6628 98% |
| Color Space (Percent of AdobeRGB 1998) (%) | 44.2 | |||||
| Color Space (Percent of sRGB) (%) | 63.7 | |||||
| Totalt genomsnitt (program/inställningar) | -14% /
-10% | -5% /
18% | -8% /
2% | 11% /
22% | -1% /
18% |
* ... mindre är bättre
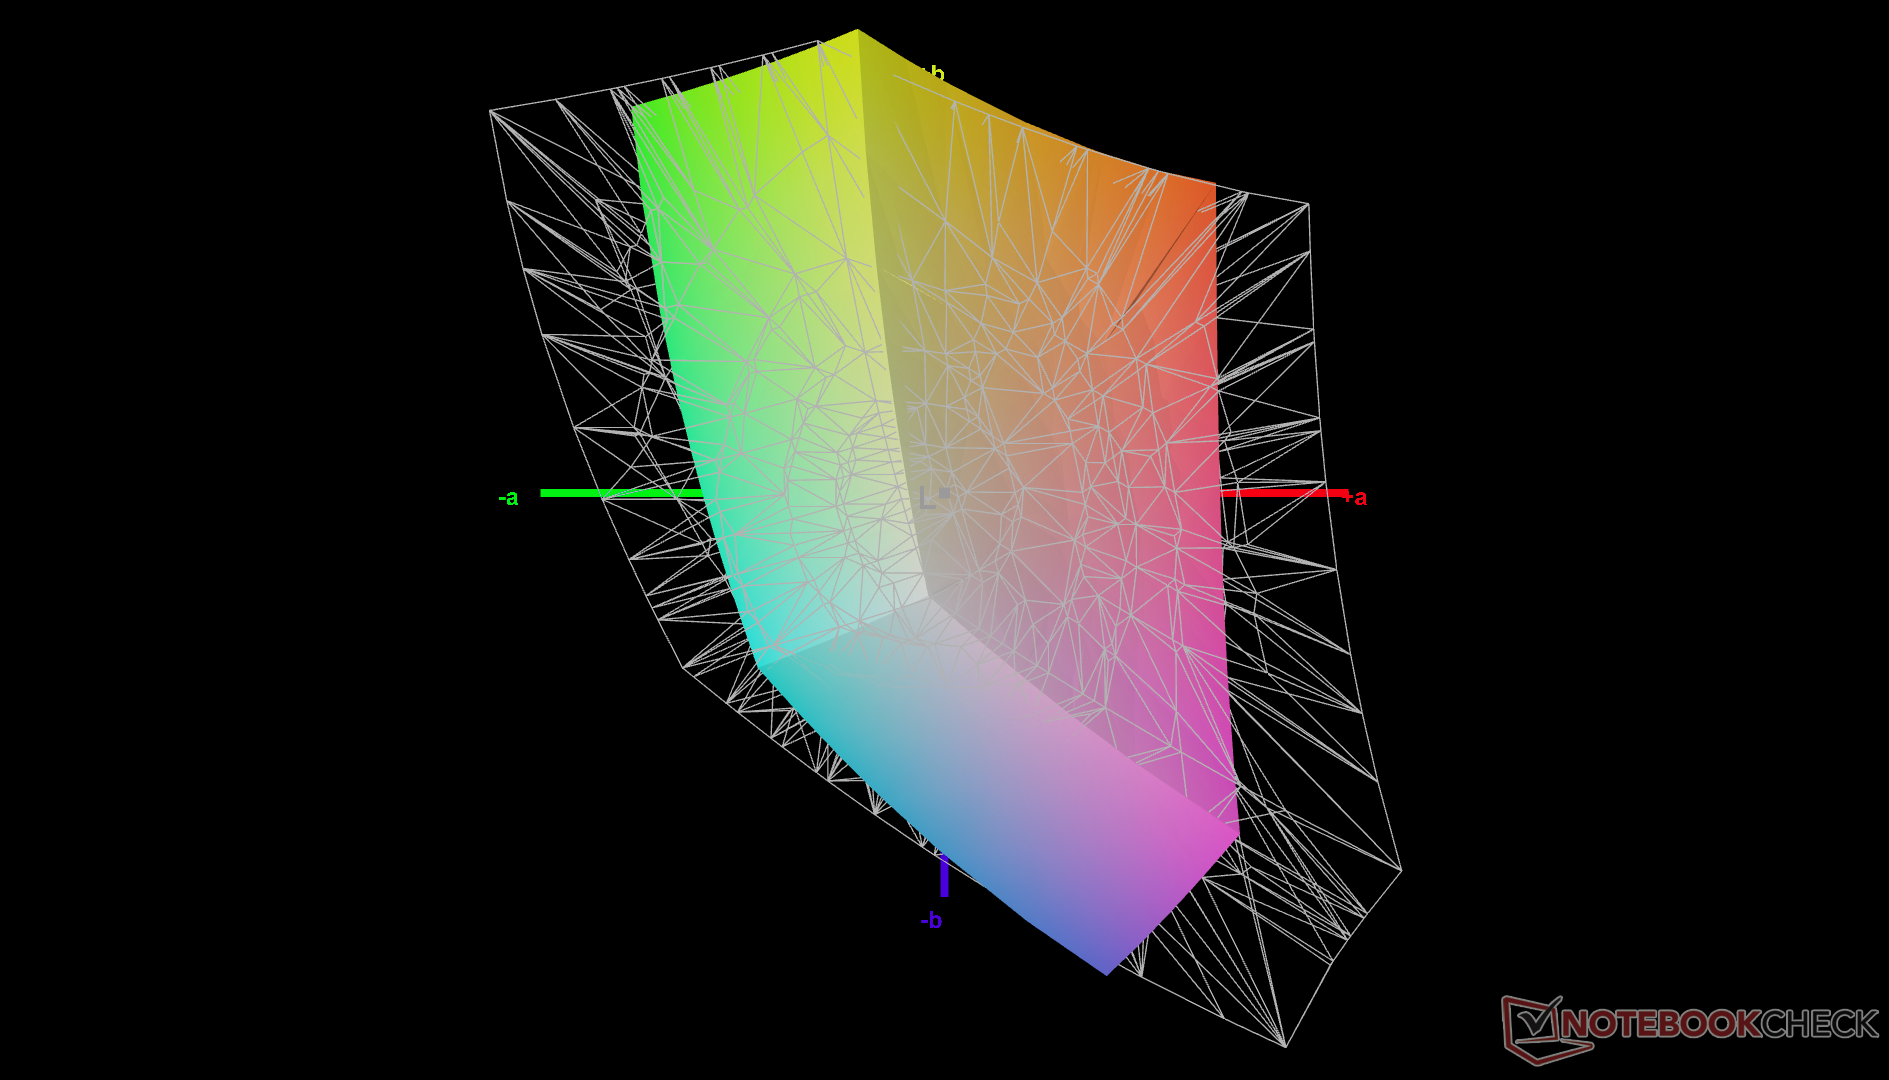
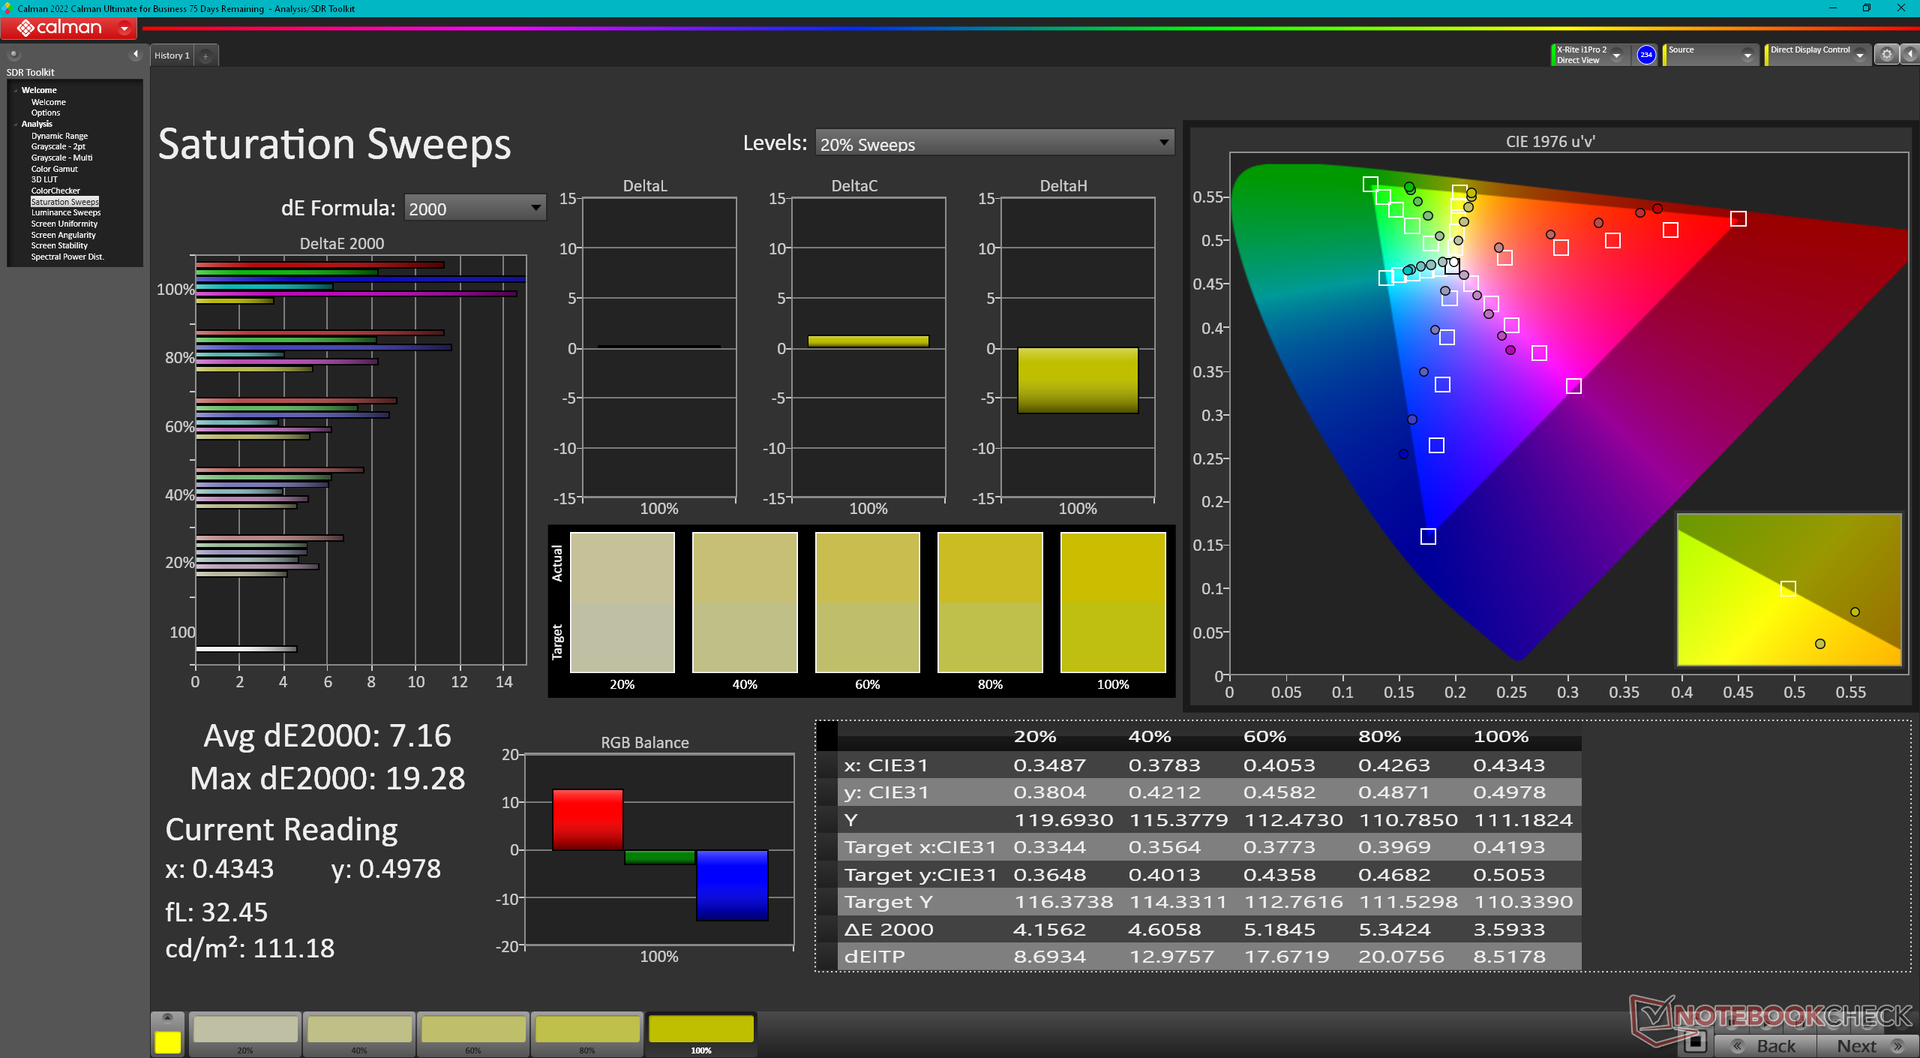
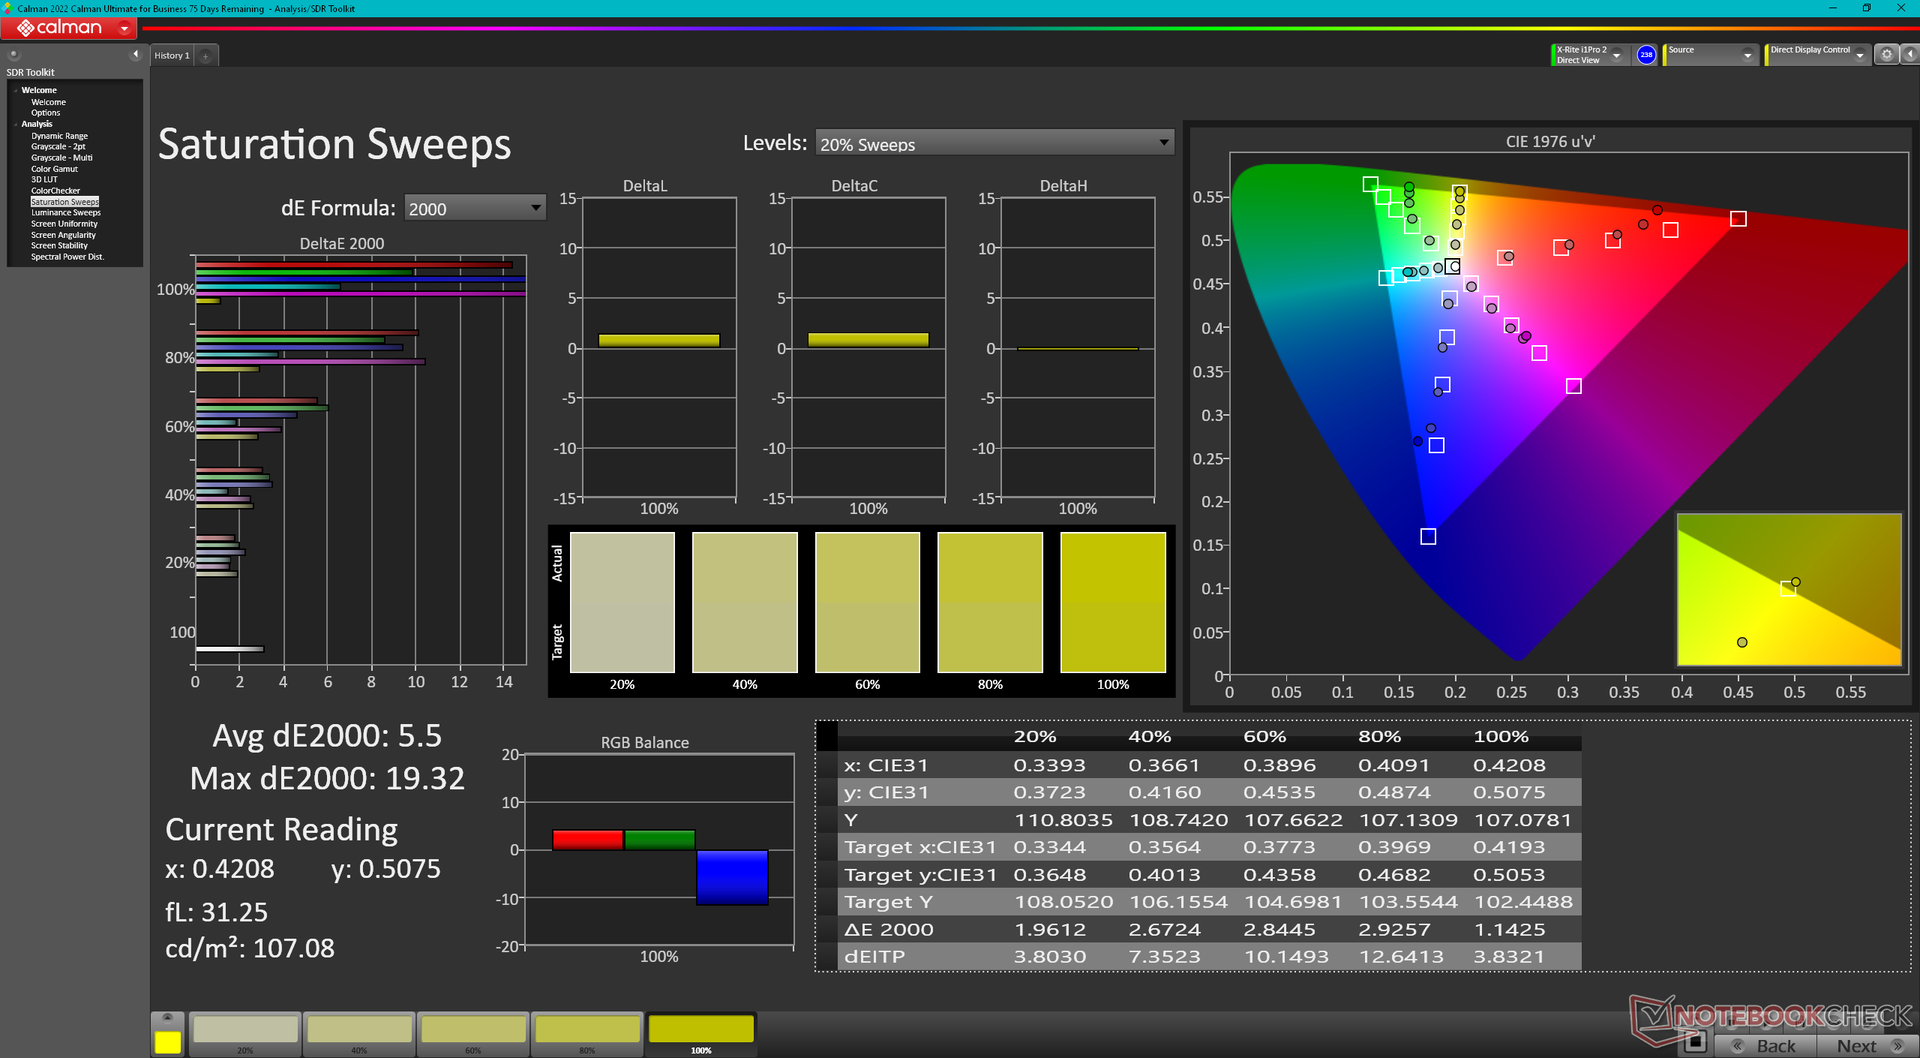
Färgtemperaturen är något för varm vid leverans. En kalibrering med vår X-Rite-kolorimeter löser detta problem och ger överlag mer exakta färger. Observera dock att färgerna fortfarande kommer att vara felaktiga vid högre mättnadsnivåer på grund av den begränsade sRGB-täckningen som nämns ovan.
Visa svarstider
| ↔ Svarstid svart till vitt | ||
|---|---|---|
| 19.3 ms ... stiga ↗ och falla ↘ kombinerat | ↗ 10.6 ms stiga | 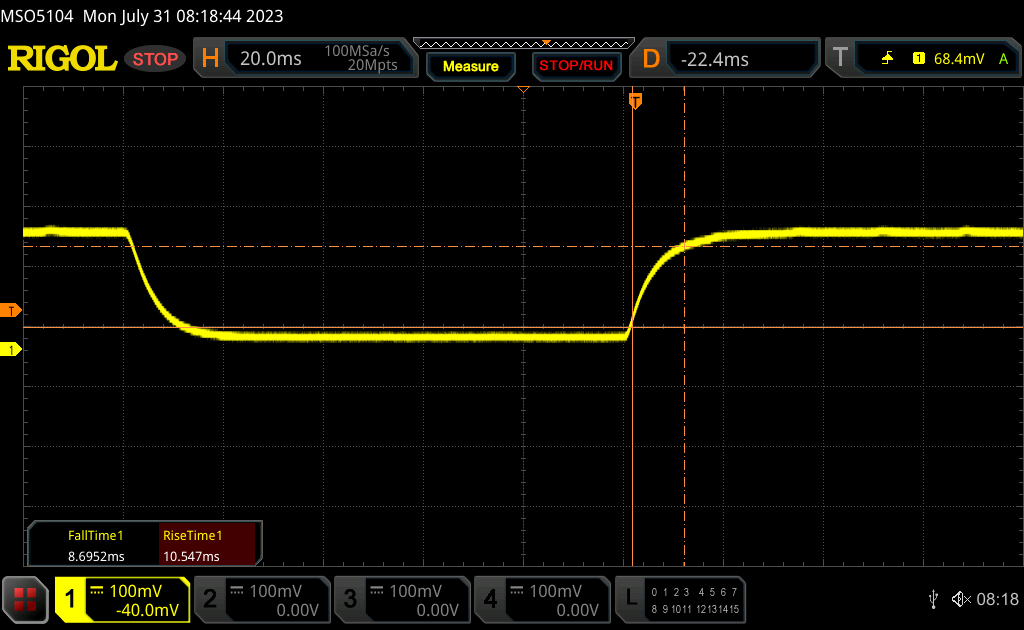 |
| ↘ 8.7 ms hösten | ||
| Skärmen visar bra svarsfrekvens i våra tester, men kan vara för långsam för konkurrenskraftiga spelare. I jämförelse sträcker sig alla testade enheter från 0.1 (minst) till 240 (maximalt) ms. » 43 % av alla enheter är bättre. Det betyder att den uppmätta svarstiden liknar genomsnittet av alla testade enheter (19.8 ms). | ||
| ↔ Svarstid 50 % grått till 80 % grått | ||
| 19.6 ms ... stiga ↗ och falla ↘ kombinerat | ↗ 13.6 ms stiga | 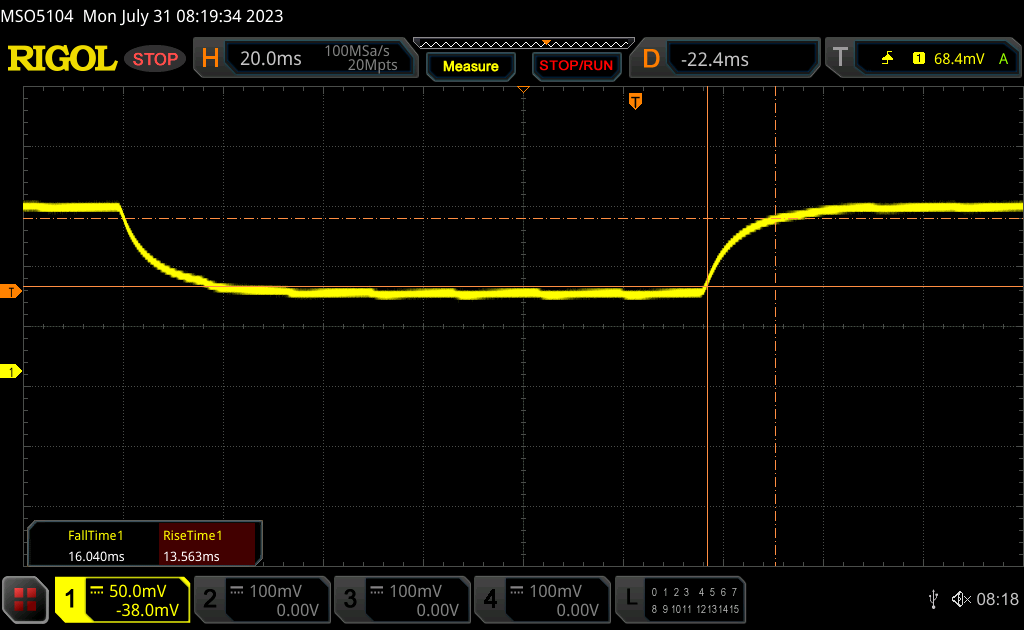 |
| ↘ 16 ms hösten | ||
| Skärmen visar bra svarsfrekvens i våra tester, men kan vara för långsam för konkurrenskraftiga spelare. I jämförelse sträcker sig alla testade enheter från 0.165 (minst) till 636 (maximalt) ms. » 33 % av alla enheter är bättre. Det betyder att den uppmätta svarstiden är bättre än genomsnittet av alla testade enheter (31 ms). | ||
Skärmflimmer / PWM (Puls-Width Modulation)
| Skärmflimmer / PWM upptäcktes inte | 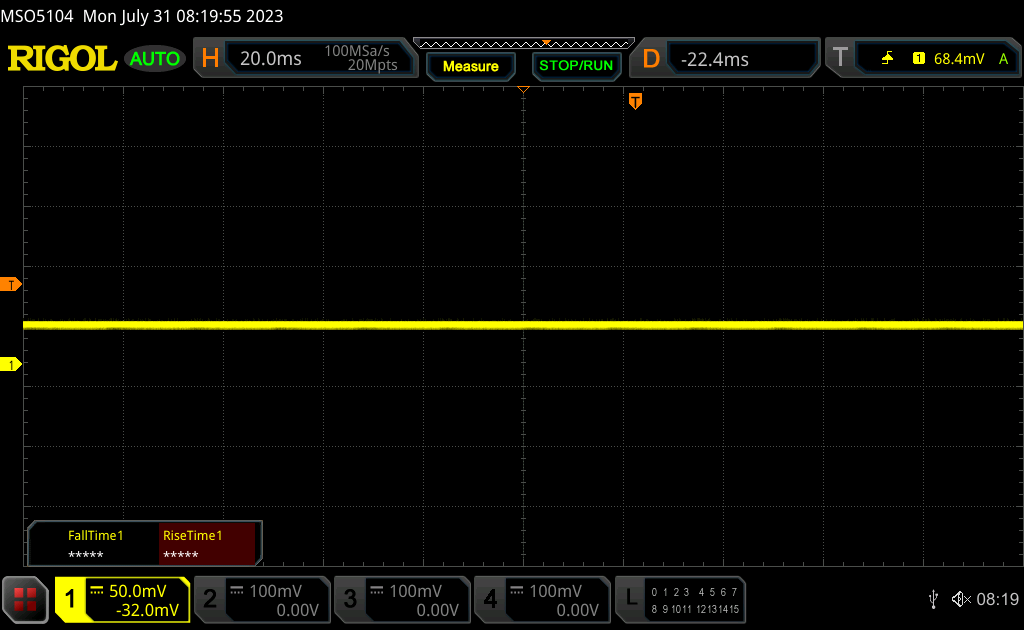 | ||
Som jämförelse: 52 % av alla testade enheter använder inte PWM för att dämpa skärmen. Om PWM upptäcktes mättes ett medelvärde av 7757 (minst: 5 - maximum: 343500) Hz. | |||
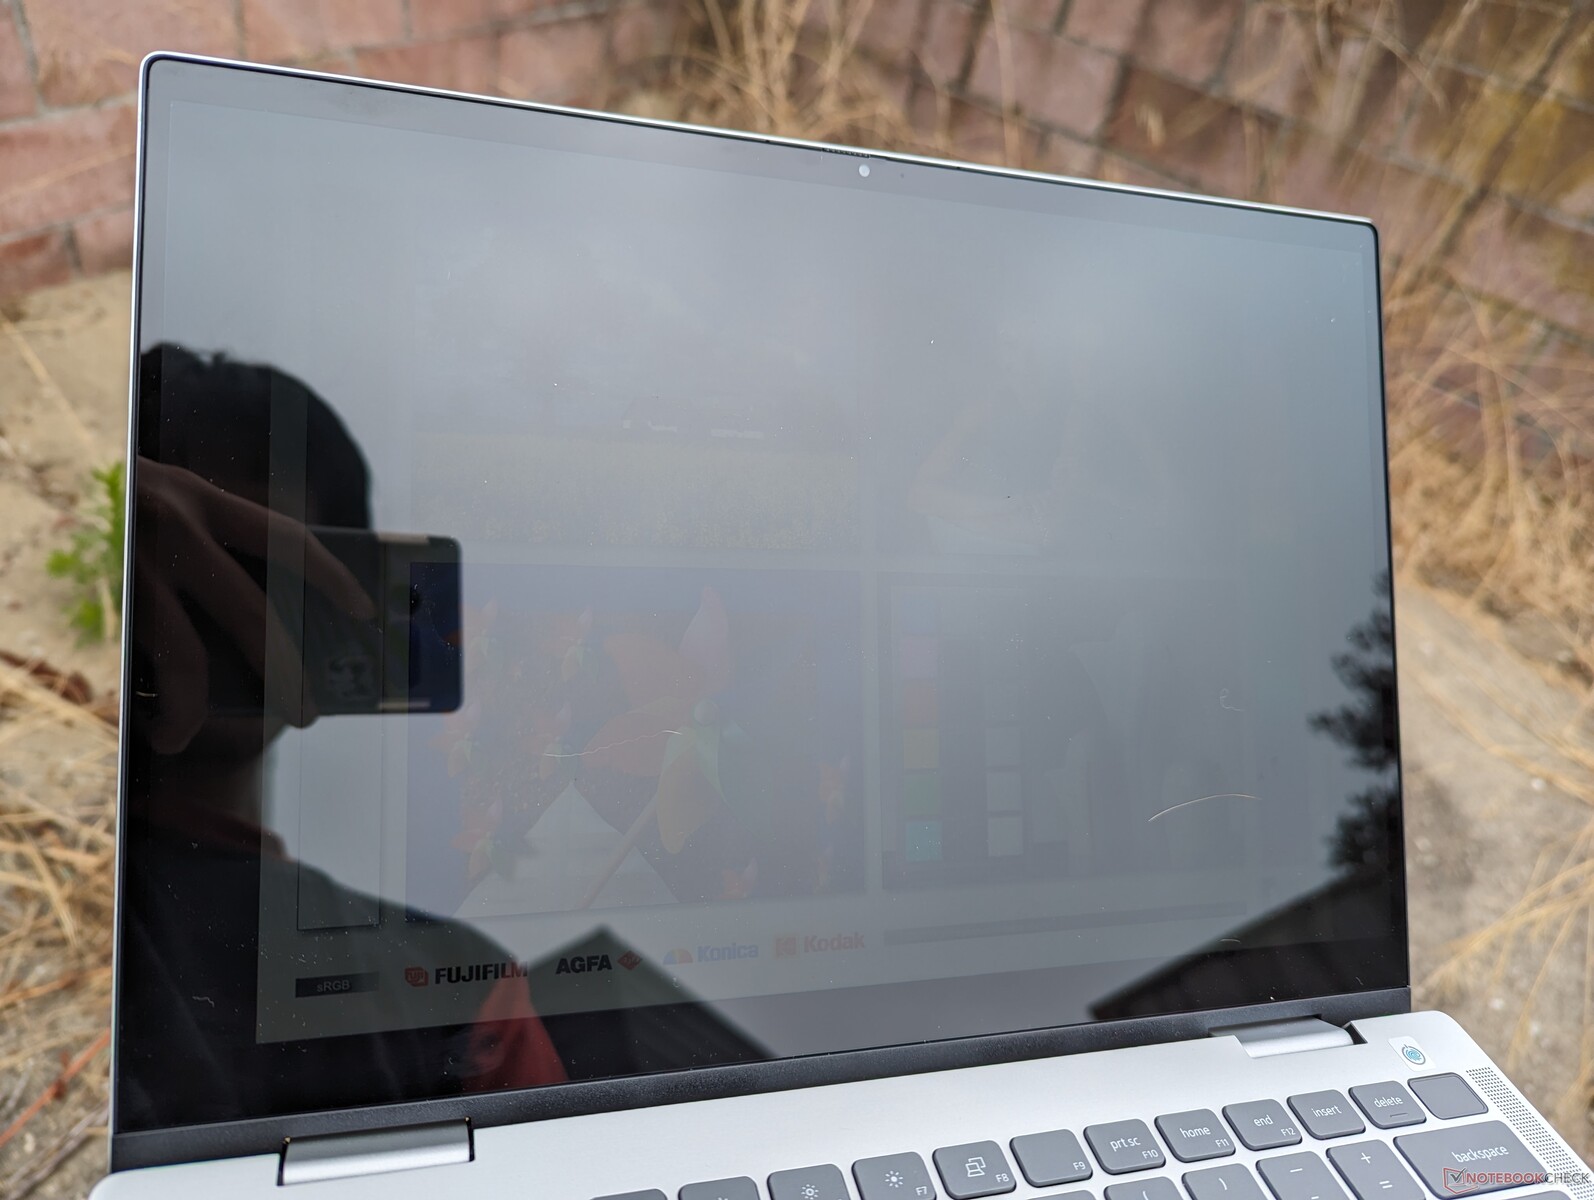
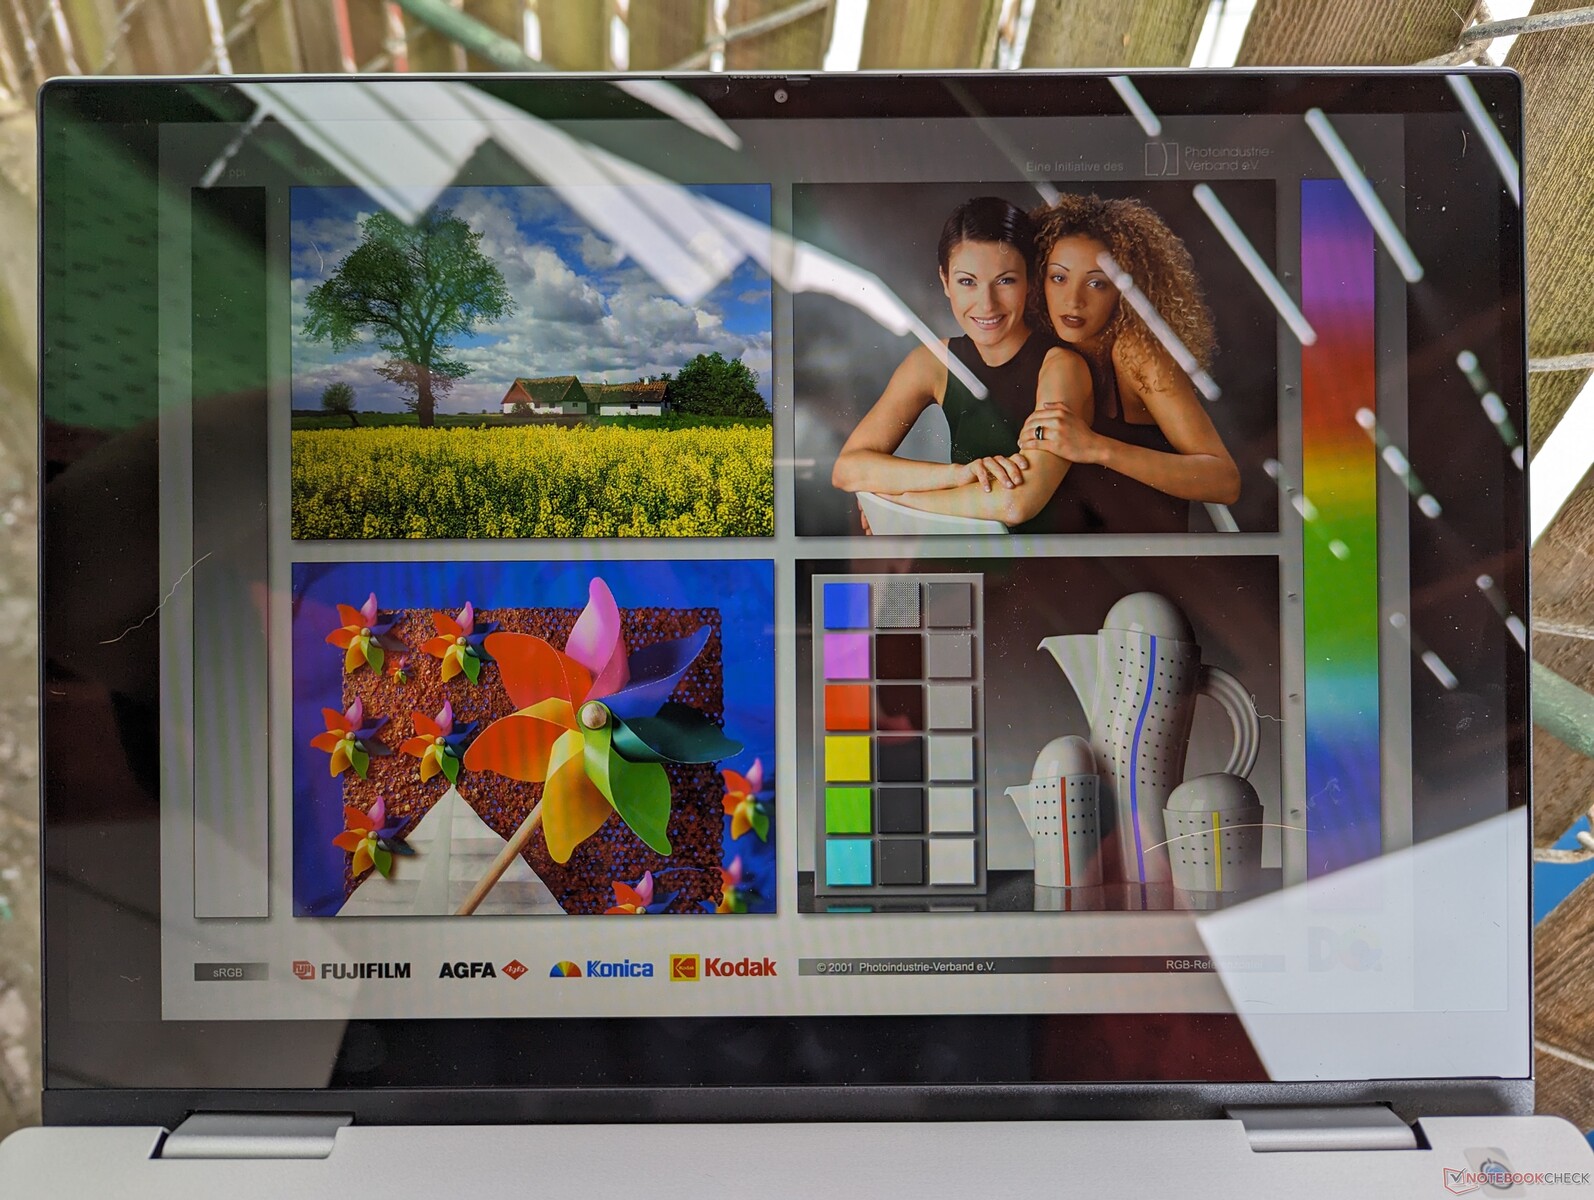
Bländningen är märkbar även när den bärbara datorn används inomhus eller i skugga. Den svaga bakgrundsbelysningen kan inte övervinna mycket av bländningen från det glansiga överlägget, vilket allvarligt påverkar synligheten under utomhusförhållanden.
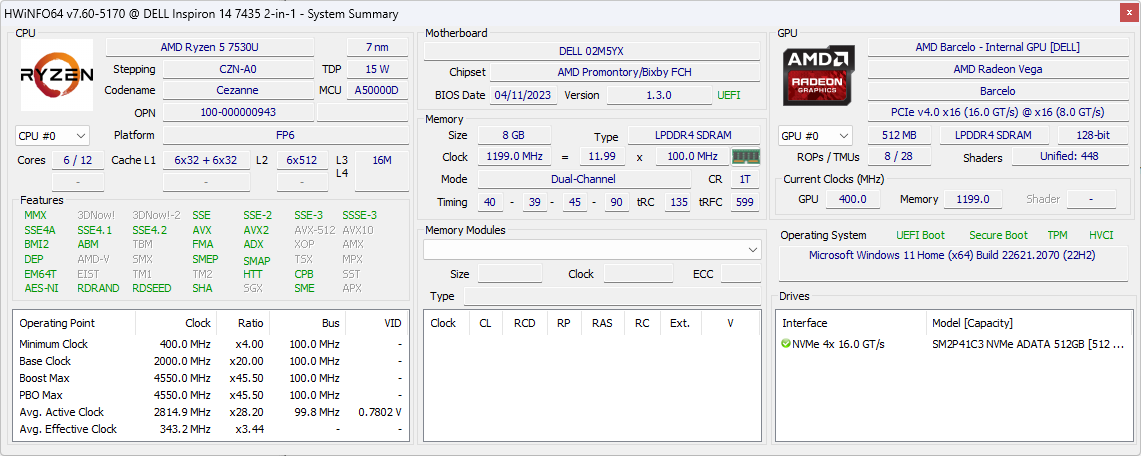
Prestanda - AMD Zen 3 i hjärtat
Villkor för testning
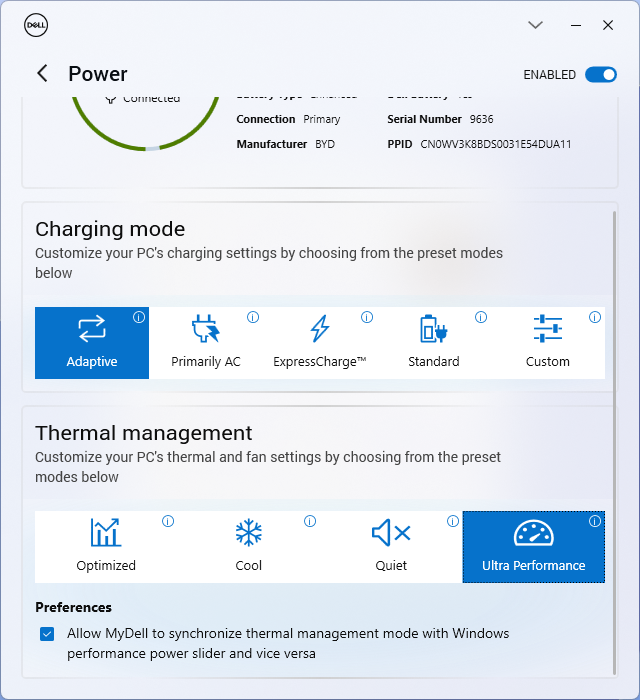
Vi ställde in vår enhet på Performance-läge via MyDell-programvaran innan vi körde riktmärkena nedan. Det är praktiskt att MyDells energiprofiler synkroniseras med Windows energiprofiler, till skillnad från de flesta andra modeller från konkurrerande tillverkare.
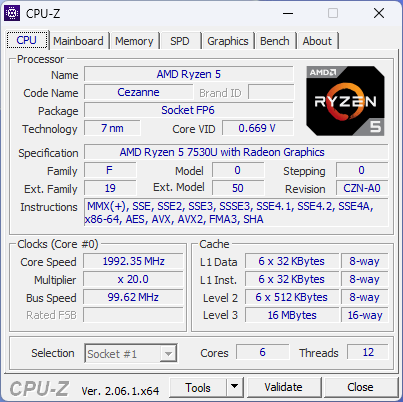
Processor
Den 6-kärniga Ryzen 5 7530U presterar nästan identiskt medRyzen 5 6600U eftersom båda är baserade på Zen 3-arkitekturen. Den övergripande prestandan är jämförbar med mellanklassmodellen Core i5-1335U som finns på modeller somAcer Aspire 5 Spin 14 samtidigt som den ligger långt över alla mobila Core i3-lösningar. AMD har anpassat den här processorn för att kunna konkurrera med Core i5-serien både vad gäller prestanda och pris.
Uppgradering till den 8-kärniga Ryzen 7 7730U förväntas öka prestandan för flertrådar med cirka 30 till 40 procent baserat på vår tid med Asus Zenbook 14.
Cinebench R15 Multi Loop
Cinebench R23: Multi Core | Single Core
Cinebench R20: CPU (Multi Core) | CPU (Single Core)
Cinebench R15: CPU Multi 64Bit | CPU Single 64Bit
Blender: v2.79 BMW27 CPU
7-Zip 18.03: 7z b 4 | 7z b 4 -mmt1
Geekbench 5.5: Multi-Core | Single-Core
HWBOT x265 Benchmark v2.2: 4k Preset
LibreOffice : 20 Documents To PDF
R Benchmark 2.5: Overall mean
* ... mindre är bättre
* ... mindre är bättre
AIDA64: FP32 Ray-Trace | FPU Julia | CPU SHA3 | CPU Queen | FPU SinJulia | FPU Mandel | CPU AES | CPU ZLib | FP64 Ray-Trace | CPU PhotoWorxx
| Performance rating | |
| Genomsnitt AMD Ryzen 5 7530U | |
| Dell Inspiron 14 7435 2-in-1 | |
| Lenovo IdeaPad Flex 7i 14IAU7 | |
| Acer Aspire 5 Spin 14 | |
| LG Gram 14T90P | |
| HP Pavilion x360 14-dy0157ng | |
| Dell Inspiron 14 7420 2-in-1 | |
| AIDA64 / FP32 Ray-Trace | |
| Dell Inspiron 14 7435 2-in-1 | |
| Genomsnitt AMD Ryzen 5 7530U (7609 - 10970, n=9) | |
| Lenovo IdeaPad Flex 7i 14IAU7 | |
| Acer Aspire 5 Spin 14 | |
| LG Gram 14T90P | |
| HP Pavilion x360 14-dy0157ng | |
| Dell Inspiron 14 7420 2-in-1 | |
| AIDA64 / FPU Julia | |
| Dell Inspiron 14 7435 2-in-1 | |
| Genomsnitt AMD Ryzen 5 7530U (48473 - 68384, n=9) | |
| Lenovo IdeaPad Flex 7i 14IAU7 | |
| Acer Aspire 5 Spin 14 | |
| LG Gram 14T90P | |
| HP Pavilion x360 14-dy0157ng | |
| Dell Inspiron 14 7420 2-in-1 | |
| AIDA64 / CPU SHA3 | |
| Genomsnitt AMD Ryzen 5 7530U (1591 - 2323, n=9) | |
| Lenovo IdeaPad Flex 7i 14IAU7 | |
| Dell Inspiron 14 7435 2-in-1 | |
| LG Gram 14T90P | |
| Acer Aspire 5 Spin 14 | |
| HP Pavilion x360 14-dy0157ng | |
| Dell Inspiron 14 7420 2-in-1 | |
| AIDA64 / CPU Queen | |
| Dell Inspiron 14 7435 2-in-1 | |
| Genomsnitt AMD Ryzen 5 7530U (66646 - 78105, n=8) | |
| Lenovo IdeaPad Flex 7i 14IAU7 | |
| Dell Inspiron 14 7420 2-in-1 | |
| Acer Aspire 5 Spin 14 | |
| LG Gram 14T90P | |
| HP Pavilion x360 14-dy0157ng | |
| AIDA64 / FPU SinJulia | |
| Dell Inspiron 14 7435 2-in-1 | |
| Genomsnitt AMD Ryzen 5 7530U (7611 - 9248, n=9) | |
| Lenovo IdeaPad Flex 7i 14IAU7 | |
| Dell Inspiron 14 7420 2-in-1 | |
| LG Gram 14T90P | |
| Acer Aspire 5 Spin 14 | |
| HP Pavilion x360 14-dy0157ng | |
| AIDA64 / FPU Mandel | |
| Dell Inspiron 14 7435 2-in-1 | |
| Genomsnitt AMD Ryzen 5 7530U (26912 - 37624, n=9) | |
| Lenovo IdeaPad Flex 7i 14IAU7 | |
| LG Gram 14T90P | |
| Acer Aspire 5 Spin 14 | |
| HP Pavilion x360 14-dy0157ng | |
| Dell Inspiron 14 7420 2-in-1 | |
| AIDA64 / CPU AES | |
| Acer Aspire 5 Spin 14 | |
| LG Gram 14T90P | |
| HP Pavilion x360 14-dy0157ng | |
| Genomsnitt AMD Ryzen 5 7530U (33314 - 92360, n=9) | |
| Lenovo IdeaPad Flex 7i 14IAU7 | |
| Dell Inspiron 14 7435 2-in-1 | |
| Dell Inspiron 14 7420 2-in-1 | |
| AIDA64 / CPU ZLib | |
| Acer Aspire 5 Spin 14 | |
| Lenovo IdeaPad Flex 7i 14IAU7 | |
| Dell Inspiron 14 7420 2-in-1 | |
| Dell Inspiron 14 7435 2-in-1 | |
| Genomsnitt AMD Ryzen 5 7530U (443 - 612, n=9) | |
| LG Gram 14T90P | |
| HP Pavilion x360 14-dy0157ng | |
| AIDA64 / FP64 Ray-Trace | |
| Dell Inspiron 14 7435 2-in-1 | |
| Genomsnitt AMD Ryzen 5 7530U (4008 - 5738, n=9) | |
| Lenovo IdeaPad Flex 7i 14IAU7 | |
| LG Gram 14T90P | |
| Acer Aspire 5 Spin 14 | |
| HP Pavilion x360 14-dy0157ng | |
| Dell Inspiron 14 7420 2-in-1 | |
| AIDA64 / CPU PhotoWorxx | |
| Lenovo IdeaPad Flex 7i 14IAU7 | |
| LG Gram 14T90P | |
| Acer Aspire 5 Spin 14 | |
| HP Pavilion x360 14-dy0157ng | |
| Dell Inspiron 14 7420 2-in-1 | |
| Dell Inspiron 14 7435 2-in-1 | |
| Genomsnitt AMD Ryzen 5 7530U (9832 - 19525, n=9) | |
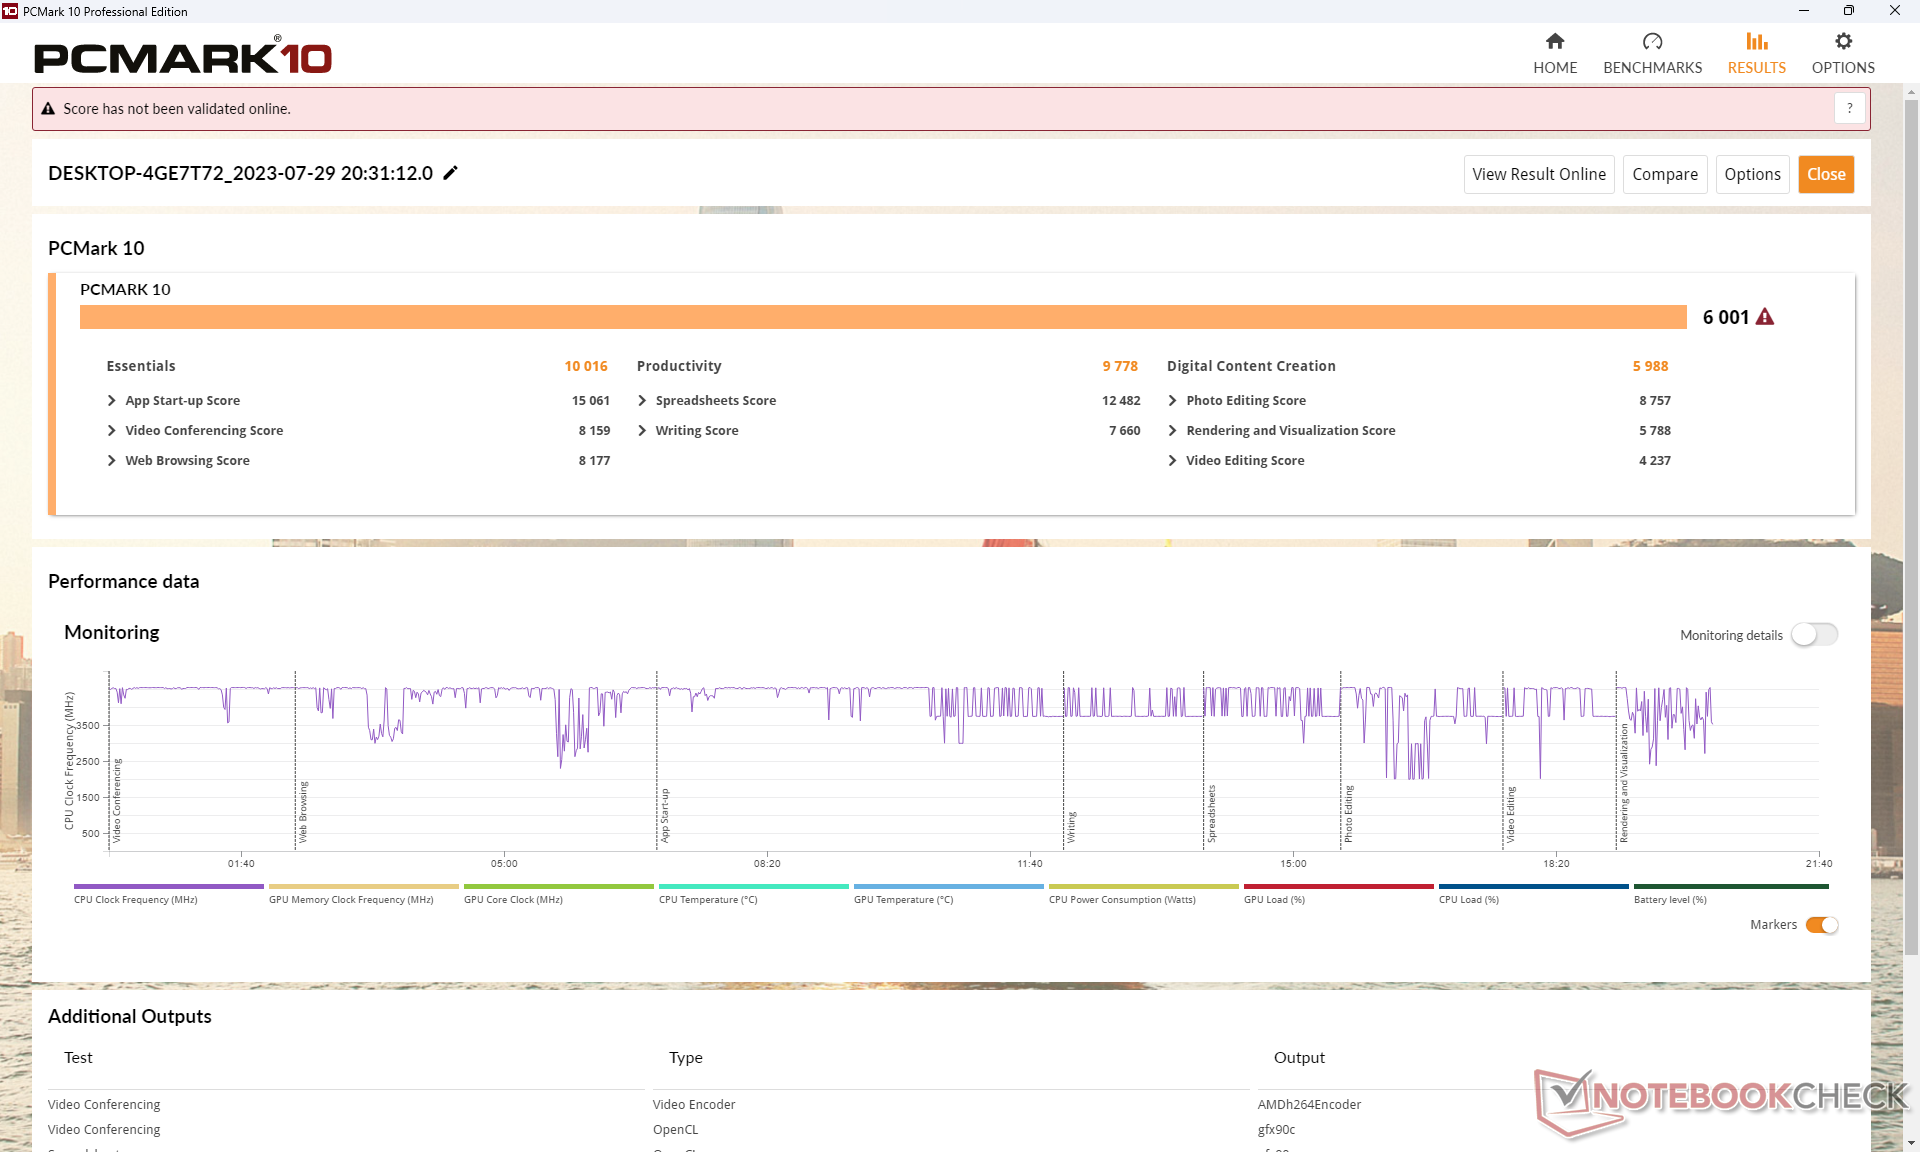
Systemets prestanda
PCMark-resultaten är högre än på de flesta andra billiga subnotebooks, särskilt i deltestet Produktivitet. Vi misstänker att detta kan bero på processorns konfiguration med 6 kärnor/12 trådar som kan ha ett större inflytande på riktmärket än P-kärn- och E-kärnkonfigurationerna för Intel-processorer.
CrossMark: Overall | Productivity | Creativity | Responsiveness
| PCMark 10 / Score | |
| Dell Inspiron 14 7435 2-in-1 | |
| Genomsnitt AMD Ryzen 5 7530U, AMD Radeon RX Vega 7 (5686 - 6209, n=8) | |
| Lenovo IdeaPad Flex 7i 14IAU7 | |
| Dell Inspiron 14 7420 2-in-1 | |
| Acer Aspire 5 Spin 14 | |
| LG Gram 14T90P | |
| HP Pavilion x360 14-dy0157ng | |
| PCMark 10 / Essentials | |
| Lenovo IdeaPad Flex 7i 14IAU7 | |
| Genomsnitt AMD Ryzen 5 7530U, AMD Radeon RX Vega 7 (9183 - 11242, n=8) | |
| Acer Aspire 5 Spin 14 | |
| Dell Inspiron 14 7420 2-in-1 | |
| Dell Inspiron 14 7435 2-in-1 | |
| LG Gram 14T90P | |
| HP Pavilion x360 14-dy0157ng | |
| PCMark 10 / Productivity | |
| Genomsnitt AMD Ryzen 5 7530U, AMD Radeon RX Vega 7 (8983 - 14037, n=8) | |
| Dell Inspiron 14 7435 2-in-1 | |
| Lenovo IdeaPad Flex 7i 14IAU7 | |
| Acer Aspire 5 Spin 14 | |
| Dell Inspiron 14 7420 2-in-1 | |
| LG Gram 14T90P | |
| HP Pavilion x360 14-dy0157ng | |
| PCMark 10 / Digital Content Creation | |
| Dell Inspiron 14 7435 2-in-1 | |
| Dell Inspiron 14 7420 2-in-1 | |
| Lenovo IdeaPad Flex 7i 14IAU7 | |
| Acer Aspire 5 Spin 14 | |
| Genomsnitt AMD Ryzen 5 7530U, AMD Radeon RX Vega 7 (4941 - 6093, n=8) | |
| HP Pavilion x360 14-dy0157ng | |
| LG Gram 14T90P | |
| CrossMark / Overall | |
| Acer Aspire 5 Spin 14 | |
| Lenovo IdeaPad Flex 7i 14IAU7 | |
| Dell Inspiron 14 7420 2-in-1 | |
| LG Gram 14T90P | |
| Genomsnitt AMD Ryzen 5 7530U, AMD Radeon RX Vega 7 (1029 - 1336, n=7) | |
| Dell Inspiron 14 7435 2-in-1 | |
| CrossMark / Productivity | |
| Acer Aspire 5 Spin 14 | |
| Dell Inspiron 14 7420 2-in-1 | |
| Lenovo IdeaPad Flex 7i 14IAU7 | |
| LG Gram 14T90P | |
| Genomsnitt AMD Ryzen 5 7530U, AMD Radeon RX Vega 7 (1115 - 1370, n=7) | |
| Dell Inspiron 14 7435 2-in-1 | |
| CrossMark / Creativity | |
| Lenovo IdeaPad Flex 7i 14IAU7 | |
| Dell Inspiron 14 7420 2-in-1 | |
| Acer Aspire 5 Spin 14 | |
| Genomsnitt AMD Ryzen 5 7530U, AMD Radeon RX Vega 7 (992 - 1390, n=7) | |
| Dell Inspiron 14 7435 2-in-1 | |
| LG Gram 14T90P | |
| CrossMark / Responsiveness | |
| Acer Aspire 5 Spin 14 | |
| LG Gram 14T90P | |
| Dell Inspiron 14 7420 2-in-1 | |
| Lenovo IdeaPad Flex 7i 14IAU7 | |
| Dell Inspiron 14 7435 2-in-1 | |
| Genomsnitt AMD Ryzen 5 7530U, AMD Radeon RX Vega 7 (900 - 1096, n=7) | |
| PCMark 10 Score | 6001 poäng | |
Hjälp | ||
| AIDA64 / Memory Copy | |
| LG Gram 14T90P | |
| Lenovo IdeaPad Flex 7i 14IAU7 | |
| Acer Aspire 5 Spin 14 | |
| HP Pavilion x360 14-dy0157ng | |
| Dell Inspiron 14 7420 2-in-1 | |
| Dell Inspiron 14 7435 2-in-1 | |
| Genomsnitt AMD Ryzen 5 7530U (20155 - 42853, n=9) | |
| AIDA64 / Memory Read | |
| LG Gram 14T90P | |
| Lenovo IdeaPad Flex 7i 14IAU7 | |
| HP Pavilion x360 14-dy0157ng | |
| Acer Aspire 5 Spin 14 | |
| Dell Inspiron 14 7420 2-in-1 | |
| Dell Inspiron 14 7435 2-in-1 | |
| Genomsnitt AMD Ryzen 5 7530U (23068 - 40270, n=9) | |
| AIDA64 / Memory Write | |
| Acer Aspire 5 Spin 14 | |
| LG Gram 14T90P | |
| Lenovo IdeaPad Flex 7i 14IAU7 | |
| HP Pavilion x360 14-dy0157ng | |
| Dell Inspiron 14 7420 2-in-1 | |
| Dell Inspiron 14 7435 2-in-1 | |
| Genomsnitt AMD Ryzen 5 7530U (22954 - 41838, n=9) | |
| AIDA64 / Memory Latency | |
| Dell Inspiron 14 7435 2-in-1 | |
| Acer Aspire 5 Spin 14 | |
| Genomsnitt AMD Ryzen 5 7530U (88.1 - 110.8, n=9) | |
| Lenovo IdeaPad Flex 7i 14IAU7 | |
| LG Gram 14T90P | |
| HP Pavilion x360 14-dy0157ng | |
| Dell Inspiron 14 7420 2-in-1 | |
* ... mindre är bättre
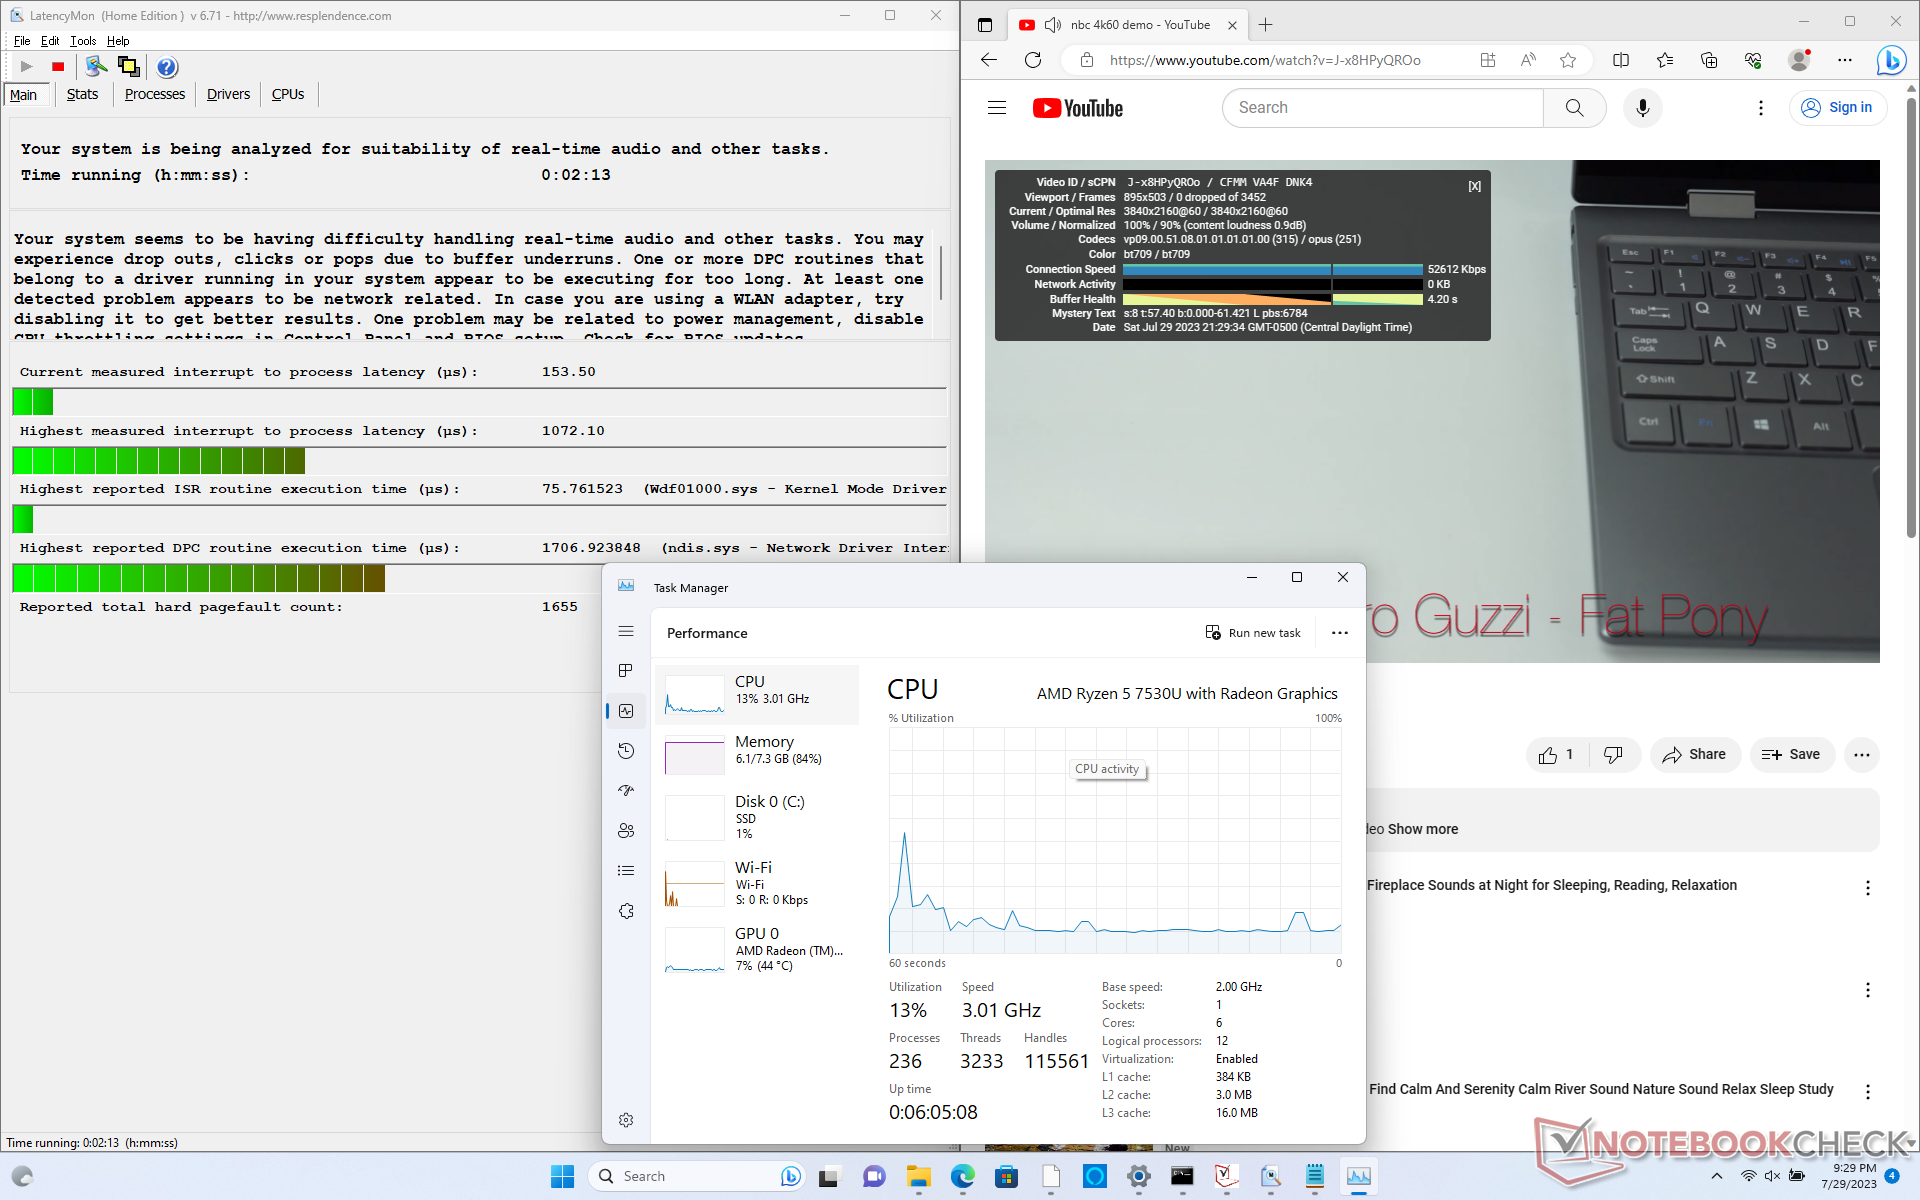
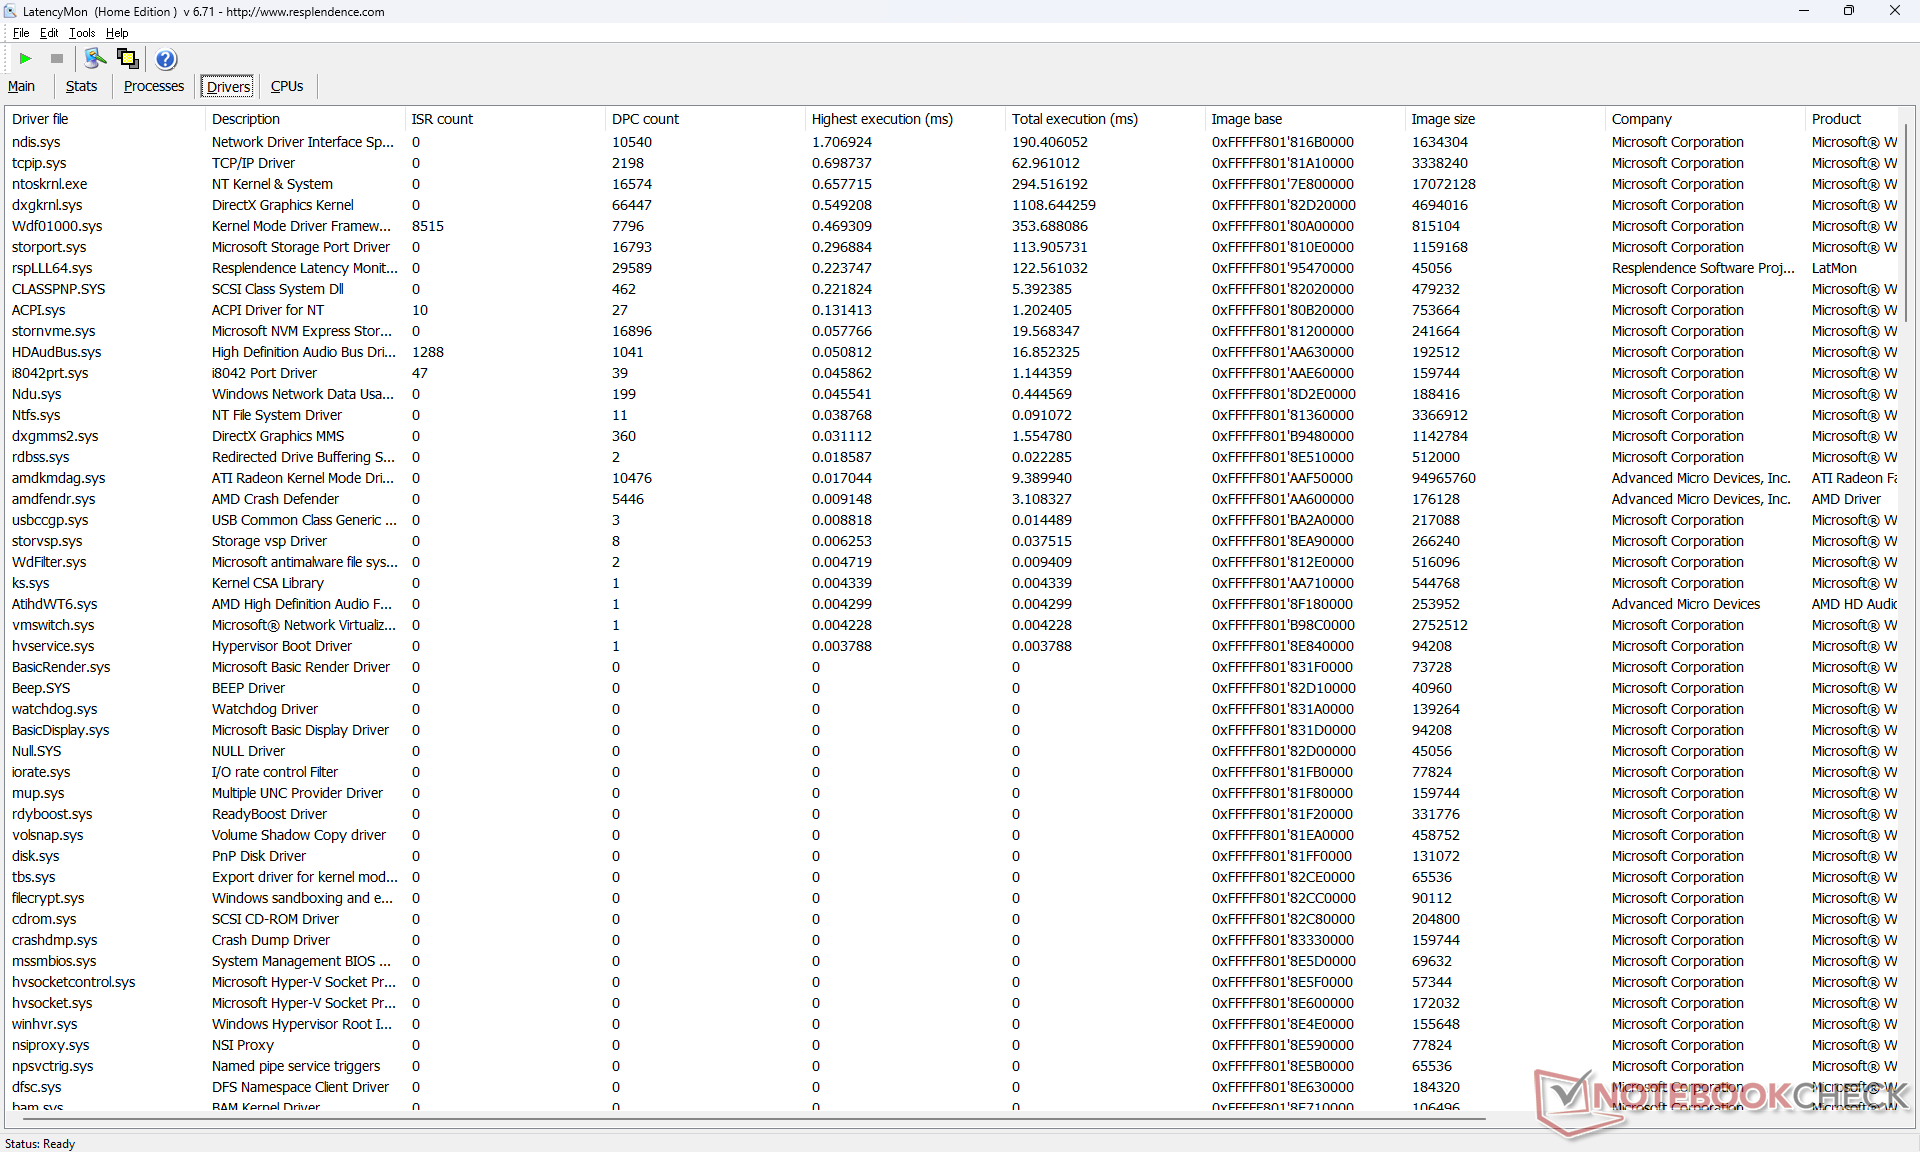
DPC-fördröjning
LatencyMon avslöjar mindre DPC-problem när flera webbläsarflikar öppnas på vår hemsida. uppspelning av 4K-video vid 60 FPS är annars perfekt och inga tappade bildrutor har registrerats.
| DPC Latencies / LatencyMon - interrupt to process latency (max), Web, Youtube, Prime95 | |
| Acer Aspire 5 Spin 14 | |
| Dell Inspiron 14 7435 2-in-1 | |
| LG Gram 14T90P | |
| HP Pavilion x360 14-dy0157ng | |
| Lenovo IdeaPad Flex 7i 14IAU7 | |
| Dell Inspiron 14 7420 2-in-1 | |
* ... mindre är bättre
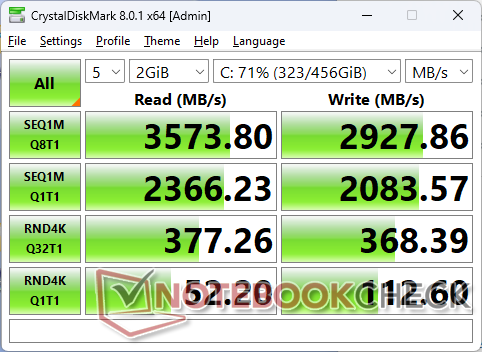
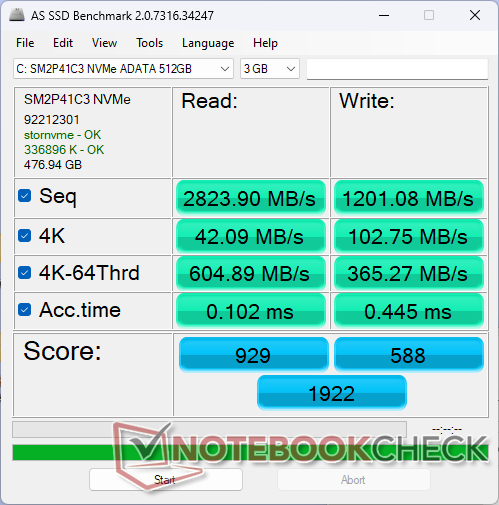
Lagringsenheter
Vår testenhet levereras med en budget 512 GB ADATA SM2P41C3 PCIe4 x4 NVMe SSD som erbjuder läs- och skrivhastigheter på upp till 3600 MB/s respektive 3000 MB/s. Det passar bra med Ryzen 5-processorn eftersom supersnabba SSD-enheter inte är till någon större nytta för målgruppen, som är vanliga hemanvändare eller studenter.
Det finns inga interna sekundära SSD-alternativ till skillnad från den dyrareLG Gram 14T90P konvertibel.

| Drive Performance rating - Percent | |
| Acer Aspire 5 Spin 14 | |
| LG Gram 14T90P | |
| Lenovo IdeaPad Flex 7i 14IAU7 | |
| HP Pavilion x360 14-dy0157ng | |
| Dell Inspiron 14 7420 2-in-1 | |
| Dell Inspiron 14 7435 2-in-1 | |
* ... mindre är bättre
Disk Throttling: DiskSpd Read Loop, Queue Depth 8
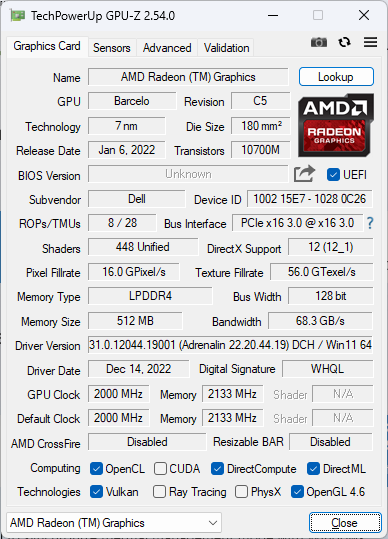
GPU-prestanda - Äldre Radeon RX Vega
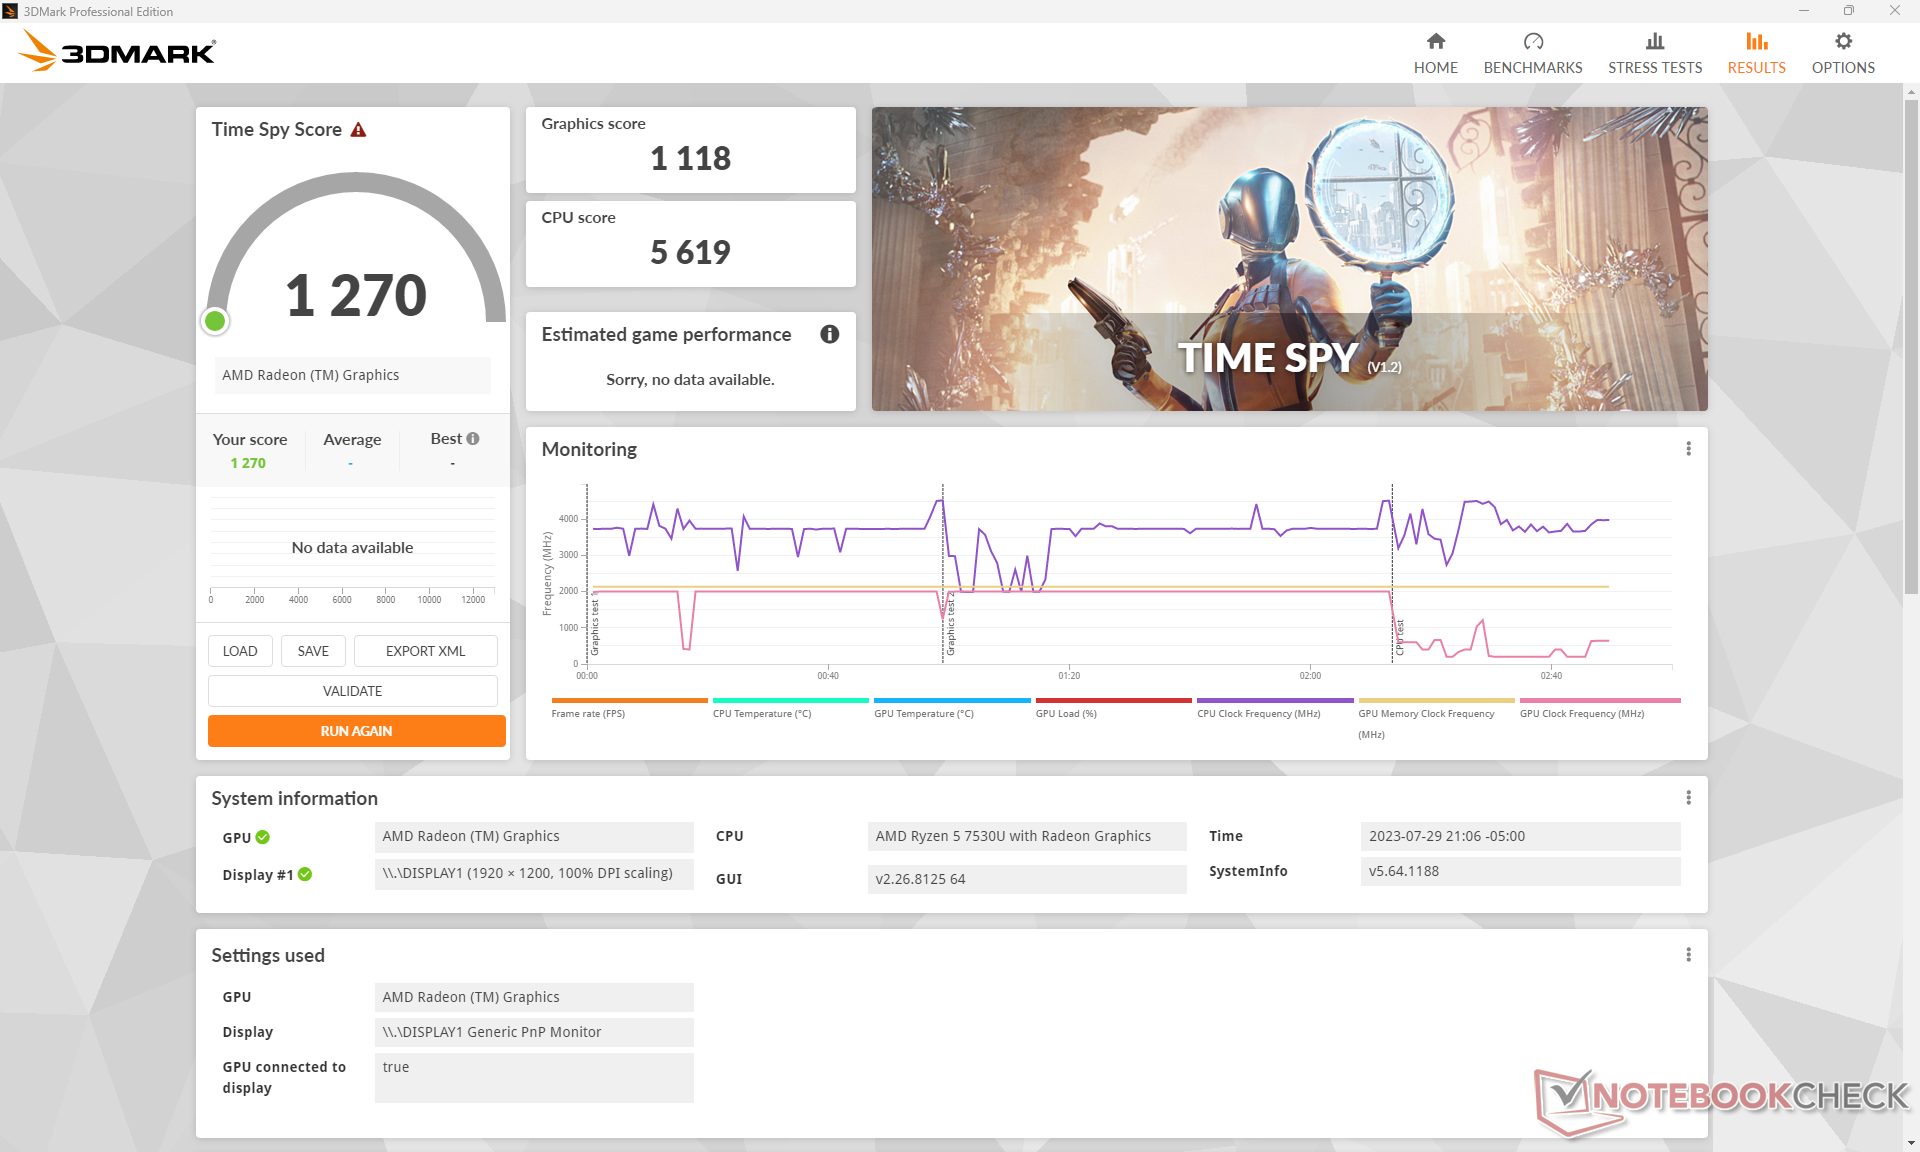
Ryzen 5 7530U och Ryzen 7 7730U körs med äldre integrerad Radeon RX Vega-grafik istället för den nyare Radeon 680M eller 780M vilket är synd eftersom de nyare lösningarna kan vara upp till 2x till 2,5x snabbare. Bortsett från mycket krävande spel som Dota 2 Reborn, kan systemet inte hantera moderna titlar, särskilt med tanke på dess begränsade 8 GB RAM-minne. F1 22, till exempel, kunde bara köras på mycket låga inställningar eftersom allt högre inställningar skulle krascha.
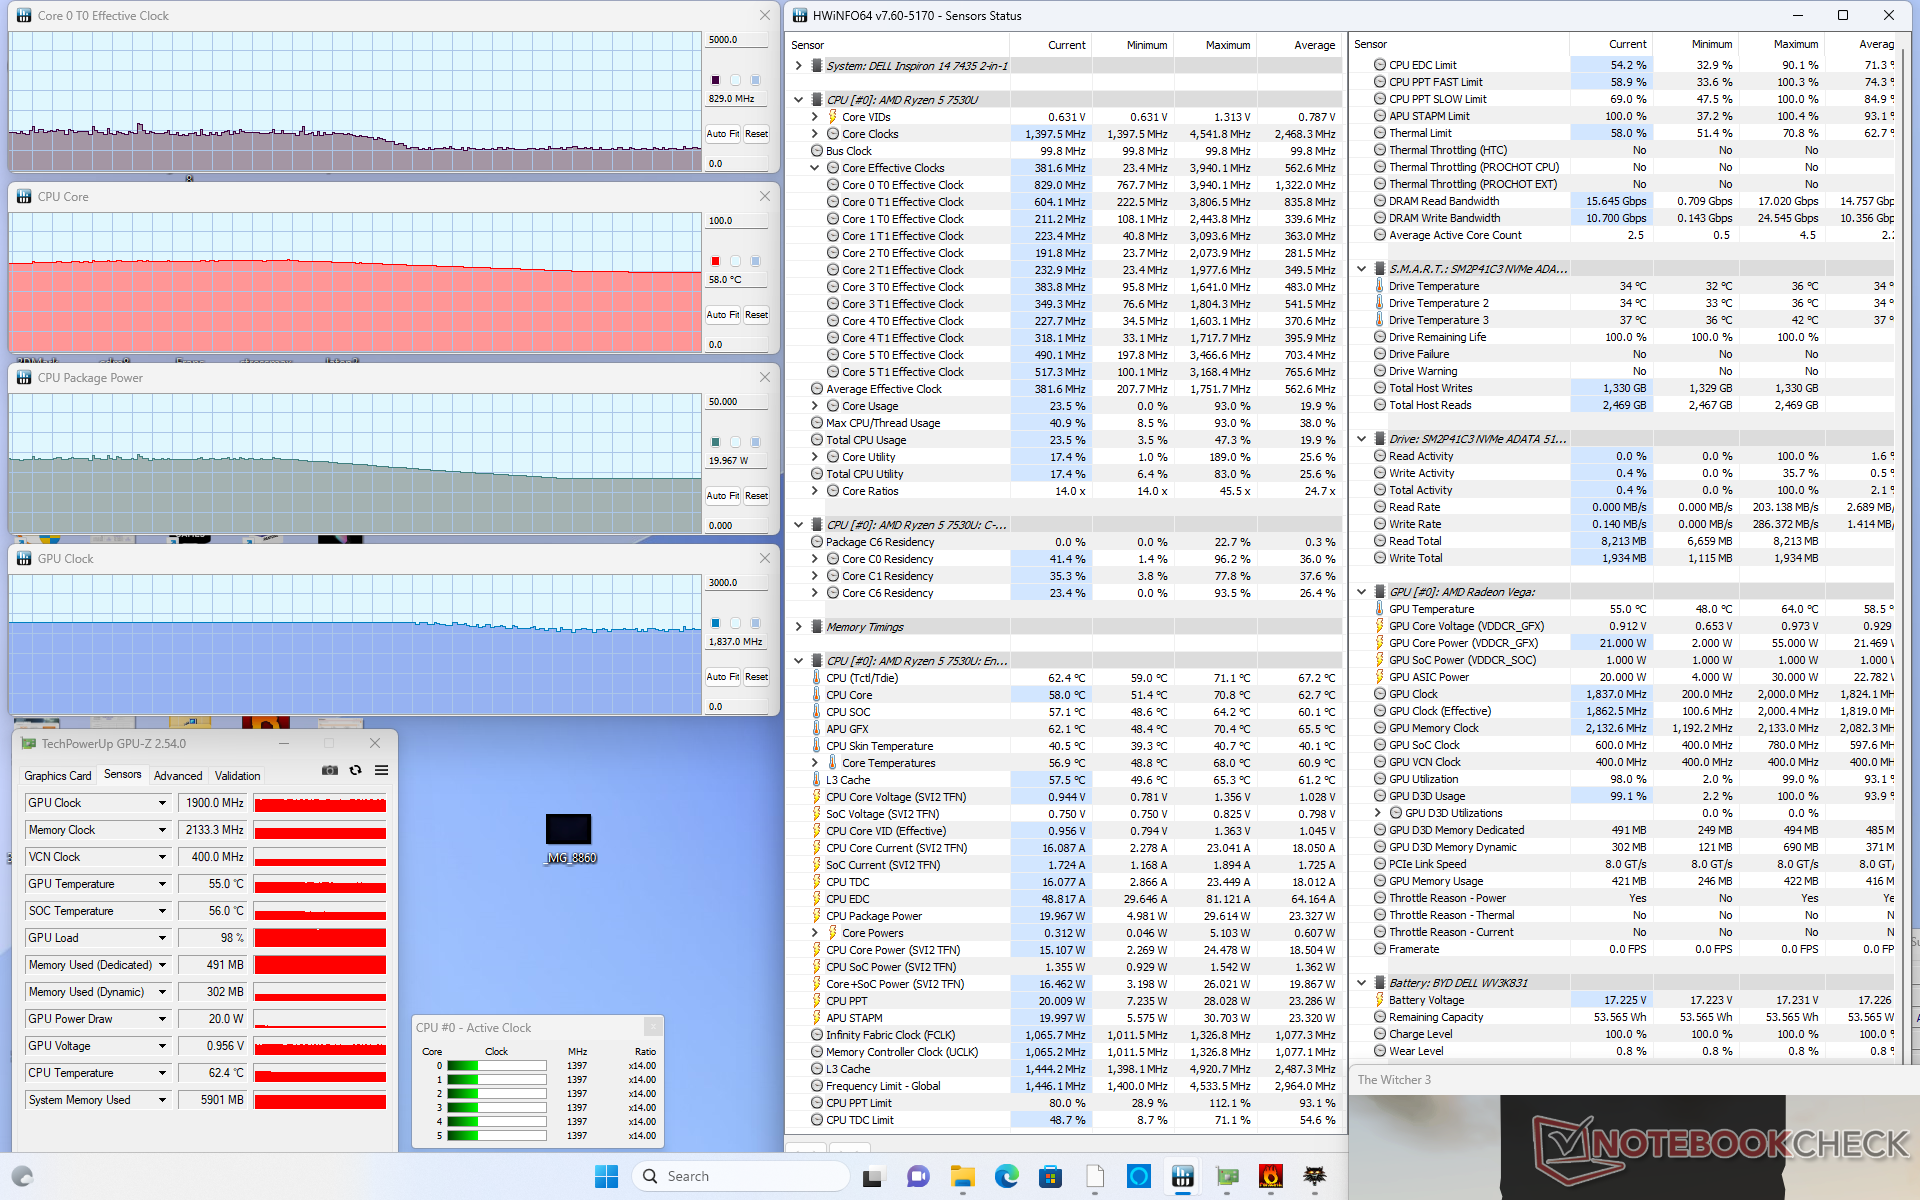
Bildfrekvensen sjönk periodvis till mitten av 50-talet innan den hoppade tillbaka upp till de höga 60-talet när den gick på tomgång på Witcher 3. Nedgångarna inträffar med jämna mellanrum, vilket framgår av vår FPS-graf nedan, vilket tyder på dålig hantering av aktiva bakgrundsprogram.
Den totala prestandan minskar med cirka 10 procent om du kör i balanserat läge, vilket framgår av vår 3DMark 11-tabell nedan.
| Kraftprofil | Grafisk poäng | Poäng för fysik | Kombinerat resultat |
| Batteri | 5798 (-4%) | 11906 (-5%) | 4161 (-6%) |
| Balanserad | 5472 (-9%) | 10908 (-13%) | 4195 (-5%) |
| Prestation | 6024 | 12492 | 4419 |
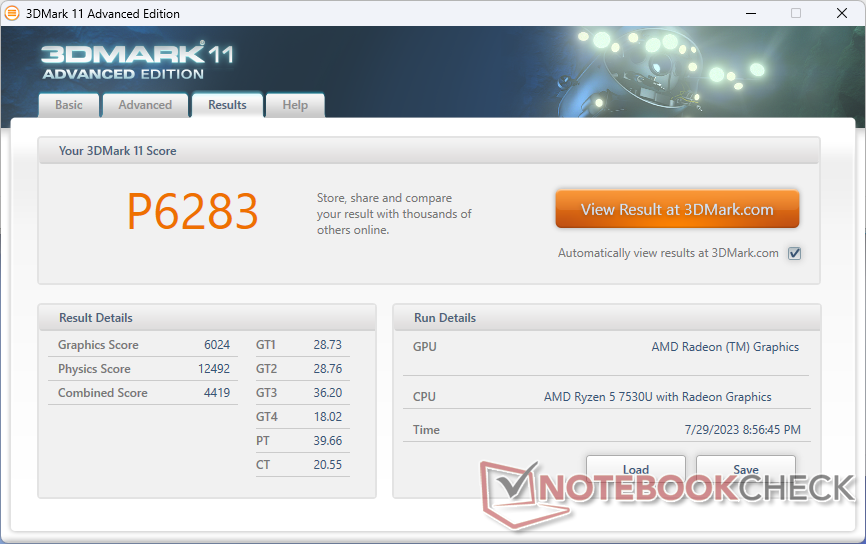
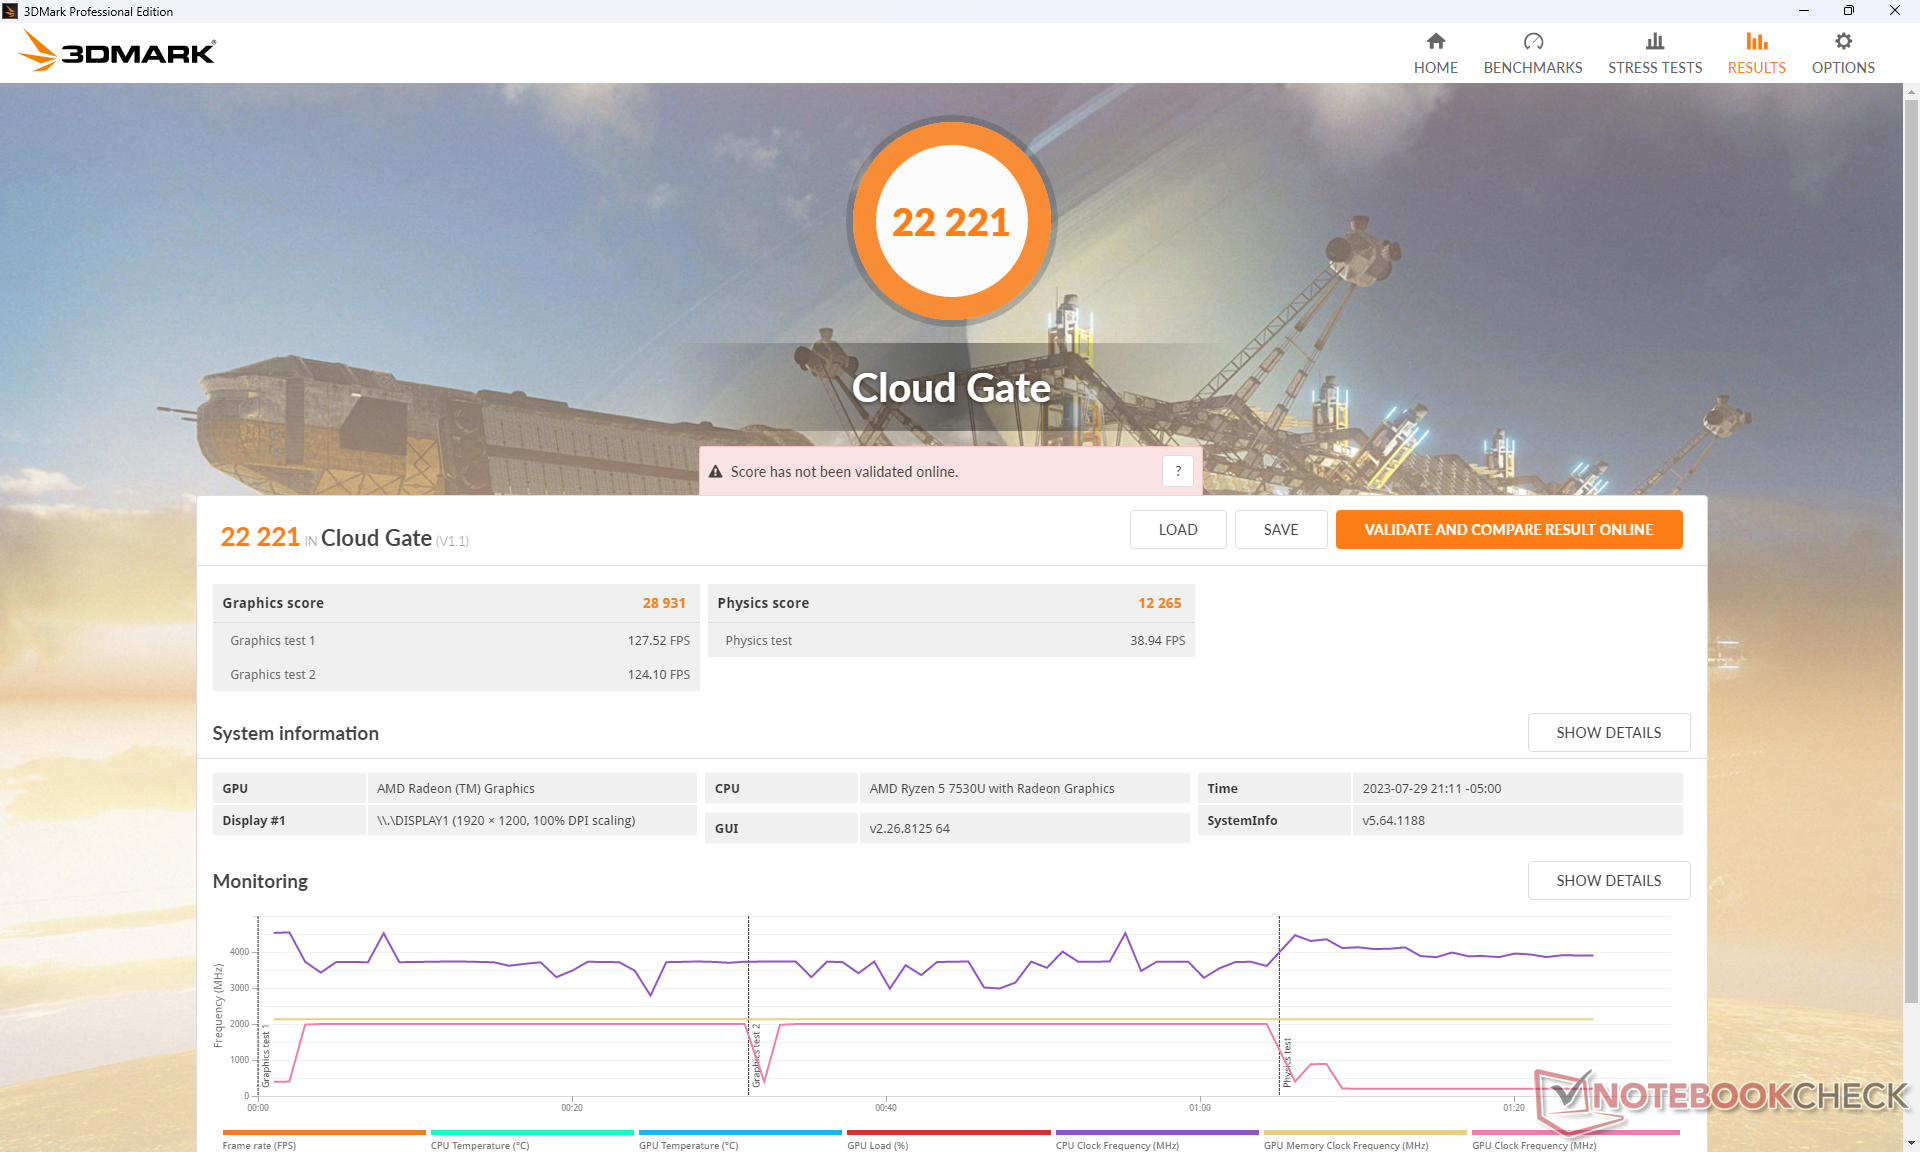
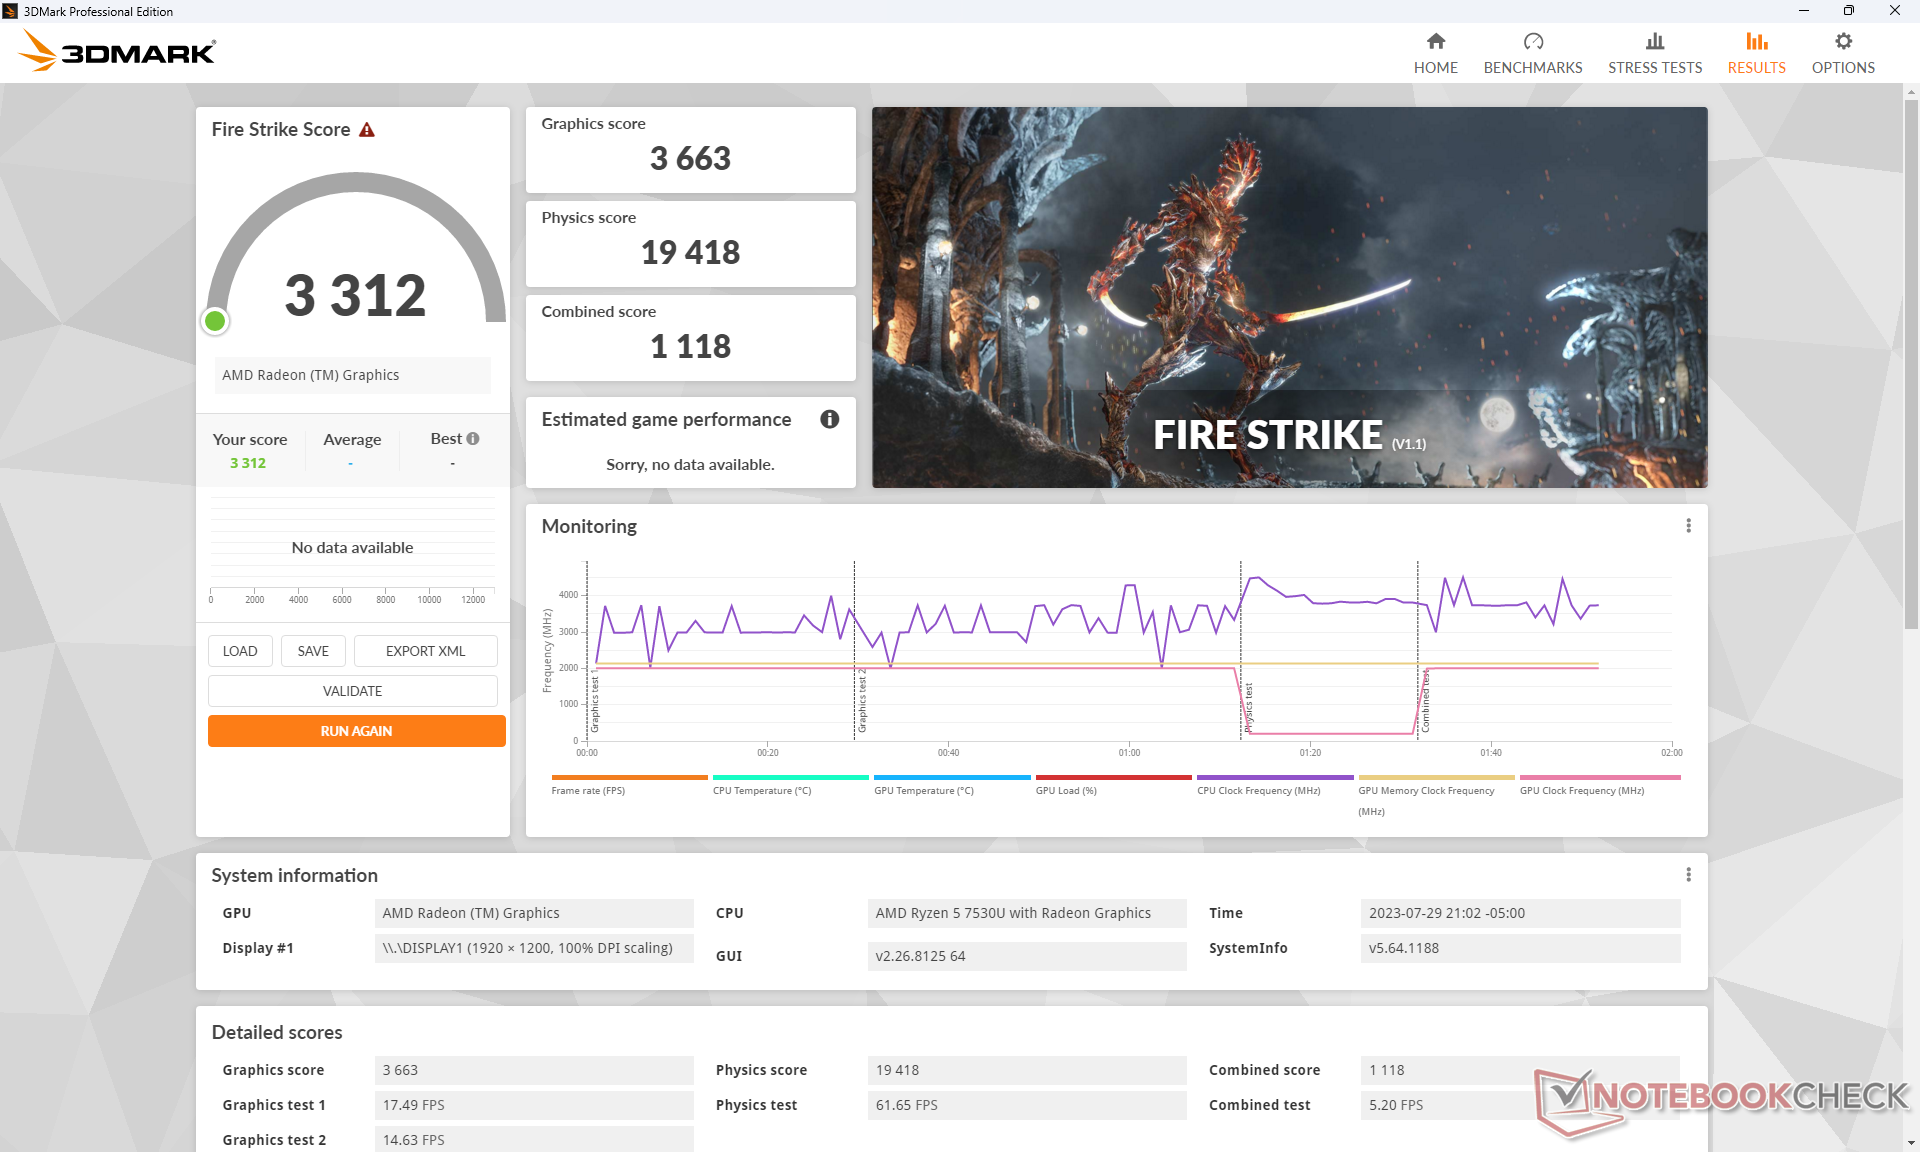
| 3DMark 11 Performance | 6283 poäng | |
| 3DMark Cloud Gate Standard Score | 22221 poäng | |
| 3DMark Fire Strike Score | 3312 poäng | |
| 3DMark Time Spy Score | 1270 poäng | |
Hjälp | ||
| F1 22 - 1280x720 Ultra Low Preset AA:T AF:16x | |
| Dell Latitude 9440 2-in-1 | |
| Lenovo ThinkPad X1 Yoga G8 i7-1355U | |
| Genomsnitt AMD Radeon RX Vega 7 (43.6 - 80.8, n=11) | |
| Dell Inspiron 14 7435 2-in-1 | |
| Tiny Tina's Wonderlands - 1280x720 Lowest Preset (DX12) | |
| Genomsnitt AMD Radeon RX Vega 7 (49.7 - 70.4, n=7) | |
| Dell Inspiron 14 7435 2-in-1 | |
| Dell Latitude 9440 2-in-1 | |
| Lenovo ThinkPad X1 Yoga G8 i7-1355U | |
Witcher 3 FPS Chart
| låg | med. | hög | ultra | |
|---|---|---|---|---|
| GTA V (2015) | 107.7 | 25.7 | 10.2 | |
| The Witcher 3 (2015) | 76 | 21.5 | 14.5 | |
| Dota 2 Reborn (2015) | 107.4 | 87.3 | 49.9 | 47.1 |
| Final Fantasy XV Benchmark (2018) | 35.1 | 17.5 | 12.1 | |
| X-Plane 11.11 (2018) | 37.4 | 29.5 | 26.4 | |
| Strange Brigade (2018) | 79.5 | 31.4 | 25.6 | 22.3 |
| Cyberpunk 2077 1.6 (2022) | 16.3 | 12.8 | 8.9 | 6.7 |
| Tiny Tina's Wonderlands (2022) | 26.5 | |||
| F1 22 (2022) |
Utsläpp
Buller från systemet
Den interna fläkten tenderar att pulsera mellan viloläge och 33,3 dB(A) när du surfar på webben eller strömmar video. Ökningen av fläktljudet tenderar att vara plötslig och skarp istället för gradvis, vilket tyvärr gör ljudet mer märkbart.
Konsekvent hög belastning, t.ex. spel, ger upphov till ett fläktljud på nästan 41 dB(A) i Performance-läget. I balanserat läge minskar fläktljudet något till 39,8 dB(A).
Vi kunde notera ett litet vinande från spolen eller elektroniska ljud från vår testenhet och därför är den aldrig riktigt tyst även när fläkten är på tomgång. Det låga 40 dB(A)-intervallet är tystare än Acer Aspire 5 Spin 14 medan det är högre änLG Gram 14T90P.
Ljudnivå
| Låg belastning |
| 23.2 / 23.2 / 23.2 dB(A) |
| Hög belastning |
| 33 / 41.3 dB(A) |
 | ||
30 dB tyst 40 dB(A) hörbar 50 dB(A) högt ljud |
||
min: | ||
| Dell Inspiron 14 7435 2-in-1 Vega 7, R5 7530U | Dell Inspiron 14 7420 2-in-1 Iris Xe G7 96EUs, i7-1255U, WDC PC SN530 SDBPMPZ-512G | Lenovo IdeaPad Flex 7i 14IAU7 Iris Xe G7 96EUs, i7-1255U, Samsung PM9B1 512GB MZAL4512HBLU | Acer Aspire 5 Spin 14 Iris Xe G7 80EUs, i5-1335U, Micron 2450 512GB MTFDKBA512TFK | LG Gram 14T90P Iris Xe G7 80EUs, i5-1135G7, Samsung SSD PM981a MZVLB512HBJQ | HP Pavilion x360 14-dy0157ng Iris Xe G7 80EUs, i5-1135G7, Toshiba KBG40ZNV512G | |
|---|---|---|---|---|---|---|
| Noise | -3% | 1% | -22% | 0% | -10% | |
| av / miljö * (dB) | 22.8 | 23.1 -1% | 23.3 -2% | 26 -14% | 25.4 -11% | 27 -18% |
| Idle Minimum * (dB) | 23.2 | 24.7 -6% | 23.3 -0% | 27.7 -19% | 25.5 -10% | 27 -16% |
| Idle Average * (dB) | 23.2 | 24.7 -6% | 23.3 -0% | 27.7 -19% | 25.5 -10% | 27 -16% |
| Idle Maximum * (dB) | 23.2 | 24.7 -6% | 23.3 -0% | 29.7 -28% | 25.5 -10% | 27 -16% |
| Load Average * (dB) | 33 | 27.7 16% | 34.3 -4% | 46.3 -40% | 28.3 14% | 38.3 -16% |
| Witcher 3 ultra * (dB) | 40.9 | 45.1 -10% | 37.8 8% | 35 14% | ||
| Load Maximum * (dB) | 41.3 | 45.1 -9% | 37.8 8% | 45.4 -10% | 35 15% | 33.2 20% |
* ... mindre är bättre
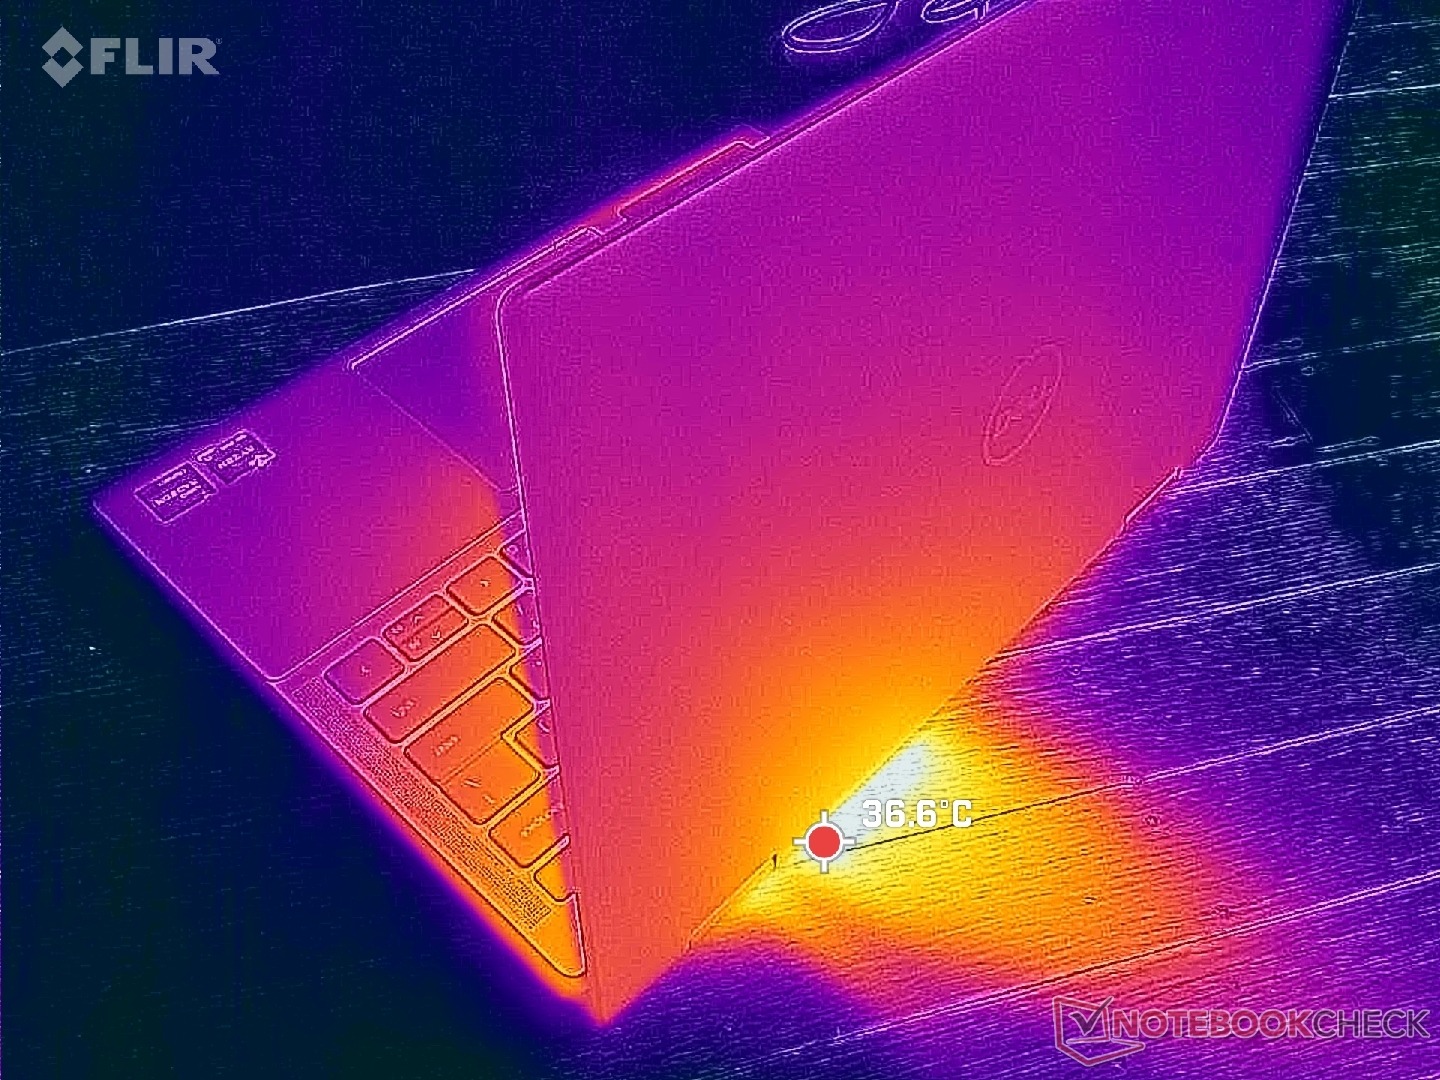
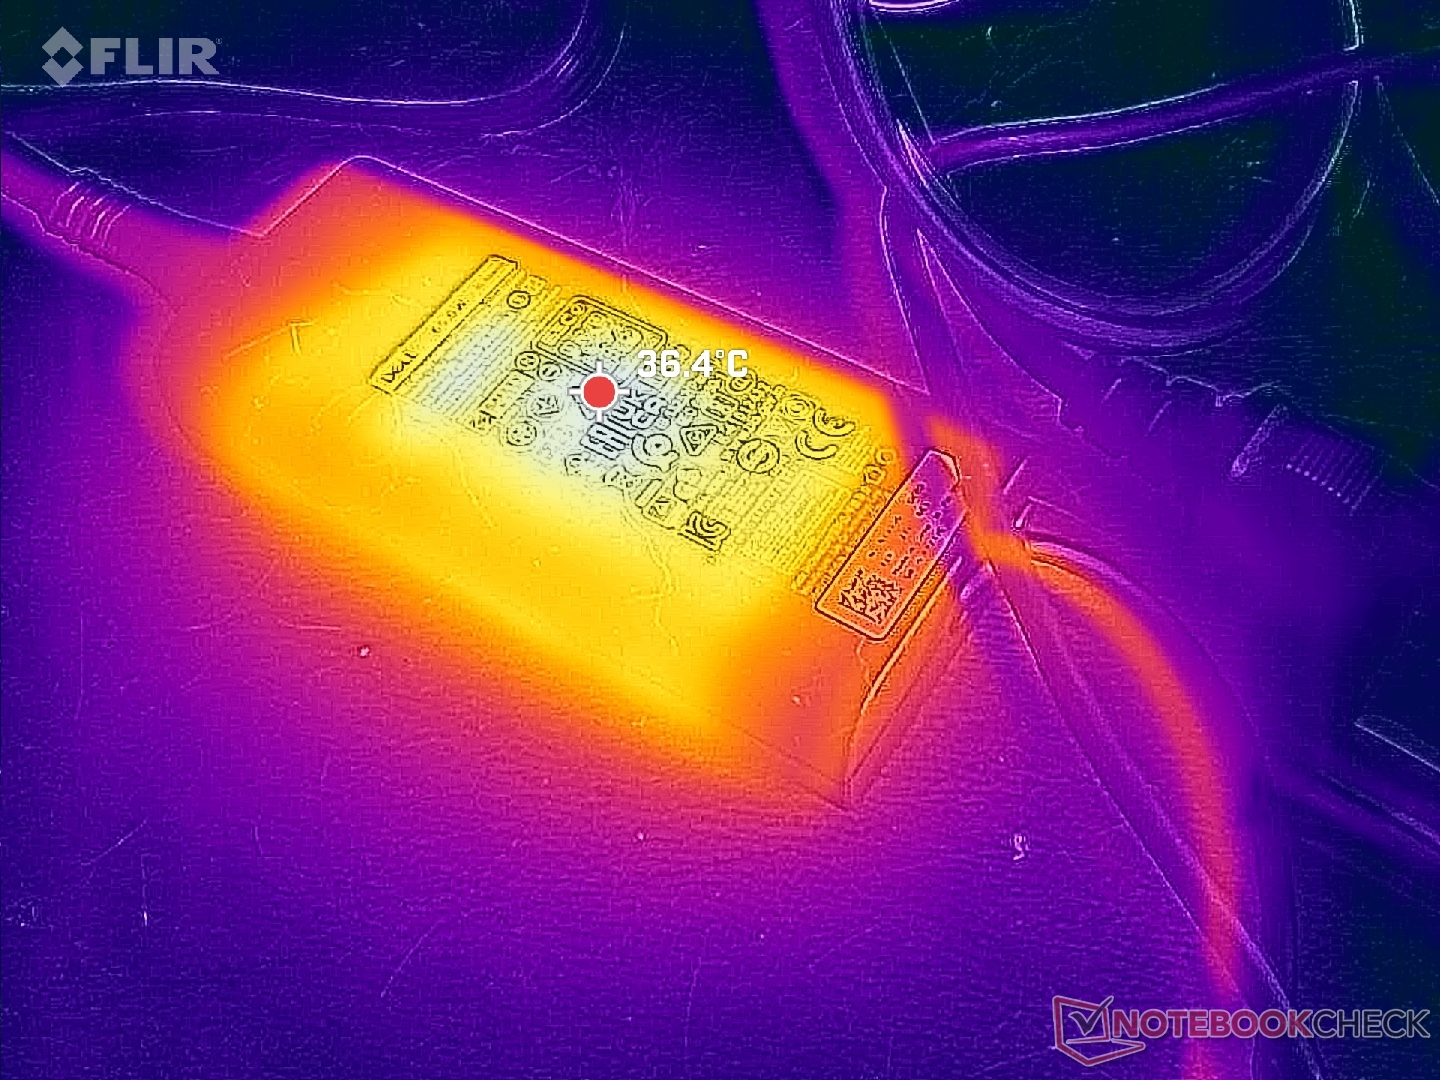
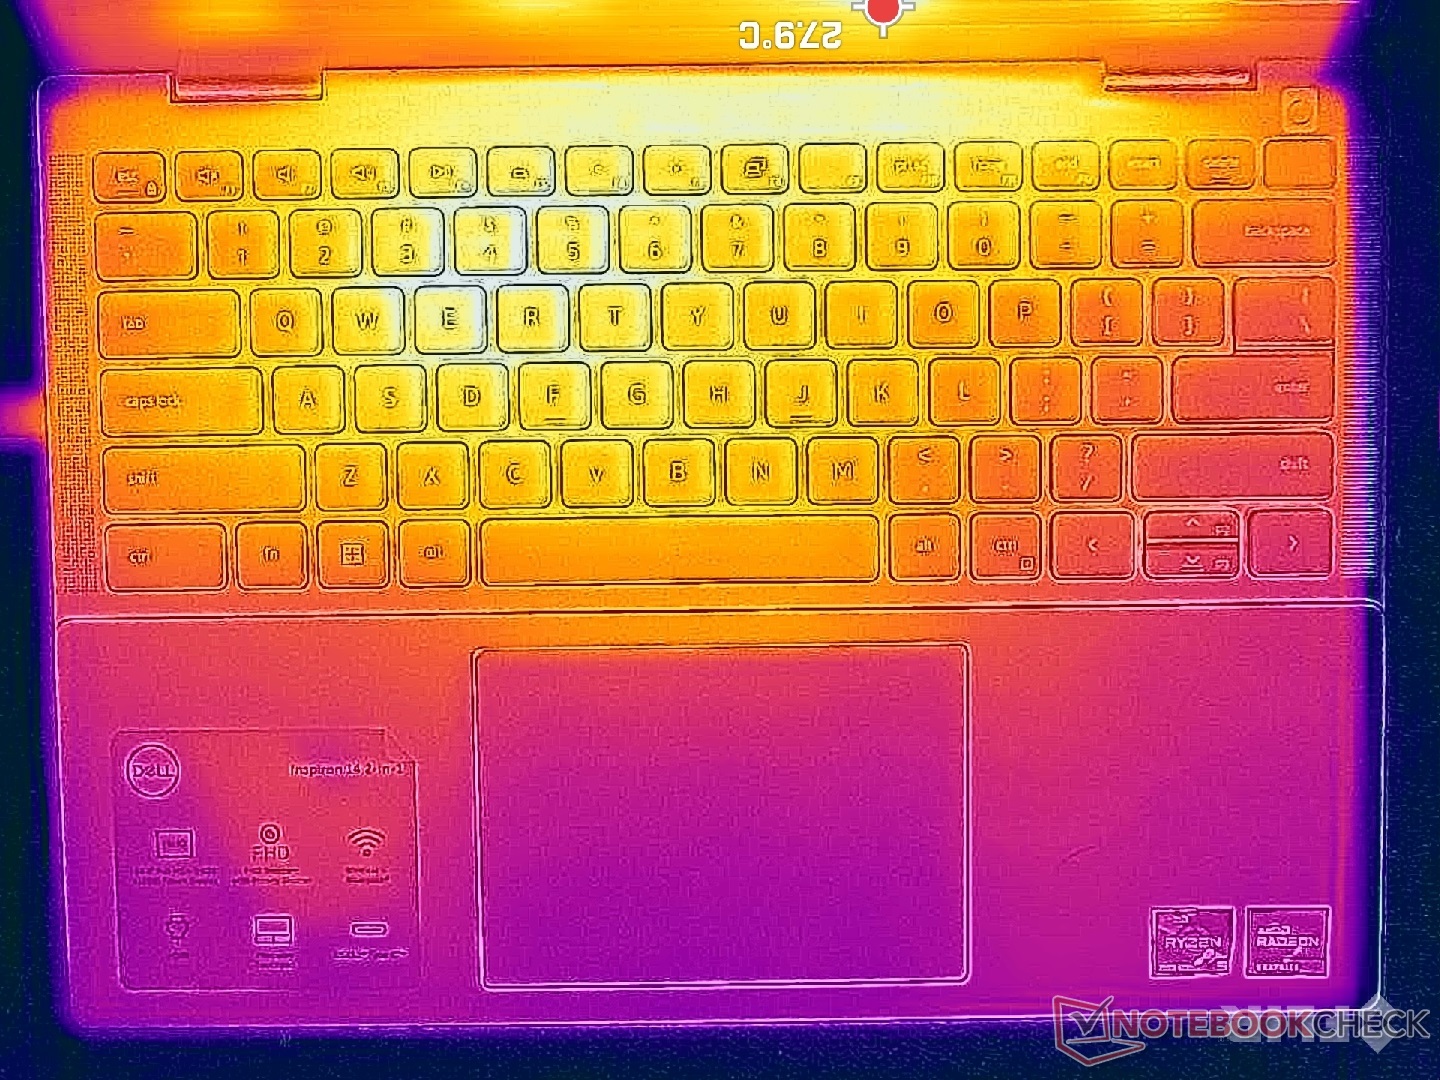
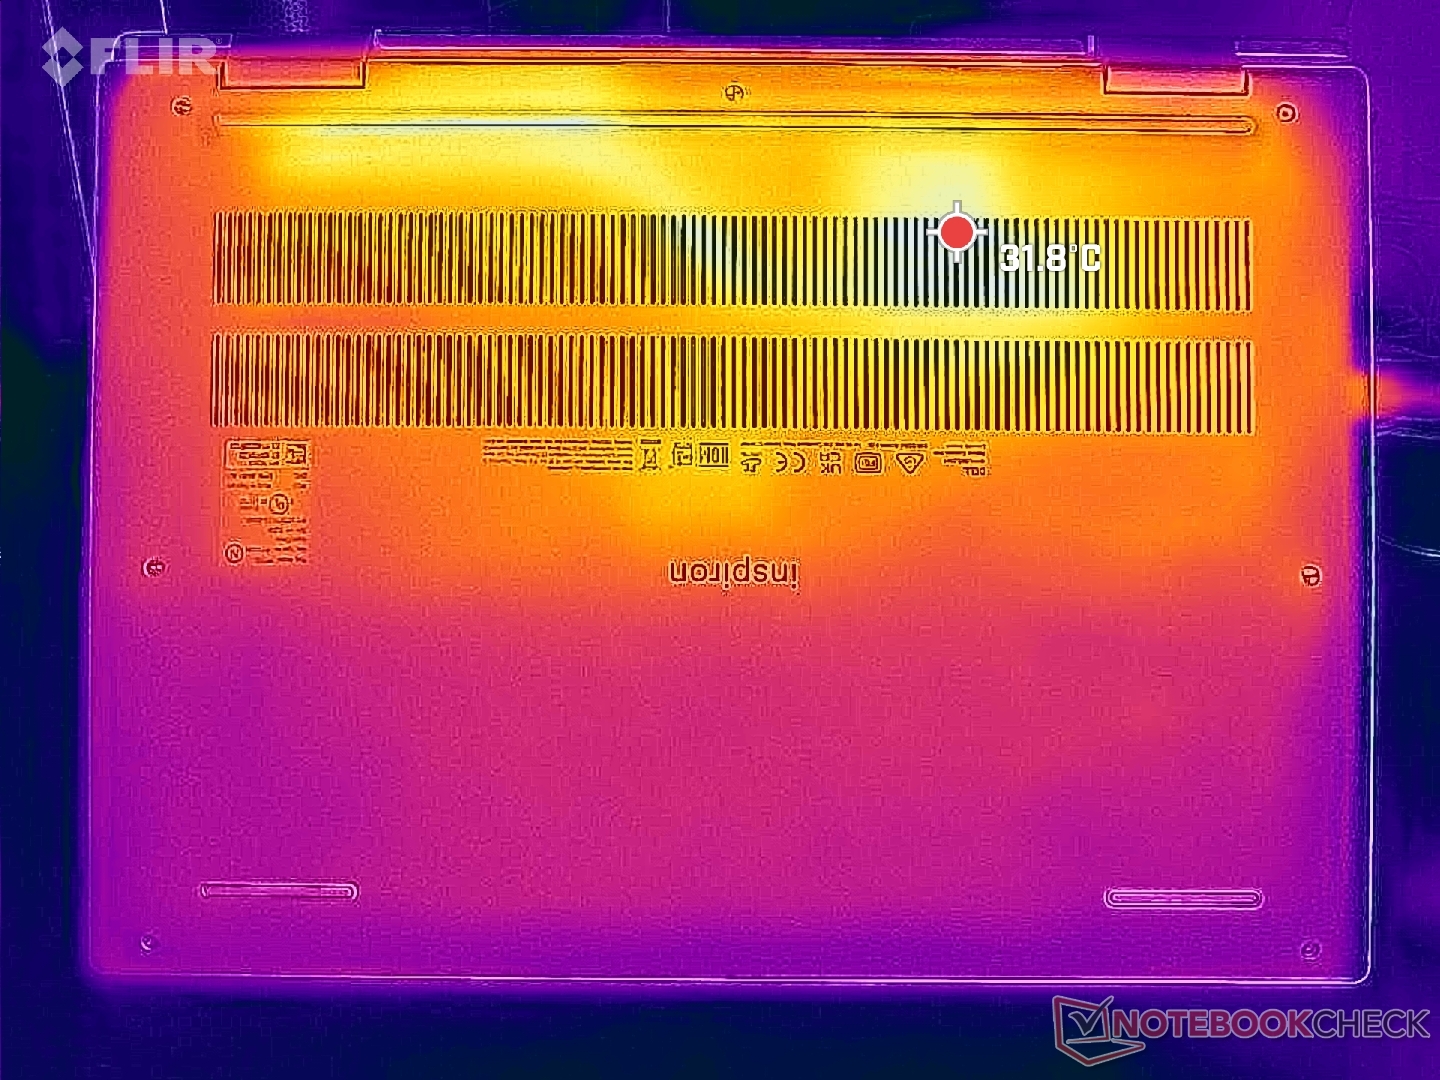
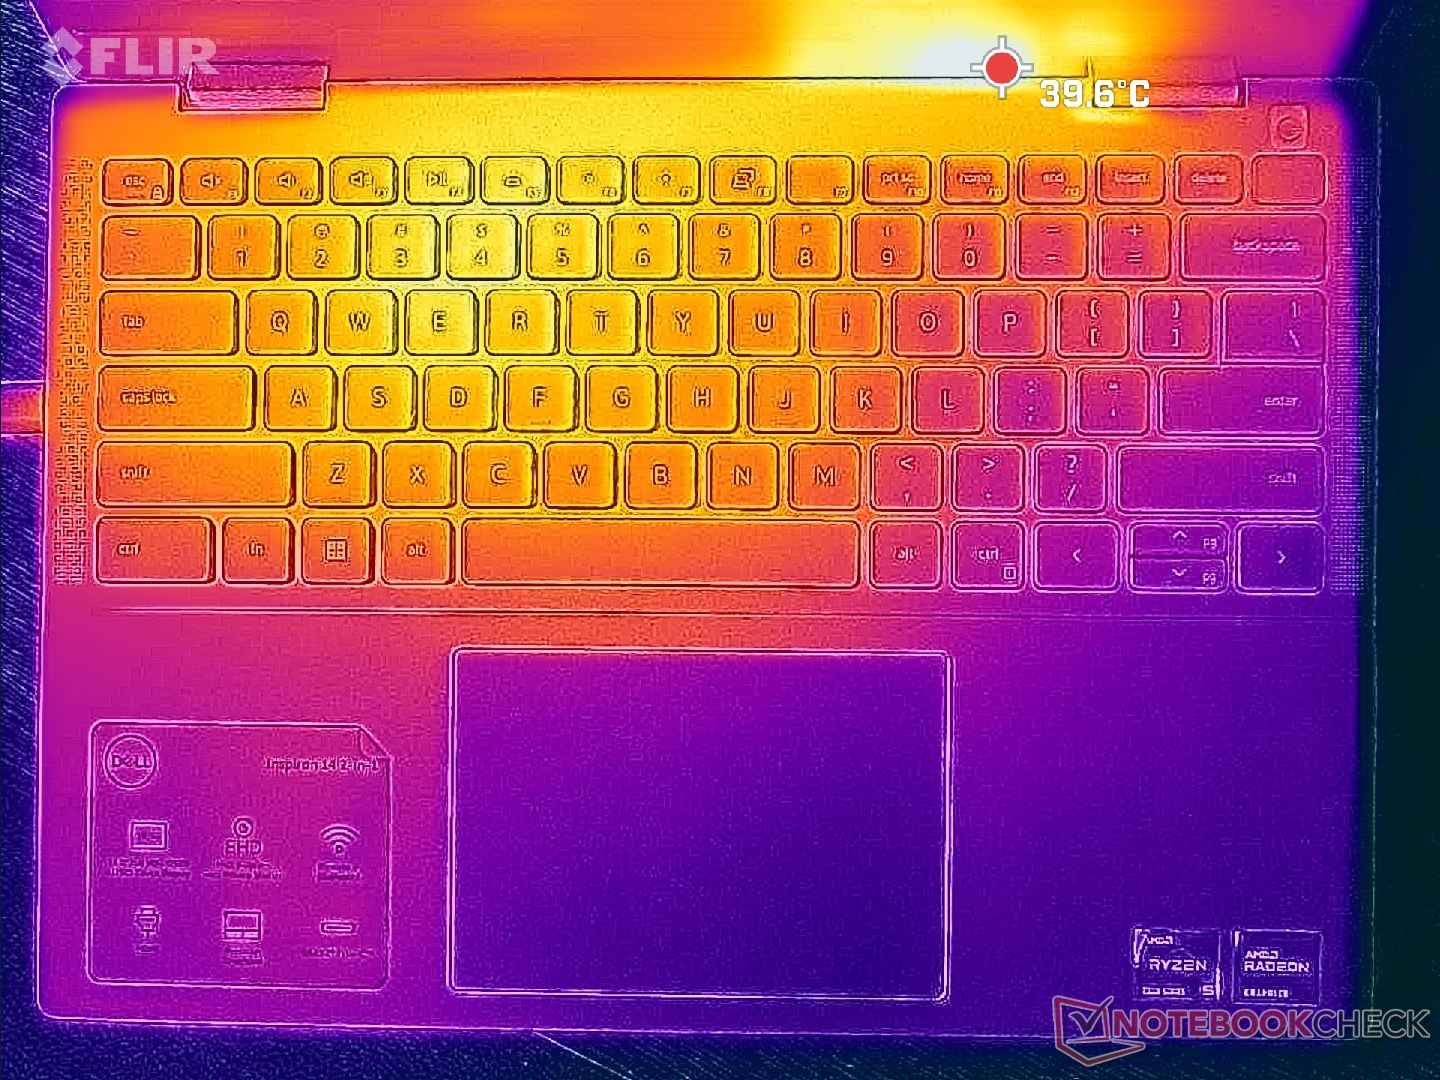
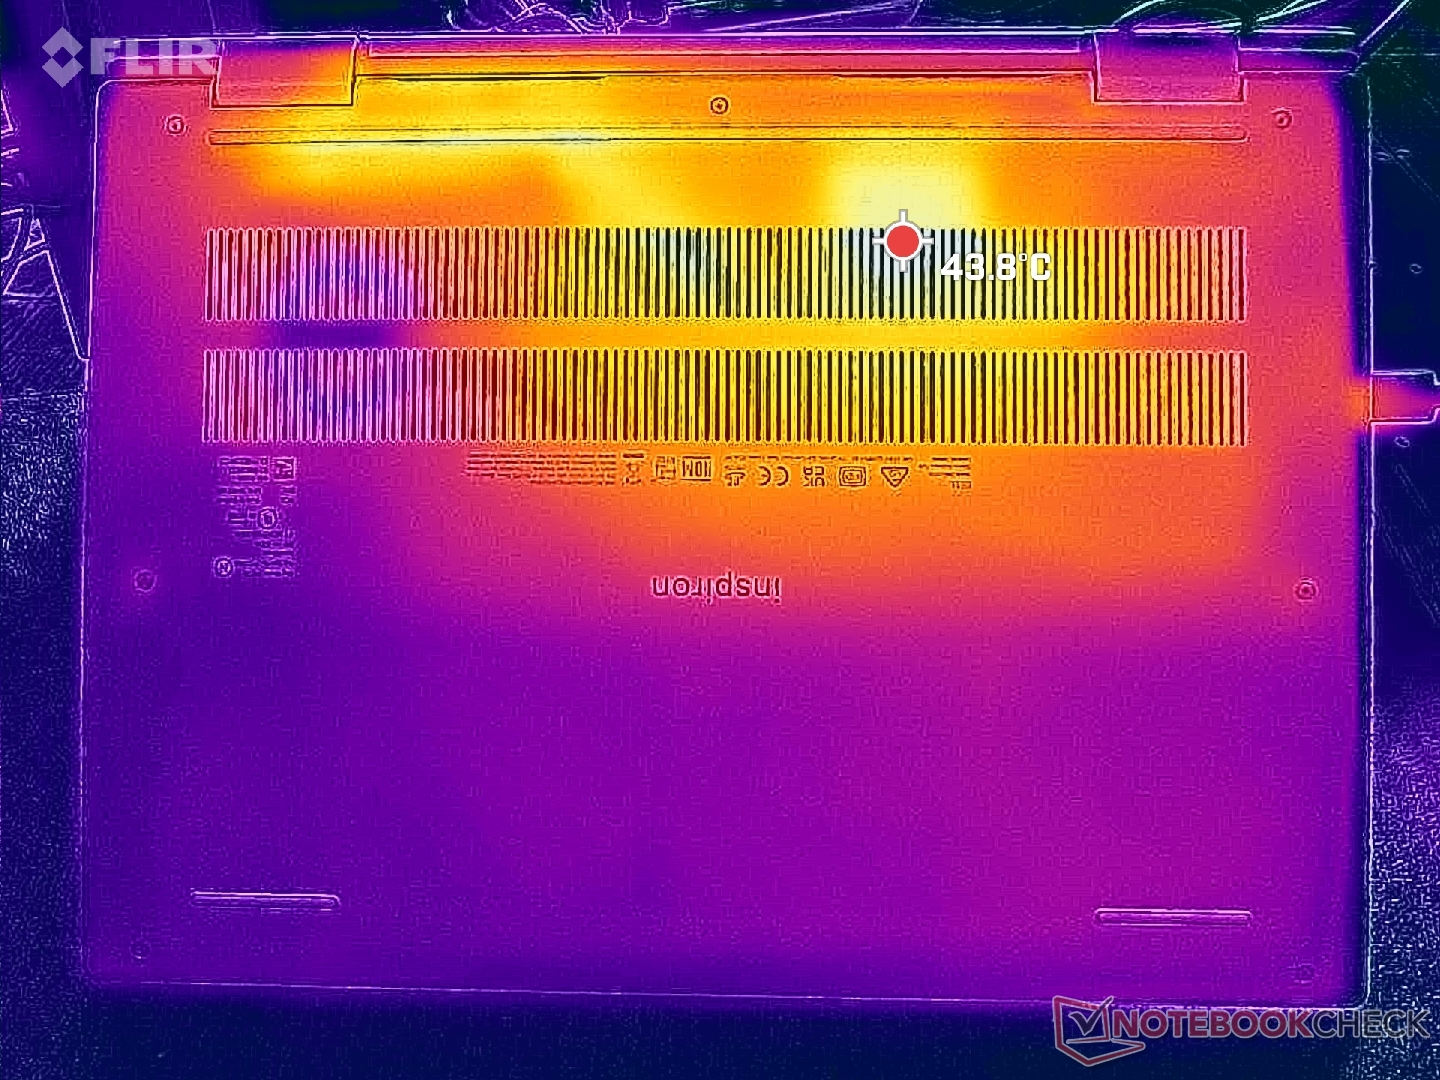
Temperatur
Yttemperaturerna är svalare än vad vi registrerade på förra årets Inspiron 14 7620 2-in-1. Vid belastning, till exempel, skulle hot spots på ovansidan och undersidan närma sig bara 36 C respektive 39 C, jämfört med 46 C på förra årets modell. Det höga 30 C-intervallet är jämförbart med modeller som IdeaPad Flex 7i 14.
Nätadaptern skulle också bli svalare med ca 36 C istället för 46 C.
(+) Den maximala temperaturen på ovansidan är 35.2 °C / 95 F, jämfört med genomsnittet av 35.4 °C / 96 F , allt från 19.6 till 60 °C för klassen Convertible.
(+) Botten värms upp till maximalt 38.2 °C / 101 F, jämfört med genomsnittet av 36.9 °C / 98 F
(+) Vid tomgångsbruk är medeltemperaturen för ovansidan 28.7 °C / 84 F, jämfört med enhetsgenomsnittet på 30.3 °C / ### class_avg_f### F.
(+) Handledsstöden och pekplattan är kallare än hudtemperaturen med maximalt 26.6 °C / 79.9 F och är därför svala att ta på.
(±) Medeltemperaturen för handledsstödsområdet på liknande enheter var 28 °C / 82.4 F (+1.4 °C / 2.5 F).
| Dell Inspiron 14 7435 2-in-1 AMD Ryzen 5 7530U, AMD Radeon RX Vega 7 | Dell Inspiron 14 7420 2-in-1 Intel Core i7-1255U, Intel Iris Xe Graphics G7 96EUs | Lenovo IdeaPad Flex 7i 14IAU7 Intel Core i7-1255U, Intel Iris Xe Graphics G7 96EUs | Acer Aspire 5 Spin 14 Intel Core i5-1335U, Intel Iris Xe Graphics G7 80EUs | LG Gram 14T90P Intel Core i5-1135G7, Intel Iris Xe Graphics G7 80EUs | HP Pavilion x360 14-dy0157ng Intel Core i5-1135G7, Intel Iris Xe Graphics G7 80EUs | |
|---|---|---|---|---|---|---|
| Heat | -2% | 11% | -14% | 3% | -2% | |
| Maximum Upper Side * (°C) | 35.2 | 38.2 -9% | 35.4 -1% | 41.7 -18% | 41.6 -18% | 38.9 -11% |
| Maximum Bottom * (°C) | 38.2 | 45.6 -19% | 38.8 -2% | 54.4 -42% | 46.2 -21% | 40.3 -5% |
| Idle Upper Side * (°C) | 31.2 | 27.4 12% | 22.6 28% | 30.4 3% | 22.6 28% | 31.8 -2% |
| Idle Bottom * (°C) | 30.4 | 28.4 7% | 24.2 20% | 29.8 2% | 23.2 24% | 27.4 10% |
* ... mindre är bättre
Stresstest
När vi körde Prime95 ökade processorn till 3,8 GHz och 34 W under bara ett par sekunder innan den sjönk och stabiliserades på 2,7 GHz och 20 W. Kärntemperaturen förblev relativt sval på 66 C även under belastning, vilket är jämförbart med den Intel-drivna Inspiron 14 7420 2-in-1 under liknande förhållanden. Vi misstänker att de mer avancerade Ryzen 7 eller Core i7 SKUs skulle köra varmare än vad vi registrerade på vår bas Ryzen 5 konfiguration.
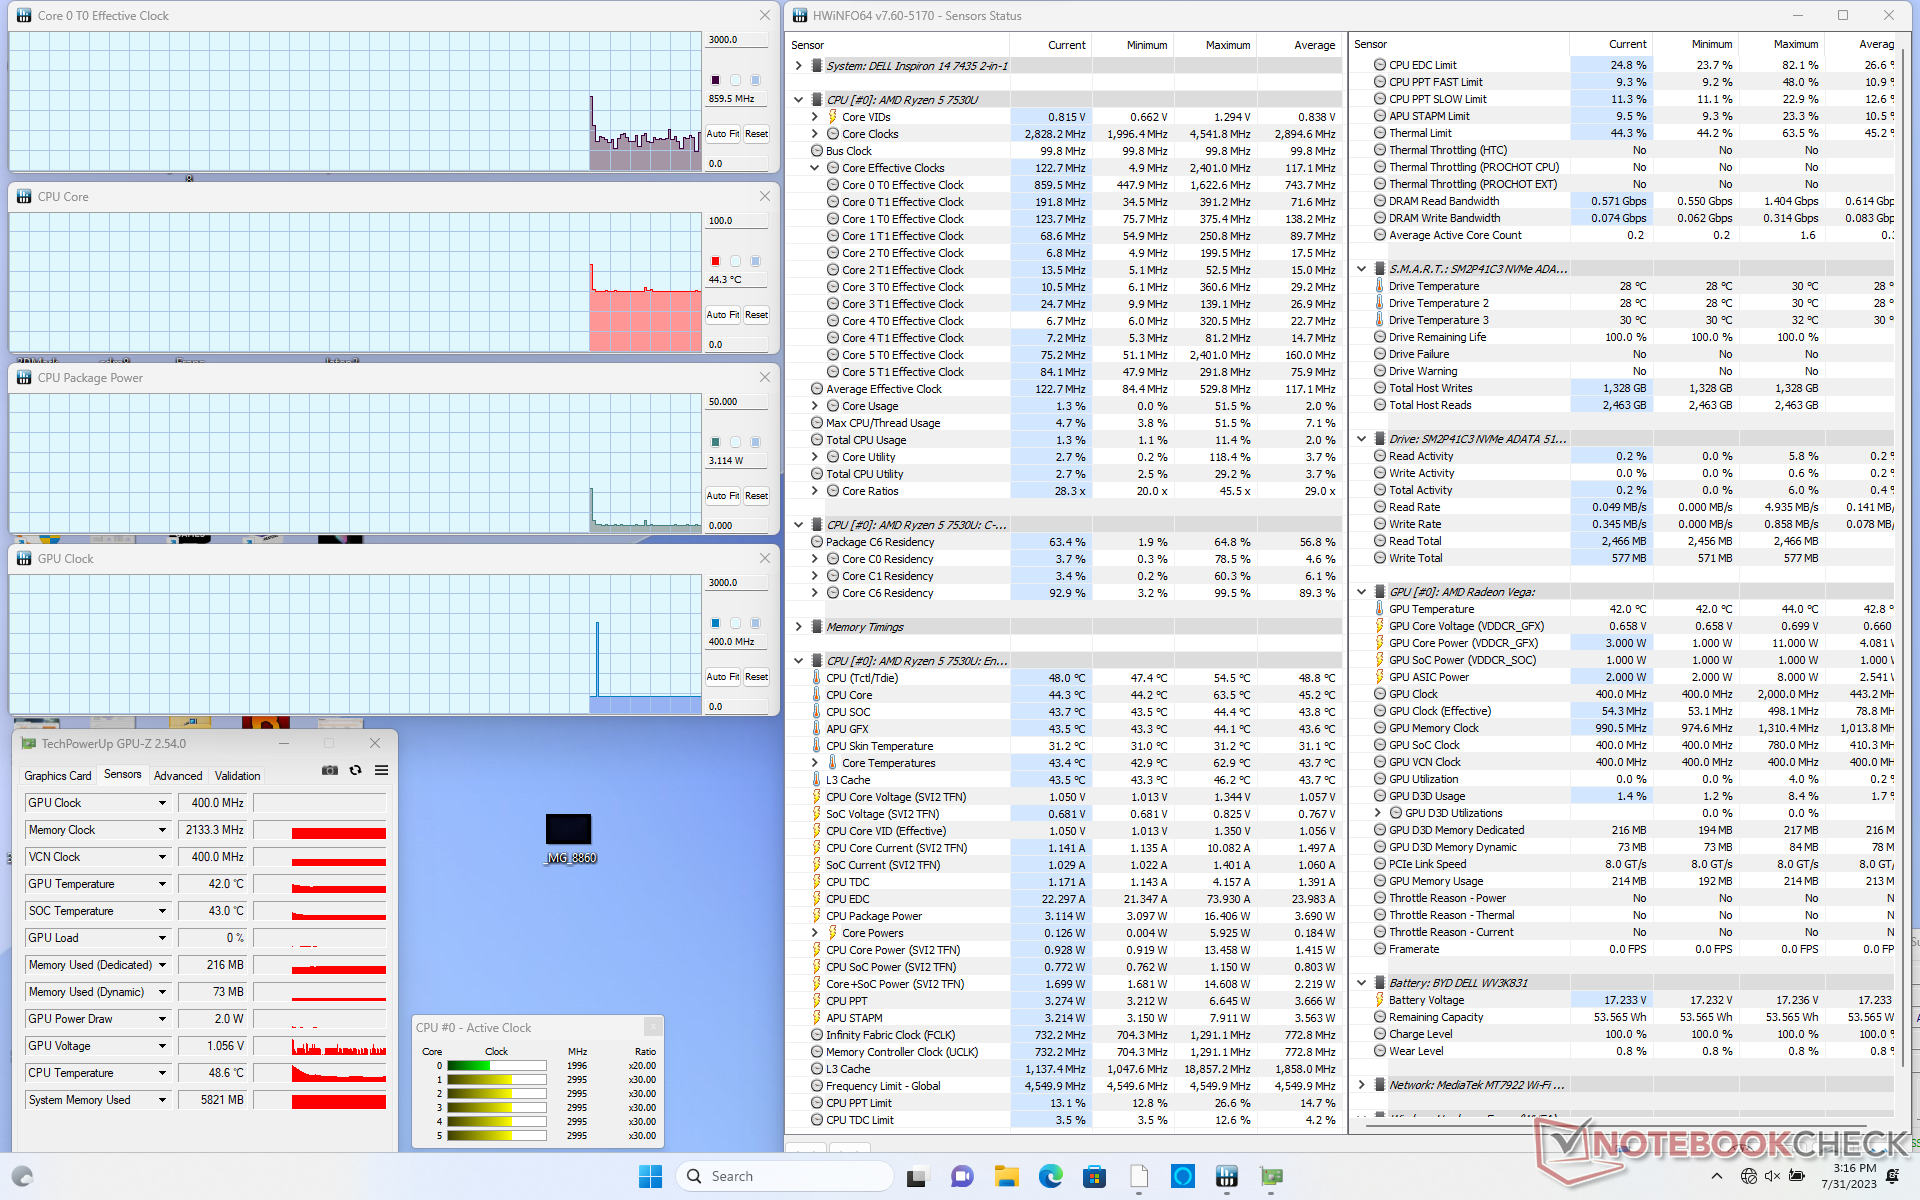
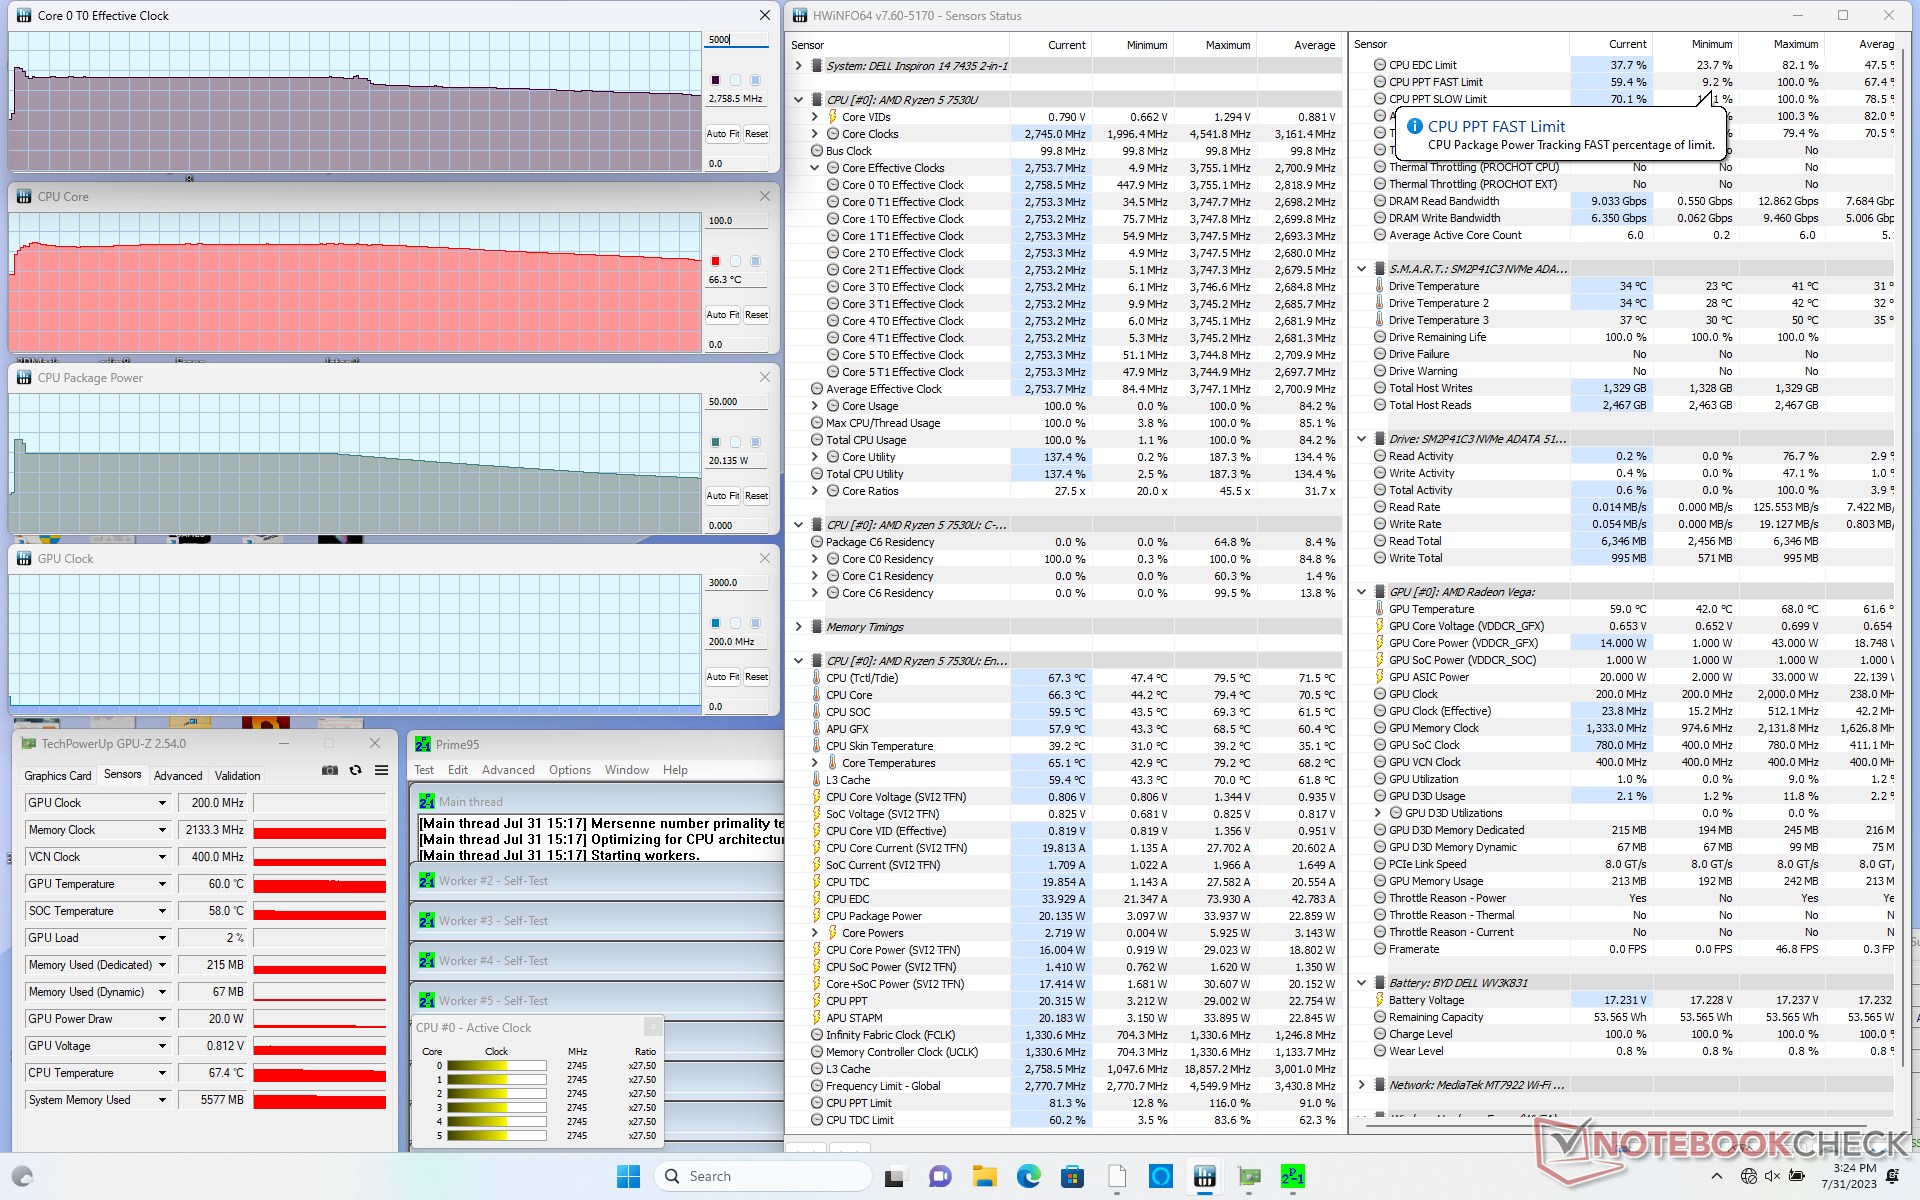
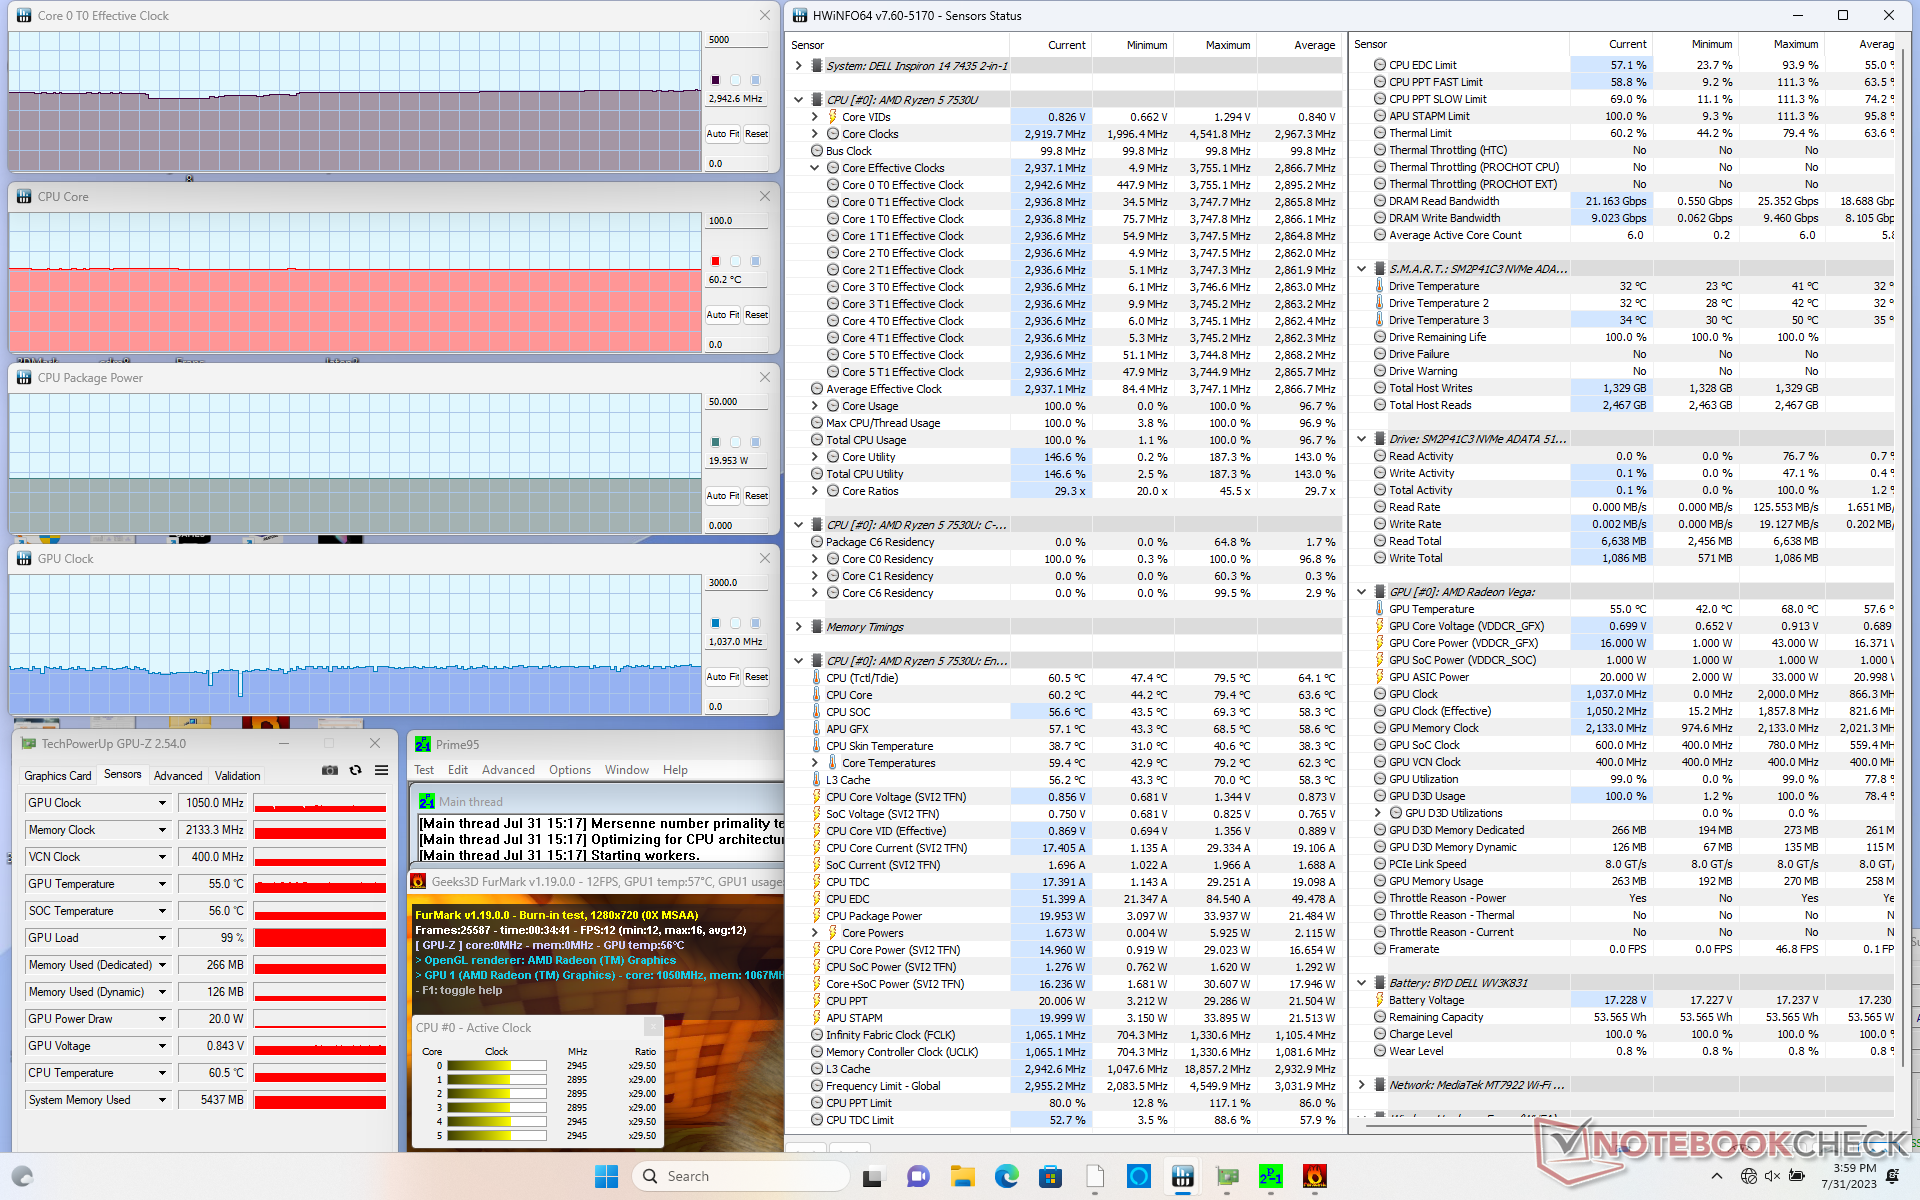
| CPU-klocka (GHz) | GPU-klocka (MHz) | Genomsnittlig CPU-temperatur (°C) | |
| System i viloläge | -- | -- | 44 |
| Prime95 Stress | 2.7 | -- | 66 |
| Prime95 + FurMark Stress | 2.9 | 1050 | 60 |
| Witcher 3 Stress | 0,8 | 1900 | 58 |
Högtalare
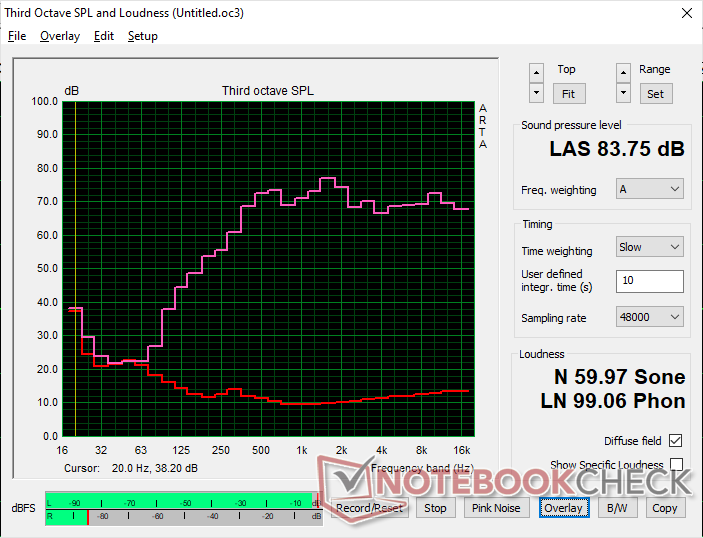
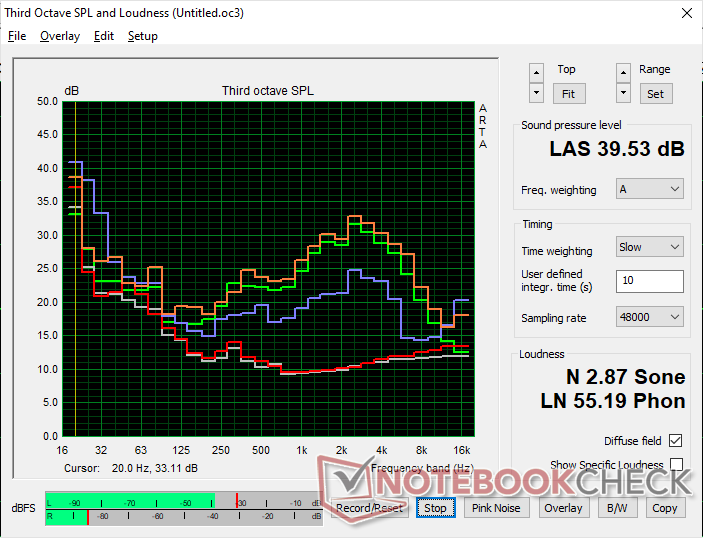
Dell Inspiron 14 7435 2-in-1 ljudanalys
(+) | högtalare kan spela relativt högt (83.8 dB)
Bas 100 - 315 Hz
(-) | nästan ingen bas - i genomsnitt 18.8% lägre än medianen
(±) | linjäriteten för basen är genomsnittlig (9.9% delta till föregående frekvens)
Mellan 400 - 2000 Hz
(+) | balanserad mellan - endast 3.5% från medianen
(+) | mids är linjära (6.1% delta till föregående frekvens)
Högsta 2 - 16 kHz
(+) | balanserade toppar - endast 1.2% från medianen
(+) | toppar är linjära (4.4% delta till föregående frekvens)
Totalt 100 - 16 000 Hz
(+) | det totala ljudet är linjärt (12.3% skillnad mot median)
Jämfört med samma klass
» 14% av alla testade enheter i den här klassen var bättre, 3% liknande, 83% sämre
» Den bästa hade ett delta på 6%, genomsnittet var 20%, sämst var 57%
Jämfört med alla testade enheter
» 10% av alla testade enheter var bättre, 3% liknande, 87% sämre
» Den bästa hade ett delta på 4%, genomsnittet var 23%, sämst var 134%
Apple MacBook Pro 16 2021 M1 Pro ljudanalys
(+) | högtalare kan spela relativt högt (84.7 dB)
Bas 100 - 315 Hz
(+) | bra bas - bara 3.8% från medianen
(+) | basen är linjär (5.2% delta till föregående frekvens)
Mellan 400 - 2000 Hz
(+) | balanserad mellan - endast 1.3% från medianen
(+) | mids är linjära (2.1% delta till föregående frekvens)
Högsta 2 - 16 kHz
(+) | balanserade toppar - endast 1.9% från medianen
(+) | toppar är linjära (2.7% delta till föregående frekvens)
Totalt 100 - 16 000 Hz
(+) | det totala ljudet är linjärt (4.6% skillnad mot median)
Jämfört med samma klass
» 0% av alla testade enheter i den här klassen var bättre, 0% liknande, 100% sämre
» Den bästa hade ett delta på 5%, genomsnittet var 17%, sämst var 45%
Jämfört med alla testade enheter
» 0% av alla testade enheter var bättre, 0% liknande, 100% sämre
» Den bästa hade ett delta på 4%, genomsnittet var 23%, sämst var 134%
Energiförvaltning
Strömförbrukning
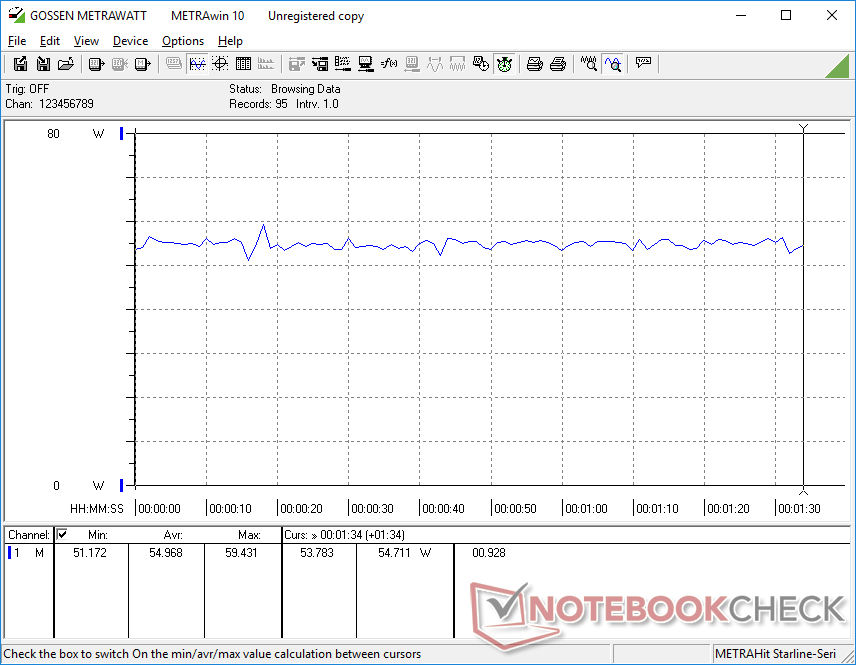
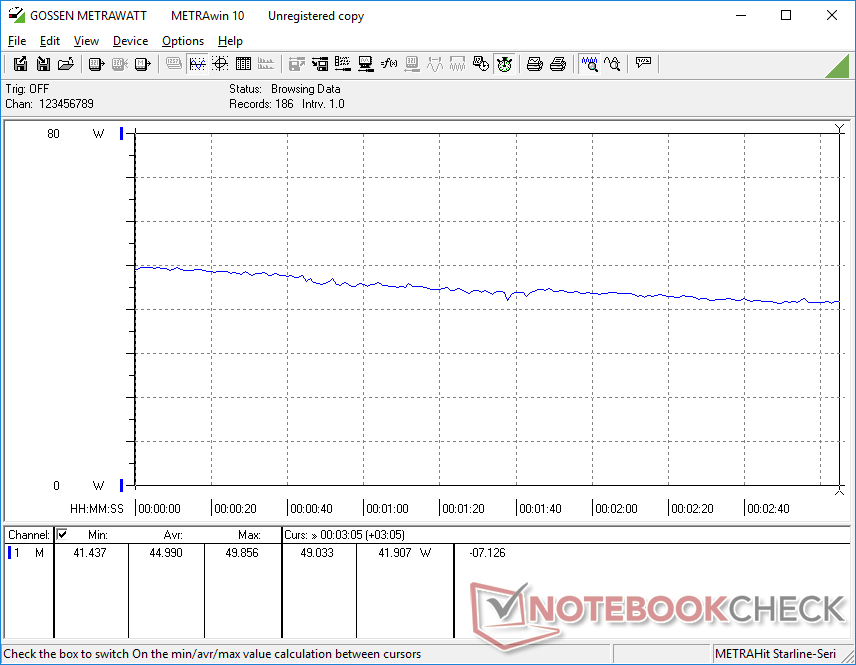
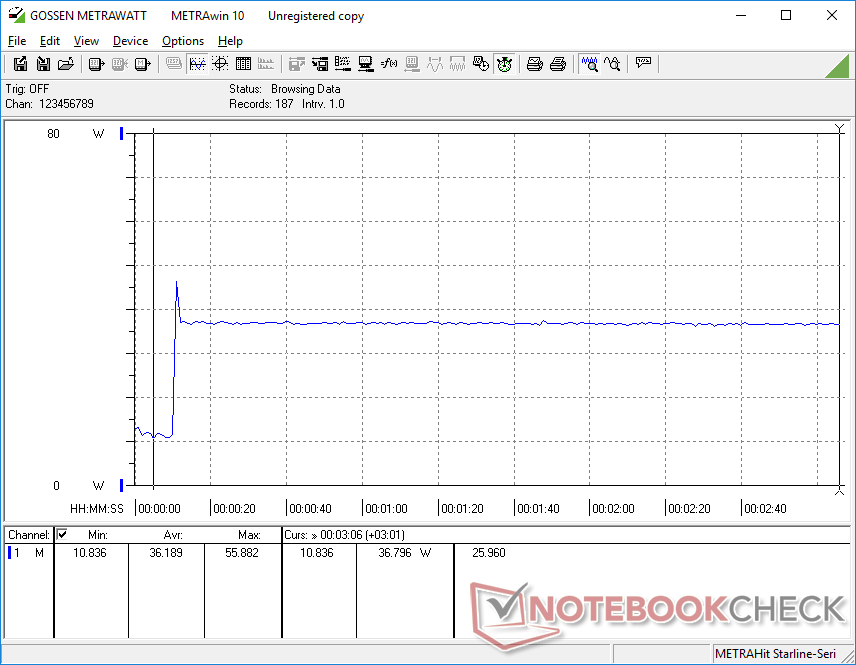
Strömförbrukningen är jämförbar med den Intel-drivna Inspiron 14 7420 under enkla belastningar, men den är konsekvent högre när man kör mer krävande belastningar som spel. Detta tyder på att den integrerade AMD GPU är något mindre strömeffektiv än den konkurrerande Iris Xe 96 EUs medan CPU-prestanda per watt är mer likartad.
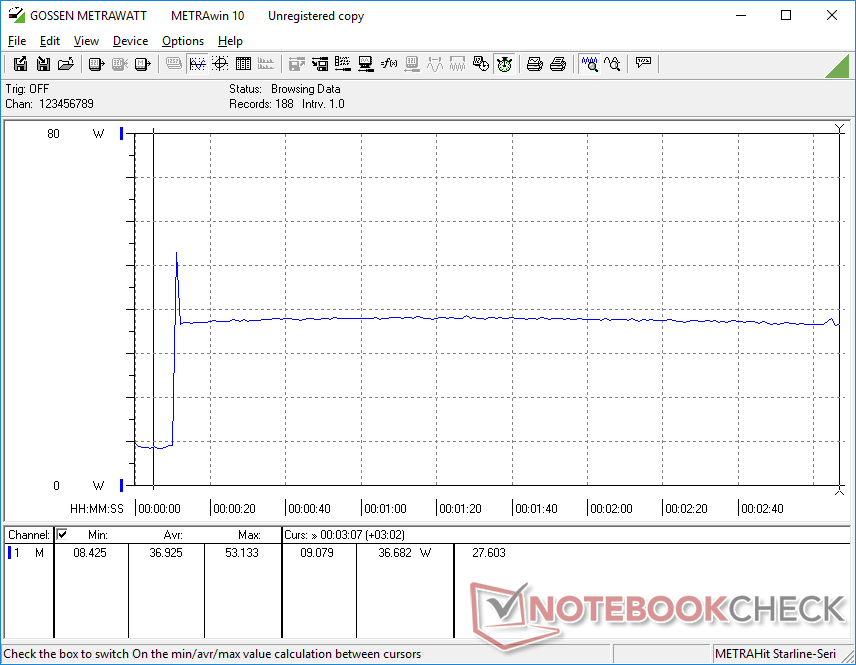
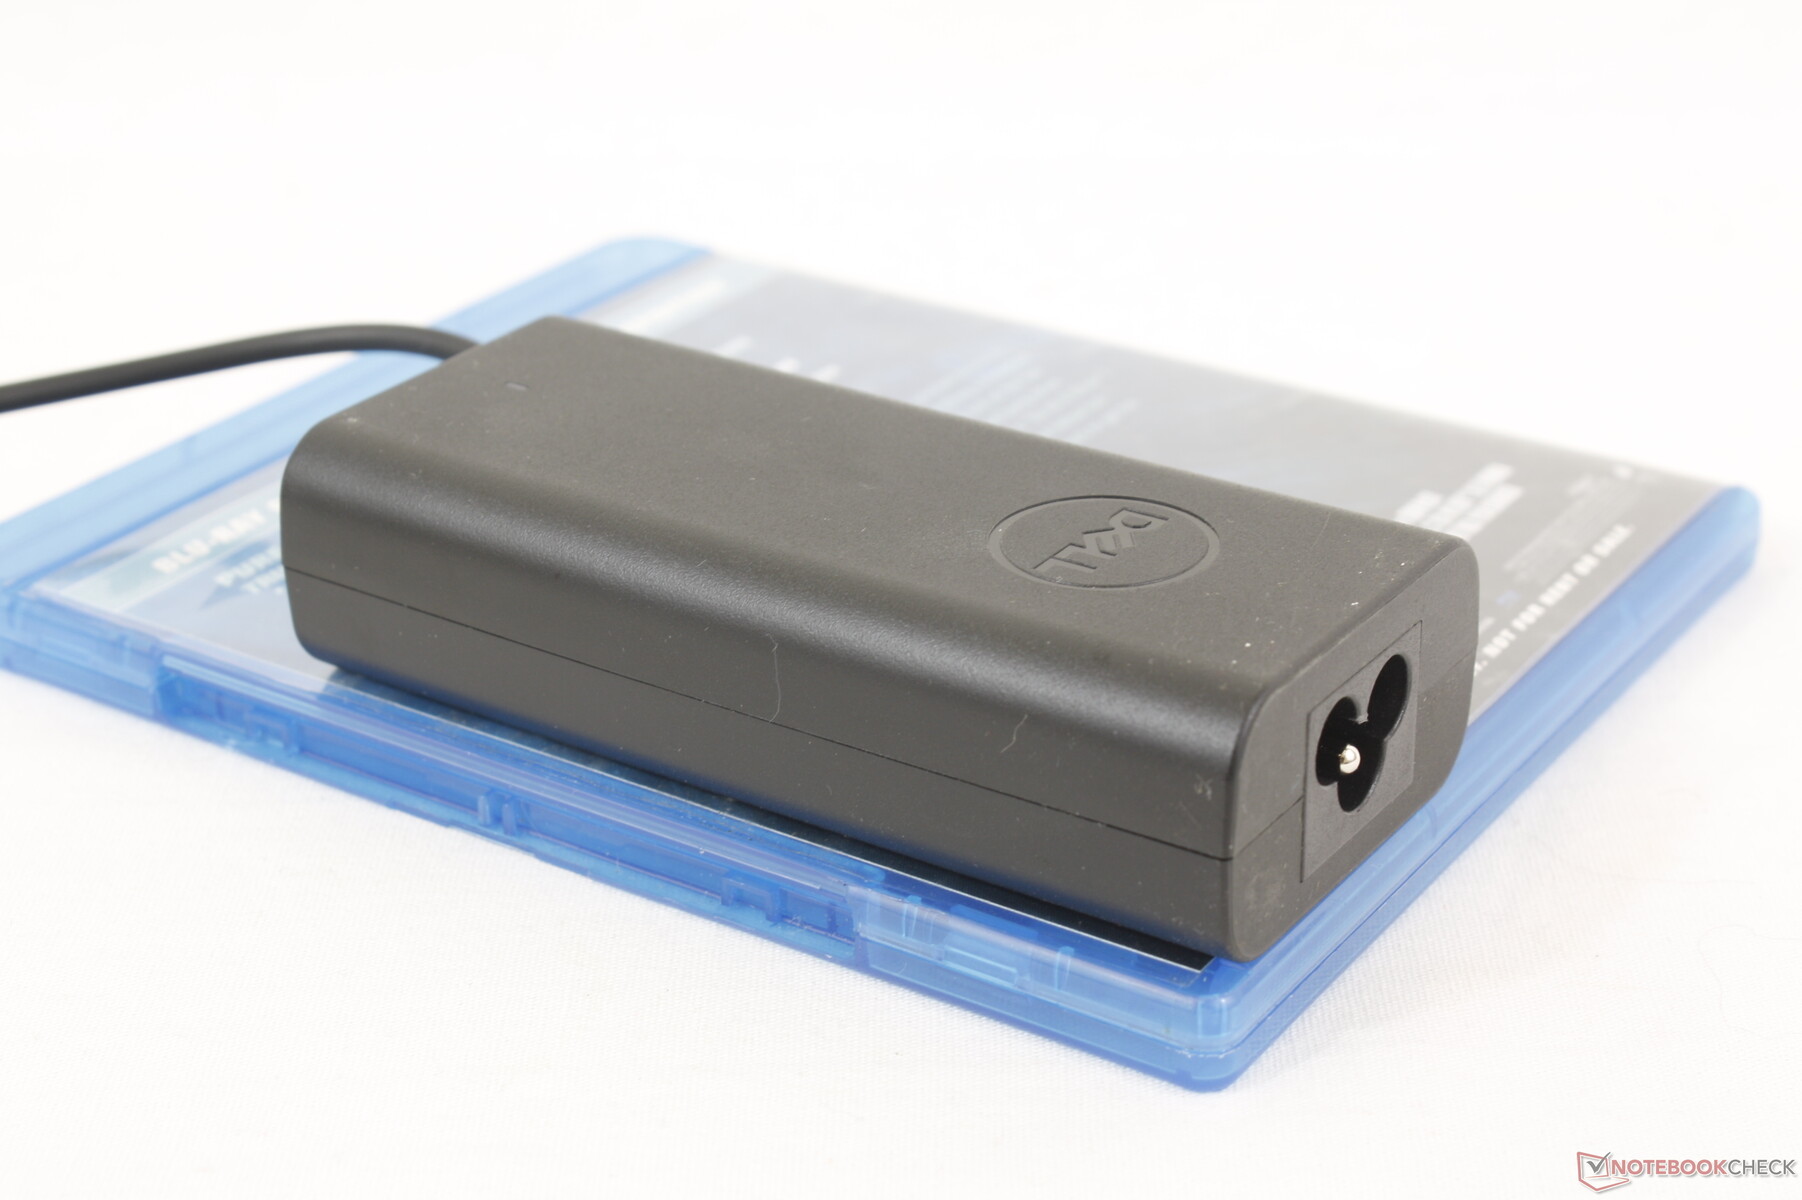
Vi kan mäta ett maximalt uttag på 56 W från den lilla (11,1 x 5,1 x 2,8 cm) 65 W USB-C-adaptern när processorn utnyttjas till 100 procent. Denna hastighet är dock mycket kortlivad, vilket framgår av våra skärmdumpar nedan, på grund av systemets begränsade Turbo Boost-potential.
| Av/Standby | |
| Låg belastning | |
| Hög belastning |
|
Förklaring:
min: | |
| Dell Inspiron 14 7435 2-in-1 R5 7530U, Vega 7, , IPS, 1920x1200, 14" | Dell Inspiron 14 7420 2-in-1 i7-1255U, Iris Xe G7 96EUs, WDC PC SN530 SDBPMPZ-512G, IPS, 1920x1200, 14" | Lenovo IdeaPad Flex 7i 14IAU7 i7-1255U, Iris Xe G7 96EUs, Samsung PM9B1 512GB MZAL4512HBLU, IPS, 2240x1400, 14" | Acer Aspire 5 Spin 14 i5-1335U, Iris Xe G7 80EUs, Micron 2450 512GB MTFDKBA512TFK, IPS, 1920x1200, 14" | LG Gram 14T90P i5-1135G7, Iris Xe G7 80EUs, Samsung SSD PM981a MZVLB512HBJQ, IPS, 1900x1200, 14" | HP Pavilion x360 14-dy0157ng i5-1135G7, Iris Xe G7 80EUs, Toshiba KBG40ZNV512G, IPS, 1920x1080, 14" | |
|---|---|---|---|---|---|---|
| Power Consumption | 6% | -10% | 12% | 24% | 33% | |
| Idle Minimum * (Watt) | 5.3 | 5.2 2% | 7.1 -34% | 4.3 19% | 2.8 47% | 4 25% |
| Idle Average * (Watt) | 9.1 | 8.2 10% | 11 -21% | 5.8 36% | 5.5 40% | 6.7 26% |
| Idle Maximum * (Watt) | 9.4 | 9.9 -5% | 11.4 -21% | 8.8 6% | 6.4 32% | 8.2 13% |
| Load Average * (Watt) | 54.9 | 44.4 19% | 43.7 20% | 44 20% | 45.4 17% | 29.6 46% |
| Witcher 3 ultra * (Watt) | 45 | 35 22% | 35.1 22% | 41.5 8% | 34 24% | 29.6 34% |
| Load Maximum * (Watt) | 55.8 | 62.5 -12% | 71 -27% | 67 -20% | 65.9 -18% | 26.7 52% |
* ... mindre är bättre
Power Consumption Witcher 3 / Stresstest
Power Consumption external Monitor
Batteritid
Körtiderna har ökat märkbart från år till år trots att batterikapaciteten inte har ändrats. Vi kan klocka in 11 timmar av verklig WLAN-surfning på vår AMD-drivna enhet jämfört med 7,5 timmar på förra årets Intel-drivna modell. Inspiron 14 7435 2-i-1 har därmed längre batteritid än många andra subnotebooks i samma prisklass.
Laddning från tom till full kapacitet tar ungefär två timmar.
| Dell Inspiron 14 7435 2-in-1 R5 7530U, Vega 7, 54 Wh | Dell Inspiron 14 7420 2-in-1 i7-1255U, Iris Xe G7 96EUs, 54 Wh | Lenovo IdeaPad Flex 7i 14IAU7 i7-1255U, Iris Xe G7 96EUs, 59 Wh | Acer Aspire 5 Spin 14 i5-1335U, Iris Xe G7 80EUs, 54.6 Wh | LG Gram 14T90P i5-1135G7, Iris Xe G7 80EUs, 72 Wh | HP Pavilion x360 14-dy0157ng i5-1135G7, Iris Xe G7 80EUs, 43 Wh | |
|---|---|---|---|---|---|---|
| Batteridrifttid | -16% | -32% | 0% | 12% | -22% | |
| Reader / Idle (h) | 19.9 | 15.9 -20% | 17.7 -11% | |||
| WiFi v1.3 (h) | 11.1 | 7.6 -32% | 7.6 -32% | 11.1 0% | 12.1 9% | 7.1 -36% |
| Load (h) | 2 | 2.1 5% | 2.3 15% | 1.6 -20% | ||
| H.264 (h) | 8.9 |
För
Emot
Omdöme - Bra prestanda för priset, men skärmen kan behöva lite arbete
När det gäller prestanda presterar vår Ryzen 5 Inspiron 14 7435 2-i-1 för 550 USD lika bra som Core i5 Inspiron 14 7430 2-i-1 för 800 USD utan några kompromisser vad gäller batteritid, skärmkvalitet, högtalare eller andra fysiska egenskaper. Om Thunderbolt-stöd inte står högt upp på din lista kan du spara nästan 200 dollar genom att välja AMD istället för Intel för just den här modellen.
Ryzen 5-konfigurationen är perfekt inställd för att prestera lika bra som Core i5-konfigurationen för hundratals dollar mindre. De kostsamma RAM-uppgraderingarna och den svaga pekskärmen sänker dock modellen lite.
Det lödda RAM-minnet är en stor nackdel med modellen i år eftersom en enkel uppgradering från 8 GB till 16 GB kostar minst 150 dollar extra. För vad som är tänkt att vara en budgetkonvertibel kan den kostsamma uppgraderingen vara ett avbräck för målgruppen. I övrigt är förändringarna av högtalarna, klickplattan och gångjärnen alla välkomna förbättringar.
Vi skulle gärna se att framtida revisioner innehåller ljusstarkare pekskärmsalternativ för bättre synlighet utomhus. Den nuvarande 250-nit-skärmen begränsar modellen till inomhusmiljöer, vilket är olyckligt eftersom köpare kanske vill använda 14-tums konvertibeln när de är på språng. En sådan funktion skulle ge Inspiron 14 7435 2-i-1 ett anmärkningsvärt ben upp mot konkurrenter som Acer Aspire 5 Spin 14, Lenovo IdeaPad Flex 7ieller HP Pavilion x360 14.
Pris och tillgänglighet
Dell levererar nu sin Inspiron 14 7435 2-i-1 från 549 USD för vår granskade Ryzen 5-konfiguration upp till 699 USD för Ryzen 7-konfigurationen. Alternativt kostar Intel Inspiron 14 7430 2-in-1 från 799 USD för Core i5-konfigurationen.
Dell Inspiron 14 7435 2-in-1
- 08/08/2023 v7 (old)
Allen Ngo
Genomskinlighet
Valet av enheter som ska granskas görs av vår redaktion. Testprovet gavs till författaren som ett lån av tillverkaren eller återförsäljaren för denna recension. Långivaren hade inget inflytande på denna recension och inte heller fick tillverkaren en kopia av denna recension innan publiceringen. Det fanns ingen skyldighet att publicera denna recension. Som ett oberoende medieföretag är Notebookcheck inte föremål för auktoritet från tillverkare, återförsäljare eller förlag.
This is how Notebookcheck is testingEvery year, Notebookcheck independently reviews hundreds of laptops and smartphones using standardized procedures to ensure that all results are comparable. We have continuously developed our test methods for around 20 years and set industry standards in the process. In our test labs, high-quality measuring equipment is utilized by experienced technicians and editors. These tests involve a multi-stage validation process. Our complex rating system is based on hundreds of well-founded measurements and benchmarks, which maintains objectivity.
Price comparison

