Test: Dell Inspiron 15 7506 2-in-1 - Enkel att använda, enkel att skaffa (Sammanfattning)
Testgrupp
Gradering | Datum | Modell | Vikt | Höjd | Storlek | Upplösning | Pris |
|---|---|---|---|---|---|---|---|
| 81.2 % v7 (old) | 12/2020 | Dell Inspiron 15 7506 2-in-1 P97F i5-1135G7, Iris Xe G7 80EUs | 1.8 kg | 17.94 mm | 15.60" | 1920x1080 | |
| 86.5 % v7 (old) | 03/2020 | Asus ZenBook Flip 15 UX563FD-A1027T i7-10510U, GeForce GTX 1050 Max-Q | 1.9 kg | 19.9 mm | 15.60" | 3840x2160 | |
| 82.8 % v6 (old) | 12/2018 | Dell Inspiron 15 7000 2-in-1 Black Edition i7-8565U, GeForce MX150 | 2.1 kg | 17 mm | 15.60" | 3840x2160 | |
| 82.8 % v7 (old) | 09/2020 | HP Envy x360 15-ee0257ng R5 4500U, Vega 6 | 2 kg | 18.9 mm | 15.60" | 1920x1080 | |
| 84.8 % v7 (old) | 04/2020 | Lenovo Yoga C740-15IML i7-10510U, UHD Graphics 620 | 1.9 kg | 17.25 mm | 15.60" | 1920x1080 | |
| 78.9 % v6 (old) | 07/2018 | Asus VivoBook Flip 15 TP510UA-E8073T i5-8250U, UHD Graphics 620 | 2.3 kg | 18 mm | 15.60" | 1920x1080 |
| SD Card Reader | |
| average JPG Copy Test (av. of 3 runs) | |
| HP Envy x360 15-ee0257ng (Toshiba Exceria Pro SDXC 64 GB UHS-II) | |
| Asus ZenBook Flip 15 UX563FD-A1027T (Toshiba Exceria Pro SDXC 64 GB UHS-II) | |
| Dell Inspiron 15 7000 2-in-1 Black Edition (Toshiba Exceria Pro SDXC 64 GB UHS-II) | |
| Asus VivoBook Flip 15 TP510UA-E8073T (Toshiba Exceria Pro SDXC 64 GB UHS-II) | |
| Dell Inspiron 15 7506 2-in-1 P97F (Toshiba Exceria Pro SDXC 64 GB UHS-II) | |
| maximum AS SSD Seq Read Test (1GB) | |
| HP Envy x360 15-ee0257ng (Toshiba Exceria Pro SDXC 64 GB UHS-II) | |
| Dell Inspiron 15 7000 2-in-1 Black Edition (Toshiba Exceria Pro SDXC 64 GB UHS-II) | |
| Dell Inspiron 15 7506 2-in-1 P97F (Toshiba Exceria Pro SDXC 64 GB UHS-II) | |
| Asus VivoBook Flip 15 TP510UA-E8073T (Toshiba Exceria Pro SDXC 64 GB UHS-II) | |


| |||||||||||||||||||||||||
Distribution av ljusstyrkan: 92 %
Mitt på batteriet: 289.8 cd/m²
Kontrast: 935:1 (Svärta: 0.31 cd/m²)
ΔE ColorChecker Calman: 3.75 | ∀{0.5-29.43 Ø4.73}
calibrated: 1.52
ΔE Greyscale Calman: 5.3 | ∀{0.09-98 Ø4.97}
97% sRGB (Argyll 1.6.3 3D)
62.9% AdobeRGB 1998 (Argyll 1.6.3 3D)
68.7% AdobeRGB 1998 (Argyll 3D)
97.2% sRGB (Argyll 3D)
67.4% Display P3 (Argyll 3D)
Gamma: 2.35
CCT: 5810 K
| Dell Inspiron 15 7506 2-in-1 P97F LG Philips 156WFF, IPS, 15.6", 1920x1080 | Asus ZenBook Flip 15 UX563FD-A1027T BOE HF NE156QUM-N64, IPS, 15.6", 3840x2160 | Dell Inspiron 15 7000 2-in-1 Black Edition AUO34EB, IPS, 15.6", 3840x2160 | HP Envy x360 15-ee0257ng BOE NV156FHM-N4T, IPS, 15.6", 1920x1080 | Lenovo Yoga C740-15IML B156HAN02.5, IPS LED, 15.6", 1920x1080 | Asus VivoBook Flip 15 TP510UA-E8073T AU Optronics B156HAN02.1, IPS, 15.6", 1920x1080 | |
|---|---|---|---|---|---|---|
| Display | -1% | 8% | -39% | -41% | -41% | |
| Display P3 Coverage (%) | 67.4 | 66.2 -2% | 75.7 12% | 40.43 -40% | 39.04 -42% | 39.19 -42% |
| sRGB Coverage (%) | 97.2 | 97.2 0% | 99.3 2% | 59.6 -39% | 57.9 -40% | 58.9 -39% |
| AdobeRGB 1998 Coverage (%) | 68.7 | 68.3 -1% | 75.7 10% | 41.77 -39% | 40.33 -41% | 40.49 -41% |
| Response Times | -6% | 15% | 39% | 7% | 18% | |
| Response Time Grey 50% / Grey 80% * (ms) | 52.4 ? | 60 ? -15% | 48 ? 8% | 34 ? 35% | 50.8 ? 3% | 44 ? 16% |
| Response Time Black / White * (ms) | 36 ? | 35 ? 3% | 28.4 ? 21% | 21 ? 42% | 32.4 ? 10% | 29 ? 19% |
| PWM Frequency (Hz) | ||||||
| Screen | 23% | -18% | -47% | -53% | -9% | |
| Brightness middle (cd/m²) | 289.8 | 351 21% | 321.1 11% | 314 8% | 286 -1% | 229 -21% |
| Brightness (cd/m²) | 274 | 335 22% | 315 15% | 280 2% | 268 -2% | 221 -19% |
| Brightness Distribution (%) | 92 | 87 -5% | 95 3% | 72 -22% | 83 -10% | 76 -17% |
| Black Level * (cd/m²) | 0.31 | 0.31 -0% | 0.36 -16% | 0.275 11% | 0.2 35% | 0.15 52% |
| Contrast (:1) | 935 | 1132 21% | 892 -5% | 1142 22% | 1430 53% | 1527 63% |
| Colorchecker dE 2000 * | 3.75 | 1.74 54% | 5.45 -45% | 5.94 -58% | 7.3 -95% | 5.03 -34% |
| Colorchecker dE 2000 max. * | 7.01 | 2.76 61% | 12.6 -80% | 21.71 -210% | 21.7 -210% | 8.89 -27% |
| Colorchecker dE 2000 calibrated * | 1.52 | 2.08 -37% | 5.15 -239% | 5.1 -236% | ||
| Greyscale dE 2000 * | 5.3 | 2.22 58% | 8.1 -53% | 2.97 44% | 7 -32% | 5.56 -5% |
| Gamma | 2.35 94% | 2.35 94% | 2.207 100% | 2.4 92% | 2.35 94% | 2.64 83% |
| CCT | 5810 112% | 6667 97% | 6845 95% | 6581 99% | 5847 111% | 7015 93% |
| Color Space (Percent of AdobeRGB 1998) (%) | 62.9 | 62 -1% | 67.3 7% | 38.1 -39% | 36.9 -41% | 37 -41% |
| Color Space (Percent of sRGB) (%) | 97 | 97 0% | 99.3 2% | 59.1 -39% | 57.5 -41% | 59 -39% |
| Totalt genomsnitt (program/inställningar) | 5% /
14% | 2% /
-9% | -16% /
-35% | -29% /
-43% | -11% /
-12% |
* ... mindre är bättre
Visa svarstider
| ↔ Svarstid svart till vitt | ||
|---|---|---|
| 36 ms ... stiga ↗ och falla ↘ kombinerat | ↗ 22.8 ms stiga | 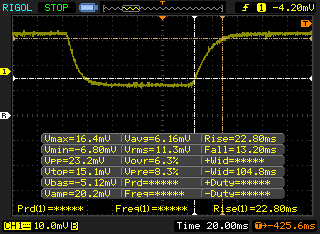 |
| ↘ 13.2 ms hösten | ||
| Skärmen visar långsamma svarsfrekvenser i våra tester och kommer att vara otillfredsställande för spelare. I jämförelse sträcker sig alla testade enheter från 0.1 (minst) till 240 (maximalt) ms. » 94 % av alla enheter är bättre. Detta innebär att den uppmätta svarstiden är sämre än genomsnittet av alla testade enheter (19.9 ms). | ||
| ↔ Svarstid 50 % grått till 80 % grått | ||
| 52.4 ms ... stiga ↗ och falla ↘ kombinerat | ↗ 29.2 ms stiga | 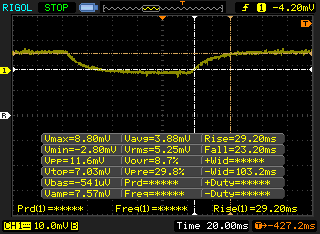 |
| ↘ 23.2 ms hösten | ||
| Skärmen visar långsamma svarsfrekvenser i våra tester och kommer att vara otillfredsställande för spelare. I jämförelse sträcker sig alla testade enheter från 0.165 (minst) till 636 (maximalt) ms. » 89 % av alla enheter är bättre. Detta innebär att den uppmätta svarstiden är sämre än genomsnittet av alla testade enheter (31.1 ms). | ||
Skärmflimmer / PWM (Puls-Width Modulation)
| Skärmflimmer / PWM upptäcktes inte | 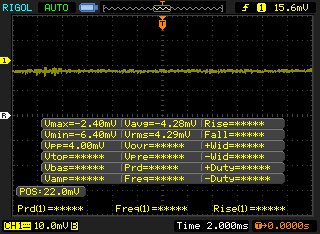 | ||
Som jämförelse: 52 % av alla testade enheter använder inte PWM för att dämpa skärmen. Om PWM upptäcktes mättes ett medelvärde av 7798 (minst: 5 - maximum: 343500) Hz. | |||
Cinebench R15: CPU Multi 64Bit | CPU Single 64Bit
Blender: v2.79 BMW27 CPU
7-Zip 18.03: 7z b 4 -mmt1 | 7z b 4
Geekbench 5.5: Single-Core | Multi-Core
HWBOT x265 Benchmark v2.2: 4k Preset
LibreOffice : 20 Documents To PDF
R Benchmark 2.5: Overall mean
| Cinebench R20 / CPU (Multi Core) | |
| HP ProBook 455 G7-175W8EA | |
| MSI Prestige 15 A10SC | |
| Dell Inspiron 15 7506 2-in-1 P97F | |
| HP Envy x360 15-ee0257ng | |
| Schenker Vision 15 | |
| Lenovo IdeaPad 5 15IIL05 | |
| Genomsnitt Intel Core i5-1135G7 (979 - 2382, n=62) | |
| Samsung Galaxy Book Flex 15-NP950 | |
| Lenovo Ideapad C340-15IWL-81N5004QGE | |
| HP Envy x360 15-dr1679cl | |
| HP Pavilion x360 15-dq0065cl | |
| Cinebench R20 / CPU (Single Core) | |
| Schenker Vision 15 | |
| Dell Inspiron 15 7506 2-in-1 P97F | |
| Genomsnitt Intel Core i5-1135G7 (375 - 527, n=62) | |
| HP ProBook 455 G7-175W8EA | |
| Samsung Galaxy Book Flex 15-NP950 | |
| MSI Prestige 15 A10SC | |
| HP Envy x360 15-ee0257ng | |
| Lenovo IdeaPad 5 15IIL05 | |
| HP Envy x360 15-dr1679cl | |
| HP Pavilion x360 15-dq0065cl | |
| Lenovo Ideapad C340-15IWL-81N5004QGE | |
| Cinebench R15 / CPU Multi 64Bit | |
| MSI Prestige 15 A10SC | |
| HP ProBook 455 G7-175W8EA | |
| Schenker Vision 15 | |
| HP Envy x360 15-ee0257ng | |
| Dell Inspiron 15 7506 2-in-1 P97F | |
| Lenovo IdeaPad 5 15IIL05 | |
| Genomsnitt Intel Core i5-1135G7 (431 - 941, n=65) | |
| Samsung Galaxy Book Flex 15-NP950 | |
| Lenovo Ideapad C340-15IWL-81N5004QGE | |
| HP Envy x360 15-dr1679cl | |
| HP Pavilion x360 15-dq0065cl | |
| Cinebench R15 / CPU Single 64Bit | |
| Schenker Vision 15 | |
| Dell Inspiron 15 7506 2-in-1 P97F | |
| Genomsnitt Intel Core i5-1135G7 (141.4 - 205, n=61) | |
| MSI Prestige 15 A10SC | |
| HP ProBook 455 G7-175W8EA | |
| Samsung Galaxy Book Flex 15-NP950 | |
| HP Envy x360 15-ee0257ng | |
| HP Pavilion x360 15-dq0065cl | |
| HP Envy x360 15-dr1679cl | |
| Lenovo IdeaPad 5 15IIL05 | |
| Lenovo Ideapad C340-15IWL-81N5004QGE | |
| Blender / v2.79 BMW27 CPU | |
| HP Envy x360 15-ee0257ng | |
| HP Envy x360 15-dr1679cl | |
| Samsung Galaxy Book Flex 15-NP950 | |
| Genomsnitt Intel Core i5-1135G7 (499 - 1044, n=60) | |
| Lenovo IdeaPad 5 15IIL05 | |
| Dell Inspiron 15 7506 2-in-1 P97F | |
| HP ProBook 455 G7-175W8EA | |
| Schenker Vision 15 | |
| 7-Zip 18.03 / 7z b 4 -mmt1 | |
| Schenker Vision 15 | |
| Dell Inspiron 15 7506 2-in-1 P97F | |
| Genomsnitt Intel Core i5-1135G7 (3924 - 4921, n=62) | |
| HP Envy x360 15-dr1679cl | |
| Samsung Galaxy Book Flex 15-NP950 | |
| HP Envy x360 15-ee0257ng | |
| Lenovo IdeaPad 5 15IIL05 | |
| HP ProBook 455 G7-175W8EA | |
| 7-Zip 18.03 / 7z b 4 | |
| HP ProBook 455 G7-175W8EA | |
| Schenker Vision 15 | |
| HP Envy x360 15-ee0257ng | |
| Dell Inspiron 15 7506 2-in-1 P97F | |
| Samsung Galaxy Book Flex 15-NP950 | |
| Genomsnitt Intel Core i5-1135G7 (14745 - 24873, n=62) | |
| Lenovo IdeaPad 5 15IIL05 | |
| HP Envy x360 15-dr1679cl | |
| Geekbench 5.5 / Single-Core | |
| Schenker Vision 15 | |
| Dell Inspiron 15 7506 2-in-1 P97F | |
| Genomsnitt Intel Core i5-1135G7 (1147 - 1428, n=58) | |
| Samsung Galaxy Book Flex 15-NP950 | |
| Lenovo IdeaPad 5 15IIL05 | |
| HP ProBook 455 G7-175W8EA | |
| HP Envy x360 15-ee0257ng | |
| HP Envy x360 15-dr1679cl | |
| Geekbench 5.5 / Multi-Core | |
| Schenker Vision 15 | |
| HP Envy x360 15-ee0257ng | |
| HP ProBook 455 G7-175W8EA | |
| Samsung Galaxy Book Flex 15-NP950 | |
| Genomsnitt Intel Core i5-1135G7 (3475 - 5472, n=58) | |
| Dell Inspiron 15 7506 2-in-1 P97F | |
| Lenovo IdeaPad 5 15IIL05 | |
| HP Envy x360 15-dr1679cl | |
| HWBOT x265 Benchmark v2.2 / 4k Preset | |
| Schenker Vision 15 | |
| Dell Inspiron 15 7506 2-in-1 P97F | |
| HP ProBook 455 G7-175W8EA | |
| Lenovo IdeaPad 5 15IIL05 | |
| Genomsnitt Intel Core i5-1135G7 (3.57 - 7.6, n=57) | |
| Samsung Galaxy Book Flex 15-NP950 | |
| HP Envy x360 15-ee0257ng | |
| HP Envy x360 15-dr1679cl | |
| LibreOffice / 20 Documents To PDF | |
| HP ProBook 455 G7-175W8EA | |
| HP Envy x360 15-ee0257ng | |
| HP Envy x360 15-dr1679cl | |
| Samsung Galaxy Book Flex 15-NP950 | |
| Lenovo IdeaPad 5 15IIL05 | |
| Genomsnitt Intel Core i5-1135G7 (44.2 - 62.9, n=60) | |
| Dell Inspiron 15 7506 2-in-1 P97F | |
| Schenker Vision 15 | |
| R Benchmark 2.5 / Overall mean | |
| HP Envy x360 15-dr1679cl | |
| Lenovo IdeaPad 5 15IIL05 | |
| Samsung Galaxy Book Flex 15-NP950 | |
| HP ProBook 455 G7-175W8EA | |
| Genomsnitt Intel Core i5-1135G7 (0.619 - 0.727, n=59) | |
| Dell Inspiron 15 7506 2-in-1 P97F | |
| HP Envy x360 15-ee0257ng | |
| Schenker Vision 15 | |
* ... mindre är bättre
| PCMark 8 Home Score Accelerated v2 | 4017 poäng | |
| PCMark 8 Work Score Accelerated v2 | 3021 poäng | |
| PCMark 10 Score | 4524 poäng | |
Hjälp | ||
| DPC Latencies / LatencyMon - interrupt to process latency (max), Web, Youtube, Prime95 | |
| Schenker Vision 15 | |
| HP Envy x360 15-dr1679cl | |
| Dell Inspiron 15 7506 2-in-1 P97F | |
| Lenovo Yoga 9i 14ITL5 | |
| HP ProBook 455 G7-175W8EA | |
| Lenovo IdeaPad 5 15IIL05 | |
| Samsung Galaxy Book Flex 15-NP950 | |
| HP Envy x360 15-ee0257ng | |
* ... mindre är bättre
| Dell Inspiron 15 7506 2-in-1 P97F Toshiba KBG40ZNS256G NVMe | Asus ZenBook Flip 15 UX563FD-A1027T Samsung SSD PM981 MZVLB1T0HALR | Dell Inspiron 15 7000 2-in-1 Black Edition Toshiba BG3 KBG30ZMS256G | HP Envy x360 15-ee0257ng Intel SSD 660p SSDPEKNW512G8 | Lenovo Yoga C740-15IML Samsung SSD PM981 MZVLB512HAJQ | Dell XPS 15 9500 Core i5 Toshiba KBG40ZNS256G NVMe | |
|---|---|---|---|---|---|---|
| AS SSD | 217% | -32% | 104% | 250% | 62% | |
| Seq Read (MB/s) | 1470 | 2739 86% | 1123 -24% | 1587 8% | 2732 86% | 1423 -3% |
| Seq Write (MB/s) | 324.2 | 1307 303% | 208.9 -36% | 864 167% | 1477 356% | 766 136% |
| 4K Read (MB/s) | 37.25 | 47.43 27% | 27.36 -27% | 51.6 39% | 57.7 55% | 42.21 13% |
| 4K Write (MB/s) | 98 | 126 29% | 65 -34% | 125.1 28% | 136.3 39% | 74.8 -24% |
| 4K-64 Read (MB/s) | 796 | 1013 27% | 313.2 -61% | 323.1 -59% | 1021 28% | 973 22% |
| 4K-64 Write (MB/s) | 152.6 | 1371 798% | 111.2 -27% | 724 374% | 1651 982% | 218.8 43% |
| Access Time Read * (ms) | 0.146 | 0.082 44% | 0.684 -368% | 0.101 31% | 0.062 58% | 0.125 14% |
| Access Time Write * (ms) | 0.577 | 0.029 95% | 0.344 40% | 0.046 92% | 0.028 95% | 0.552 4% |
| Score Read (Points) | 980 | 1335 36% | 453 -54% | 533 -46% | 1352 38% | 1157 18% |
| Score Write (Points) | 283 | 1628 475% | 197 -30% | 935 230% | 1935 584% | 370 31% |
| Score Total (Points) | 1714 | 3582 109% | 844 -51% | 1725 1% | 3929 129% | 2094 22% |
| Copy ISO MB/s (MB/s) | 353.5 | 1931 446% | 927 162% | 1323 274% | 1972 458% | 1151 226% |
| Copy Program MB/s (MB/s) | 194.1 | 457.9 136% | 206.4 6% | 340.8 76% | 642 231% | 499.4 157% |
| Copy Game MB/s (MB/s) | 239 | 1242 420% | 360.4 51% | 823 244% | 1090 356% | 733 207% |
| CrystalDiskMark 5.2 / 6 | 181% | -24% | 69% | 221% | 79% | |
| Write 4K (MB/s) | 99.3 | 137.8 39% | 83.4 -16% | 104.5 5% | 142.3 43% | 93.3 -6% |
| Read 4K (MB/s) | 32.1 | 44.15 38% | 32.22 0% | 49.7 55% | 47.56 48% | 45.9 43% |
| Write Seq (MB/s) | 353.1 | 2073 487% | 171.7 -51% | 981 178% | 2185 519% | 1211 243% |
| Read Seq (MB/s) | 1370 | 2165 58% | 924 -33% | 1517 11% | 2235 63% | 1633 19% |
| Write 4K Q32T1 (MB/s) | 171.1 | 431.9 152% | 161.5 -6% | 398.8 133% | 515 201% | 273.1 60% |
| Read 4K Q32T1 (MB/s) | 350.8 | 427.7 22% | 301.1 -14% | 338.4 -4% | 413.4 18% | 356 1% |
| Write Seq Q32T1 (MB/s) | 325.9 | 2253 591% | 222.3 -32% | 982 201% | 2981 815% | 1198 268% |
| Read Seq Q32T1 (MB/s) | 2197 | 3480 58% | 1300 -41% | 1650 -25% | 3565 62% | 2269 3% |
| Totalt genomsnitt (program/inställningar) | 199% /
203% | -28% /
-29% | 87% /
92% | 236% /
239% | 71% /
68% |
* ... mindre är bättre

DiskSpd Read Loop, Queue Depth 8
| 3DMark 11 Performance | 5585 poäng | |
| 3DMark Cloud Gate Standard Score | 13909 poäng | |
| 3DMark Fire Strike Score | 2781 poäng | |
| 3DMark Time Spy Score | 1192 poäng | |
Hjälp | ||
| Final Fantasy XV Benchmark | |
| 1280x720 Lite Quality | |
| Lenovo Yoga 9i 14ITL5 | |
| Genomsnitt Intel Iris Xe Graphics G7 80EUs (8.32 - 45.6, n=107) | |
| Dell Inspiron 15 7506 2-in-1 P97F | |
| 1920x1080 Standard Quality | |
| Lenovo Yoga 9i 14ITL5 | |
| Genomsnitt Intel Iris Xe Graphics G7 80EUs (4.47 - 25.4, n=100) | |
| Dell Inspiron 15 7506 2-in-1 P97F | |
| 1920x1080 High Quality | |
| Lenovo Yoga 9i 14ITL5 | |
| Genomsnitt Intel Iris Xe Graphics G7 80EUs (4.01 - 22, n=91) | |
| Dell Inspiron 15 7506 2-in-1 P97F | |
| låg | med. | hög | ultra | |
|---|---|---|---|---|
| The Witcher 3 (2015) | 66.1 | 36.5 | 19.8 | 10 |
| Dota 2 Reborn (2015) | 78.2 | 54.4 | 36.3 | 34.1 |
| Final Fantasy XV Benchmark (2018) | 29.2 | 15 | 10.8 | |
| X-Plane 11.11 (2018) | 23.6 | 31.3 | 32.8 |
| Dell Inspiron 15 7506 2-in-1 P97F Iris Xe G7 80EUs, i5-1135G7, Toshiba KBG40ZNS256G NVMe | Asus ZenBook Flip 15 UX563FD-A1027T GeForce GTX 1050 Max-Q, i7-10510U, Samsung SSD PM981 MZVLB1T0HALR | Dell Inspiron 15 7000 2-in-1 Black Edition GeForce MX150, i7-8565U, Toshiba BG3 KBG30ZMS256G | HP Envy x360 15-ee0257ng Vega 6, R5 4500U, Intel SSD 660p SSDPEKNW512G8 | Lenovo Yoga C740-15IML UHD Graphics 620, i7-10510U, Samsung SSD PM981 MZVLB512HAJQ | Asus VivoBook Flip 15 TP510UA-E8073T UHD Graphics 620, i5-8250U, SanDisk SD8SN8U128G1002 | |
|---|---|---|---|---|---|---|
| Noise | -5% | -14% | -5% | -1% | -6% | |
| av / miljö * (dB) | 27.1 | 30.3 -12% | 28 -3% | 27 -0% | 29.3 -8% | 30.2 -11% |
| Idle Minimum * (dB) | 27.1 | 30.3 -12% | 28 -3% | 27 -0% | 29.3 -8% | 30.9 -14% |
| Idle Average * (dB) | 27.1 | 30.3 -12% | 28 -3% | 27 -0% | 29.3 -8% | 30.9 -14% |
| Idle Maximum * (dB) | 27.1 | 30.3 -12% | 28.4 -5% | 27 -0% | 29.6 -9% | 30.9 -14% |
| Load Average * (dB) | 31.5 | 33.7 -7% | 48.6 -54% | 43.2 -37% | 32.4 -3% | 34.2 -9% |
| Witcher 3 ultra * (dB) | 37.4 | 37.4 -0% | 47.9 -28% | |||
| Load Maximum * (dB) | 47.2 | 38.9 18% | 49.2 -4% | 43.2 8% | 33.3 29% | 34.2 28% |
* ... mindre är bättre
Ljudnivå
| Låg belastning |
| 27.1 / 27.1 / 27.1 dB(A) |
| Hög belastning |
| 31.5 / 47.2 dB(A) |
 | ||
30 dB tyst 40 dB(A) hörbar 50 dB(A) högt ljud |
||
min: | ||
(+) Den maximala temperaturen på ovansidan är 35.6 °C / 96 F, jämfört med genomsnittet av 36.8 °C / 98 F , allt från 21 till 71 °C för klassen Multimedia.
(-) Botten värms upp till maximalt 46.8 °C / 116 F, jämfört med genomsnittet av 39.1 °C / 102 F
(+) Vid tomgångsbruk är medeltemperaturen för ovansidan 21.9 °C / 71 F, jämfört med enhetsgenomsnittet på 31.3 °C / ### class_avg_f### F.
(+) Handledsstöden och pekplattan är kallare än hudtemperaturen med maximalt 25 °C / 77 F och är därför svala att ta på.
(+) Medeltemperaturen för handledsstödsområdet på liknande enheter var 28.7 °C / 83.7 F (+3.7 °C / 6.7 F).
Dell Inspiron 15 7506 2-in-1 P97F ljudanalys
(±) | högtalarljudstyrkan är genomsnittlig men bra (81.6 dB)
Bas 100 - 315 Hz
(-) | nästan ingen bas - i genomsnitt 22.7% lägre än medianen
(±) | linjäriteten för basen är genomsnittlig (11% delta till föregående frekvens)
Mellan 400 - 2000 Hz
(±) | högre mellan - i genomsnitt 8.4% högre än median
(±) | linjäriteten för mids är genomsnittlig (8.6% delta till föregående frekvens)
Högsta 2 - 16 kHz
(+) | balanserade toppar - endast 3.4% från medianen
(+) | toppar är linjära (6.2% delta till föregående frekvens)
Totalt 100 - 16 000 Hz
(±) | linjäriteten för det totala ljudet är genomsnittlig (21.2% skillnad mot median)
Jämfört med samma klass
» 73% av alla testade enheter i den här klassen var bättre, 7% liknande, 20% sämre
» Den bästa hade ett delta på 5%, genomsnittet var 17%, sämst var 45%
Jämfört med alla testade enheter
» 59% av alla testade enheter var bättre, 7% liknande, 34% sämre
» Den bästa hade ett delta på 4%, genomsnittet var 24%, sämst var 134%
Apple MacBook 12 (Early 2016) 1.1 GHz ljudanalys
(+) | högtalare kan spela relativt högt (83.6 dB)
Bas 100 - 315 Hz
(±) | reducerad bas - i genomsnitt 11.3% lägre än medianen
(±) | linjäriteten för basen är genomsnittlig (14.2% delta till föregående frekvens)
Mellan 400 - 2000 Hz
(+) | balanserad mellan - endast 2.4% från medianen
(+) | mids är linjära (5.5% delta till föregående frekvens)
Högsta 2 - 16 kHz
(+) | balanserade toppar - endast 2% från medianen
(+) | toppar är linjära (4.5% delta till föregående frekvens)
Totalt 100 - 16 000 Hz
(+) | det totala ljudet är linjärt (10.2% skillnad mot median)
Jämfört med samma klass
» 7% av alla testade enheter i den här klassen var bättre, 2% liknande, 91% sämre
» Den bästa hade ett delta på 5%, genomsnittet var 18%, sämst var 53%
Jämfört med alla testade enheter
» 5% av alla testade enheter var bättre, 1% liknande, 94% sämre
» Den bästa hade ett delta på 4%, genomsnittet var 24%, sämst var 134%
| Av/Standby | |
| Låg belastning | |
| Hög belastning |
|
Förklaring:
min: | |
| Dell Inspiron 15 7506 2-in-1 P97F i5-1135G7, Iris Xe G7 80EUs, Toshiba KBG40ZNS256G NVMe, IPS, 1920x1080, 15.6" | Asus ZenBook Flip 15 UX563FD-A1027T i7-10510U, GeForce GTX 1050 Max-Q, Samsung SSD PM981 MZVLB1T0HALR, IPS, 3840x2160, 15.6" | Dell Inspiron 15 7000 2-in-1 Black Edition i7-8565U, GeForce MX150, Toshiba BG3 KBG30ZMS256G, IPS, 3840x2160, 15.6" | HP Envy x360 15-ee0257ng R5 4500U, Vega 6, Intel SSD 660p SSDPEKNW512G8, IPS, 1920x1080, 15.6" | Lenovo Yoga C740-15IML i7-10510U, UHD Graphics 620, Samsung SSD PM981 MZVLB512HAJQ, IPS LED, 1920x1080, 15.6" | Asus VivoBook Flip 15 TP510UA-E8073T i5-8250U, UHD Graphics 620, SanDisk SD8SN8U128G1002, IPS, 1920x1080, 15.6" | |
|---|---|---|---|---|---|---|
| Power Consumption | -53% | -24% | -15% | -5% | 3% | |
| Idle Minimum * (Watt) | 3.9 | 2.3 41% | 4.2 -8% | 3.9 -0% | 2.97 24% | 3.9 -0% |
| Idle Average * (Watt) | 6.9 | 10.3 -49% | 7.8 -13% | 7 -1% | 7.2 -4% | 7.2 -4% |
| Idle Maximum * (Watt) | 8.5 | 11 -29% | 8.5 -0% | 10.5 -24% | 9.9 -16% | 9.5 -12% |
| Load Average * (Watt) | 30.5 | 77 -152% | 57 -87% | 48 -57% | 40.8 -34% | 36.8 -21% |
| Witcher 3 ultra * (Watt) | 42.6 | 68 -60% | 57.3 -35% | |||
| Load Maximum * (Watt) | 69.7 | 118 -69% | 68 2% | 65 7% | 64.7 7% | 33.1 53% |
* ... mindre är bättre
| Dell Inspiron 15 7506 2-in-1 P97F i5-1135G7, Iris Xe G7 80EUs, 53 Wh | Asus ZenBook Flip 15 UX563FD-A1027T i7-10510U, GeForce GTX 1050 Max-Q, 71 Wh | Dell Inspiron 15 7000 2-in-1 Black Edition i7-8565U, GeForce MX150, 56 Wh | HP Envy x360 15-ee0257ng R5 4500U, Vega 6, 51 Wh | Lenovo Yoga C740-15IML i7-10510U, UHD Graphics 620, 60.3 Wh | Asus VivoBook Flip 15 TP510UA-E8073T i5-8250U, UHD Graphics 620, 42 Wh | |
|---|---|---|---|---|---|---|
| Batteridrifttid | 36% | -20% | 13% | 40% | -28% | |
| Reader / Idle (h) | 18.8 | 19.5 4% | ||||
| WiFi v1.3 (h) | 8.3 | 9.4 13% | 6.6 -20% | 9.4 13% | 10.4 25% | 6 -28% |
| Load (h) | 1.3 | 2.5 92% | 2 54% |
För
Emot
Läs den fullständiga versionen av den här recensionen på engelska här.
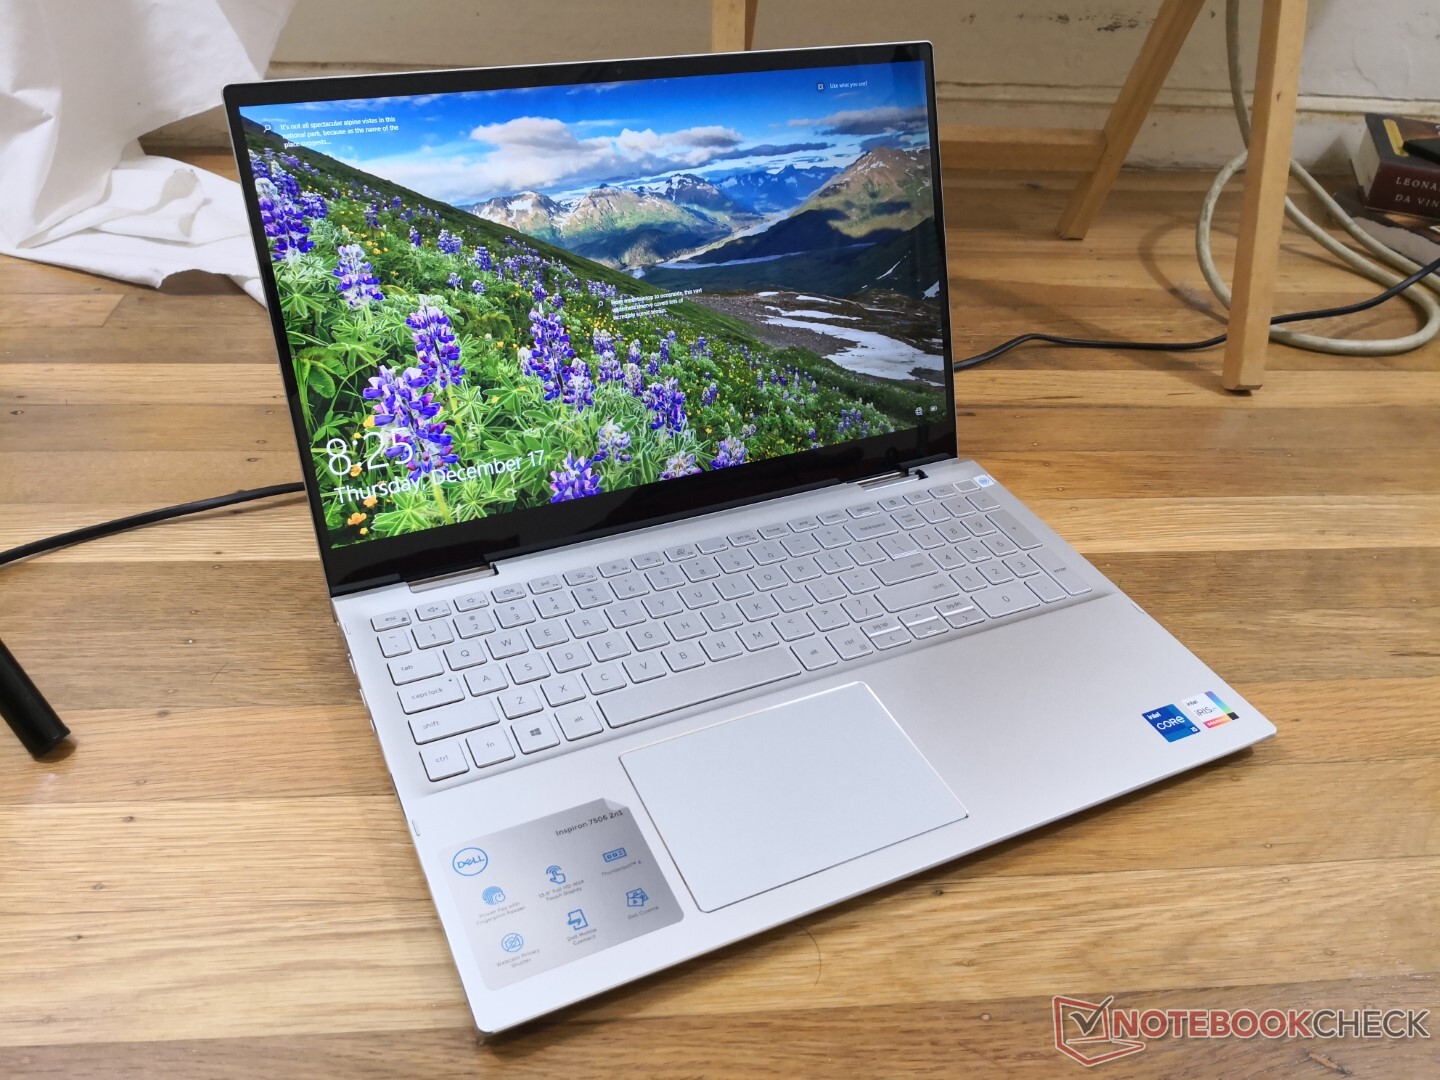
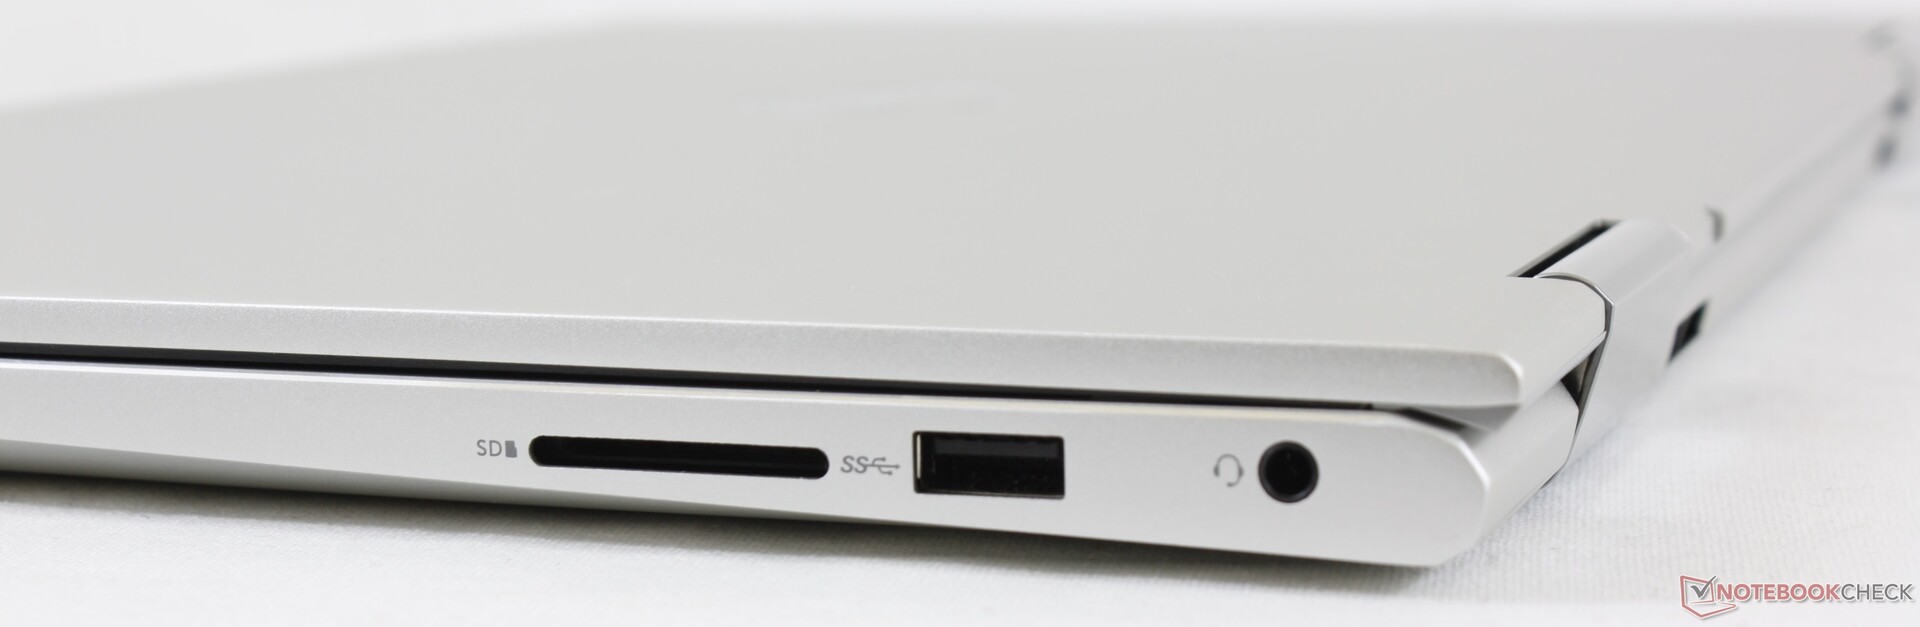
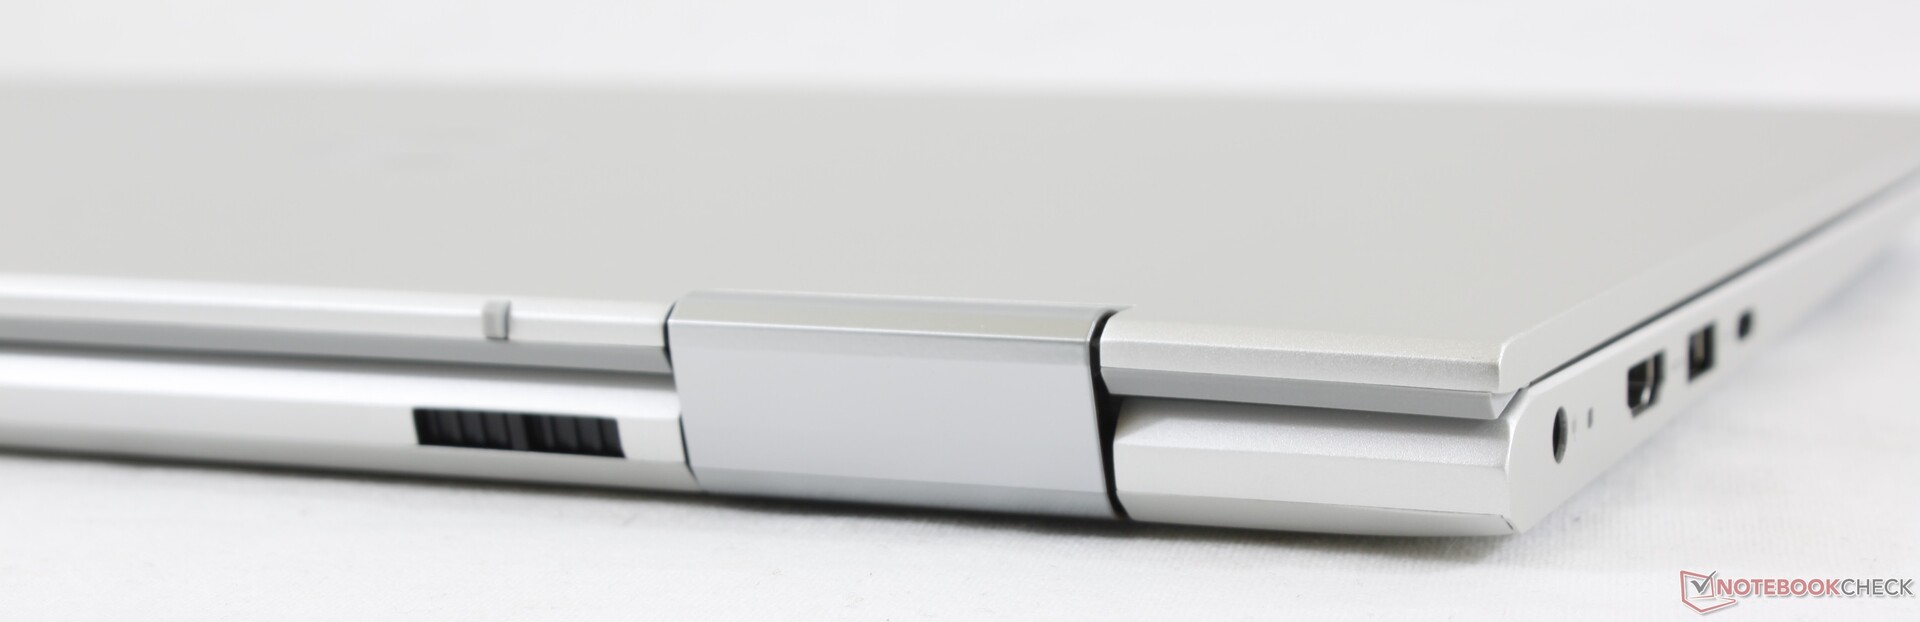
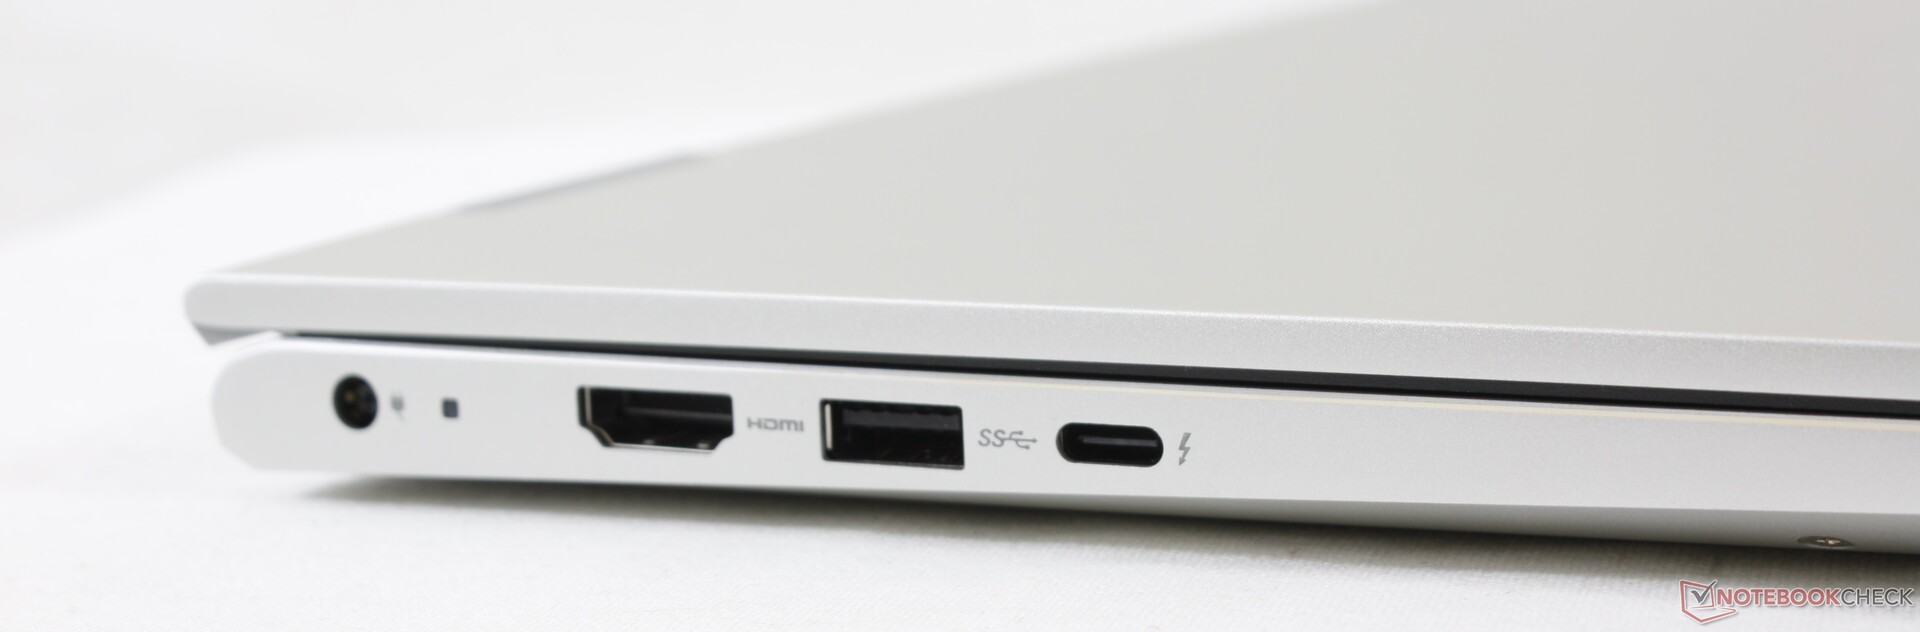
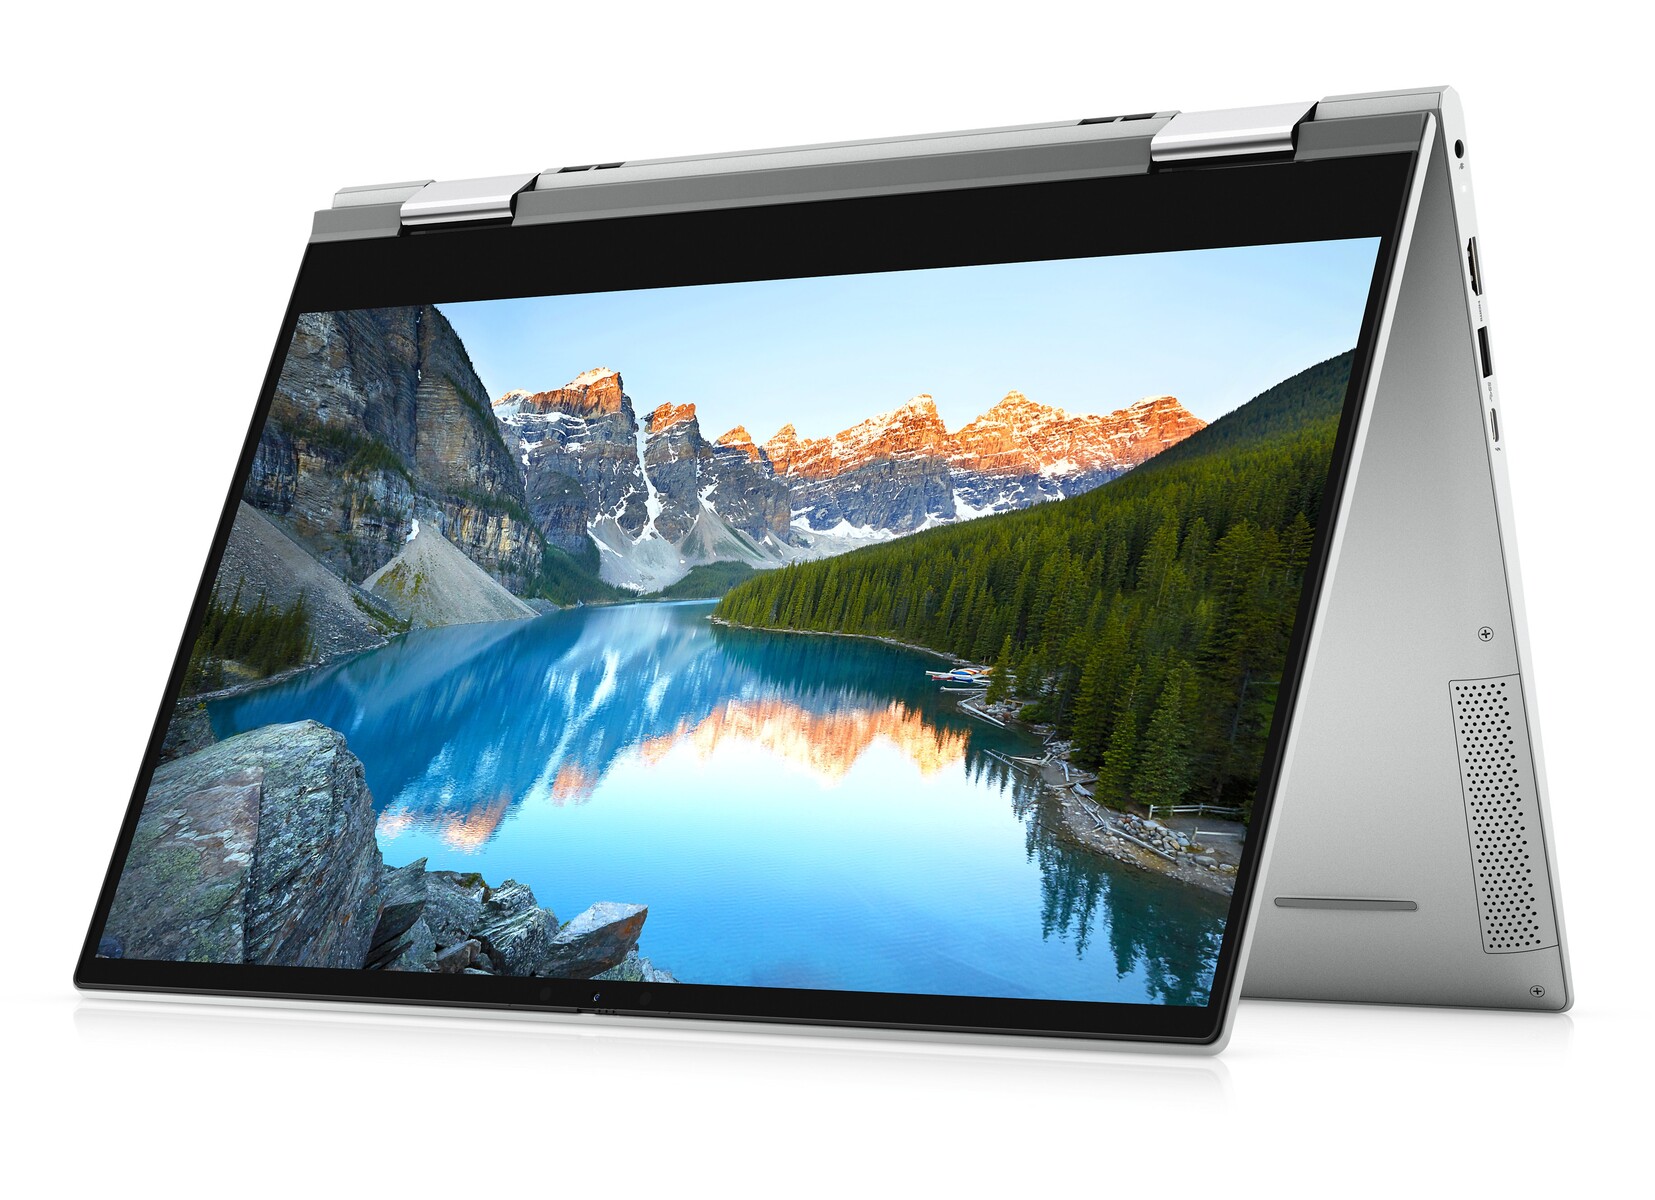
Den största skillnaden mellan Inspiron 15 7506 2-in-1 Silver Edition och andra omvandlingsbara modeller på 15.6 tum med äldre processorer är att den har stöd för Thunderbolt 4. Modeller som Asus ZenBook Flip 15, VivoBook Flip 15 eller HP Envy x360 15 har inte stöd för Thunderbolt alls, vilket begränsar deras dockningsförmågor. Om du planerar att använda Thunderbolt med eGPU:er eller flera 4K-skärmar kan du få stor nytta av Dells omvandlingsbara.
Andra nämnvärda egenskaper är en högpresterande processor samt RAM och SSD-enhet som är lätta att komma åt. Att Dells system är omvandlingsbart betyder inte att du behöver offra prestanda eller servicemöjligheter.
På den negativa sidan kunde den mjuka klickplattan och tangentbordets återkoppling behövt lite mer arbete. Knapparna är inte i närheten lika fasta och trevliga att skriva med som på Envy x360 15 och det grå typsnittet kan vara svårt att se mot de grå tangenterna. Om du kan vänja dig vid detta är Inspiron 15 7506 2-in-1 en mångsidig lösning tack vare sin formfaktor, stabil prestanda och ett brett utbud av anslutningsmöjligheter.
En balanserad omvandlingsbar med utmärkt prestanda, goda servicemöjligheter och stöd för Thunderbolt 4. Men det finns fortfarande utrymme för förbättring när det kommer till klickplattan och skärmens ljusstyrka.
Dell Inspiron 15 7506 2-in-1 P97F
- 12/20/2020 v7 (old)
Allen Ngo
Price comparison
