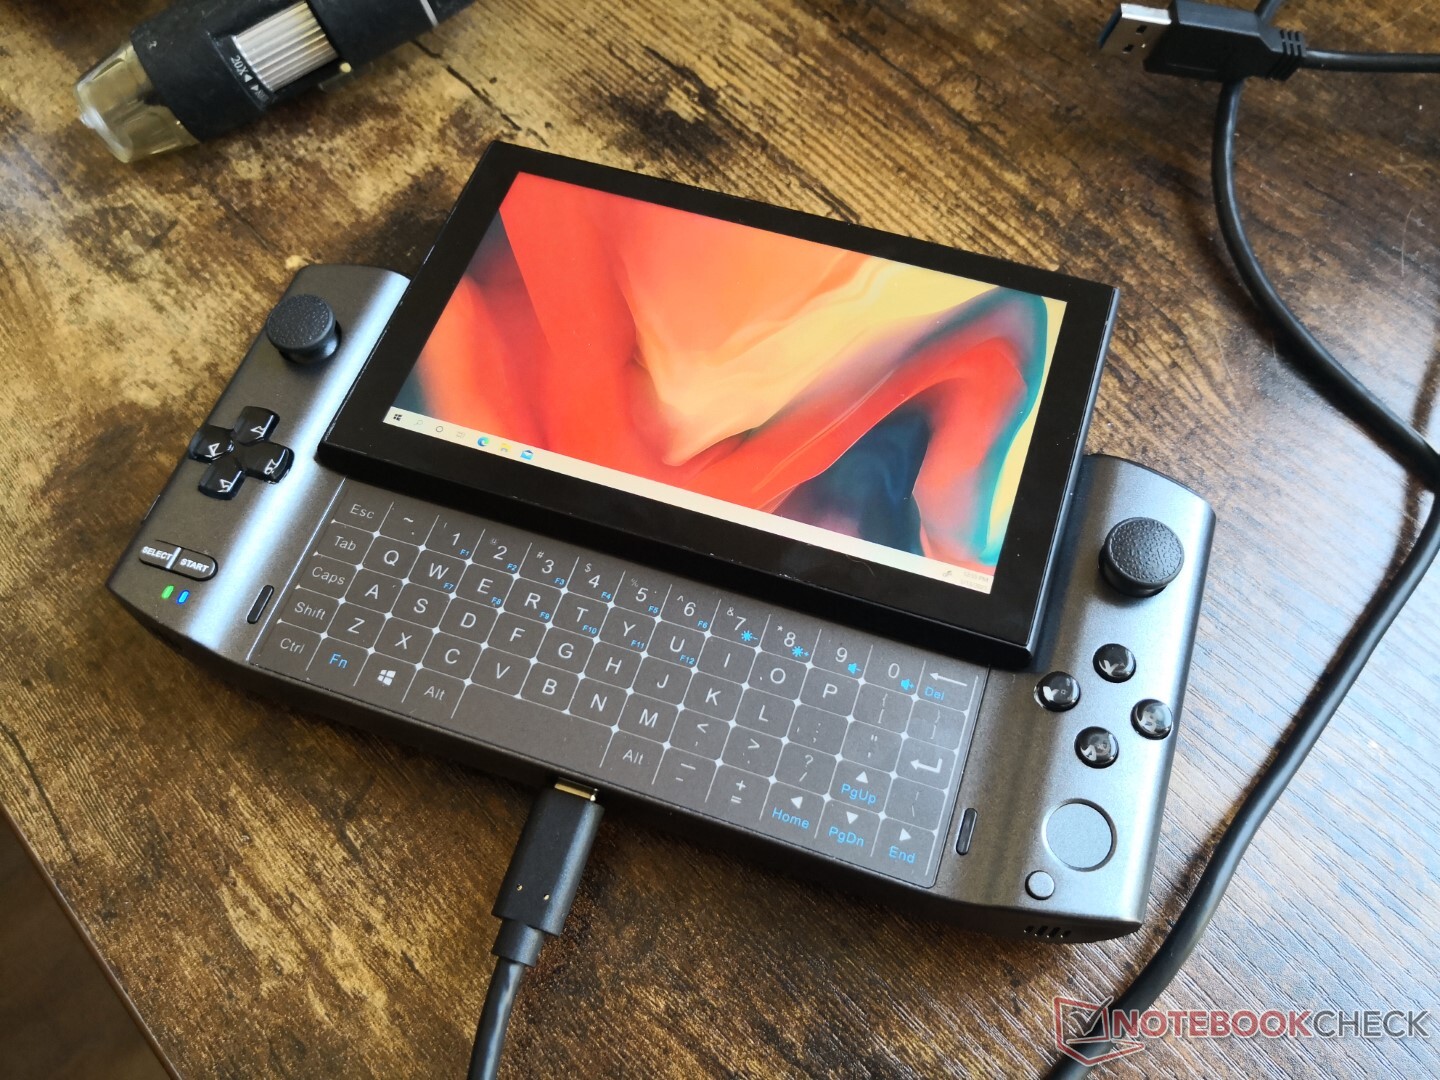
Test: GPD Win 3 - En inofficiell Microsoft Switch (Sammanfattning)
Testgrupp
Gradering | Datum | Modell | Vikt | Höjd | Storlek | Upplösning | Pris |
|---|---|---|---|---|---|---|---|
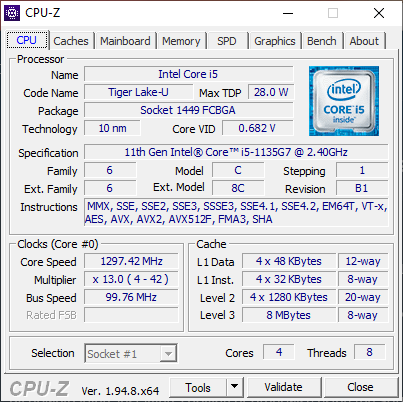
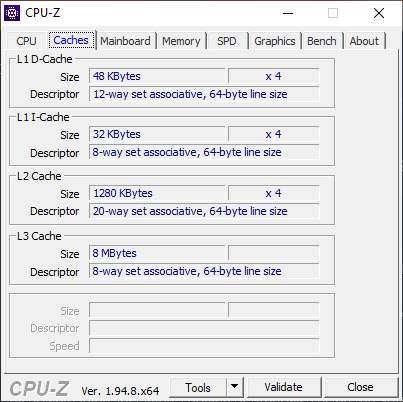
v (old) | 01/2021 | GPD Win 3 i5-1135G7, Iris Xe G7 80EUs | 553 g | 27 mm | 5.50" | 1280x720 | |
| 88.1 % v7 (old) | 12/2020 | Dell XPS 13 9310 Core i7 FHD i7-1165G7, Iris Xe G7 96EUs | 1.3 kg | 14.8 mm | 13.40" | 1920x1200 | |
| 91.1 % v7 (old) | 12/2020 | Apple MacBook Air 2020 M1 Entry M1, M1 7-Core GPU | 1.3 kg | 16.1 mm | 13.30" | 2560x1600 | |
| 88.4 % v7 (old) | 01/2020 | HP Spectre x360 13-aw0013dx i7-1065G7, Iris Plus Graphics G7 (Ice Lake 64 EU) | 1.2 kg | 16.9 mm | 13.30" | 1920x1080 | |
| 87.5 % v7 (old) | 08/2020 | Asus ZenBook 13 UX325JA i7-1065G7, Iris Plus Graphics G7 (Ice Lake 64 EU) | 1.1 kg | 13.9 mm | 13.30" | 1920x1080 | |
| 84 % v7 (old) | 02/2020 | Microsoft Surface Laptop 3 13 Core i5-1035G7 i5-1035G7, Iris Plus Graphics G7 (Ice Lake 64 EU) | 1.3 kg | 14.5 mm | 13.50" | 2256x1504 |
| SD Card Reader | |
| average JPG Copy Test (av. of 3 runs) | |
| Dell XPS 13 9310 Core i7 FHD (Toshiba Exceria Pro M501 64 GB UHS-II) | |
| HP Spectre x360 13-aw0013dx (Toshiba Exceria Pro M501 microSDXC 64GB) | |
| GPD Win 3 (Toshiba Exceria Pro M501 32 GB UHS-II) | |
| Asus ZenBook 13 UX325JA (Toshiba Exceria Pro M501 microSDXC 64GB) | |
| maximum AS SSD Seq Read Test (1GB) | |
| Dell XPS 13 9310 Core i7 FHD (Toshiba Exceria Pro M501 64 GB UHS-II) | |
| HP Spectre x360 13-aw0013dx (Toshiba Exceria Pro M501 microSDXC 64GB) | |
| GPD Win 3 (Toshiba Exceria Pro M501 32 GB UHS-II) | |
| Asus ZenBook 13 UX325JA (Toshiba Exceria Pro M501 microSDXC 64GB) | |
| |||||||||||||||||||||||||
Distribution av ljusstyrkan: 93 %
Mitt på batteriet: 468.8 cd/m²
Kontrast: 1042:1 (Svärta: 0.45 cd/m²)
ΔE ColorChecker Calman: 9 | ∀{0.5-29.43 Ø4.73}
calibrated: 1.91
ΔE Greyscale Calman: 10.9 | ∀{0.09-98 Ø4.97}
89.2% sRGB (Argyll 1.6.3 3D)
56.6% AdobeRGB 1998 (Argyll 1.6.3 3D)
61.4% AdobeRGB 1998 (Argyll 3D)
89.6% sRGB (Argyll 3D)
59.5% Display P3 (Argyll 3D)
Gamma: 2.13
CCT: 10972 K
| GPD Win 3 IPS, 5.5", 1280x720 | Dell XPS 13 9310 Core i7 FHD Sharp LQ134N1, IPS, 13.4", 1920x1200 | Apple MacBook Air 2020 M1 Entry IPS, 13.3", 2560x1600 | HP Spectre x360 13-aw0013dx AU Optronics AUO5E2D, IPS, 13.3", 1920x1080 | Asus ZenBook 13 UX325JA Sharp LQ133M1JW40, IPS, 13.3", 1920x1080 | Microsoft Surface Laptop 3 13 Core i5-1035G7 Sharp LQ135P1JX51, IPS, 13.5", 2256x1504 | |
|---|---|---|---|---|---|---|
| Display | 16% | 39% | 14% | 6% | 10% | |
| Display P3 Coverage (%) | 59.5 | 70.9 19% | 98.6 66% | 69.6 17% | 63.8 7% | 65.7 10% |
| sRGB Coverage (%) | 89.6 | 99.1 11% | 100 12% | 98.9 10% | 94.5 5% | 98.6 10% |
| AdobeRGB 1998 Coverage (%) | 61.4 | 72.9 19% | 85.9 40% | 71.5 16% | 64.9 6% | 67.8 10% |
| Response Times | -30% | 10% | -48% | 0% | -56% | |
| Response Time Grey 50% / Grey 80% * (ms) | 40 ? | 52 ? -30% | 31 ? 22% | 60.8 ? -52% | 47 ? -18% | 59.2 ? -48% |
| Response Time Black / White * (ms) | 25.6 ? | 33.2 ? -30% | 26.1 ? -2% | 36.8 ? -44% | 21 ? 18% | 41.6 ? -63% |
| PWM Frequency (Hz) | 2475 ? | 118000 ? | 250 ? | 21740 ? | ||
| Screen | 29% | 34% | 22% | 16% | 31% | |
| Brightness middle (cd/m²) | 468.8 | 543.3 16% | 417 -11% | 447.4 -5% | 435 -7% | 403.4 -14% |
| Brightness (cd/m²) | 460 | 524 14% | 395 -14% | 420 -9% | 404 -12% | 397 -14% |
| Brightness Distribution (%) | 93 | 92 -1% | 91 -2% | 85 -9% | 83 -11% | 89 -4% |
| Black Level * (cd/m²) | 0.45 | 0.38 16% | 0.39 13% | 0.31 31% | 0.565 -26% | 0.34 24% |
| Contrast (:1) | 1042 | 1430 37% | 1069 3% | 1443 38% | 770 -26% | 1186 14% |
| Colorchecker dE 2000 * | 9 | 3.02 66% | 1.12 88% | 4.23 53% | 2.66 70% | 0.94 90% |
| Colorchecker dE 2000 max. * | 15.5 | 7.61 51% | 2.71 83% | 9.34 40% | 4.73 69% | 2.92 81% |
| Colorchecker dE 2000 calibrated * | 1.91 | 1.23 36% | 0.77 60% | 1.32 31% | 1.19 38% | 0.99 48% |
| Greyscale dE 2000 * | 10.9 | 5 54% | 1.7 84% | 6.1 44% | 3.65 67% | 0.9 92% |
| Gamma | 2.13 103% | 2.02 109% | 2207 0% | 2.11 104% | 2.34 94% | 2.13 103% |
| CCT | 10972 59% | 6550 99% | 6870 95% | 6136 106% | 7109 91% | 6620 98% |
| Color Space (Percent of AdobeRGB 1998) (%) | 56.6 | 66.8 18% | 64.8 14% | 60 6% | 62.3 10% | |
| Color Space (Percent of sRGB) (%) | 89.2 | 99.6 12% | 98.9 11% | 95 7% | 98.7 11% | |
| Totalt genomsnitt (program/inställningar) | 5% /
19% | 28% /
32% | -4% /
12% | 7% /
12% | -5% /
16% |
* ... mindre är bättre
Visa svarstider
| ↔ Svarstid svart till vitt | ||
|---|---|---|
| 25.6 ms ... stiga ↗ och falla ↘ kombinerat | ↗ 13.6 ms stiga | 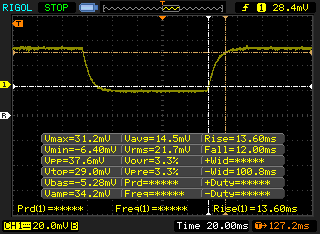 |
| ↘ 12 ms hösten | ||
| Skärmen visar relativt långsamma svarsfrekvenser i våra tester och kan vara för långsam för spelare. I jämförelse sträcker sig alla testade enheter från 0.1 (minst) till 240 (maximalt) ms. » 61 % av alla enheter är bättre. Detta innebär att den uppmätta svarstiden är sämre än genomsnittet av alla testade enheter (19.9 ms). | ||
| ↔ Svarstid 50 % grått till 80 % grått | ||
| 40 ms ... stiga ↗ och falla ↘ kombinerat | ↗ 22 ms stiga | 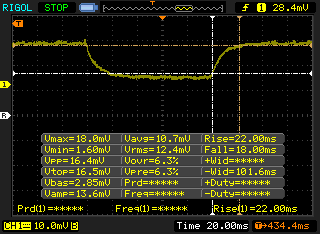 |
| ↘ 18 ms hösten | ||
| Skärmen visar långsamma svarsfrekvenser i våra tester och kommer att vara otillfredsställande för spelare. I jämförelse sträcker sig alla testade enheter från 0.165 (minst) till 636 (maximalt) ms. » 61 % av alla enheter är bättre. Detta innebär att den uppmätta svarstiden är sämre än genomsnittet av alla testade enheter (31.1 ms). | ||
Skärmflimmer / PWM (Puls-Width Modulation)
| Skärmflimmer / PWM upptäcktes inte | 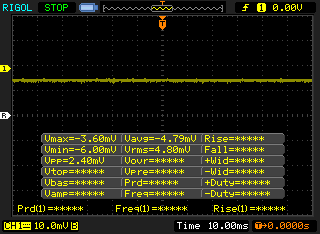 | ||
Som jämförelse: 52 % av alla testade enheter använder inte PWM för att dämpa skärmen. Om PWM upptäcktes mättes ett medelvärde av 7801 (minst: 5 - maximum: 343500) Hz. | |||
Cinebench R15: CPU Multi 64Bit | CPU Single 64Bit
Blender: v2.79 BMW27 CPU
7-Zip 18.03: 7z b 4 -mmt1 | 7z b 4
Geekbench 5.5: Single-Core | Multi-Core
HWBOT x265 Benchmark v2.2: 4k Preset
LibreOffice : 20 Documents To PDF
R Benchmark 2.5: Overall mean
| Cinebench R20 / CPU (Multi Core) | |
| Lenovo Yoga Slim 7 14ARE05 82A20008GE | |
| Razer Book 13 FHD | |
| Genomsnitt Intel Core i7-1165G7 (1060 - 2657, n=81) | |
| Dell XPS 13 9310 Core i7 4K | |
| GPD Win 3 | |
| Genomsnitt Intel Core i5-1135G7 (979 - 2382, n=62) | |
| Acer Swift 3 SF314-42-R27B | |
| Asus ZenBook 13 UX325JA | |
| Samsung Galaxy Book Flex 13.3 | |
| Lenovo ThinkBook 13s-20R90071GE | |
| HP Envy 13-aq0003ng | |
| Dynabook Portege A30-E-174 | |
| Cinebench R20 / CPU (Single Core) | |
| Razer Book 13 FHD | |
| Dell XPS 13 9310 Core i7 4K | |
| Genomsnitt Intel Core i7-1165G7 (442 - 589, n=81) | |
| GPD Win 3 | |
| Genomsnitt Intel Core i5-1135G7 (375 - 527, n=62) | |
| Lenovo Yoga Slim 7 14ARE05 82A20008GE | |
| Asus ZenBook 13 UX325JA | |
| Acer Swift 3 SF314-42-R27B | |
| Samsung Galaxy Book Flex 13.3 | |
| Lenovo ThinkBook 13s-20R90071GE | |
| Dynabook Portege A30-E-174 | |
| HP Envy 13-aq0003ng | |
| Cinebench R15 / CPU Multi 64Bit | |
| Lenovo Yoga Slim 7 14ARE05 82A20008GE | |
| Razer Book 13 FHD | |
| Dell XPS 13 9310 Core i7 4K | |
| Genomsnitt Intel Core i7-1165G7 (553 - 1027, n=86) | |
| Genomsnitt Intel Core i5-1135G7 (431 - 941, n=65) | |
| Asus ZenBook 13 UX325JA | |
| GPD Win 3 | |
| Lenovo ThinkBook 13s-20R90071GE | |
| Acer Swift 3 SF314-42-R27B | |
| Samsung Galaxy Book Flex 13.3 | |
| HP Envy 13-aq0003ng | |
| Dynabook Portege A30-E-174 | |
| Cinebench R15 / CPU Single 64Bit | |
| Razer Book 13 FHD | |
| Dell XPS 13 9310 Core i7 4K | |
| Genomsnitt Intel Core i7-1165G7 (115 - 230, n=78) | |
| GPD Win 3 | |
| Genomsnitt Intel Core i5-1135G7 (141.4 - 205, n=61) | |
| Asus ZenBook 13 UX325JA | |
| Lenovo Yoga Slim 7 14ARE05 82A20008GE | |
| HP Envy 13-aq0003ng | |
| Acer Swift 3 SF314-42-R27B | |
| Samsung Galaxy Book Flex 13.3 | |
| Lenovo ThinkBook 13s-20R90071GE | |
| Dynabook Portege A30-E-174 | |
| Blender / v2.79 BMW27 CPU | |
| Samsung Galaxy Book Flex 13.3 | |
| Asus ZenBook 13 UX325JA | |
| Acer Swift 3 SF314-42-R27B | |
| Lenovo ThinkBook 13s-20R90071GE | |
| HP Envy x360 13-ay0359ng | |
| Genomsnitt Intel Core i5-1135G7 (499 - 1044, n=60) | |
| Dell XPS 13 9310 Core i7 4K | |
| GPD Win 3 | |
| Genomsnitt Intel Core i7-1165G7 (468 - 1138, n=80) | |
| Razer Book 13 FHD | |
| Lenovo Yoga Slim 7 14ARE05 82A20008GE | |
| 7-Zip 18.03 / 7z b 4 -mmt1 | |
| Razer Book 13 FHD | |
| Genomsnitt Intel Core i7-1165G7 (4478 - 5507, n=80) | |
| Dell XPS 13 9310 Core i7 4K | |
| GPD Win 3 | |
| Genomsnitt Intel Core i5-1135G7 (3924 - 4921, n=62) | |
| Lenovo Yoga Slim 7 14ARE05 82A20008GE | |
| Asus ZenBook 13 UX325JA | |
| HP Envy x360 13-ay0359ng | |
| Samsung Galaxy Book Flex 13.3 | |
| Acer Swift 3 SF314-42-R27B | |
| Lenovo ThinkBook 13s-20R90071GE | |
| 7-Zip 18.03 / 7z b 4 | |
| Lenovo Yoga Slim 7 14ARE05 82A20008GE | |
| Razer Book 13 FHD | |
| Genomsnitt Intel Core i7-1165G7 (15347 - 27405, n=80) | |
| HP Envy x360 13-ay0359ng | |
| GPD Win 3 | |
| Genomsnitt Intel Core i5-1135G7 (14745 - 24873, n=62) | |
| Dell XPS 13 9310 Core i7 4K | |
| Lenovo ThinkBook 13s-20R90071GE | |
| Acer Swift 3 SF314-42-R27B | |
| Asus ZenBook 13 UX325JA | |
| Samsung Galaxy Book Flex 13.3 | |
| Geekbench 5.5 / Single-Core | |
| Razer Book 13 FHD | |
| Dell XPS 13 9310 Core i7 4K | |
| Genomsnitt Intel Core i7-1165G7 (1302 - 1595, n=77) | |
| GPD Win 3 | |
| Genomsnitt Intel Core i5-1135G7 (1147 - 1428, n=58) | |
| Asus ZenBook 13 UX325JA | |
| Samsung Galaxy Book Flex 13.3 | |
| Lenovo Yoga Slim 7 14ARE05 82A20008GE | |
| Acer Swift 3 SF314-42-R27B | |
| Geekbench 5.5 / Multi-Core | |
| Lenovo Yoga Slim 7 14ARE05 82A20008GE | |
| Razer Book 13 FHD | |
| Dell XPS 13 9310 Core i7 4K | |
| Genomsnitt Intel Core i7-1165G7 (3078 - 5926, n=77) | |
| GPD Win 3 | |
| Genomsnitt Intel Core i5-1135G7 (3475 - 5472, n=58) | |
| Asus ZenBook 13 UX325JA | |
| Samsung Galaxy Book Flex 13.3 | |
| Acer Swift 3 SF314-42-R27B | |
| HWBOT x265 Benchmark v2.2 / 4k Preset | |
| Lenovo Yoga Slim 7 14ARE05 82A20008GE | |
| Razer Book 13 FHD | |
| Genomsnitt Intel Core i7-1165G7 (1.39 - 8.47, n=80) | |
| GPD Win 3 | |
| HP Envy x360 13-ay0359ng | |
| Genomsnitt Intel Core i5-1135G7 (3.57 - 7.6, n=57) | |
| Dell XPS 13 9310 Core i7 4K | |
| Lenovo ThinkBook 13s-20R90071GE | |
| Acer Swift 3 SF314-42-R27B | |
| Asus ZenBook 13 UX325JA | |
| Samsung Galaxy Book Flex 13.3 | |
| LibreOffice / 20 Documents To PDF | |
| HP Envy x360 13-ay0359ng | |
| Lenovo Yoga Slim 7 14ARE05 82A20008GE | |
| Acer Swift 3 SF314-42-R27B | |
| Samsung Galaxy Book Flex 13.3 | |
| Genomsnitt Intel Core i5-1135G7 (44.2 - 62.9, n=60) | |
| Asus ZenBook 13 UX325JA | |
| Razer Book 13 FHD | |
| Genomsnitt Intel Core i7-1165G7 (21.5 - 88.1, n=78) | |
| GPD Win 3 | |
| Dell XPS 13 9310 Core i7 4K | |
| R Benchmark 2.5 / Overall mean | |
| Samsung Galaxy Book Flex 13.3 | |
| Acer Swift 3 SF314-42-R27B | |
| Asus ZenBook 13 UX325JA | |
| Genomsnitt Intel Core i5-1135G7 (0.619 - 0.727, n=59) | |
| HP Envy x360 13-ay0359ng | |
| GPD Win 3 | |
| Lenovo Yoga Slim 7 14ARE05 82A20008GE | |
| Dell XPS 13 9310 Core i7 4K | |
| Genomsnitt Intel Core i7-1165G7 (0.552 - 1.002, n=80) | |
| Razer Book 13 FHD | |
* ... mindre är bättre
| PCMark 8 Home Score Accelerated v2 | 4463 poäng | |
| PCMark 8 Work Score Accelerated v2 | 3214 poäng | |
| PCMark 10 Score | 4663 poäng | |
Hjälp | ||
| DPC Latencies / LatencyMon - interrupt to process latency (max), Web, Youtube, Prime95 | |
| Asus ZenBook 13 UX325JA | |
| Razer Book 13 FHD | |
| Dell XPS 13 9310 Core i7 4K | |
| Lenovo Yoga 9i 14ITL5 | |
| Dell XPS 13 9310 Core i7 FHD | |
| Samsung Galaxy Book Flex 13.3 | |
| GPD Win 3 | |
| Lenovo ThinkBook 13s-ITL-20V90003GE | |
| Acer Swift 3 SF314-42-R27B | |
| Lenovo Yoga 7 14ITL5 | |
* ... mindre är bättre
| GPD Win 3 BIWIN NS200 1TB CNF82GS1G02-1TB | Dell XPS 13 9310 Core i7 FHD Micron 2300 512GB MTFDHBA512TDV | HP Spectre x360 13-aw0013dx Intel Optane Memory H10 with Solid State Storage 32GB + 512GB HBRPEKNX0202A(L/H) | Asus ZenBook 13 UX325JA Intel SSD 660p 1TB SSDPEKNW010T8 | Microsoft Surface Laptop 3 13 Core i5-1035G7 SK hynix BC501 HFM256GDGTNG | |
|---|---|---|---|---|---|
| AS SSD | -38% | -54% | -40% | -53% | |
| Seq Read (MB/s) | 1585 | 2091 32% | 1039 -34% | 1587 0% | 1387 -12% |
| Seq Write (MB/s) | 1776 | 1396 -21% | 310.1 -83% | 938 -47% | 504 -72% |
| 4K Read (MB/s) | 61.6 | 49.29 -20% | 76 23% | 51 -17% | 42.35 -31% |
| 4K Write (MB/s) | 208.9 | 104.2 -50% | 118 -44% | 141.9 -32% | 120 -43% |
| 4K-64 Read (MB/s) | 1142 | 827 -28% | 371.8 -67% | 576 -50% | 497.4 -56% |
| 4K-64 Write (MB/s) | 1103 | 1636 48% | 469.5 -57% | 584 -47% | 354.9 -68% |
| Access Time Read * (ms) | 0.03 | 0.066 -120% | 0.067 -123% | 0.083 -177% | 0.055 -83% |
| Access Time Write * (ms) | 0.074 | 0.365 -393% | 0.138 -86% | 0.04 46% | 0.093 -26% |
| Score Read (Points) | 1362 | 1086 -20% | 552 -59% | 785 -42% | 678 -50% |
| Score Write (Points) | 1489 | 1880 26% | 618 -58% | 820 -45% | 525 -65% |
| Score Total (Points) | 3573 | 3499 -2% | 1448 -59% | 1990 -44% | 1520 -57% |
| Copy ISO MB/s (MB/s) | 1741 | 1544 -11% | 764 -56% | 1311 -25% | 764 -56% |
| Copy Program MB/s (MB/s) | 543 | 613 13% | 465.8 -14% | 310.3 -43% | 256.1 -53% |
| Copy Game MB/s (MB/s) | 1318 | 1451 10% | 764 -42% | 801 -39% | 368.4 -72% |
| CrystalDiskMark 5.2 / 6 | -4% | -20% | -25% | -42% | |
| Write 4K (MB/s) | 223 | 97.5 -56% | 112.6 -50% | 139.7 -37% | 112.3 -50% |
| Read 4K (MB/s) | 66.5 | 50.9 -23% | 131 97% | 56.4 -15% | 42.13 -37% |
| Write Seq (MB/s) | 1857 | 1811 -2% | 458.9 -75% | 1265 -32% | 630 -66% |
| Read Seq (MB/s) | 1737 | 1836 6% | 1355 -22% | 1492 -14% | 1023 -41% |
| Write 4K Q32T1 (MB/s) | 611 | 521 -15% | 341.3 -44% | 402.5 -34% | 336.6 -45% |
| Read 4K Q32T1 (MB/s) | 688 | 357.5 -48% | 320.6 -53% | 329.3 -52% | 399.6 -42% |
| Write Seq Q32T1 (MB/s) | 1948 | 2879 48% | 1219 -37% | 1786 -8% | 821 -58% |
| Read Seq Q32T1 (MB/s) | 1995 | 3204 61% | 2462 23% | 1923 -4% | 2030 2% |
| Totalt genomsnitt (program/inställningar) | -21% /
-26% | -37% /
-42% | -33% /
-34% | -48% /
-49% |
* ... mindre är bättre

DiskSpd Read Loop, Queue Depth 8
| 3DMark 11 Performance | 6290 poäng | |
| 3DMark Cloud Gate Standard Score | 18709 poäng | |
| 3DMark Fire Strike Score | 4395 poäng | |
| 3DMark Time Spy Score | 1506 poäng | |
Hjälp | ||
| låg | med. | hög | ultra | |
|---|---|---|---|---|
| GTA V (2015) | 73.6 | 60.9 | 23.5 | |
| The Witcher 3 (2015) | 90.6 | 55.6 | 31.7 | 14.1 |
| Dota 2 Reborn (2015) | 81.4 | 64.2 | 44.3 | 44.2 |
| Final Fantasy XV Benchmark (2018) | 38.9 | 21 | 16.5 | |
| X-Plane 11.11 (2018) | 26.6 | 35.6 | 31.6 | |
| Strange Brigade (2018) | 87.7 | 36.2 | 28 | 22.8 |
| GPD Win 3 Iris Xe G7 80EUs, i5-1135G7, BIWIN NS200 1TB CNF82GS1G02-1TB | Dell XPS 13 9310 Core i7 FHD Iris Xe G7 96EUs, i7-1165G7, Micron 2300 512GB MTFDHBA512TDV | HP Spectre x360 13-aw0013dx Iris Plus Graphics G7 (Ice Lake 64 EU), i7-1065G7, Intel Optane Memory H10 with Solid State Storage 32GB + 512GB HBRPEKNX0202A(L/H) | Asus ZenBook 13 UX325JA Iris Plus Graphics G7 (Ice Lake 64 EU), i7-1065G7, Intel SSD 660p 1TB SSDPEKNW010T8 | Microsoft Surface Laptop 3 13 Core i5-1035G7 Iris Plus Graphics G7 (Ice Lake 64 EU), i5-1035G7, SK hynix BC501 HFM256GDGTNG | |
|---|---|---|---|---|---|
| Noise | 16% | 11% | 4% | 7% | |
| av / miljö * (dB) | 27.4 | 25.7 6% | 28.5 -4% | 30.1 -10% | 28.5 -4% |
| Idle Minimum * (dB) | 29.1 | 25.7 12% | 28.5 2% | 30.1 -3% | 28.5 2% |
| Idle Average * (dB) | 29.1 | 25.7 12% | 28.5 2% | 30.1 -3% | 28.5 2% |
| Idle Maximum * (dB) | 29.1 | 25.9 11% | 28.5 2% | 30.1 -3% | 28.5 2% |
| Load Average * (dB) | 40.7 | 26.2 36% | 28.5 30% | 32.7 20% | 28.5 30% |
| Witcher 3 ultra * (dB) | 42.8 | 36.5 15% | 35.3 18% | 38.6 10% | 40.4 6% |
| Load Maximum * (dB) | 46.3 | 36.6 21% | 35.3 24% | 38.5 17% | 40.4 13% |
* ... mindre är bättre
Ljudnivå
| Låg belastning |
| 29.1 / 29.1 / 29.1 dB(A) |
| Hög belastning |
| 40.7 / 46.3 dB(A) |
 | ||
30 dB tyst 40 dB(A) hörbar 50 dB(A) högt ljud |
||
min: | ||
GPD Win 3 ljudanalys
(+) | högtalare kan spela relativt högt (92.6 dB)
Bas 100 - 315 Hz
(-) | nästan ingen bas - i genomsnitt 22.3% lägre än medianen
(+) | basen är linjär (5.8% delta till föregående frekvens)
Mellan 400 - 2000 Hz
(±) | högre mellan - i genomsnitt 6% högre än median
(+) | mids är linjära (6% delta till föregående frekvens)
Högsta 2 - 16 kHz
(±) | högre toppar - i genomsnitt 7.5% högre än medianen
(±) | linjäriteten för toppar är genomsnittlig (7.4% delta till föregående frekvens)
Totalt 100 - 16 000 Hz
(±) | linjäriteten för det totala ljudet är genomsnittlig (21.6% skillnad mot median)
Jämfört med samma klass
» 83% av alla testade enheter i den här klassen var bättre, 9% liknande, 9% sämre
» Den bästa hade ett delta på 12%, genomsnittet var 17%, sämst var 23%
Jämfört med alla testade enheter
» 61% av alla testade enheter var bättre, 7% liknande, 32% sämre
» Den bästa hade ett delta på 4%, genomsnittet var 24%, sämst var 134%
Apple MacBook 12 (Early 2016) 1.1 GHz ljudanalys
(+) | högtalare kan spela relativt högt (83.6 dB)
Bas 100 - 315 Hz
(±) | reducerad bas - i genomsnitt 11.3% lägre än medianen
(±) | linjäriteten för basen är genomsnittlig (14.2% delta till föregående frekvens)
Mellan 400 - 2000 Hz
(+) | balanserad mellan - endast 2.4% från medianen
(+) | mids är linjära (5.5% delta till föregående frekvens)
Högsta 2 - 16 kHz
(+) | balanserade toppar - endast 2% från medianen
(+) | toppar är linjära (4.5% delta till föregående frekvens)
Totalt 100 - 16 000 Hz
(+) | det totala ljudet är linjärt (10.2% skillnad mot median)
Jämfört med samma klass
» 7% av alla testade enheter i den här klassen var bättre, 2% liknande, 91% sämre
» Den bästa hade ett delta på 5%, genomsnittet var 18%, sämst var 53%
Jämfört med alla testade enheter
» 5% av alla testade enheter var bättre, 1% liknande, 94% sämre
» Den bästa hade ett delta på 4%, genomsnittet var 24%, sämst var 134%
| Av/Standby | |
| Låg belastning | |
| Hög belastning |
|
Förklaring:
min: | |
| GPD Win 3 i5-1135G7, Iris Xe G7 80EUs, BIWIN NS200 1TB CNF82GS1G02-1TB, IPS, 1280x720, 5.5" | Dell XPS 13 9310 Core i7 FHD i7-1165G7, Iris Xe G7 96EUs, Micron 2300 512GB MTFDHBA512TDV, IPS, 1920x1200, 13.4" | Apple MacBook Air 2020 M1 Entry M1, M1 7-Core GPU, Apple SSD AP0256Q, IPS, 2560x1600, 13.3" | HP Spectre x360 13-aw0013dx i7-1065G7, Iris Plus Graphics G7 (Ice Lake 64 EU), Intel Optane Memory H10 with Solid State Storage 32GB + 512GB HBRPEKNX0202A(L/H), IPS, 1920x1080, 13.3" | Asus ZenBook 13 UX325JA i7-1065G7, Iris Plus Graphics G7 (Ice Lake 64 EU), Intel SSD 660p 1TB SSDPEKNW010T8, IPS, 1920x1080, 13.3" | Microsoft Surface Laptop 3 13 Core i5-1035G7 i5-1035G7, Iris Plus Graphics G7 (Ice Lake 64 EU), SK hynix BC501 HFM256GDGTNG, IPS, 2256x1504, 13.5" | |
|---|---|---|---|---|---|---|
| Power Consumption | -24% | -0% | -24% | -10% | -49% | |
| Idle Minimum * (Watt) | 2.9 | 3.9 -34% | 1.9 34% | 3.9 -34% | 2.4 17% | 4.4 -52% |
| Idle Average * (Watt) | 4.5 | 5.9 -31% | 6.4 -42% | 6.3 -40% | 4.6 -2% | 7.5 -67% |
| Idle Maximum * (Watt) | 4.5 | 6.3 -40% | 7 -56% | 6.8 -51% | 9 -100% | 7.8 -73% |
| Load Average * (Watt) | 38.5 | 39.7 -3% | 25 35% | 32.6 15% | 36 6% | 41.9 -9% |
| Witcher 3 ultra * (Watt) | 28.9 | 34.8 -20% | 25.6 11% | 27 7% | 40.8 -41% | |
| Load Maximum * (Watt) | 41.4 | 47.5 -15% | 30.3 27% | 59 -43% | 36 13% | 63.9 -54% |
* ... mindre är bättre
| GPD Win 3 i5-1135G7, Iris Xe G7 80EUs, 44 Wh | Dell XPS 13 9310 Core i7 FHD i7-1165G7, Iris Xe G7 96EUs, 52 Wh | Apple MacBook Air 2020 M1 Entry M1, M1 7-Core GPU, 49.9 Wh | HP Spectre x360 13-aw0013dx i7-1065G7, Iris Plus Graphics G7 (Ice Lake 64 EU), 60 Wh | Asus ZenBook 13 UX325JA i7-1065G7, Iris Plus Graphics G7 (Ice Lake 64 EU), 67 Wh | Microsoft Surface Laptop 3 13 Core i5-1035G7 i5-1035G7, Iris Plus Graphics G7 (Ice Lake 64 EU), 45 Wh | |
|---|---|---|---|---|---|---|
| Batteridrifttid | 72% | 42% | 48% | 80% | 10% | |
| WiFi v1.3 (h) | 11.3 | 11 -3% | 16 42% | 9.9 -12% | 13.8 22% | 8.3 -27% |
| Load (h) | 1.3 | 3.2 146% | 2.7 108% | 3.1 138% | 1.9 46% | |
| Reader / Idle (h) | 30 | 37.1 | 26.6 | 34.4 |
För
Emot
Läs den fullständiga versionen av den här recensionen på engelska här.
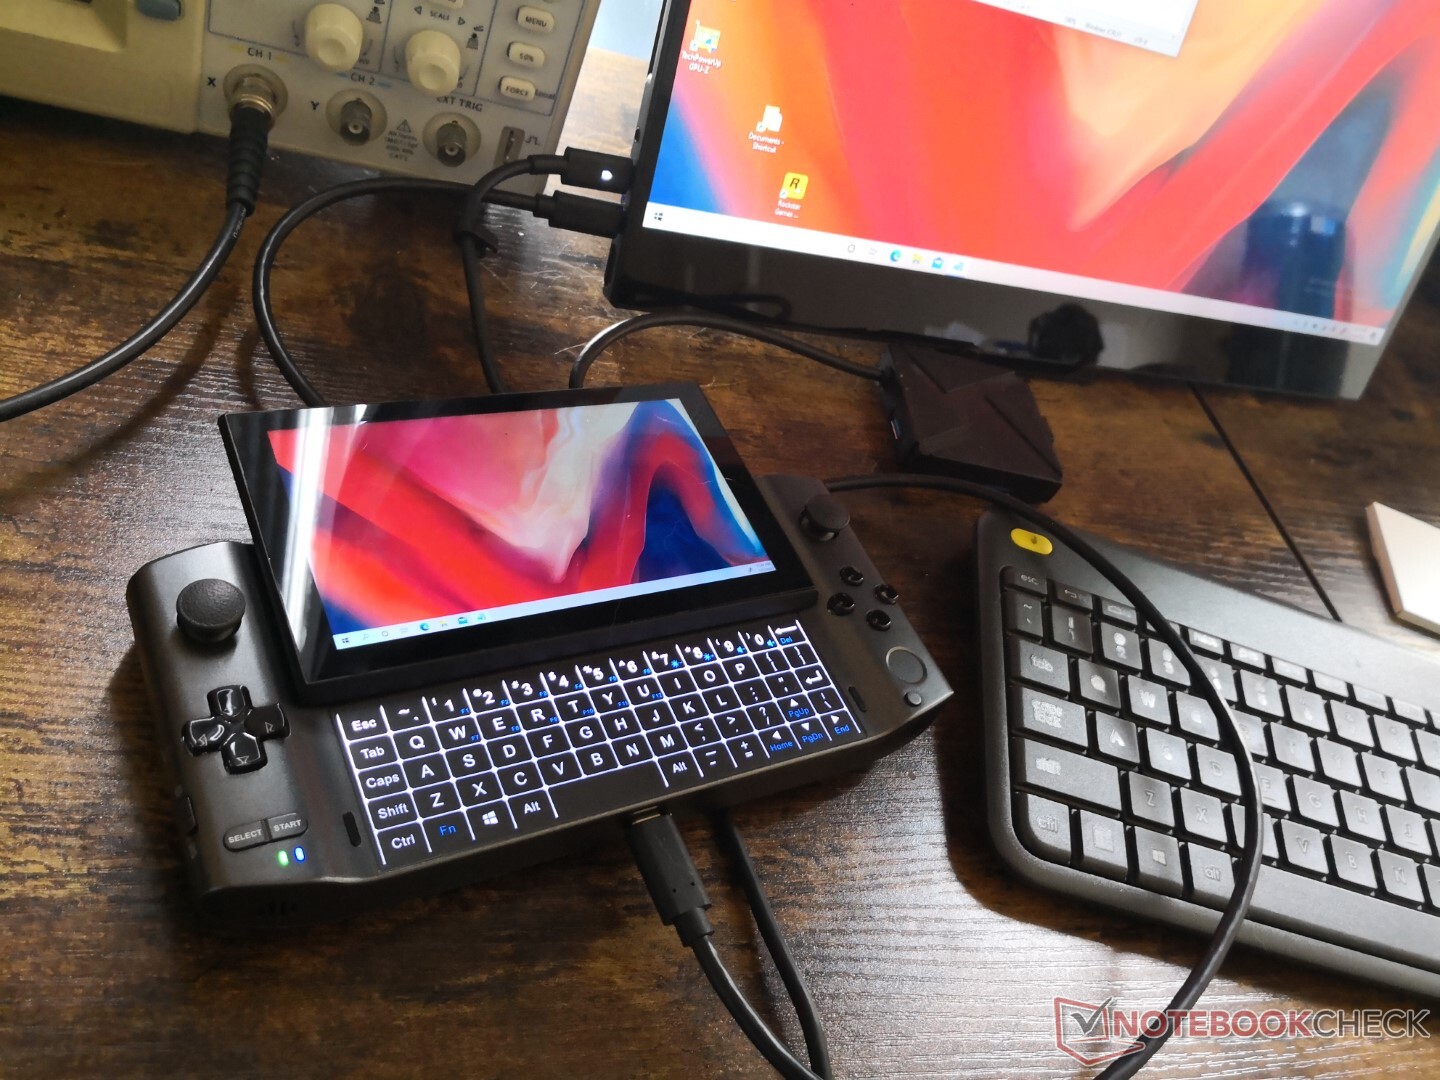
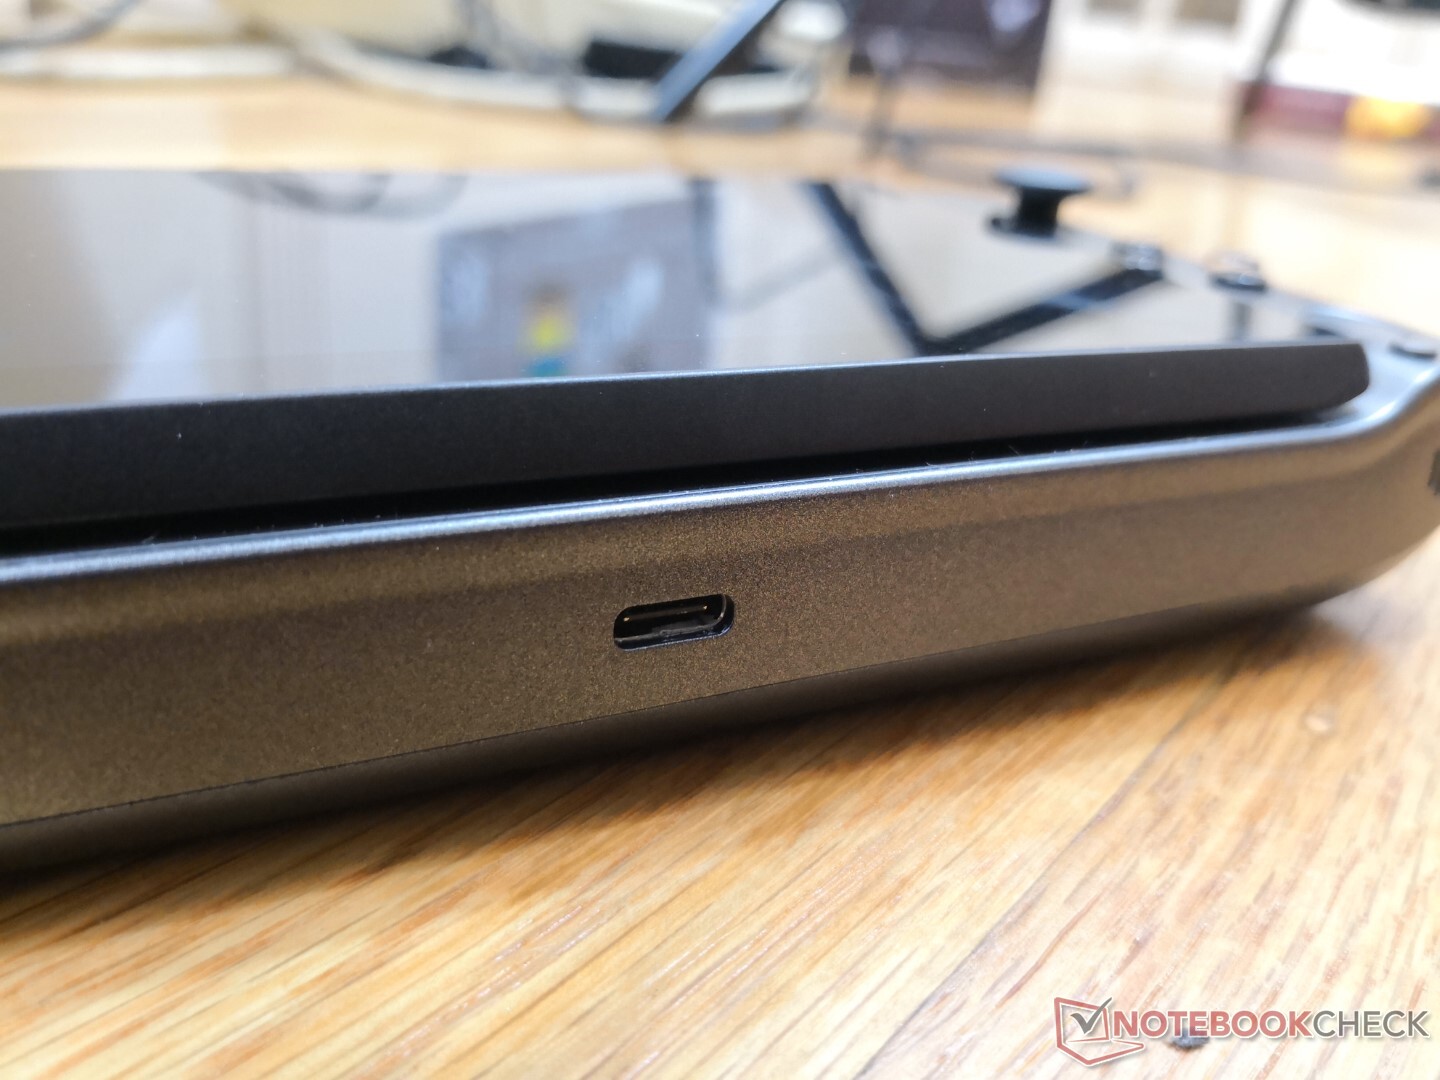
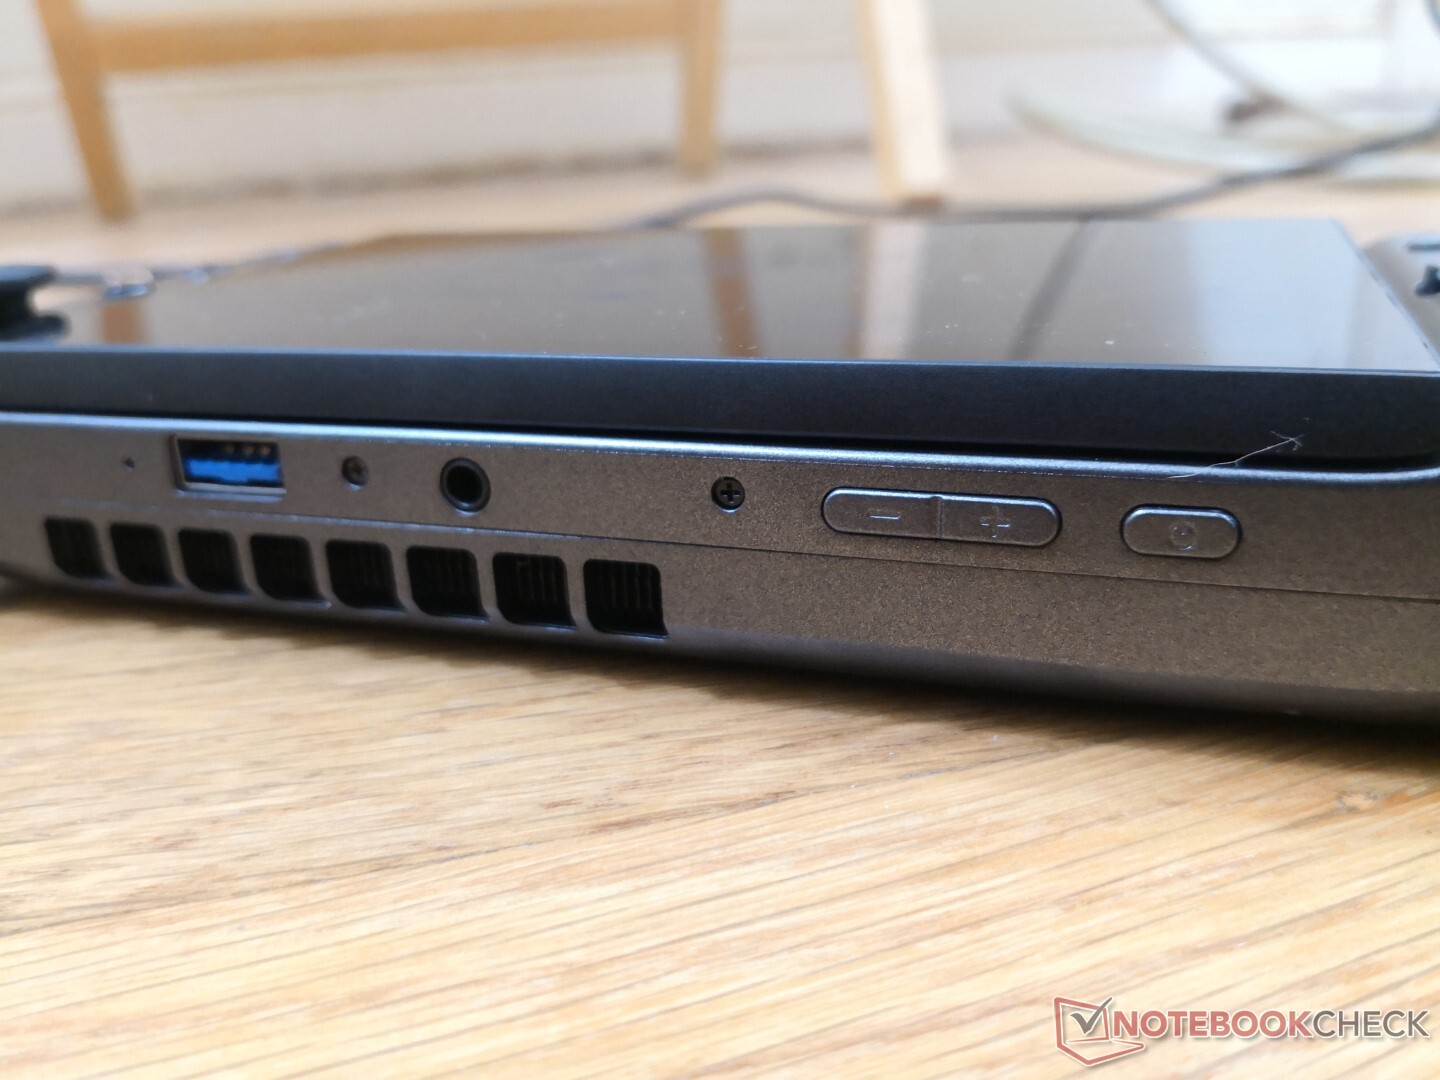
Win 3 är mer kraftfull än den ser ut då den i princip kör samma hårdvara som driver de senaste stora Intel Evo Ultrabook-modellerna. Integrerad möjlighet till Thunderbolt 4-dockning och en uppgraderbar M.2 NVMe SSD gör den än mer mångsidig.
En kraftfull handhållen enhet som hade behövt bättre knappar.
Det finns flera funktioner vi gärna skulle vilja se på en potentiell revidering. Stöd för adaptive sync, möjlighet att ställa in om den känns igen som en XBox/DualShock-kontroll, större skärm i förhållande till kroppen, en webbkamera samt lägre vikt är saker som hade gjort den bättre att använda.
Men med det sagt har den också en handfull irritationsmoment som behöver åtgärdas. Slumpartade tangentnedslag, svampiga knappar, att den plötsligt vaknar från sömnläge samt att knappar fastnar då och då gör att Win 3 känns som en billig tredjepartskontroll trots den kapabla hårdvaran på insidan. Det är inte omöjligt att vänja sig vid den, men om du redan är vad vid en vanlig XBox-, Playstation- eller Switch-kontroll kommer du önska att knapparna på Win 3 hade haft lite mer djup och återkoppling.
Price comparison
