Test: 2021 HP Envy 14 - Tiger Lake, 16:10 och GeForce GTX 1650 Ti Max-Q i samma enhet (Sammanfattning)
Testgrupp
Gradering | Datum | Modell | Vikt | Höjd | Storlek | Upplösning | Pris |
|---|---|---|---|---|---|---|---|
| 86.5 % v7 (old) | 02/2021 | HP Envy 14-eb0010nr i5-1135G7, GeForce GTX 1650 Ti Max-Q | 1.6 kg | 17.9 mm | 14.00" | 1920x1200 | |
| 84.2 % v7 (old) | 04/2021 | Lenovo IdeaPad Slim 9i 14ITL5 i7-1165G7, Iris Xe G7 96EUs | 1.3 kg | 14.6 mm | 14.00" | 3840x2160 | |
| 85.1 % v7 (old) | 02/2021 | Asus ZenBook Duo 14 UX482EA i7-1165G7, Iris Xe G7 96EUs | 1.6 kg | 16.9 mm | 14.00" | 1920x1080 | |
| 89.4 % v7 (old) | 12/2020 | HP Spectre x360 14t-ea000 i7-1165G7, Iris Xe G7 96EUs | 1.3 kg | 17.2 mm | 13.50" | 1920x1280 | |
| 74.5 % v7 (old) | 06/2020 | Dell Inspiron 14 3493-4KWCF i7-1065G7, GeForce MX230 | 1.8 kg | 21 mm | 14.00" | 1920x1080 | |
| 86.3 % v7 (old) | 12/2020 | Huawei MateBook 14 2020 Intel i7-10510U, GeForce MX350 | 1.5 kg | 15.9 mm | 14.00" | 2160x1440 |
| SD Card Reader | |
| average JPG Copy Test (av. of 3 runs) | |
| HP Spectre x360 14t-ea000 (Toshiba Exceria Pro M501 microSDXC 32GB) | |
| HP Envy 14-eb0010nr (Toshiba Exceria Pro M501 microSDXC 32GB) | |
| Asus ZenBook Duo 14 UX482EA (Toshiba Exceria Pro M501 microSDXC 32GB) | |
| maximum AS SSD Seq Read Test (1GB) | |
| HP Spectre x360 14t-ea000 (Toshiba Exceria Pro M501 microSDXC 32GB) | |
| HP Envy 14-eb0010nr (Toshiba Exceria Pro M501 microSDXC 32GB) | |
| Asus ZenBook Duo 14 UX482EA (Toshiba Exceria Pro M501 microSDXC 32GB) | |


| |||||||||||||||||||||||||
Distribution av ljusstyrkan: 81 %
Mitt på batteriet: 412 cd/m²
Kontrast: 1288:1 (Svärta: 0.32 cd/m²)
ΔE ColorChecker Calman: 1.88 | ∀{0.5-29.43 Ø4.73}
calibrated: 1.96
ΔE Greyscale Calman: 2.2 | ∀{0.09-98 Ø4.97}
99.8% sRGB (Argyll 1.6.3 3D)
68.7% AdobeRGB 1998 (Argyll 1.6.3 3D)
76.7% AdobeRGB 1998 (Argyll 3D)
99.8% sRGB (Argyll 3D)
77.1% Display P3 (Argyll 3D)
Gamma: 2.1
CCT: 6650 K
| HP Envy 14-eb0010nr AU Optronics AUOF392, IPS, 14", 1920x1200 | Lenovo IdeaPad Slim 9i 14ITL5 B140ZAN01.7, IPS, 14", 3840x2160 | Asus ZenBook Duo 14 UX482EA AU Optronics B140HAN06.8, IPS, 14", 1920x1080 | HP Spectre x360 14t-ea000 LG Philips LGD0663, IPS, 13.5", 1920x1280 | Dell Inspiron 14 3493-4KWCF Chi Mei 140HCA, IPS, 14", 1920x1080 | Huawei MateBook 14 2020 Intel TV140WTM-NH0, IPS LED, 14", 2160x1440 | |
|---|---|---|---|---|---|---|
| Display | 6% | -6% | -9% | -43% | -8% | |
| Display P3 Coverage (%) | 77.1 | 87.4 13% | 69 -11% | 65.8 -15% | 41.84 -46% | 67.1 -13% |
| sRGB Coverage (%) | 99.8 | 99.9 0% | 99.1 -1% | 98.2 -2% | 62.3 -38% | 99.1 -1% |
| AdobeRGB 1998 Coverage (%) | 76.7 | 81.1 6% | 71 -7% | 67.9 -11% | 43.33 -44% | 69 -10% |
| Response Times | 20% | 4% | 7% | 33% | 45% | |
| Response Time Grey 50% / Grey 80% * (ms) | 61.2 ? | 48.4 ? 21% | 56.4 ? 8% | 62 ? -1% | 41 ? 33% | 37.6 ? 39% |
| Response Time Black / White * (ms) | 46 ? | 37.2 ? 19% | 46 ? -0% | 39.6 ? 14% | 31 ? 33% | 22.4 ? 51% |
| PWM Frequency (Hz) | 2500 ? | 59520 ? | ||||
| Screen | -32% | 8% | -3% | -98% | -20% | |
| Brightness middle (cd/m²) | 412 | 475.8 15% | 361.8 -12% | 443.5 8% | 226 -45% | 458 11% |
| Brightness (cd/m²) | 392 | 463 18% | 351 -10% | 394 1% | 214 -45% | 448 14% |
| Brightness Distribution (%) | 81 | 89 10% | 90 11% | 78 -4% | 92 14% | 89 10% |
| Black Level * (cd/m²) | 0.32 | 0.44 -38% | 0.28 12% | 0.17 47% | 0.17 47% | 0.25 22% |
| Contrast (:1) | 1288 | 1081 -16% | 1292 0% | 2609 103% | 1329 3% | 1832 42% |
| Colorchecker dE 2000 * | 1.88 | 3.81 -103% | 1.44 23% | 2.7 -44% | 5.21 -177% | 3.4 -81% |
| Colorchecker dE 2000 max. * | 3.06 | 6.96 -127% | 3.3 -8% | 4.36 -42% | 22.15 -624% | 6.7 -119% |
| Colorchecker dE 2000 calibrated * | 1.96 | 2.55 -30% | 1.24 37% | 2.61 -33% | 4.43 -126% | 1.7 13% |
| Greyscale dE 2000 * | 2.2 | 4.1 -86% | 1.3 41% | 3.4 -55% | 3.27 -49% | 4.9 -123% |
| Gamma | 2.1 105% | 2.14 103% | 2.15 102% | 2.09 105% | 2.36 93% | 2.16 102% |
| CCT | 6650 98% | 6564 99% | 6411 101% | 6144 106% | 6538 99% | 7704 84% |
| Color Space (Percent of AdobeRGB 1998) (%) | 68.7 | 72.4 5% | 64.9 -6% | 62.1 -10% | 40 -42% | 63.5 -8% |
| Color Space (Percent of sRGB) (%) | 99.8 | 99.9 0% | 99.3 -1% | 98.5 -1% | 62 -38% | 99.1 -1% |
| Totalt genomsnitt (program/inställningar) | -2% /
-18% | 2% /
5% | -2% /
-3% | -36% /
-72% | 6% /
-10% |
* ... mindre är bättre
Visa svarstider
| ↔ Svarstid svart till vitt | ||
|---|---|---|
| 46 ms ... stiga ↗ och falla ↘ kombinerat | ↗ 24 ms stiga | 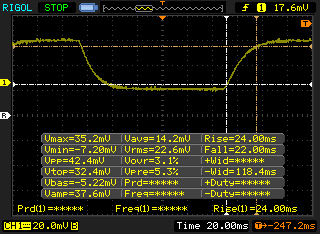 |
| ↘ 22 ms hösten | ||
| Skärmen visar långsamma svarsfrekvenser i våra tester och kommer att vara otillfredsställande för spelare. I jämförelse sträcker sig alla testade enheter från 0.1 (minst) till 240 (maximalt) ms. » 99 % av alla enheter är bättre. Detta innebär att den uppmätta svarstiden är sämre än genomsnittet av alla testade enheter (19.9 ms). | ||
| ↔ Svarstid 50 % grått till 80 % grått | ||
| 61.2 ms ... stiga ↗ och falla ↘ kombinerat | ↗ 30 ms stiga | 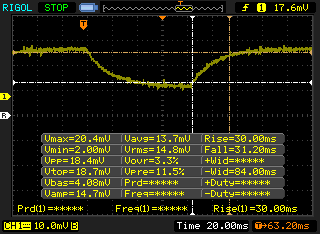 |
| ↘ 31.2 ms hösten | ||
| Skärmen visar långsamma svarsfrekvenser i våra tester och kommer att vara otillfredsställande för spelare. I jämförelse sträcker sig alla testade enheter från 0.165 (minst) till 636 (maximalt) ms. » 97 % av alla enheter är bättre. Detta innebär att den uppmätta svarstiden är sämre än genomsnittet av alla testade enheter (31.1 ms). | ||
Skärmflimmer / PWM (Puls-Width Modulation)
| Skärmflimmer / PWM upptäcktes inte | 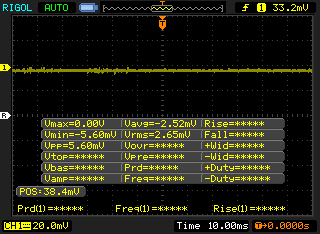 | ||
Som jämförelse: 52 % av alla testade enheter använder inte PWM för att dämpa skärmen. Om PWM upptäcktes mättes ett medelvärde av 7791 (minst: 5 - maximum: 343500) Hz. | |||
Cinebench R15: CPU Multi 64Bit | CPU Single 64Bit
Blender: v2.79 BMW27 CPU
7-Zip 18.03: 7z b 4 -mmt1 | 7z b 4
Geekbench 5.5: Single-Core | Multi-Core
HWBOT x265 Benchmark v2.2: 4k Preset
LibreOffice : 20 Documents To PDF
R Benchmark 2.5: Overall mean
| Cinebench R20 / CPU (Multi Core) | |
| Lenovo Yoga Slim 7-14ARE | |
| Lenovo Yoga Slim 7 14ARE05 82A20008GE | |
| HP Envy 15-ep0098nr | |
| Dell XPS 13 7390 Core i7-10710U | |
| Honor MagicBook 14, Ryzen 5 4500U | |
| HP Envy 14-eb0010nr | |
| MSI Prestige 14 Evo A11M-005 | |
| Asus ZenBook Duo 14 UX482EA | |
| Genomsnitt Intel Core i5-1135G7 (979 - 2382, n=62) | |
| Microsoft Surface Laptop 3 13 Core i5-1035G7 | |
| Asus Zenbook S UX393JA | |
| Acer Swift 3 SF314-42-R27B | |
| Asus ZenBook 14 UX434FL-DB77 | |
| Asus VivoBook 14 X403FA | |
| Huawei MateBook 14 2020 Intel | |
| Dynabook Portege A30-E-174 | |
| Cinebench R20 / CPU (Single Core) | |
| MSI Prestige 14 Evo A11M-005 | |
| Asus ZenBook Duo 14 UX482EA | |
| Genomsnitt Intel Core i5-1135G7 (375 - 527, n=62) | |
| HP Envy 14-eb0010nr | |
| Lenovo Yoga Slim 7-14ARE | |
| Lenovo Yoga Slim 7 14ARE05 82A20008GE | |
| Dell XPS 13 7390 Core i7-10710U | |
| Asus Zenbook S UX393JA | |
| Asus ZenBook 14 UX434FL-DB77 | |
| Huawei MateBook 14 2020 Intel | |
| Honor MagicBook 14, Ryzen 5 4500U | |
| Microsoft Surface Laptop 3 13 Core i5-1035G7 | |
| HP Envy 15-ep0098nr | |
| Acer Swift 3 SF314-42-R27B | |
| Asus VivoBook 14 X403FA | |
| Dynabook Portege A30-E-174 | |
| Cinebench R15 / CPU Multi 64Bit | |
| Lenovo Yoga Slim 7-14ARE | |
| HP Envy 15-ep0098nr | |
| Lenovo Yoga Slim 7 14ARE05 82A20008GE | |
| Dell XPS 13 7390 Core i7-10710U | |
| Honor MagicBook 14, Ryzen 5 4500U | |
| Asus ZenBook Duo 14 UX482EA | |
| MSI Prestige 14 Evo A11M-005 | |
| HP Envy 14-eb0010nr | |
| Genomsnitt Intel Core i5-1135G7 (431 - 941, n=65) | |
| Microsoft Surface Laptop 3 13 Core i5-1035G7 | |
| Asus ZenBook 14 UX434FL-DB77 | |
| Asus VivoBook 14 X403FA | |
| Asus Zenbook S UX393JA | |
| Acer Swift 3 SF314-42-R27B | |
| Huawei MateBook 14 2020 Intel | |
| Dynabook Portege A30-E-174 | |
| Cinebench R15 / CPU Single 64Bit | |
| Asus ZenBook Duo 14 UX482EA | |
| MSI Prestige 14 Evo A11M-005 | |
| HP Envy 14-eb0010nr | |
| HP Envy 15-ep0098nr | |
| Genomsnitt Intel Core i5-1135G7 (141.4 - 205, n=61) | |
| Lenovo Yoga Slim 7-14ARE | |
| Huawei MateBook 14 2020 Intel | |
| Dell XPS 13 7390 Core i7-10710U | |
| Asus Zenbook S UX393JA | |
| Asus ZenBook 14 UX434FL-DB77 | |
| Lenovo Yoga Slim 7 14ARE05 82A20008GE | |
| Microsoft Surface Laptop 3 13 Core i5-1035G7 | |
| Honor MagicBook 14, Ryzen 5 4500U | |
| Acer Swift 3 SF314-42-R27B | |
| Dynabook Portege A30-E-174 | |
| Asus VivoBook 14 X403FA | |
| Geekbench 5.5 / Single-Core | |
| HP Envy 14-eb0010nr | |
| MSI Prestige 14 Evo A11M-005 | |
| Genomsnitt Intel Core i5-1135G7 (1147 - 1428, n=58) | |
| Asus Zenbook S UX393JA | |
| HP Envy 15-ep0098nr | |
| Huawei MateBook 14 2020 Intel | |
| Asus ZenBook 14 UX434FL-DB77 | |
| Lenovo Yoga Slim 7-14ARE | |
| Lenovo Yoga Slim 7-14ARE | |
| Lenovo Yoga Slim 7 14ARE05 82A20008GE | |
| Honor MagicBook 14, Ryzen 5 4500U | |
| Acer Swift 3 SF314-42-R27B | |
| Geekbench 5.5 / Multi-Core | |
| Lenovo Yoga Slim 7-14ARE | |
| Lenovo Yoga Slim 7-14ARE | |
| HP Envy 15-ep0098nr | |
| Lenovo Yoga Slim 7 14ARE05 82A20008GE | |
| MSI Prestige 14 Evo A11M-005 | |
| Honor MagicBook 14, Ryzen 5 4500U | |
| HP Envy 14-eb0010nr | |
| Genomsnitt Intel Core i5-1135G7 (3475 - 5472, n=58) | |
| Asus Zenbook S UX393JA | |
| Huawei MateBook 14 2020 Intel | |
| Acer Swift 3 SF314-42-R27B | |
| Asus ZenBook 14 UX434FL-DB77 | |
| LibreOffice / 20 Documents To PDF | |
| Asus ZenBook Duo 14 UX482EA | |
| Asus ZenBook 14 UX434FL-DB77 | |
| Lenovo Yoga Slim 7 14ARE05 82A20008GE | |
| Acer Swift 3 SF314-42-R27B | |
| Honor MagicBook 14, Ryzen 5 4500U | |
| Lenovo Yoga Slim 7-14ARE | |
| MSI Prestige 14 Evo A11M-005 | |
| Genomsnitt Intel Core i5-1135G7 (44.2 - 62.9, n=60) | |
| Huawei MateBook 14 2020 Intel | |
| HP Envy 14-eb0010nr | |
| Asus Zenbook S UX393JA | |
| HP Envy 15-ep0098nr | |
| R Benchmark 2.5 / Overall mean | |
| Asus ZenBook Duo 14 UX482EA | |
| Asus ZenBook 14 UX434FL-DB77 | |
| Acer Swift 3 SF314-42-R27B | |
| Asus Zenbook S UX393JA | |
| Huawei MateBook 14 2020 Intel | |
| Honor MagicBook 14, Ryzen 5 4500U | |
| Genomsnitt Intel Core i5-1135G7 (0.619 - 0.727, n=59) | |
| HP Envy 14-eb0010nr | |
| Lenovo Yoga Slim 7 14ARE05 82A20008GE | |
| Lenovo Yoga Slim 7-14ARE | |
| HP Envy 15-ep0098nr | |
| MSI Prestige 14 Evo A11M-005 | |
Cinebench R15: CPU Multi 64Bit | CPU Single 64Bit
Blender: v2.79 BMW27 CPU
7-Zip 18.03: 7z b 4 -mmt1 | 7z b 4
Geekbench 5.5: Single-Core | Multi-Core
HWBOT x265 Benchmark v2.2: 4k Preset
LibreOffice : 20 Documents To PDF
R Benchmark 2.5: Overall mean
* ... mindre är bättre
| PCMark 8 Home Score Accelerated v2 | 3909 poäng | |
| PCMark 8 Work Score Accelerated v2 | 5402 poäng | |
| PCMark 10 Score | 5410 poäng | |
Hjälp | ||
| DPC Latencies / LatencyMon - interrupt to process latency (max), Web, Youtube, Prime95 | |
| HP Envy 14-eb0010nr | |
| HP Spectre x360 14t-ea000 | |
| Lenovo IdeaPad Slim 9i 14ITL5 | |
| Asus ZenBook Duo 14 UX482EA | |
| Huawei MateBook 14 2020 Intel | |
* ... mindre är bättre
| HP Envy 14-eb0010nr Samsung SSD PM981a MZVLB256HBHQ | Lenovo IdeaPad Slim 9i 14ITL5 WDC PC SN730 SDBPNTY-512G | Asus ZenBook Duo 14 UX482EA SK Hynix HFM512GD3JX013N | Dell Inspiron 14 3493-4KWCF Toshiba KBG40ZNS512G NVMe | Huawei MateBook 14 2020 Intel Lite-On CA5-8D512 | |
|---|---|---|---|---|---|
| AS SSD | 1% | -1% | -43% | 4% | |
| Seq Read (MB/s) | 2127 | 2068 -3% | 2088 -2% | 2074 -2% | 2933 38% |
| Seq Write (MB/s) | 1427 | 1414 -1% | 1311 -8% | 775 -46% | 810 -43% |
| 4K Read (MB/s) | 52.5 | 46.99 -10% | 58.2 11% | 37.81 -28% | 56.6 8% |
| 4K Write (MB/s) | 122.9 | 211.9 72% | 128.4 4% | 101.3 -18% | 147.6 20% |
| 4K-64 Read (MB/s) | 947 | 1027 8% | 1039 10% | 1265 34% | 856 -10% |
| 4K-64 Write (MB/s) | 1598 | 978 -39% | 1238 -23% | 383.5 -76% | 1099 -31% |
| Access Time Read * (ms) | 0.072 | 0.057 21% | 0.045 37% | 0.081 -13% | 0.046 36% |
| Access Time Write * (ms) | 0.09 | 0.066 27% | 0.088 2% | 0.263 -192% | 0.028 69% |
| Score Read (Points) | 1212 | 1281 6% | 1306 8% | 1510 25% | 1206 0% |
| Score Write (Points) | 1864 | 1331 -29% | 1497 -20% | 562 -70% | 1328 -29% |
| Score Total (Points) | 3674 | 3243 -12% | 3446 -6% | 2781 -24% | 3059 -17% |
| Copy ISO MB/s (MB/s) | 1605 | 1891 18% | 2248 40% | 716 -55% | |
| Copy Program MB/s (MB/s) | 847 | 604 -29% | 559 -34% | 335.4 -60% | |
| Copy Game MB/s (MB/s) | 1632 | 1422 -13% | 1087 -33% | 484.8 -70% | |
| CrystalDiskMark 5.2 / 6 | 3% | -3% | -3% | 23% | |
| Write 4K (MB/s) | 119.7 | 131.5 10% | 72.1 -40% | 159.6 33% | 161.8 35% |
| Read 4K (MB/s) | 45.28 | 36.83 -19% | 41.1 -9% | 53.5 18% | 60.6 34% |
| Write Seq (MB/s) | 1951 | 1614 -17% | 1949 0% | 1174 -40% | 2209 13% |
| Read Seq (MB/s) | 2252 | 2030 -10% | 1989 -12% | 1648 -27% | 2473 10% |
| Write 4K Q32T1 (MB/s) | 438.1 | 516 18% | 413.8 -6% | 420.8 -4% | 514 17% |
| Read 4K Q32T1 (MB/s) | 312.8 | 419.7 34% | 384.2 23% | 564 80% | 586 87% |
| Write Seq Q32T1 (MB/s) | 2348 | 2705 15% | 2816 20% | 1231 -48% | 2205 -6% |
| Read Seq Q32T1 (MB/s) | 3529 | 3390 -4% | 3534 0% | 2274 -36% | 3352 -5% |
| Totalt genomsnitt (program/inställningar) | 2% /
2% | -2% /
-2% | -23% /
-28% | 14% /
12% |
* ... mindre är bättre

DiskSpd Read Loop, Queue Depth 8
| 3DMark 11 Performance | 10940 poäng | |
| 3DMark Cloud Gate Standard Score | 23869 poäng | |
| 3DMark Fire Strike Score | 7411 poäng | |
| 3DMark Time Spy Score | 3168 poäng | |
Hjälp | ||
| låg | med. | hög | ultra | |
|---|---|---|---|---|
| GTA V (2015) | 156 | 145 | 88.1 | 45.3 |
| The Witcher 3 (2015) | 156.8 | 90 | 53.6 | 31.5 |
| Dota 2 Reborn (2015) | 128 | 116 | 109 | 105 |
| Final Fantasy XV Benchmark (2018) | 90.1 | 46.3 | 32.5 | |
| X-Plane 11.11 (2018) | 86.8 | 73.5 | 62.7 | |
| Strange Brigade (2018) | 188 | 76.5 | 62.2 | 53.6 |
| HP Envy 14-eb0010nr GeForce GTX 1650 Ti Max-Q, i5-1135G7, Samsung SSD PM981a MZVLB256HBHQ | Lenovo IdeaPad Slim 9i 14ITL5 Iris Xe G7 96EUs, i7-1165G7, WDC PC SN730 SDBPNTY-512G | Asus ZenBook Duo 14 UX482EA Iris Xe G7 96EUs, i7-1165G7, SK Hynix HFM512GD3JX013N | Dell Inspiron 14 3493-4KWCF GeForce MX230, i7-1065G7, Toshiba KBG40ZNS512G NVMe | Huawei MateBook 14 2020 Intel GeForce MX350, i7-10510U, Lite-On CA5-8D512 | |
|---|---|---|---|---|---|
| Noise | -3% | 0% | -13% | -6% | |
| av / miljö * (dB) | 25.9 | 26.7 -3% | 26.3 -2% | 30.3 -17% | 29.3 -13% |
| Idle Minimum * (dB) | 26 | 26.7 -3% | 26.5 -2% | 30.3 -17% | 29.3 -13% |
| Idle Average * (dB) | 26 | 26.7 -3% | 26.5 -2% | 30.3 -17% | 29.3 -13% |
| Idle Maximum * (dB) | 26 | 26.7 -3% | 26.5 -2% | 30.3 -17% | 30.8 -18% |
| Load Average * (dB) | 34.9 | 34 3% | 26.7 23% | 42.9 -23% | 35.7 -2% |
| Witcher 3 ultra * (dB) | 34.5 | 43.5 -26% | 40.7 -18% | 35.7 -3% | |
| Load Maximum * (dB) | 48.7 | 43.5 11% | 45.6 6% | 43.3 11% | 37.9 22% |
* ... mindre är bättre
Ljudnivå
| Låg belastning |
| 26 / 26 / 26 dB(A) |
| Hög belastning |
| 34.9 / 48.7 dB(A) |
 | ||
30 dB tyst 40 dB(A) hörbar 50 dB(A) högt ljud |
||
min: | ||
(±) Den maximala temperaturen på ovansidan är 41.2 °C / 106 F, jämfört med genomsnittet av 36.8 °C / 98 F , allt från 21 till 71 °C för klassen Multimedia.
(-) Botten värms upp till maximalt 45.6 °C / 114 F, jämfört med genomsnittet av 39.1 °C / 102 F
(+) Vid tomgångsbruk är medeltemperaturen för ovansidan 27.1 °C / 81 F, jämfört med enhetsgenomsnittet på 31.3 °C / ### class_avg_f### F.
(+) När du spelar The Witcher 3 är medeltemperaturen för ovansidan 29.6 °C / 85 F, jämfört med enhetsgenomsnittet på 31.3 °C / ## #class_avg_f### F.
(+) Handledsstöden och pekplattan är kallare än hudtemperaturen med maximalt 29.4 °C / 84.9 F och är därför svala att ta på.
(±) Medeltemperaturen för handledsstödsområdet på liknande enheter var 28.7 °C / 83.7 F (-0.7 °C / -1.2 F).
HP Envy 14-eb0010nr ljudanalys
(+) | högtalare kan spela relativt högt (82.8 dB)
Bas 100 - 315 Hz
(±) | reducerad bas - i genomsnitt 14.4% lägre än medianen
(±) | linjäriteten för basen är genomsnittlig (12.3% delta till föregående frekvens)
Mellan 400 - 2000 Hz
(+) | balanserad mellan - endast 4.8% från medianen
(+) | mids är linjära (6.8% delta till föregående frekvens)
Högsta 2 - 16 kHz
(+) | balanserade toppar - endast 2.8% från medianen
(+) | toppar är linjära (3.3% delta till föregående frekvens)
Totalt 100 - 16 000 Hz
(+) | det totala ljudet är linjärt (13.6% skillnad mot median)
Jämfört med samma klass
» 29% av alla testade enheter i den här klassen var bättre, 5% liknande, 66% sämre
» Den bästa hade ett delta på 5%, genomsnittet var 17%, sämst var 45%
Jämfört med alla testade enheter
» 15% av alla testade enheter var bättre, 4% liknande, 82% sämre
» Den bästa hade ett delta på 4%, genomsnittet var 24%, sämst var 134%
Apple MacBook 12 (Early 2016) 1.1 GHz ljudanalys
(+) | högtalare kan spela relativt högt (83.6 dB)
Bas 100 - 315 Hz
(±) | reducerad bas - i genomsnitt 11.3% lägre än medianen
(±) | linjäriteten för basen är genomsnittlig (14.2% delta till föregående frekvens)
Mellan 400 - 2000 Hz
(+) | balanserad mellan - endast 2.4% från medianen
(+) | mids är linjära (5.5% delta till föregående frekvens)
Högsta 2 - 16 kHz
(+) | balanserade toppar - endast 2% från medianen
(+) | toppar är linjära (4.5% delta till föregående frekvens)
Totalt 100 - 16 000 Hz
(+) | det totala ljudet är linjärt (10.2% skillnad mot median)
Jämfört med samma klass
» 7% av alla testade enheter i den här klassen var bättre, 2% liknande, 91% sämre
» Den bästa hade ett delta på 5%, genomsnittet var 18%, sämst var 53%
Jämfört med alla testade enheter
» 5% av alla testade enheter var bättre, 1% liknande, 94% sämre
» Den bästa hade ett delta på 4%, genomsnittet var 24%, sämst var 134%
| Av/Standby | |
| Låg belastning | |
| Hög belastning |
|
Förklaring:
min: | |
| HP Envy 14-eb0010nr i5-1135G7, GeForce GTX 1650 Ti Max-Q, Samsung SSD PM981a MZVLB256HBHQ, IPS, 1920x1200, 14" | Lenovo IdeaPad Slim 9i 14ITL5 i7-1165G7, Iris Xe G7 96EUs, WDC PC SN730 SDBPNTY-512G, IPS, 3840x2160, 14" | Asus ZenBook Duo 14 UX482EA i7-1165G7, Iris Xe G7 96EUs, SK Hynix HFM512GD3JX013N, IPS, 1920x1080, 14" | HP Spectre x360 14t-ea000 i7-1165G7, Iris Xe G7 96EUs, Samsung SSD PM981a MZVLB512HBJQ, IPS, 1920x1280, 13.5" | Dell Inspiron 14 3493-4KWCF i7-1065G7, GeForce MX230, Toshiba KBG40ZNS512G NVMe, IPS, 1920x1080, 14" | Huawei MateBook 14 2020 Intel i7-10510U, GeForce MX350, Lite-On CA5-8D512, IPS LED, 2160x1440, 14" | |
|---|---|---|---|---|---|---|
| Power Consumption | 33% | 39% | 51% | 39% | 33% | |
| Idle Minimum * (Watt) | 4.2 | 4.5 -7% | 3.6 14% | 3 29% | 4.7 -12% | 3 29% |
| Idle Average * (Watt) | 18.3 | 10.5 43% | 9.3 49% | 5.1 72% | 6.6 64% | 9 51% |
| Idle Maximum * (Watt) | 19.2 | 10.6 45% | 10 48% | 6.4 67% | 5.9 69% | 11 43% |
| Load Average * (Watt) | 72.9 | 44.2 39% | 40.6 44% | 39.6 46% | 56 23% | 60.8 17% |
| Witcher 3 ultra * (Watt) | 61.5 | 45.8 26% | 44.3 28% | 39.6 36% | 56 9% | |
| Load Maximum * (Watt) | 127.8 | 61.9 52% | 62.4 51% | 56.2 56% | 60.2 53% | 65.6 49% |
* ... mindre är bättre
| HP Envy 14-eb0010nr i5-1135G7, GeForce GTX 1650 Ti Max-Q, 63.3 Wh | Lenovo IdeaPad Slim 9i 14ITL5 i7-1165G7, Iris Xe G7 96EUs, 63.5 Wh | Asus ZenBook Duo 14 UX482EA i7-1165G7, Iris Xe G7 96EUs, 70 Wh | HP Spectre x360 14t-ea000 i7-1165G7, Iris Xe G7 96EUs, 66 Wh | Dell Inspiron 14 3493-4KWCF i7-1065G7, GeForce MX230, 42 Wh | Huawei MateBook 14 2020 Intel i7-10510U, GeForce MX350, 56 Wh | |
|---|---|---|---|---|---|---|
| Batteridrifttid | 27% | 68% | 33% | -28% | 26% | |
| Reader / Idle (h) | 27.7 | 40.1 45% | 36.8 33% | 36.4 31% | 13.8 -50% | |
| WiFi v1.3 (h) | 10.8 | 11 2% | 8.4 -22% | 11.8 9% | 6.5 -40% | 12.8 19% |
| Load (h) | 1.5 | 2 33% | 4.4 193% | 2.4 60% | 1.6 7% | 2 33% |
För
Emot
Läs den fullständiga versionen av den här recensionen på engelska här.
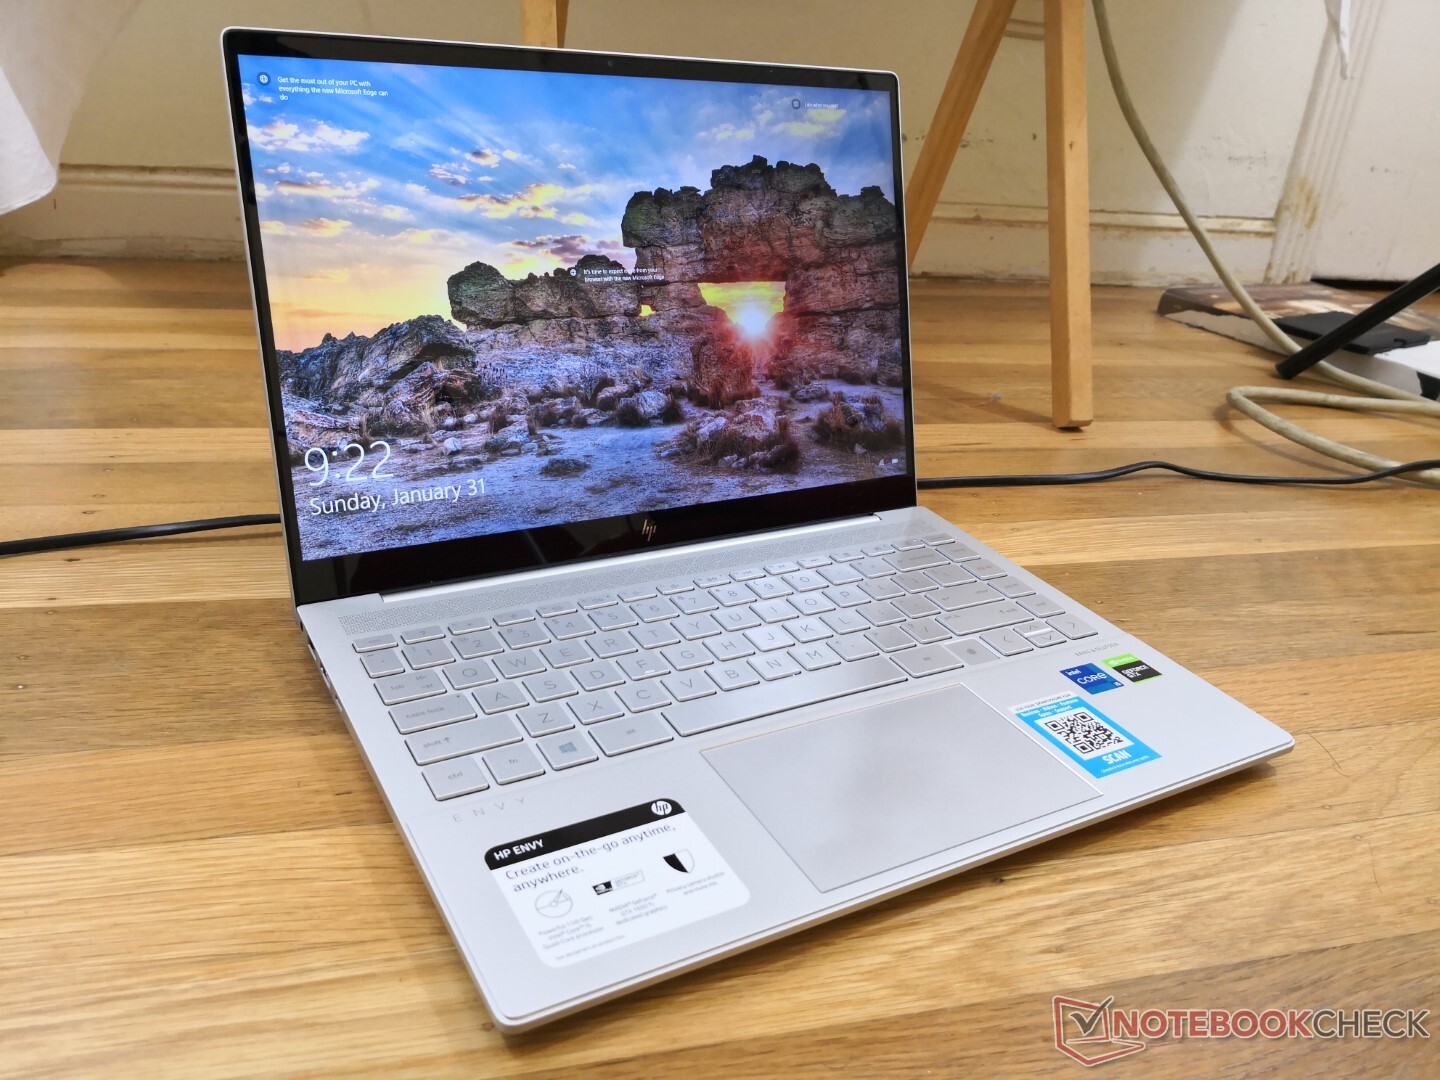
I princip alla Ultrabook-modeller mindre än 15.6 tum med Core U-processorer har begränsad möjlighet att upprätthålla Turbo Boost och kommer antingen med integrerad- eller GeForce MX-grafik. Även om detta inte är ett problem för de flesta användarna får proffs som vill ha högre CPU- och GPU-prestanda oftast nöja sig med större modeller på 15.6 tum där det finns fler alternativ med GeForce GTX. 2021 års Envy 14 är en av få bärbara datorer på 14 tum som verkligen kan utnyttja de högre Turbo Boost-klockfrekvenserna från sin Tiger Lake och har stöd för samma GeForce GTX-alternativ som de större Spectre x360 15- och Dell XPS 15-serierna. Om du vill ha den snabbaste bärbara datorn på 14 tum som finns behöver du inte leta längre.
Envy 14 uppnår en bra balans mellan mobiliteten från en subnotebook på 14 tum och den höga prestandan från en multimedialaptop på 15.6 tum. Om du gör en hel del tungt grafikarbete samtidigt som du reser eller flyttar dig mellan olika lektioner passar den här kompakta HP-datorn perfekt.
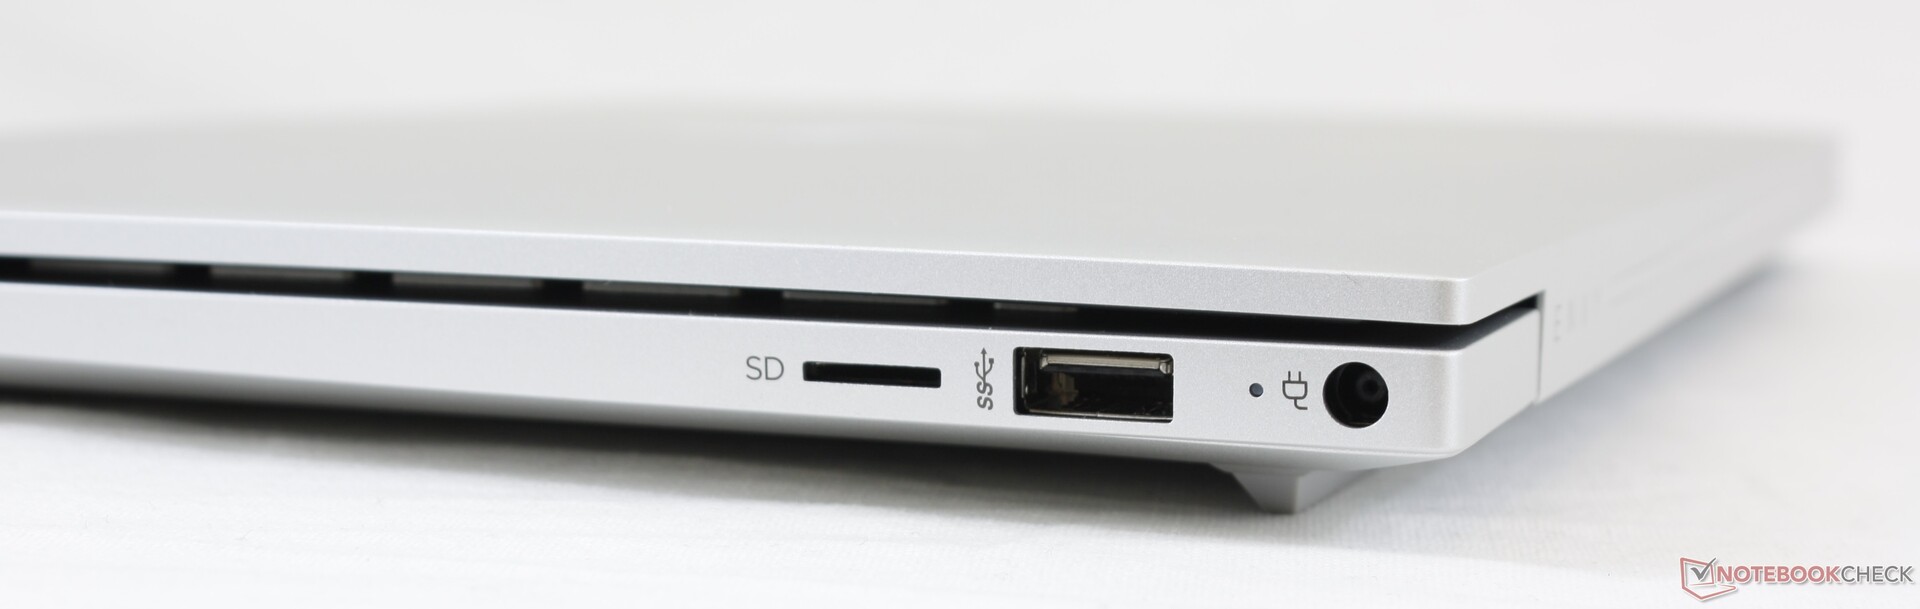
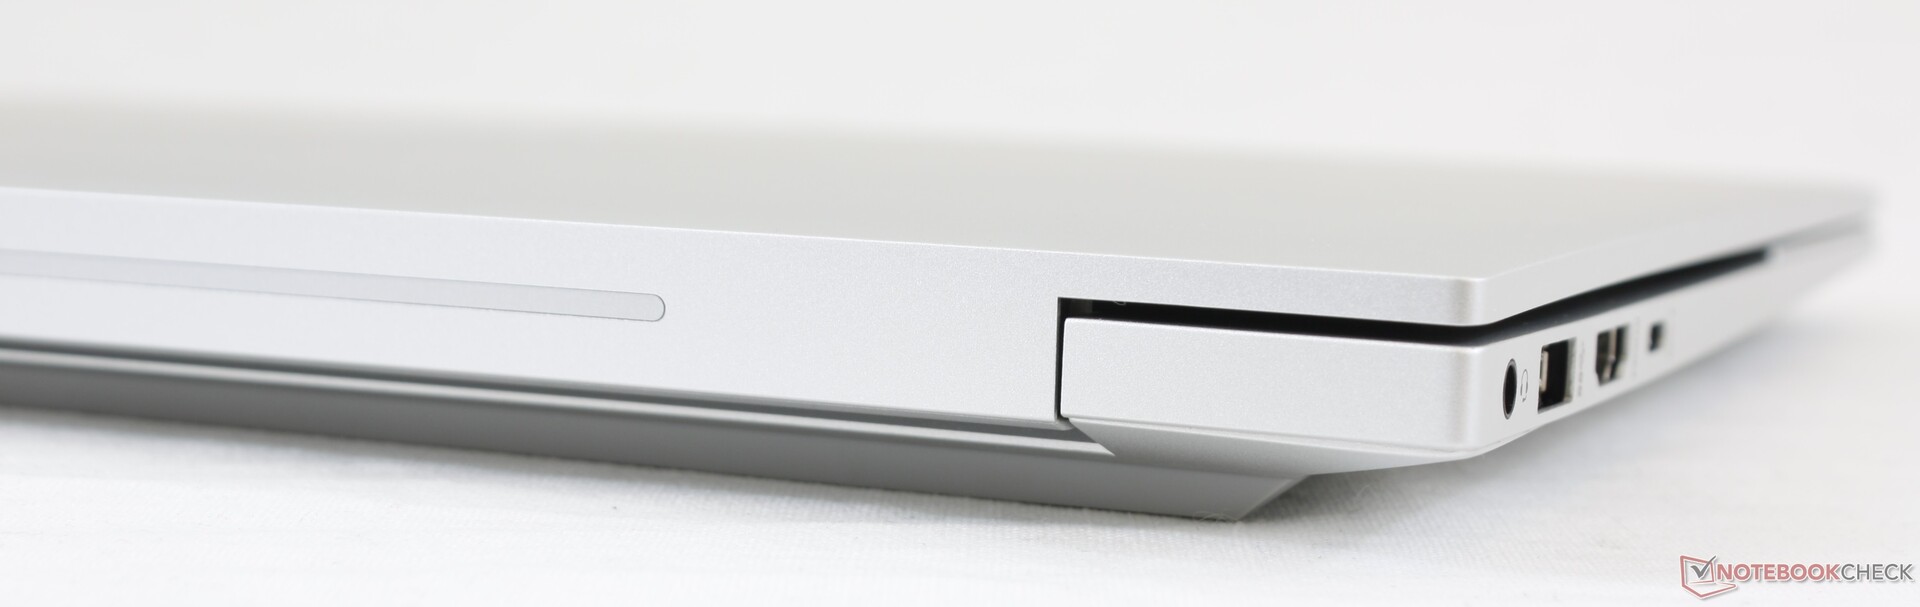
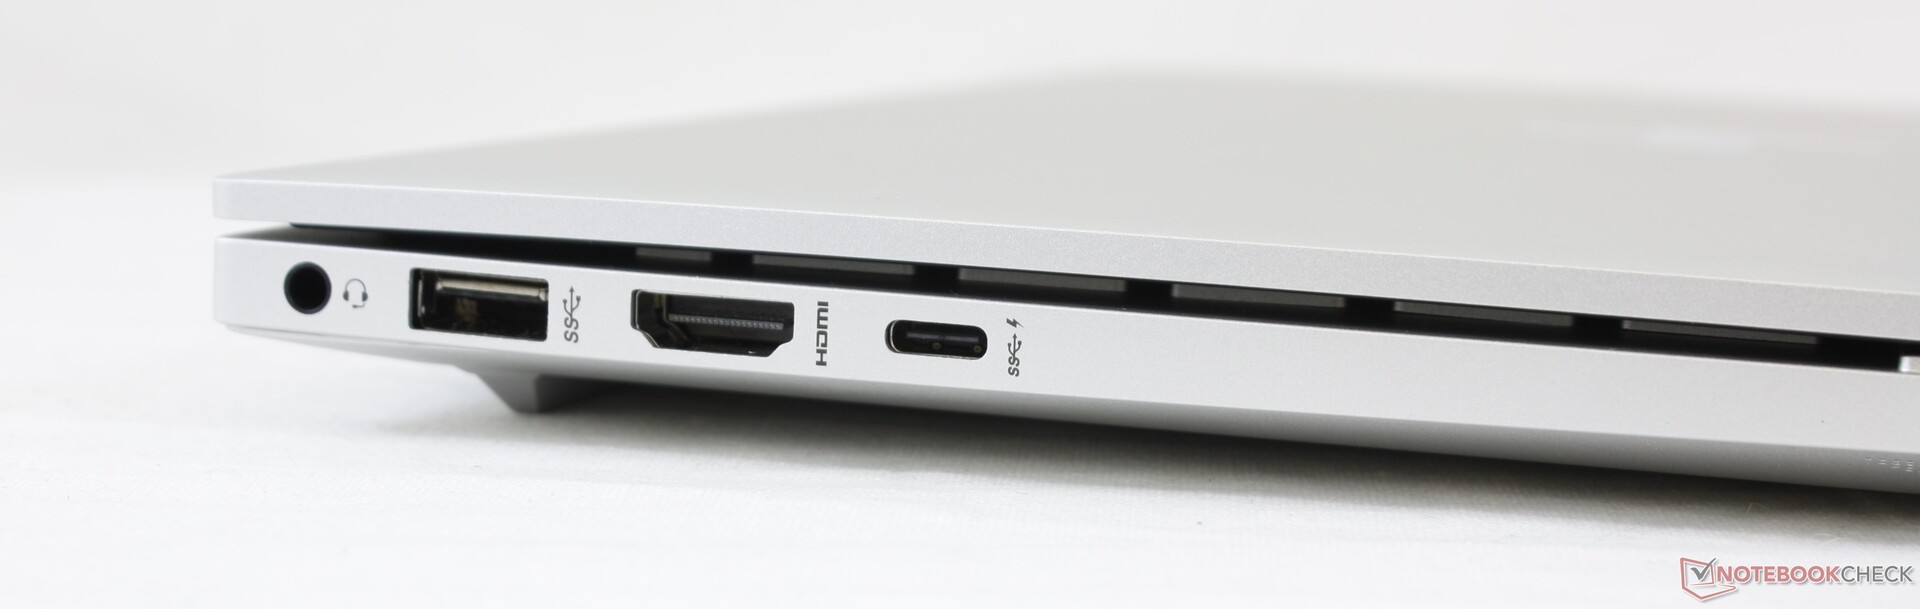
Utöver den höga prestandan förtjänar andra fysiska egenskaper beröm, vilket inkluderar fasta tangentbordsknappar, enkel service och ett hälsosamt utbud av inbyggda portar. "Endast USB-C"-trenden med svårtillgängliga SSD-enheter gör att många andra laptops på 13 eller 14 tum behöver förlita sig väldigt mycket på USB-C adaptrar.
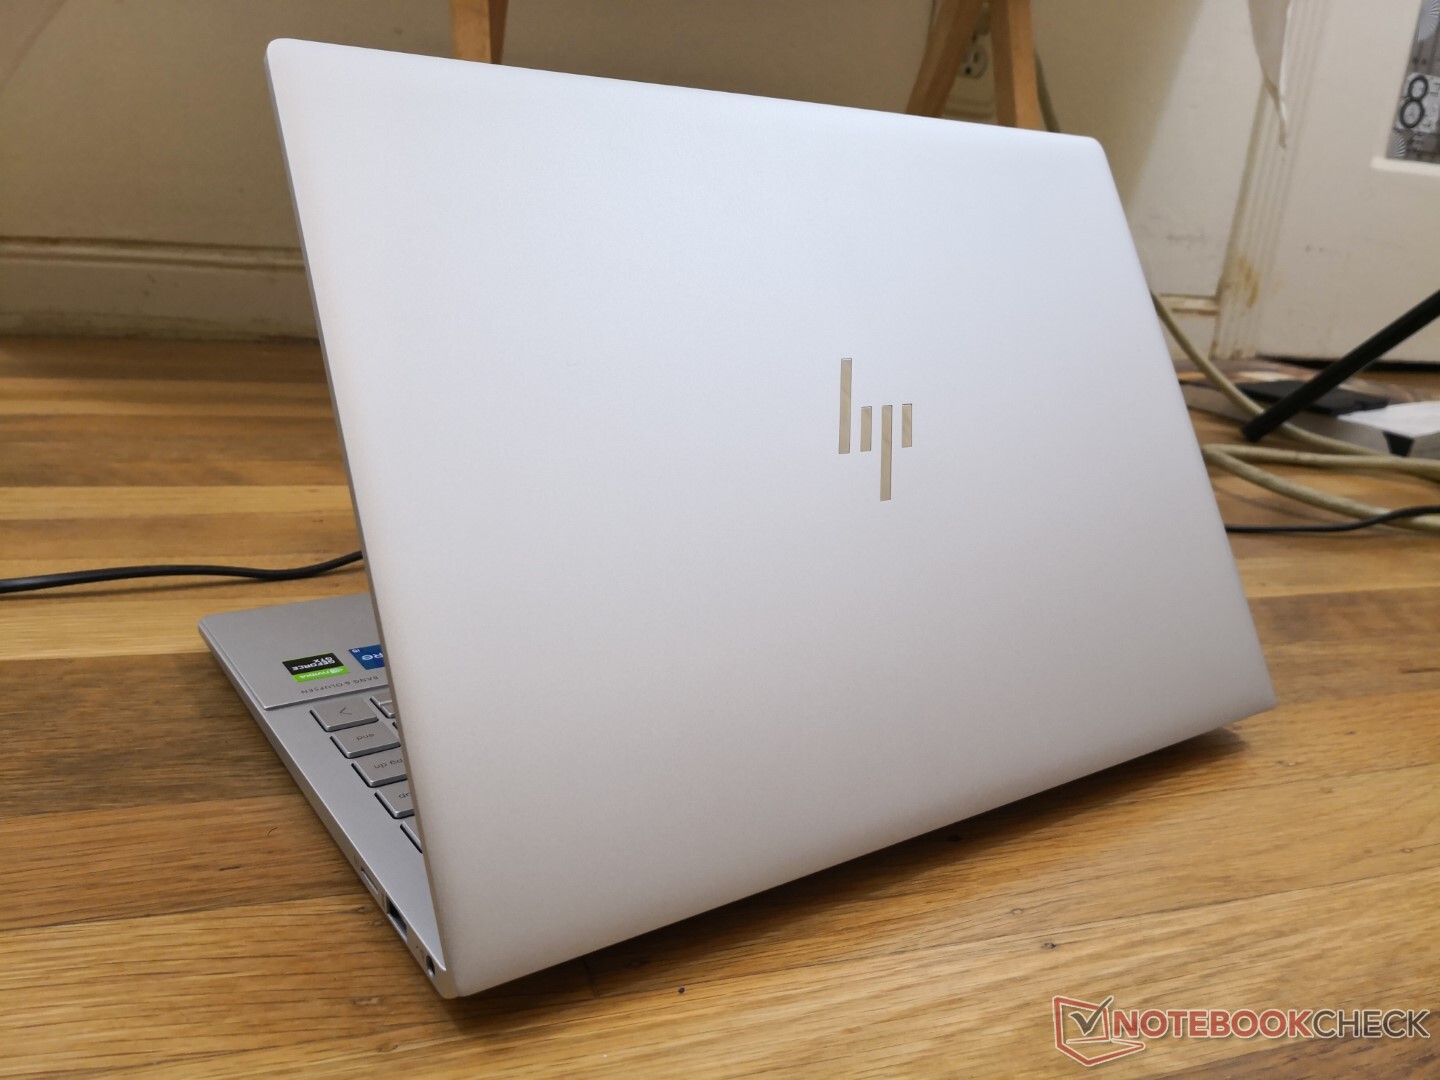
Systemet är inte perfekt, vilket vår långa lista över nackdelar visar. I synnerhet kunde gångjärnen varit fastare i breda vinklar samtidigt som bottenplattan kunde suttit tightare runt hörnena. En del gillar nog inte fingeravtrycksläsarens placering och IR-kameran saknar märkligt nog stöd för Windows Hello. Man får också förvänta sig mer fläktljud och högre temperaturer än på de flesta andra subnotebook-modeller vid krävande belastning, vilket inte är förvånande med tanke på den höga prestandan Envy 14 siktar på.
HP Envy 14-eb0010nr
- 02/02/2021 v7 (old)
Allen Ngo
Price comparison
