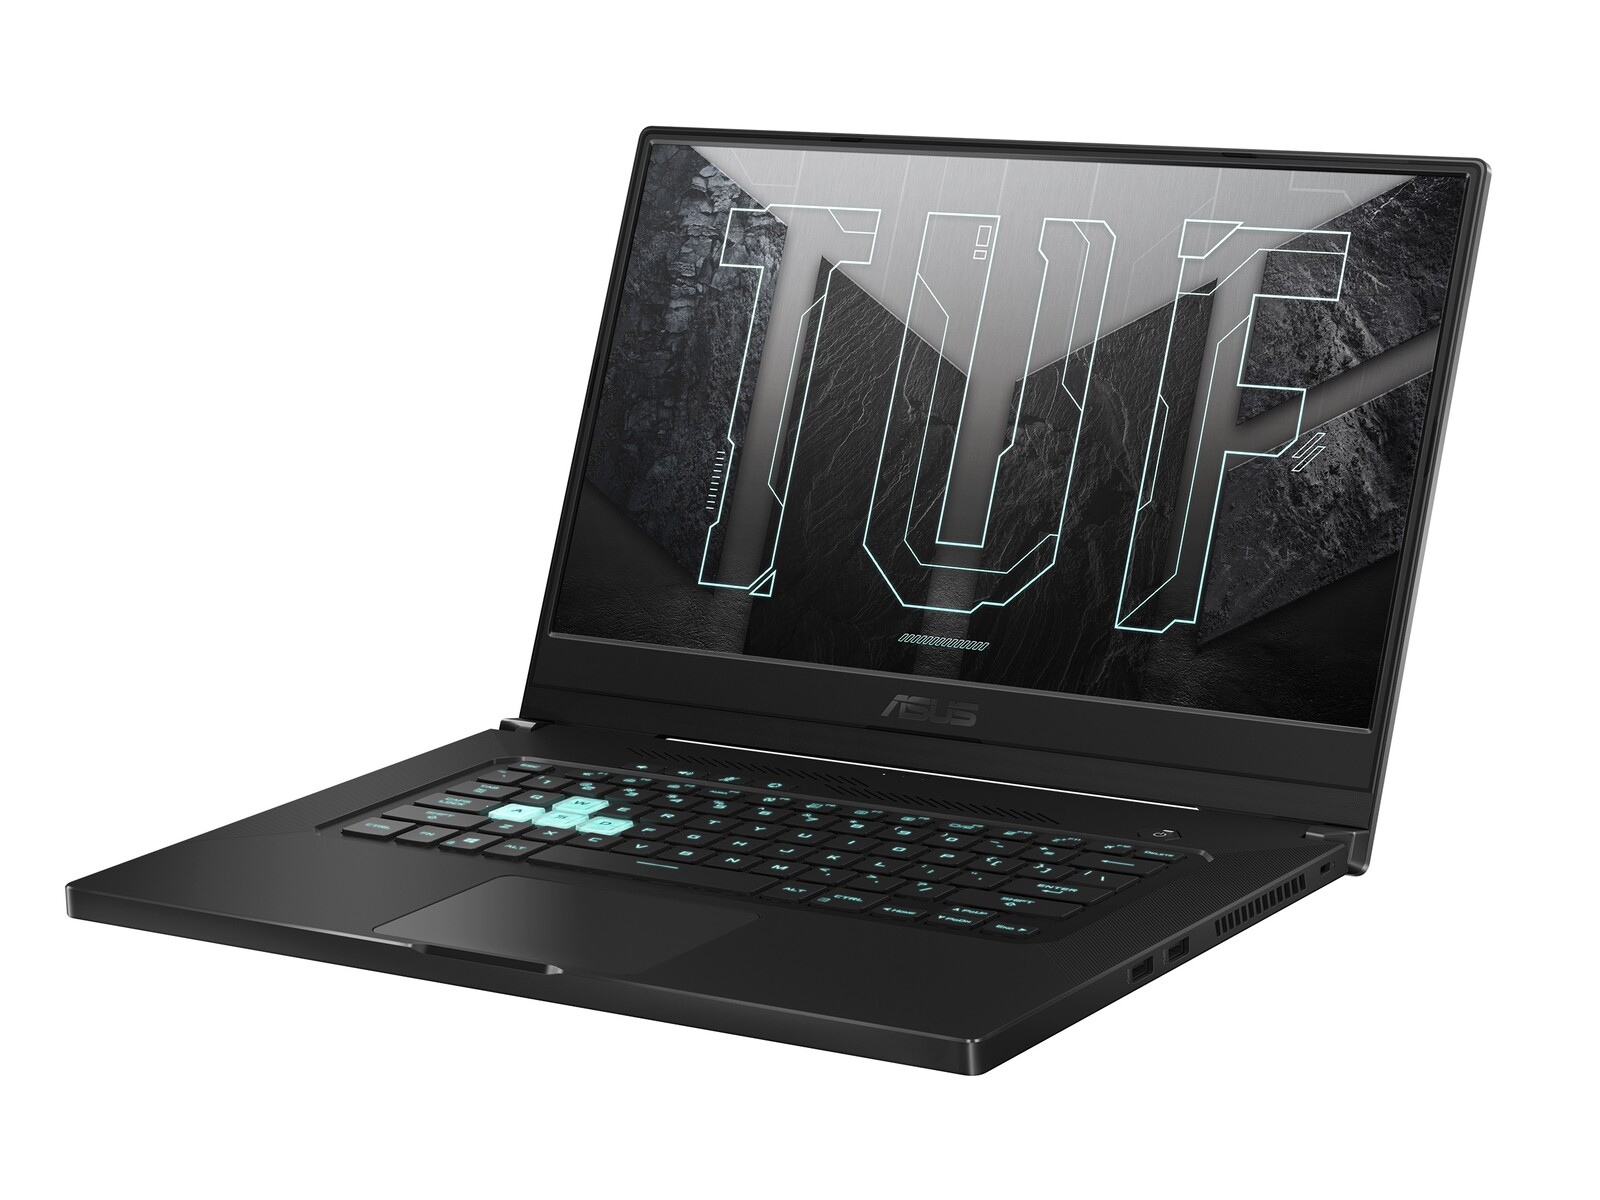
Test: Asus TUF Dash F15 - Ampere med en fot på bromsen (Sammanfattning)
Testgrupp
Gradering | Datum | Modell | Vikt | Höjd | Storlek | Upplösning | Pris |
|---|---|---|---|---|---|---|---|
| 82.4 % v7 (old) | 02/2021 | Asus TUF Dash F15 FX516PR i7-11370H, GeForce RTX 3070 Laptop GPU | 2 kg | 20 mm | 15.60" | 1920x1080 | |
| 83.8 % v7 (old) | 02/2021 | Asus ROG Zephyrus G15 GA503Q R9 5900HS, GeForce RTX 3080 Laptop GPU | 2 kg | 20 mm | 15.60" | 2560x1440 | |
| 82.8 % v7 (old) | 05/2020 | MSI GS66 Stealth 10SFS i9-10980HK, GeForce RTX 2070 Super Max-Q | 2.2 kg | 20 mm | 15.60" | 1920x1080 | |
| 86.5 % v7 (old) | 08/2020 | Aorus 15G XB i7-10875H, GeForce RTX 2070 Super Max-Q | 2.3 kg | 25 mm | 15.60" | 1920x1080 | |
| 86.9 % v7 (old) | Razer Blade 15 RTX 2070 Super Max-Q i7-10875H, GeForce RTX 2070 Super Max-Q | 2.1 kg | 17.8 mm | 15.60" | 1920x1080 | ||
| 85.8 % v7 (old) | 05/2020 | Gigabyte Aero 15 OLED XB-8DE51B0SP i7-10875H, GeForce RTX 2070 Super Max-Q | 2.2 kg | 20 mm | 15.60" | 3840x2160 |
| Networking | |
| iperf3 transmit AX12 | |
| Aorus 15G XB | |
| Asus ROG Zephyrus G15 GA503Q | |
| MSI GS66 Stealth 10SFS | |
| Gigabyte Aero 15 OLED XB-8DE51B0SP | |
| Razer Blade 15 RTX 2070 Super Max-Q | |
| Genomsnitt Intel Wi-Fi 6 AX201 (49.8 - 1775, n=324) | |
| Asus TUF Dash F15 FX516PR | |
| iperf3 receive AX12 | |
| Asus ROG Zephyrus G15 GA503Q | |
| Razer Blade 15 RTX 2070 Super Max-Q | |
| Asus TUF Dash F15 FX516PR | |
| MSI GS66 Stealth 10SFS | |
| Genomsnitt Intel Wi-Fi 6 AX201 (136 - 1743, n=324) | |
| Gigabyte Aero 15 OLED XB-8DE51B0SP | |
| Aorus 15G XB | |
| |||||||||||||||||||||||||
Distribution av ljusstyrkan: 91 %
Mitt på batteriet: 286 cd/m²
Kontrast: 1144:1 (Svärta: 0.25 cd/m²)
ΔE ColorChecker Calman: 2.43 | ∀{0.5-29.43 Ø4.72}
calibrated: 0.83
ΔE Greyscale Calman: 3.5 | ∀{0.09-98 Ø4.97}
91% sRGB (Argyll 1.6.3 3D)
68% AdobeRGB 1998 (Argyll 1.6.3 3D)
67.9% AdobeRGB 1998 (Argyll 3D)
98.1% sRGB (Argyll 3D)
66.9% Display P3 (Argyll 3D)
Gamma: 2.32
CCT: 7145 K
| Asus TUF Dash F15 FX516PR LQ156M1JW26 (SHP1532), IPS, 1920x1080, 15.6" | Asus ROG Zephyrus G15 GA503Q CMN N156KME-GNA (CMN152A), IPS-Level, 2560x1440, 15.6" | MSI GS66 Stealth 10SFS AUO B156HAN12.0 (AUO328E), IPS, 1920x1080, 15.6" | Aorus 15G XB Sharp LQ156M1JW03, IGZO, 1920x1080, 15.6" | Razer Blade 15 RTX 2070 Super Max-Q AU Optronics B156HAN12.0, IPS, 1920x1080, 15.6" | Gigabyte Aero 15 OLED XB-8DE51B0SP Samsung SDCA029, OLED, 3840x2160, 15.6" | |
|---|---|---|---|---|---|---|
| Display | 25% | 3% | 0% | 3% | 32% | |
| Display P3 Coverage (%) | 66.9 | 97.3 45% | 69.5 4% | 67.2 0% | 69.4 4% | 99.9 49% |
| sRGB Coverage (%) | 98.1 | 99.9 2% | 99.6 2% | 97.8 0% | 98.8 1% | 100 2% |
| AdobeRGB 1998 Coverage (%) | 67.9 | 86.2 27% | 70.8 4% | 68 0% | 70.5 4% | 98.2 45% |
| Response Times | 8% | -7% | -23% | 47% | 82% | |
| Response Time Grey 50% / Grey 80% * (ms) | 12 ? | 8.8 ? 27% | 14 ? -17% | 16 ? -33% | 3.2 ? 73% | 2.2 ? 82% |
| Response Time Black / White * (ms) | 10 ? | 11.2 ? -12% | 9.6 ? 4% | 11.2 ? -12% | 8 ? 20% | 1.8 ? 82% |
| PWM Frequency (Hz) | 23580 ? | 23580 ? | 60 ? | |||
| Screen | -27% | -1% | 7% | -14% | 2% | |
| Brightness middle (cd/m²) | 286 | 327 14% | 316 10% | 264 -8% | 345.4 21% | 385 35% |
| Brightness (cd/m²) | 275 | 309 12% | 311 13% | 248 -10% | 342 24% | 390 42% |
| Brightness Distribution (%) | 91 | 89 -2% | 92 1% | 89 -2% | 90 -1% | 93 2% |
| Black Level * (cd/m²) | 0.25 | 0.33 -32% | 0.21 16% | 0.3 -20% | 0.34 -36% | |
| Contrast (:1) | 1144 | 991 -13% | 1505 32% | 880 -23% | 1016 -11% | |
| Colorchecker dE 2000 * | 2.43 | 4.49 -85% | 3.03 -25% | 1.21 50% | 3.18 -31% | 2.46 -1% |
| Colorchecker dE 2000 max. * | 6.33 | 8.42 -33% | 7.32 -16% | 3.07 52% | 6.57 -4% | 4.01 37% |
| Colorchecker dE 2000 calibrated * | 0.83 | 2.27 -173% | 1.1 -33% | 0.92 -11% | 1.77 -113% | 2.6 -213% |
| Greyscale dE 2000 * | 3.5 | 4.2 -20% | 3.9 -11% | 1.6 54% | 3.8 -9% | 1.39 60% |
| Gamma | 2.32 95% | 2.173 101% | 2.42 91% | 2.192 100% | 2.15 102% | 2.31 95% |
| CCT | 7145 91% | 7014 93% | 7439 87% | 6340 103% | 7109 91% | 6395 102% |
| Color Space (Percent of AdobeRGB 1998) (%) | 68 | 86 26% | 65 -4% | 68 0% | 64.3 -5% | 98 44% |
| Color Space (Percent of sRGB) (%) | 91 | 99 9% | 100 10% | 90 -1% | 99 9% | 100 10% |
| Totalt genomsnitt (program/inställningar) | 2% /
-13% | -2% /
-1% | -5% /
2% | 12% /
-3% | 39% /
20% |
* ... mindre är bättre
Visa svarstider
| ↔ Svarstid svart till vitt | ||
|---|---|---|
| 10 ms ... stiga ↗ och falla ↘ kombinerat | ↗ 5.6 ms stiga | 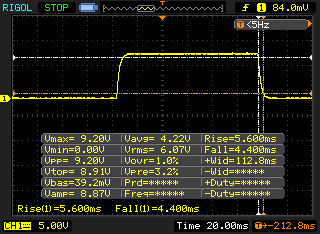 |
| ↘ 4.4 ms hösten | ||
| Skärmen visar bra svarsfrekvens i våra tester, men kan vara för långsam för konkurrenskraftiga spelare. I jämförelse sträcker sig alla testade enheter från 0.1 (minst) till 240 (maximalt) ms. » 27 % av alla enheter är bättre. Det betyder att den uppmätta svarstiden är bättre än genomsnittet av alla testade enheter (19.8 ms). | ||
| ↔ Svarstid 50 % grått till 80 % grått | ||
| 12 ms ... stiga ↗ och falla ↘ kombinerat | ↗ 6.8 ms stiga | 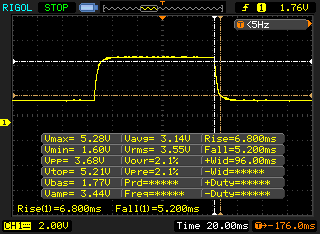 |
| ↘ 5.2 ms hösten | ||
| Skärmen visar bra svarsfrekvens i våra tester, men kan vara för långsam för konkurrenskraftiga spelare. I jämförelse sträcker sig alla testade enheter från 0.165 (minst) till 636 (maximalt) ms. » 25 % av alla enheter är bättre. Det betyder att den uppmätta svarstiden är bättre än genomsnittet av alla testade enheter (31 ms). | ||
Skärmflimmer / PWM (Puls-Width Modulation)
| Skärmflimmer / PWM upptäckt | 23580 Hz | ≤ 30 % ljusstyrka inställning | 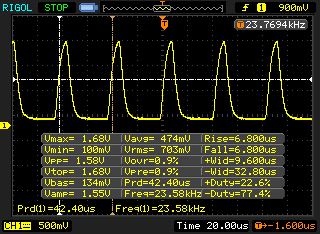 |
Displayens bakgrundsbelysning flimrar vid 23580 Hz (i värsta fall, t.ex. med PWM) Flimrande upptäckt vid en ljusstyrkeinställning på 30 % och lägre. Det ska inte finnas något flimmer eller PWM över denna ljusstyrkeinställning. Frekvensen för 23580 Hz är ganska hög, så de flesta användare som är känsliga för PWM bör inte märka något flimmer. Som jämförelse: 52 % av alla testade enheter använder inte PWM för att dämpa skärmen. Om PWM upptäcktes mättes ett medelvärde av 7763 (minst: 5 - maximum: 343500) Hz. | |||
| Cinebench R15 | |
| CPU Single 64Bit | |
| Genomsnitt av klass Gaming (188.8 - 343, n=109, senaste 2 åren) | |
| Asus TUF Dash F15 FX516PR | |
| Genomsnitt Intel Core i7-11370H (162.9 - 233, n=15) | |
| Gigabyte Aero 15 OLED XB-8DE51B0SP | |
| Asus ROG Zephyrus G15 GA503Q | |
| Aorus 15G XB | |
| Razer Blade 15 RTX 2070 Super Max-Q | |
| MSI GS66 Stealth 10SFS | |
| CPU Multi 64Bit | |
| Genomsnitt av klass Gaming (1578 - 6271, n=108, senaste 2 åren) | |
| Asus ROG Zephyrus G15 GA503Q | |
| Aorus 15G XB | |
| Gigabyte Aero 15 OLED XB-8DE51B0SP | |
| MSI GS66 Stealth 10SFS | |
| Razer Blade 15 RTX 2070 Super Max-Q | |
| Asus TUF Dash F15 FX516PR | |
| Genomsnitt Intel Core i7-11370H (606 - 1086, n=17) | |
| Blender - v2.79 BMW27 CPU | |
| Genomsnitt Intel Core i7-11370H (432 - 762, n=11) | |
| Asus TUF Dash F15 FX516PR | |
| Razer Blade 15 RTX 2070 Super Max-Q | |
| MSI GS66 Stealth 10SFS | |
| Gigabyte Aero 15 OLED XB-8DE51B0SP | |
| Aorus 15G XB | |
| Asus ROG Zephyrus G15 GA503Q | |
| Genomsnitt av klass Gaming (80 - 330, n=107, senaste 2 åren) | |
| Cinebench R20 | |
| CPU (Single Core) | |
| Genomsnitt av klass Gaming (442 - 895, n=109, senaste 2 åren) | |
| Genomsnitt Intel Core i7-11370H (475 - 601, n=11) | |
| Asus ROG Zephyrus G15 GA503Q | |
| Asus TUF Dash F15 FX516PR | |
| Gigabyte Aero 15 OLED XB-8DE51B0SP | |
| Razer Blade 15 RTX 2070 Super Max-Q | |
| Aorus 15G XB | |
| MSI GS66 Stealth 10SFS | |
| CPU (Multi Core) | |
| Genomsnitt av klass Gaming (4029 - 16108, n=109, senaste 2 åren) | |
| Asus ROG Zephyrus G15 GA503Q | |
| Gigabyte Aero 15 OLED XB-8DE51B0SP | |
| Aorus 15G XB | |
| MSI GS66 Stealth 10SFS | |
| Razer Blade 15 RTX 2070 Super Max-Q | |
| Asus TUF Dash F15 FX516PR | |
| Genomsnitt Intel Core i7-11370H (1438 - 2578, n=11) | |
| Geekbench 5.5 | |
| Single-Core | |
| Genomsnitt av klass Gaming (986 - 2474, n=108, senaste 2 åren) | |
| Genomsnitt Intel Core i7-11370H (1376 - 1607, n=10) | |
| Asus ROG Zephyrus G15 GA503Q | |
| Asus TUF Dash F15 FX516PR | |
| Gigabyte Aero 15 OLED XB-8DE51B0SP | |
| Razer Blade 15 RTX 2070 Super Max-Q | |
| MSI GS66 Stealth 10SFS | |
| Aorus 15G XB | |
| Multi-Core | |
| Genomsnitt av klass Gaming (6460 - 27010, n=108, senaste 2 åren) | |
| Aorus 15G XB | |
| Gigabyte Aero 15 OLED XB-8DE51B0SP | |
| Asus ROG Zephyrus G15 GA503Q | |
| MSI GS66 Stealth 10SFS | |
| Razer Blade 15 RTX 2070 Super Max-Q | |
| Genomsnitt Intel Core i7-11370H (3828 - 6115, n=10) | |
| Asus TUF Dash F15 FX516PR | |
| HWBOT x265 Benchmark v2.2 - 4k Preset | |
| Genomsnitt av klass Gaming (11.5 - 44.3, n=108, senaste 2 åren) | |
| Asus ROG Zephyrus G15 GA503Q | |
| Gigabyte Aero 15 OLED XB-8DE51B0SP | |
| Aorus 15G XB | |
| MSI GS66 Stealth 10SFS | |
| Razer Blade 15 RTX 2070 Super Max-Q | |
| Asus TUF Dash F15 FX516PR | |
| Genomsnitt Intel Core i7-11370H (4.98 - 8.82, n=11) | |
| LibreOffice - 20 Documents To PDF | |
| Asus TUF Dash F15 FX516PR | |
| Aorus 15G XB | |
| Asus ROG Zephyrus G15 GA503Q | |
| MSI GS66 Stealth 10SFS | |
| Gigabyte Aero 15 OLED XB-8DE51B0SP | |
| Genomsnitt av klass Gaming (19 - 88.8, n=108, senaste 2 åren) | |
| Razer Blade 15 RTX 2070 Super Max-Q | |
| Genomsnitt Intel Core i7-11370H (23.6 - 56.5, n=11) | |
| R Benchmark 2.5 - Overall mean | |
| MSI GS66 Stealth 10SFS | |
| Aorus 15G XB | |
| Razer Blade 15 RTX 2070 Super Max-Q | |
| Genomsnitt Intel Core i7-11370H (0.544 - 0.596, n=11) | |
| Asus TUF Dash F15 FX516PR | |
| Gigabyte Aero 15 OLED XB-8DE51B0SP | |
| Asus ROG Zephyrus G15 GA503Q | |
| Genomsnitt av klass Gaming (0.3439 - 0.759, n=109, senaste 2 åren) | |
* ... mindre är bättre
| PCMark 10 - Score | |
| Genomsnitt av klass Gaming (5828 - 11574, n=95, senaste 2 åren) | |
| Asus ROG Zephyrus G15 GA503Q | |
| Razer Blade 15 RTX 2070 Super Max-Q | |
| Gigabyte Aero 15 OLED XB-8DE51B0SP | |
| MSI GS66 Stealth 10SFS | |
| Asus TUF Dash F15 FX516PR | |
| Aorus 15G XB | |
| PCMark 10 Score | 6088 poäng | |
Hjälp | ||
| DPC Latencies / LatencyMon - interrupt to process latency (max), Web, Youtube, Prime95 | |
| Aorus 15G XB | |
| MSI GS66 Stealth 10SFS | |
| Gigabyte Aero 15 OLED XB-8DE51B0SP | |
| Razer Blade 15 RTX 2070 Super Max-Q | |
| Asus TUF Dash F15 FX516PR | |
| Asus ROG Zephyrus G15 GA503Q | |
* ... mindre är bättre
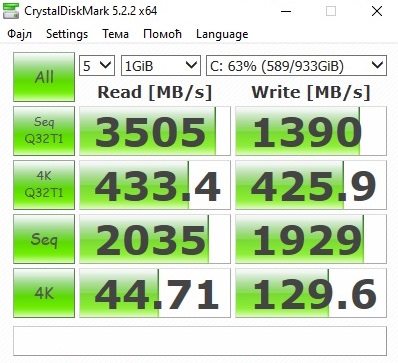
| Asus TUF Dash F15 FX516PR SK Hynix HFM001TD3JX013N | Asus ROG Zephyrus G15 GA503Q SK Hynix HFM001TD3JX013N | MSI GS66 Stealth 10SFS Samsung SSD PM981 MZVLB1T0HALR | Aorus 15G XB Samsung SSD PM981a MZVLB512HBJQ | Razer Blade 15 RTX 2070 Super Max-Q Samsung SSD PM981a MZVLB512HBJQ | Gigabyte Aero 15 OLED XB-8DE51B0SP Intel Optane Memory H10 with Solid State Storage 32GB + 512GB HBRPEKNX0202A(L/H) | |
|---|---|---|---|---|---|---|
| CrystalDiskMark 5.2 / 6 | 31% | 13% | 19% | 24% | 13% | |
| Write 4K (MB/s) | 129.6 | 156.4 21% | 131.3 1% | 121.6 -6% | 139.8 8% | 127.4 -2% |
| Read 4K (MB/s) | 44.71 | 66.7 49% | 45.84 3% | 44.37 -1% | 48.62 9% | 147.5 230% |
| Write Seq (MB/s) | 1929 | 2318 20% | 2370 23% | 2617 36% | 2260 17% | 485.9 -75% |
| Read Seq (MB/s) | 2035 | 2151 6% | 1509 -26% | 1297 -36% | 2135 5% | 1352 -34% |
| Write 4K Q32T1 (MB/s) | 425.9 | 525 23% | 481.5 13% | 499 17% | 499.3 17% | 476.5 12% |
| Read 4K Q32T1 (MB/s) | 433.4 | 452.1 4% | 560 29% | 557 29% | 552 27% | 531 23% |
| Write Seq Q32T1 (MB/s) | 1390 | 3055 120% | 2392 72% | 2978 114% | 2960 113% | 1061 -24% |
| Read Seq Q32T1 (MB/s) | 3505 | 3607 3% | 3232 -8% | 3360 -4% | 3269 -7% | 2552 -27% |
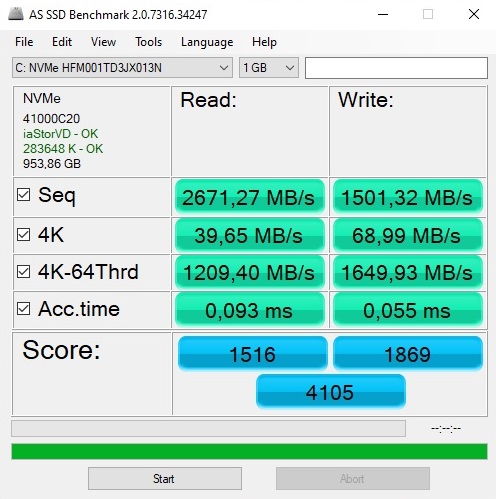
| AS SSD | 31% | 22% | 24% | 12% | -15% | |
| Seq Read (MB/s) | 2671 | 2950 10% | 1065 -60% | 1795 -33% | 1957 -27% | 1200 -55% |
| Seq Write (MB/s) | 1501 | 1600 7% | 2360 57% | 2724 81% | 2092 39% | 836 -44% |
| 4K Read (MB/s) | 39.65 | 53.6 35% | 48.09 21% | 49.67 25% | 50.2 27% | 65.8 66% |
| 4K Write (MB/s) | 69 | 126.8 84% | 110.7 60% | 109.3 58% | 96.5 40% | 103.8 50% |
| 4K-64 Read (MB/s) | 1209 | 1429 18% | 1635 35% | 1284 6% | 1594 32% | 789 -35% |
| 4K-64 Write (MB/s) | 1650 | 2177 32% | 1829 11% | 1962 19% | 2005 22% | 929 -44% |
| Access Time Read * (ms) | 0.093 | 0.064 31% | 0.071 24% | 0.063 32% | 0.057 39% | 0.103 -11% |
| Access Time Write * (ms) | 0.055 | 0.029 47% | 0.034 38% | 0.034 38% | 0.112 -104% | 0.045 18% |
| Score Read (Points) | 1516 | 1778 17% | 1790 18% | 1513 0% | 1840 21% | 975 -36% |
| Score Write (Points) | 1869 | 2464 32% | 2176 16% | 2344 25% | 2310 24% | 1117 -40% |
| Score Total (Points) | 4105 | 5090 24% | 4950 21% | 4685 14% | 5103 24% | 2594 -37% |
| Totalt genomsnitt (program/inställningar) | 31% /
31% | 18% /
18% | 22% /
22% | 18% /
17% | -1% /
-3% |
* ... mindre är bättre

DiskSpd Read Loop, Queue Depth 8
| 3DMark Cloud Gate Standard Score | 29530 poäng | |
| 3DMark Fire Strike Score | 16769 poäng | |
| 3DMark Time Spy Score | 7358 poäng | |
Hjälp | ||
| The Witcher 3 | |
| 1920x1080 Ultra Graphics & Postprocessing (HBAO+) | |
| Genomsnitt av klass Gaming (95 - 240, n=8, senaste 2 åren) | |
| Genomsnitt NVIDIA GeForce RTX 3070 Laptop GPU (34.9 - 109, n=52) | |
| Asus ROG Zephyrus G15 GA503Q | |
| Gigabyte Aero 15 OLED XB-8DE51B0SP | |
| Asus TUF Dash F15 FX516PR | |
| Aorus 15G XB | |
| Razer Blade 15 RTX 2070 Super Max-Q | |
| MSI GS66 Stealth 10SFS | |
| 3840x2160 High Graphics & Postprocessing (Nvidia HairWorks Off) | |
| Genomsnitt av klass Gaming (114 - 169.8, n=3, senaste 2 åren) | |
| Asus ROG Zephyrus G15 GA503Q | |
| Genomsnitt NVIDIA GeForce RTX 3070 Laptop GPU (40.3 - 71.9, n=9) | |
| Gigabyte Aero 15 OLED XB-8DE51B0SP | |
| Asus TUF Dash F15 FX516PR | |
| låg | med. | hög | ultra | QHD | 4K | |
|---|---|---|---|---|---|---|
| GTA V (2015) | 164 | 153 | 111 | 72.6 | ||
| The Witcher 3 (2015) | 126 | 76.7 | 51 | |||
| Dota 2 Reborn (2015) | 127 | 116 | 107 | 103 | ||
| X-Plane 11.11 (2018) | 89.1 | 73.4 | 63.3 | |||
| Shadow of the Tomb Raider (2018) | 88 | 86 | 65 | 36 | ||
| Battlefield V (2018) | 106 | 100 | 80.5 | 49.4 | ||
| Apex Legends (2019) | 143 | 141 | 103 | 58.8 | ||
| Far Cry New Dawn (2019) | 80 | 70 | 62 | 42 | ||
| Metro Exodus (2019) | 69.4 | 57.1 | 45.3 | 27.7 | ||
| The Division 2 (2019) | 85 | 68 | 48 | 26 | ||
| Anno 1800 (2019) | 73.9 | 39.8 | 34.2 | 21.8 | ||
| Rage 2 (2019) | 102 | 99.7 | 65.3 | 32.7 | ||
| Control (2019) | 69.6 | 45.2 | 22.3 | |||
| Borderlands 3 (2019) | 78.2 | 65.4 | 47.2 | 25.7 | ||
| GRID 2019 (2019) | 83.2 | 63.7 | 55.6 | 38.1 | ||
| Need for Speed Heat (2019) | 66.1 | 64.8 | 54.8 | 32.1 | ||
| Star Wars Jedi Fallen Order (2019) | 71.5 | 69.1 | 60.1 | 35 | ||
| Red Dead Redemption 2 (2019) | 67.2 | 46.3 | 37.5 | 24.3 | ||
| Hunt Showdown (2020) | 98.4 | 62.3 | 30.9 | |||
| Doom Eternal (2020) | 152 | 149 | 118 | 64 | ||
| Gears Tactics (2020) | 110 | 85.2 | 62.2 | 32.5 | ||
| F1 2020 (2020) | 118 | 97 | 74 | 45 | ||
| Death Stranding (2020) | 73.8 | 73.4 | 70.7 | 43.7 | ||
| Horizon Zero Dawn (2020) | 88 | 70 | 56 | 34 | ||
| Crysis Remastered (2020) | 63.1 | 47.2 | 37.3 | 23.9 | ||
| Serious Sam 4 (2020) | 74.3 | 66.4 | 55.9 | |||
| Mafia Definitive Edition (2020) | 77.6 | 57.9 | 31.4 | |||
| Star Wars Squadrons (2020) | 180 | 167 | 129 | 70.5 | ||
| FIFA 21 (2020) | 148 | 144 | 114 | 67.5 | ||
| Watch Dogs Legion (2020) | 68 | 55 | 42 | 25 | ||
| Dirt 5 (2020) | 76.5 | 50 | 33.3 | |||
| Assassin´s Creed Valhalla (2020) | 63 | 56 | 44 | 27 | ||
| Call of Duty Black Ops Cold War (2020) | 82 | 73.5 | 53.7 | 29.8 | ||
| Yakuza Like a Dragon (2020) | 90.2 | 84.3 | 59.2 | 31 | ||
| Immortals Fenyx Rising (2020) | 73 | 70 | 57 | 38 | ||
| Cyberpunk 2077 1.0 (2020) | 57.9 | 50 | 32 | 15.5 |
Ljudnivå
| Låg belastning |
| 25 / 30 / 35 dB(A) |
| Hög belastning |
| 53 / 54 dB(A) |
 | ||
30 dB tyst 40 dB(A) hörbar 50 dB(A) högt ljud |
||
min: | ||
| Asus TUF Dash F15 FX516PR i7-11370H, GeForce RTX 3070 Laptop GPU | Asus ROG Zephyrus G15 GA503Q R9 5900HS, GeForce RTX 3080 Laptop GPU | MSI GS66 Stealth 10SFS i9-10980HK, GeForce RTX 2070 Super Max-Q | Aorus 15G XB i7-10875H, GeForce RTX 2070 Super Max-Q | Razer Blade 15 RTX 2070 Super Max-Q i7-10875H, GeForce RTX 2070 Super Max-Q | Gigabyte Aero 15 OLED XB-8DE51B0SP i7-10875H, GeForce RTX 2070 Super Max-Q | |
|---|---|---|---|---|---|---|
| Noise | 4% | -11% | -7% | 3% | -13% | |
| av / miljö * (dB) | 24 | 25 -4% | 30 -25% | 25 -4% | 27 -13% | 30 -25% |
| Idle Minimum * (dB) | 25 | 26 -4% | 32 -28% | 32 -28% | 27 -8% | 34 -36% |
| Idle Average * (dB) | 30 | 27 10% | 34 -13% | 34 -13% | 27 10% | 36 -20% |
| Idle Maximum * (dB) | 35 | 31 11% | 39 -11% | 38 -9% | 27 23% | 41 -17% |
| Load Average * (dB) | 53 | 49 8% | 53 -0% | 48 9% | 44.7 16% | 48 9% |
| Witcher 3 ultra * (dB) | 48 | 49 -2% | 48 -0% | 50 -4% | 51.2 -7% | 48 -0% |
| Load Maximum * (dB) | 54 | 51 6% | 53 2% | 54 -0% | 54 -0% | 54 -0% |
* ... mindre är bättre
(-) Den maximala temperaturen på ovansidan är 55 °C / 131 F, jämfört med genomsnittet av 40.4 °C / 105 F , allt från 21.2 till 68.8 °C för klassen Gaming.
(-) Botten värms upp till maximalt 56 °C / 133 F, jämfört med genomsnittet av 43.2 °C / 110 F
(+) Vid tomgångsbruk är medeltemperaturen för ovansidan 27.2 °C / 81 F, jämfört med enhetsgenomsnittet på 33.9 °C / ### class_avg_f### F.
(-) När du spelar The Witcher 3 är medeltemperaturen för ovansidan 47.2 °C / 117 F, jämfört med enhetsgenomsnittet på 33.9 °C / ## #class_avg_f### F.
(±) Handledsstöden och pekplattan kan bli väldigt varma vid beröring med maximalt 38 °C / 100.4 F.
(-) Medeltemperaturen för handledsstödsområdet på liknande enheter var 28.8 °C / 83.8 F (-9.2 °C / -16.6 F).
| Asus TUF Dash F15 FX516PR i7-11370H, GeForce RTX 3070 Laptop GPU | Asus ROG Zephyrus G15 GA503Q R9 5900HS, GeForce RTX 3080 Laptop GPU | MSI GS66 Stealth 10SFS i9-10980HK, GeForce RTX 2070 Super Max-Q | Aorus 15G XB i7-10875H, GeForce RTX 2070 Super Max-Q | Razer Blade 15 RTX 2070 Super Max-Q i7-10875H, GeForce RTX 2070 Super Max-Q | Gigabyte Aero 15 OLED XB-8DE51B0SP i7-10875H, GeForce RTX 2070 Super Max-Q | |
|---|---|---|---|---|---|---|
| Heat | 0% | 5% | 6% | -10% | 5% | |
| Maximum Upper Side * (°C) | 55 | 51 7% | 53 4% | 44 20% | 50 9% | 49 11% |
| Maximum Bottom * (°C) | 56 | 56 -0% | 55 2% | 63 -13% | 52.2 7% | 61 -9% |
| Idle Upper Side * (°C) | 29 | 29 -0% | 28 3% | 27 7% | 37.2 -28% | 27 7% |
| Idle Bottom * (°C) | 32 | 34 -6% | 29 9% | 29 9% | 41.4 -29% | 29 9% |
* ... mindre är bättre
Asus TUF Dash F15 FX516PR ljudanalys
(±) | högtalarljudstyrkan är genomsnittlig men bra (81 dB)
Bas 100 - 315 Hz
(±) | reducerad bas - i genomsnitt 13.8% lägre än medianen
(±) | linjäriteten för basen är genomsnittlig (8.6% delta till föregående frekvens)
Mellan 400 - 2000 Hz
(+) | balanserad mellan - endast 3.4% från medianen
(+) | mids är linjära (5.5% delta till föregående frekvens)
Högsta 2 - 16 kHz
(±) | högre toppar - i genomsnitt 7.1% högre än medianen
(±) | linjäriteten för toppar är genomsnittlig (11.8% delta till föregående frekvens)
Totalt 100 - 16 000 Hz
(±) | linjäriteten för det totala ljudet är genomsnittlig (15.4% skillnad mot median)
Jämfört med samma klass
» 34% av alla testade enheter i den här klassen var bättre, 7% liknande, 59% sämre
» Den bästa hade ett delta på 6%, genomsnittet var 18%, sämst var 132%
Jämfört med alla testade enheter
» 22% av alla testade enheter var bättre, 4% liknande, 73% sämre
» Den bästa hade ett delta på 4%, genomsnittet var 24%, sämst var 134%
Asus ROG Zephyrus G15 GA503Q ljudanalys
(±) | högtalarljudstyrkan är genomsnittlig men bra (78 dB)
Bas 100 - 315 Hz
(+) | bra bas - bara 4% från medianen
(+) | basen är linjär (6.5% delta till föregående frekvens)
Mellan 400 - 2000 Hz
(+) | balanserad mellan - endast 4.5% från medianen
(+) | mids är linjära (2.1% delta till föregående frekvens)
Högsta 2 - 16 kHz
(+) | balanserade toppar - endast 3.5% från medianen
(+) | toppar är linjära (5.7% delta till föregående frekvens)
Totalt 100 - 16 000 Hz
(+) | det totala ljudet är linjärt (11.2% skillnad mot median)
Jämfört med samma klass
» 8% av alla testade enheter i den här klassen var bättre, 4% liknande, 88% sämre
» Den bästa hade ett delta på 6%, genomsnittet var 18%, sämst var 132%
Jämfört med alla testade enheter
» 7% av alla testade enheter var bättre, 2% liknande, 91% sämre
» Den bästa hade ett delta på 4%, genomsnittet var 24%, sämst var 134%
| Av/Standby | |
| Låg belastning | |
| Hög belastning |
|
Förklaring:
min: | |
| Asus TUF Dash F15 FX516PR i7-11370H, GeForce RTX 3070 Laptop GPU | Asus ROG Zephyrus G15 GA503Q R9 5900HS, GeForce RTX 3080 Laptop GPU | MSI GS66 Stealth 10SFS i9-10980HK, GeForce RTX 2070 Super Max-Q | Aorus 15G XB i7-10875H, GeForce RTX 2070 Super Max-Q | Razer Blade 15 RTX 2070 Super Max-Q i7-10875H, GeForce RTX 2070 Super Max-Q | Gigabyte Aero 15 OLED XB-8DE51B0SP i7-10875H, GeForce RTX 2070 Super Max-Q | |
|---|---|---|---|---|---|---|
| Power Consumption | -7% | -39% | -55% | -61% | -69% | |
| Idle Minimum * (Watt) | 9 | 10 -11% | 13 -44% | 16 -78% | 14.3 -59% | 18 -100% |
| Idle Average * (Watt) | 11 | 12 -9% | 16 -45% | 20 -82% | 22.3 -103% | 21 -91% |
| Idle Maximum * (Watt) | 16 | 17 -6% | 27 -69% | 30 -88% | 36.9 -131% | 38 -138% |
| Load Average * (Watt) | 107 | 108 -1% | 109 -2% | 102 5% | 118.4 -11% | 113 -6% |
| Witcher 3 ultra * (Watt) | 121 | 123 -2% | 155 -28% | 156 -29% | 153.7 -27% | 149 -23% |
| Load Maximum * (Watt) | 162 | 182 -12% | 236 -46% | 256 -58% | 220.8 -36% | 256 -58% |
* ... mindre är bättre
| Asus TUF Dash F15 FX516PR i7-11370H, GeForce RTX 3070 Laptop GPU, 76 Wh | Asus ROG Zephyrus G15 GA503Q R9 5900HS, GeForce RTX 3080 Laptop GPU, 90 Wh | MSI GS66 Stealth 10SFS i9-10980HK, GeForce RTX 2070 Super Max-Q, 99.99 Wh | Aorus 15G XB i7-10875H, GeForce RTX 2070 Super Max-Q, 94 Wh | Razer Blade 15 RTX 2070 Super Max-Q i7-10875H, GeForce RTX 2070 Super Max-Q, 80 Wh | Gigabyte Aero 15 OLED XB-8DE51B0SP i7-10875H, GeForce RTX 2070 Super Max-Q, 94.2 Wh | |
|---|---|---|---|---|---|---|
| Batteridrifttid | -11% | -40% | -31% | -31% | -40% | |
| Reader / Idle (h) | 16 | 12.1 -24% | 8.4 -47% | 9.7 -39% | 8.6 -46% | |
| WiFi v1.3 (h) | 9.1 | 9.4 3% | 6.1 -33% | 7 -23% | 6.3 -31% | 6.1 -33% |
| Load (h) | 1.5 | 1.7 | 2.5 | 2.8 | ||
| H.264 (h) | 7.7 |
För
Emot
Läs den fullständiga versionen av den här recensionen på engelska här.
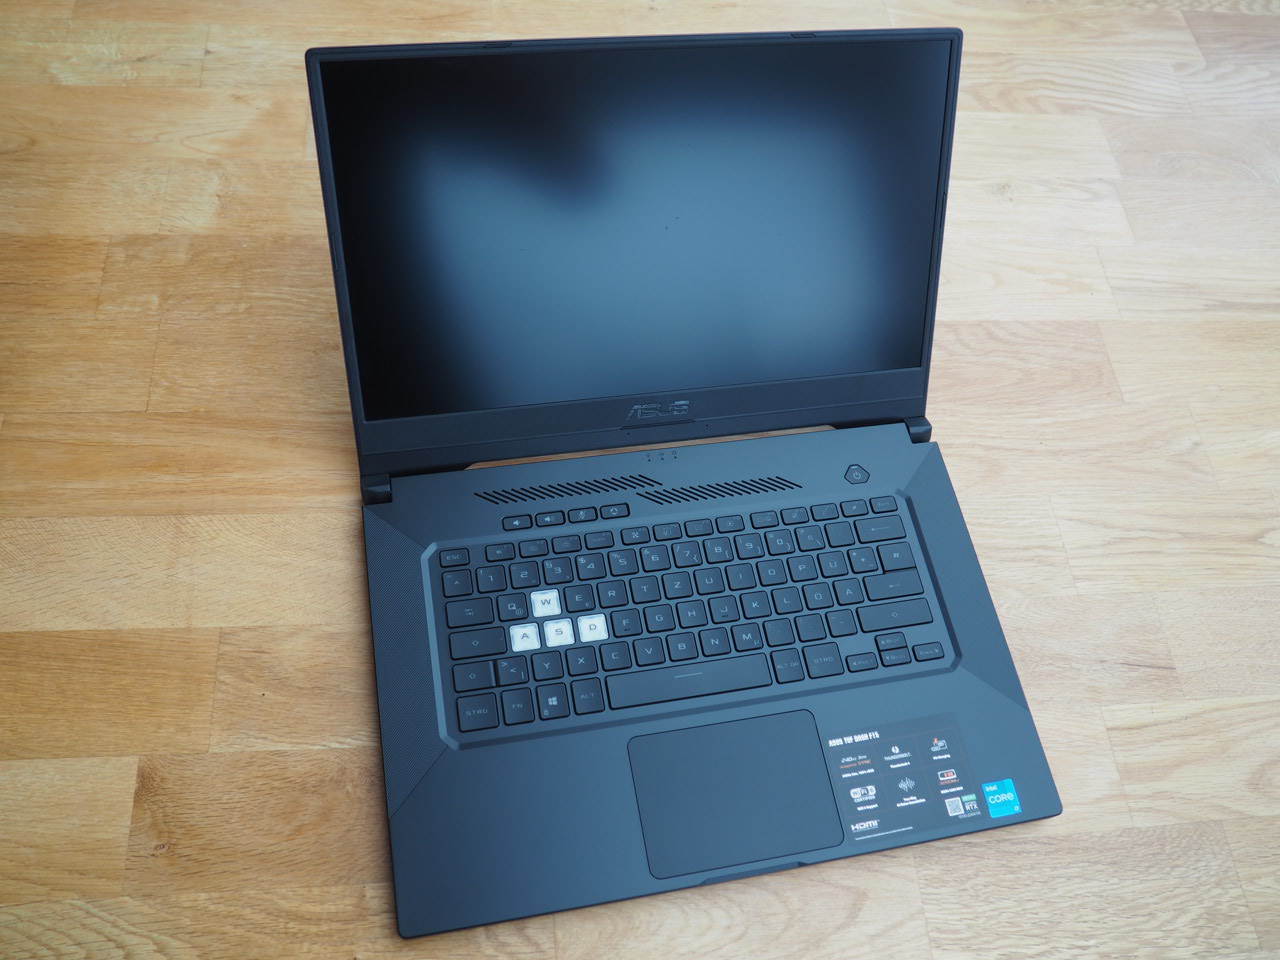
Asus TUF Dash F15 FX516P har utan tvekan sina fördelar.
Utöver en snabb men också aningen mörk 240 Hz-skärm inkluderar fördelarna riktigt lång batteritid som till och med är längre än på de flesta kontorslaptops.
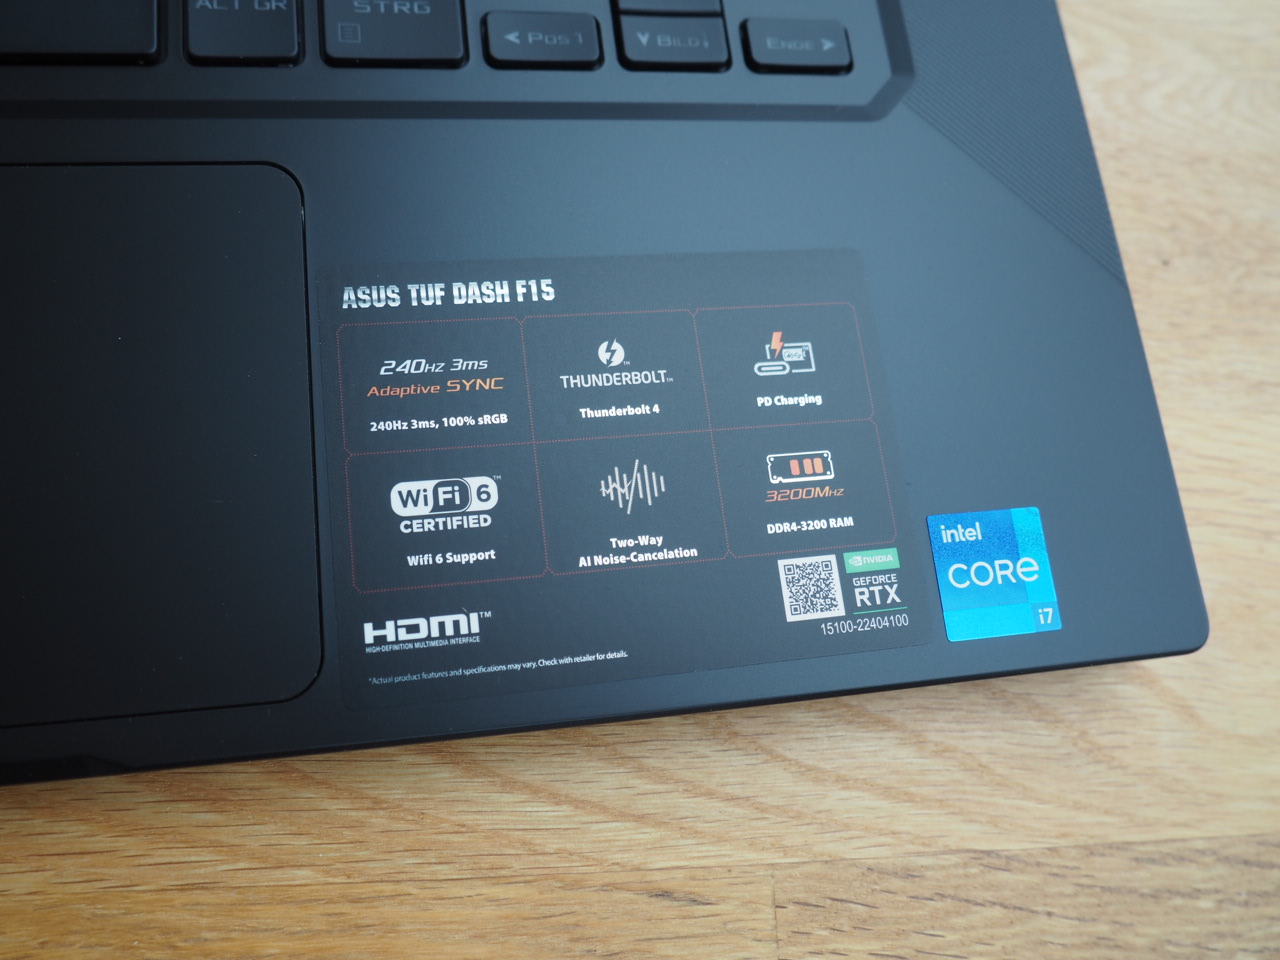
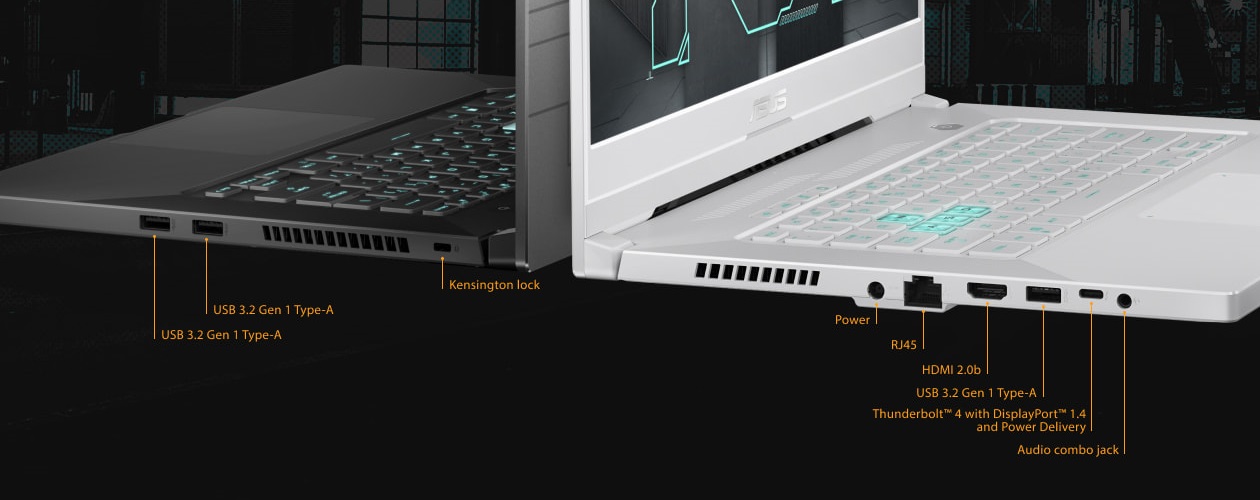
Vi gillade också faktum att den kommer med USB 4 och stöd för Thunderbolt med 100W Power Delivery-laddning.
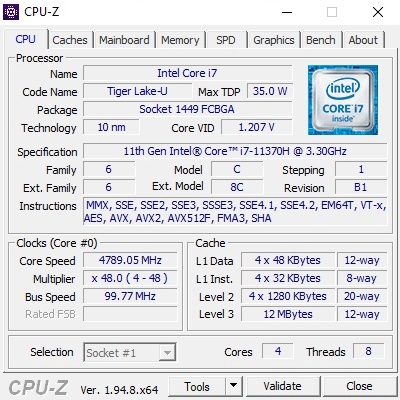
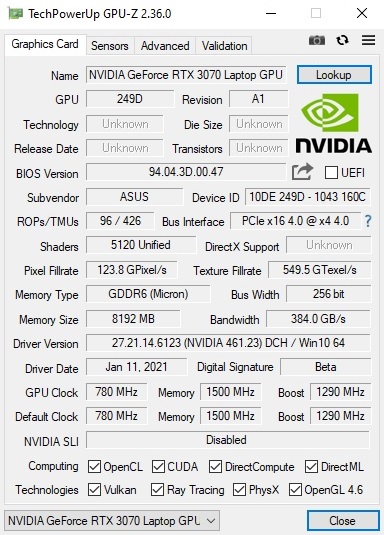
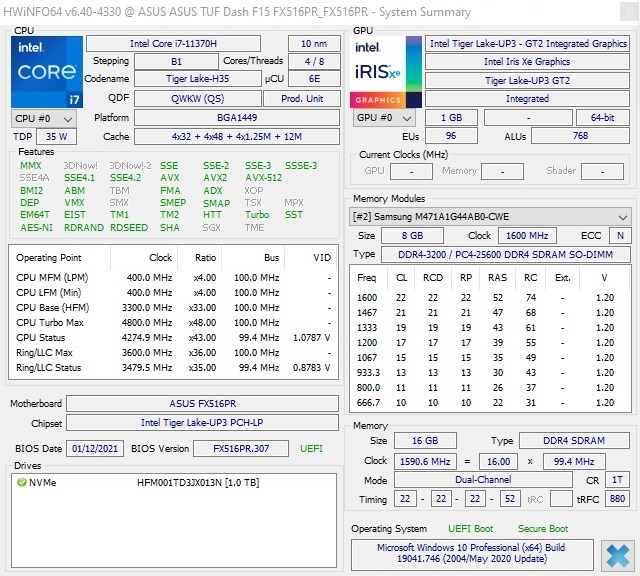
Men grafikprestandan är en öm punkt, och vi råder dig verkligen att inte har för höga förväntningar. Som tidigare nämnt har Asus konfigurerat RTX 3070 Laptop GPU:n med lägsta möjliga TGP-tröskelvärde, vilket begränsar prestandapotentialen rejält. Dessutom är en CPU med bara fyra kärnor inte direkt modernt 2021 med tanke på vad Dash F15 kostar. En billig sexkärnig CPU från AMD hade passat mycket bättre.
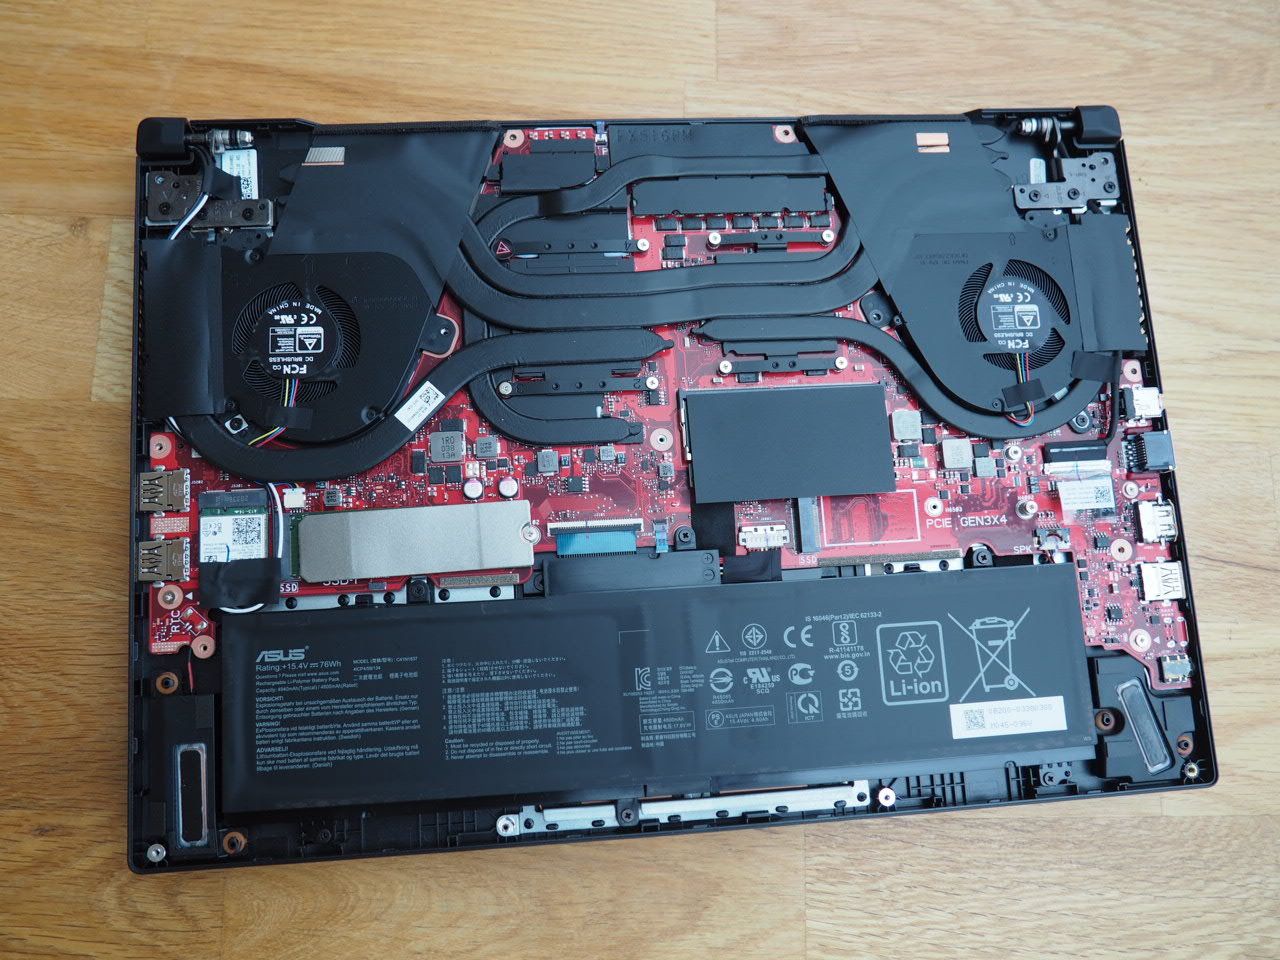
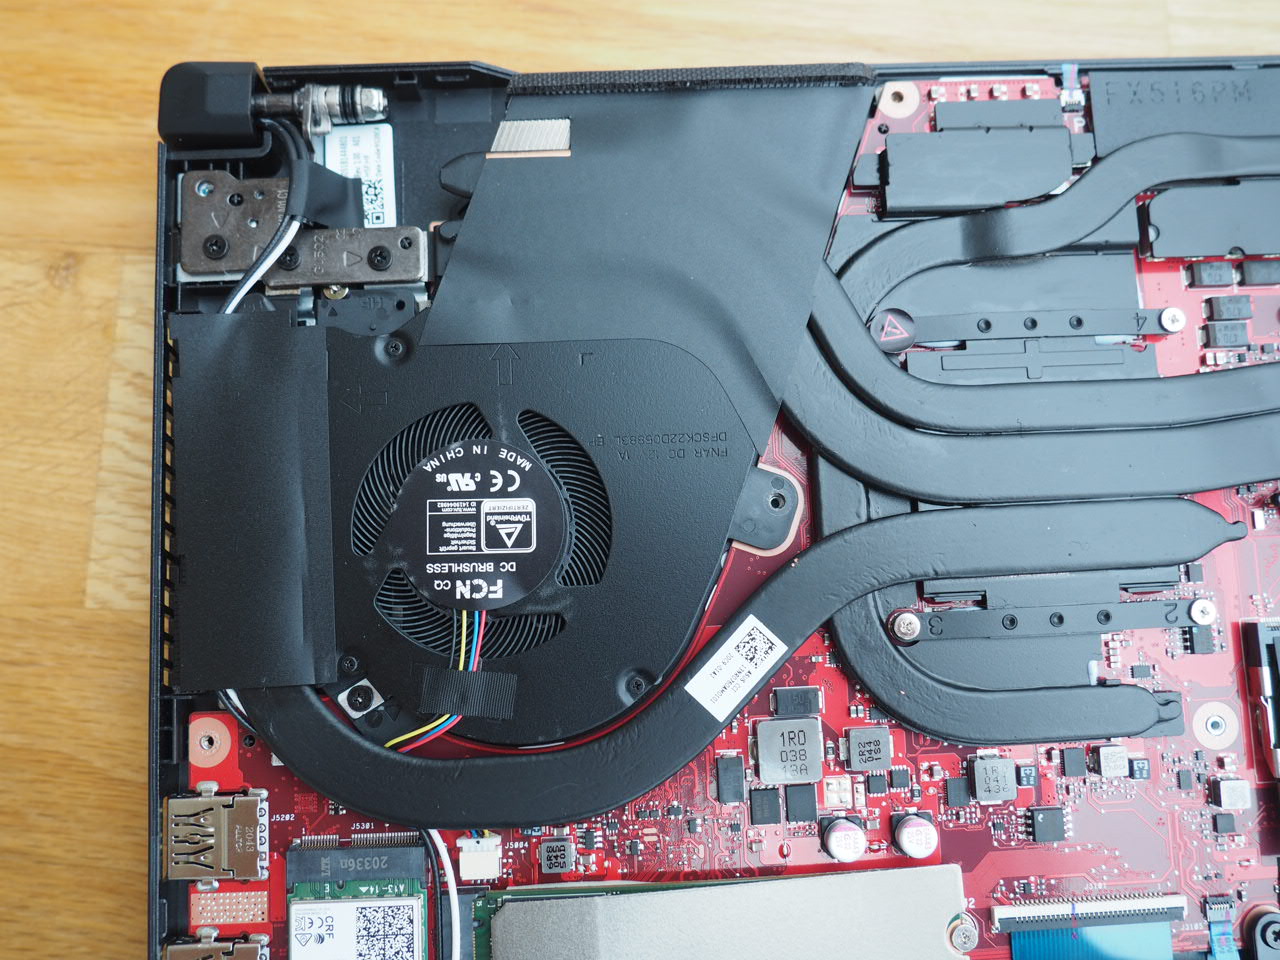
Asus borde överväga att förbättra temperatur- och ljudnivåerna vid 3D-belastning och vi önskar oss också en webbkamera till en eventuellt efterföljare till Dash F15.
Asus TUF Dash F15 FX516PR
- 02/02/2021 v7 (old)
Florian Glaser
Price comparison