Recension av Asus Vivobook Pro 16X - Asus-system med OLED-skärm i toppklass

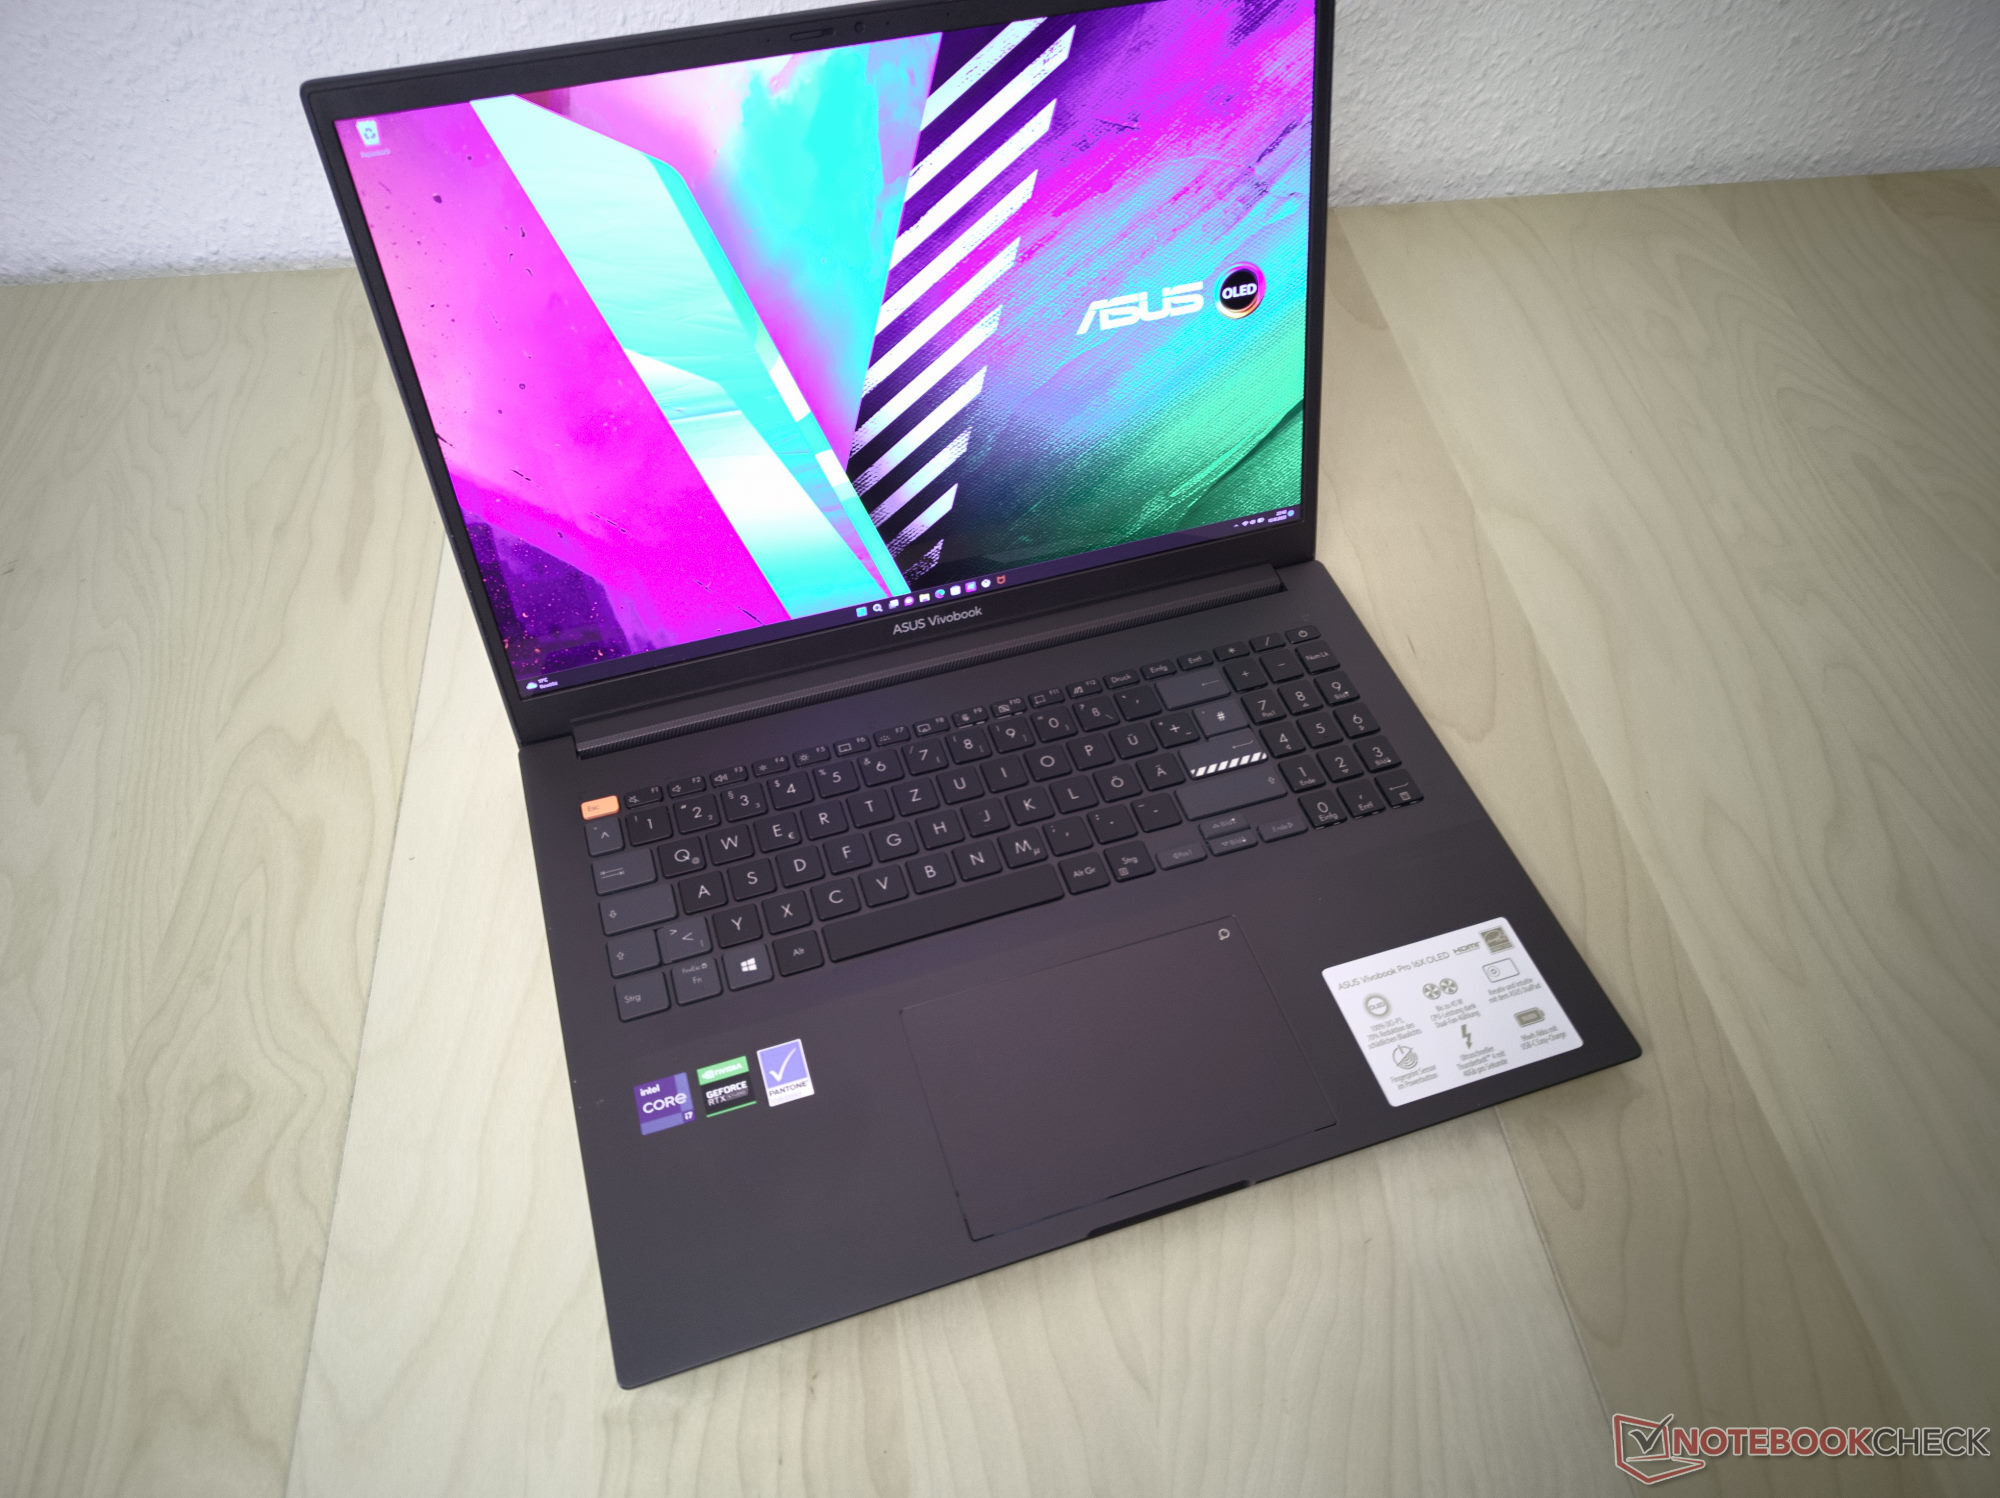
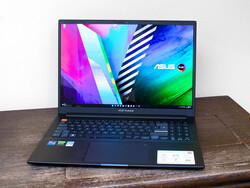
Med tanke på dess funktioner verkar Asus Vivobook Pro 16X vara inriktad på kreatörer. Den är utrustad med en utmärkt 16:10 OLED-skärm och uppnår goda resultat i olika benchmarks. Detta åstadkoms med en Intel Core i7-11370H från den senaste generationen och en Nvidia GeForce RTX 3050. Alternativt finns Vivobook Pro 16X också i många andra konfigurationer, som inkluderar de senaste AMD- eller Intel-processorerna och flera Nvidia GPU-alternativ.
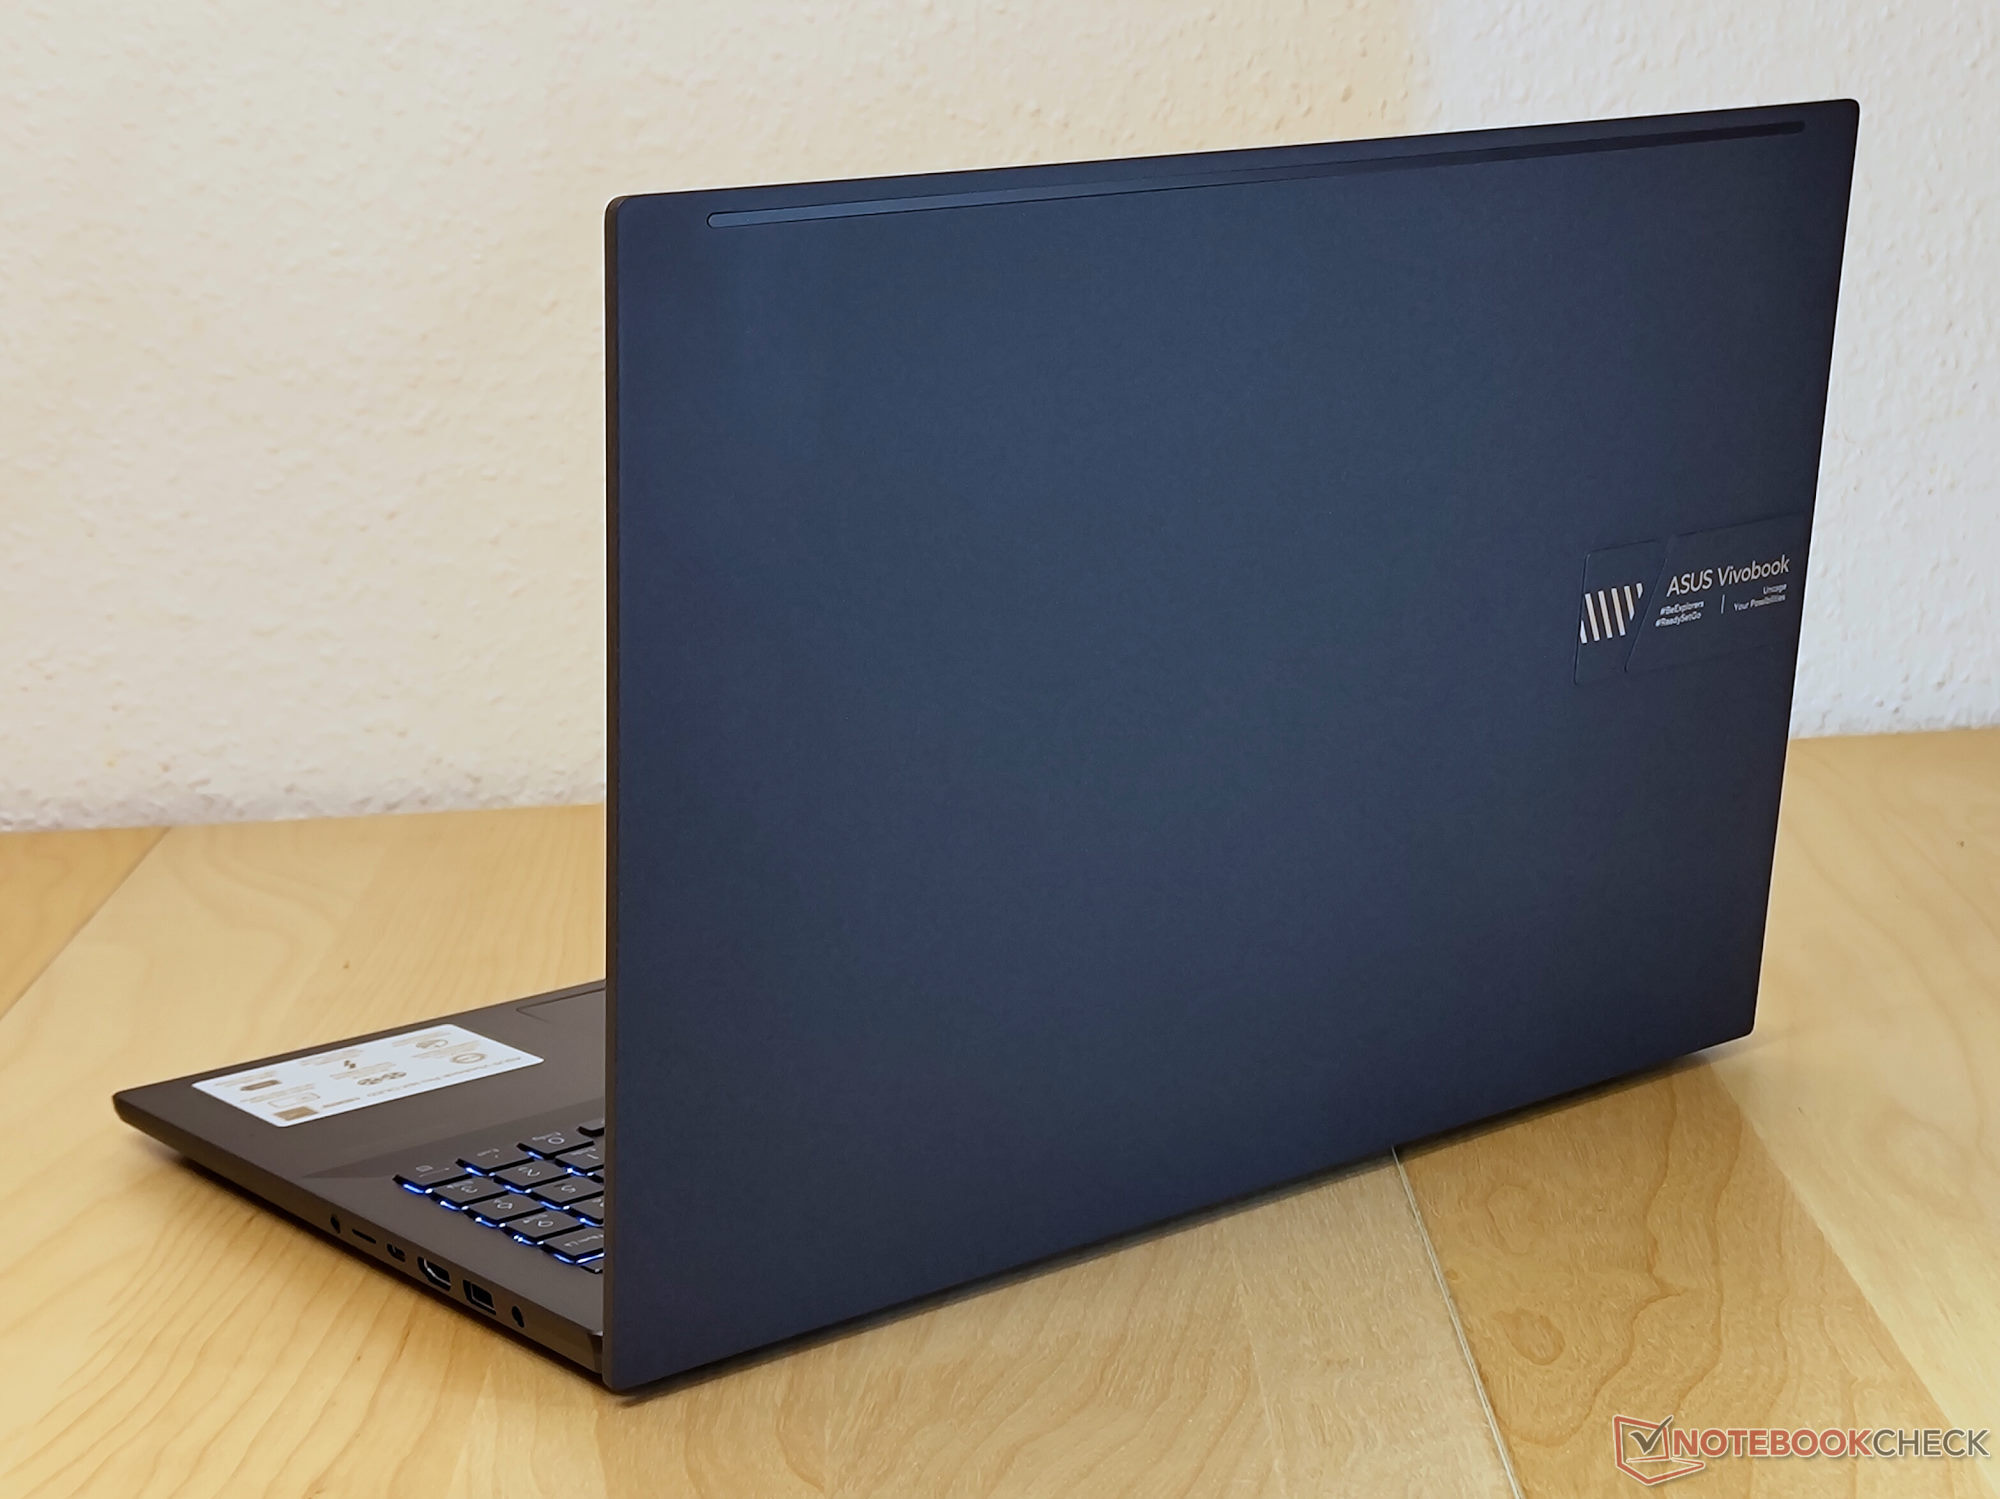
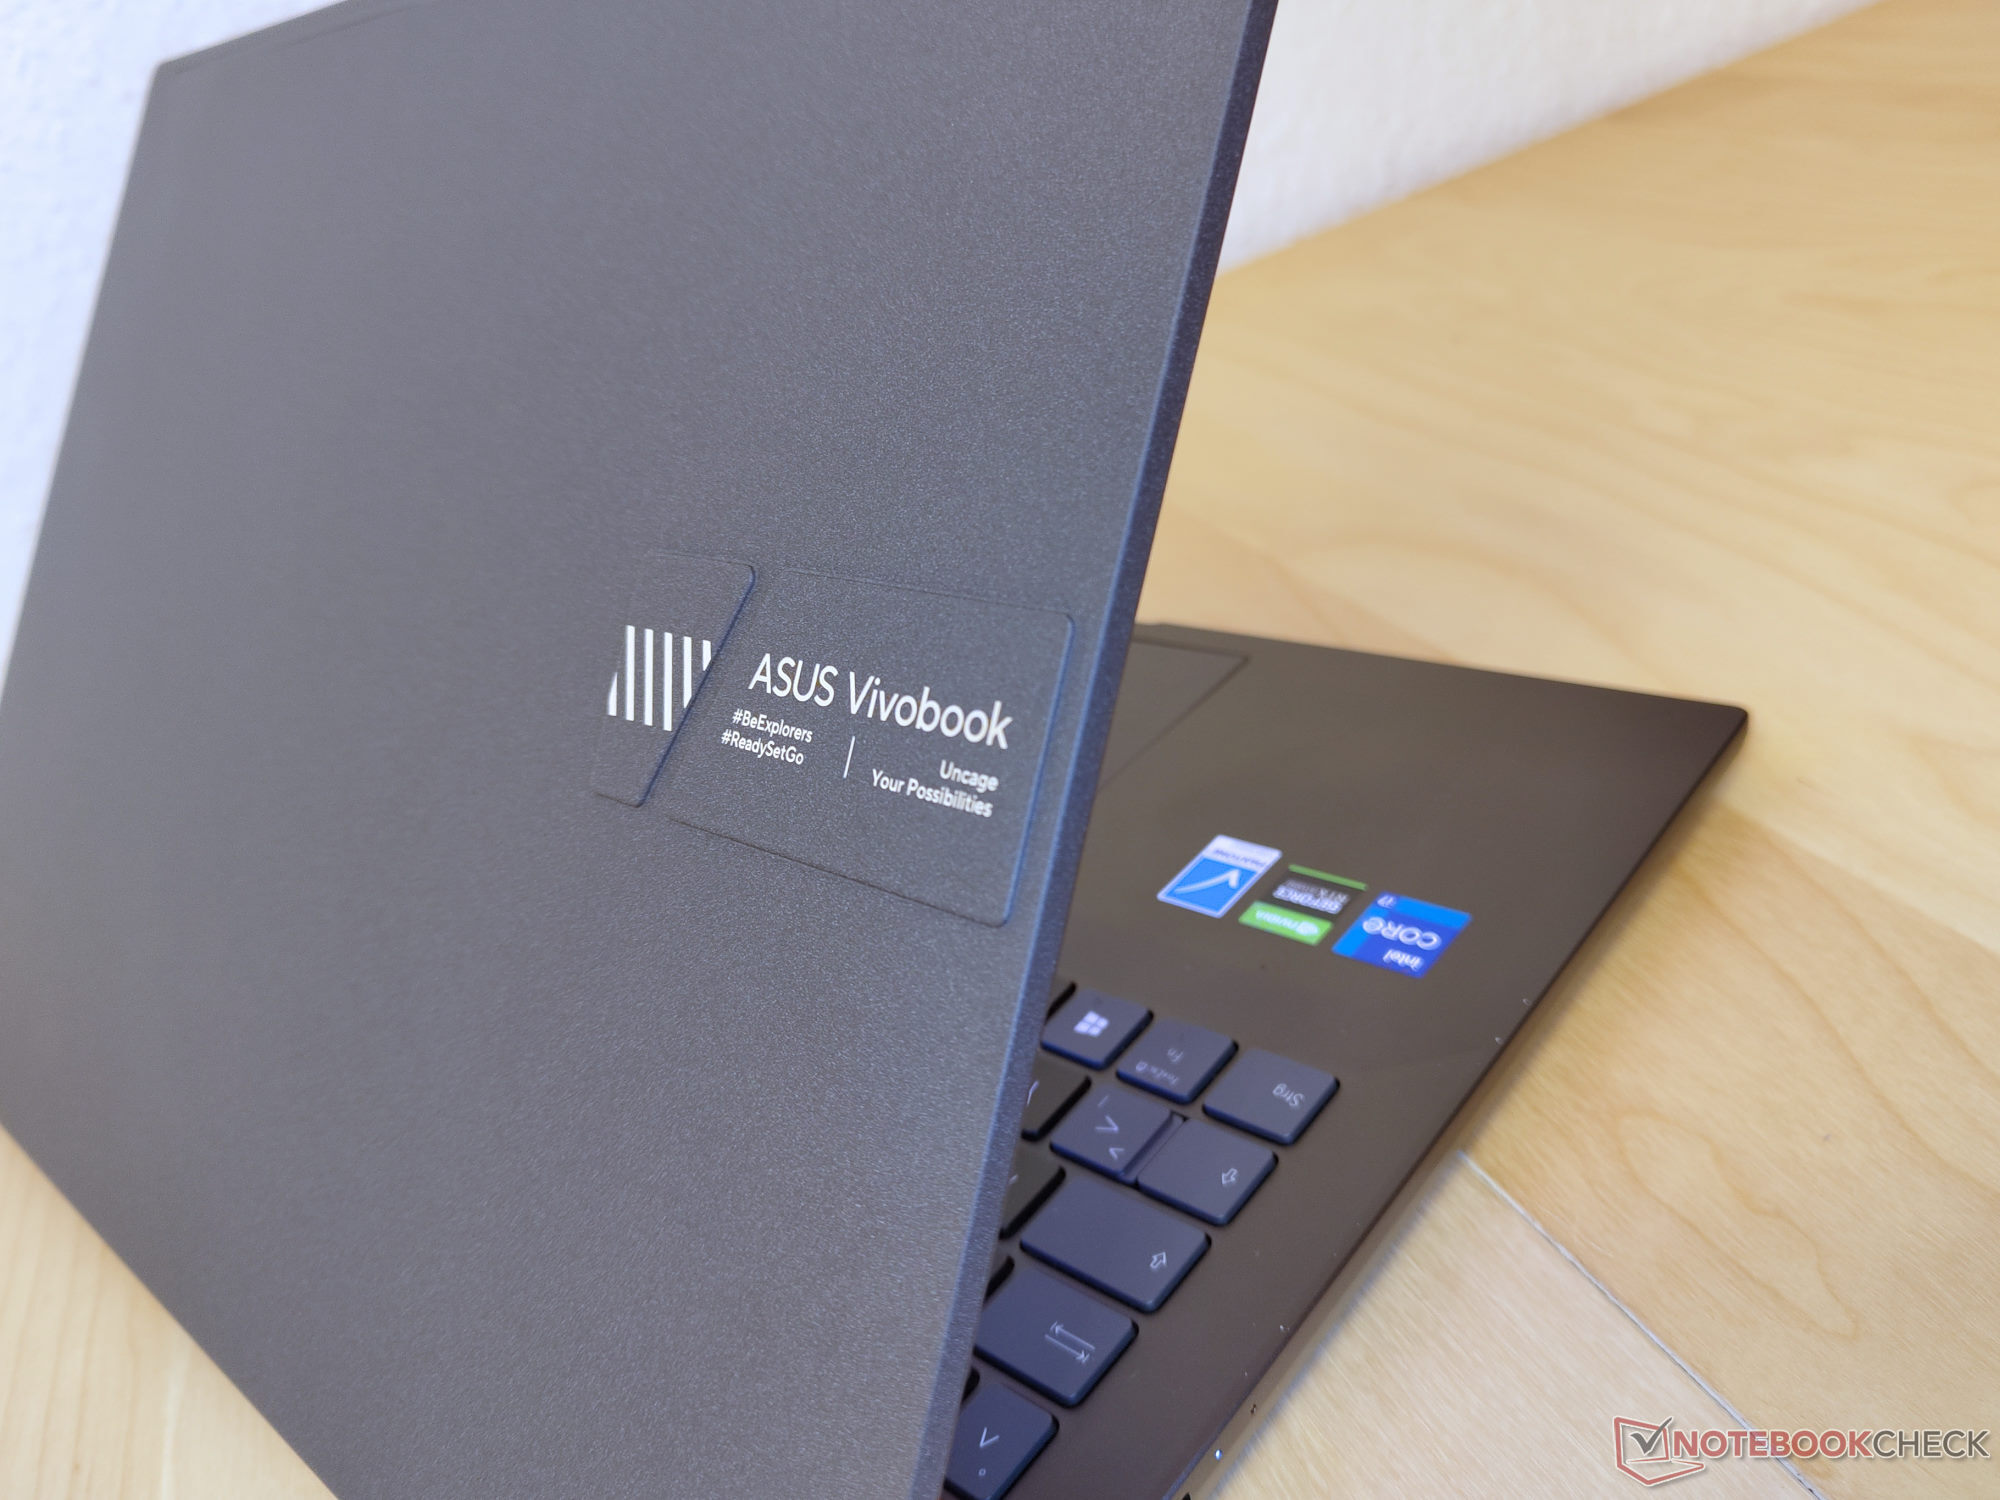
Den bärbara datorns visuella presentation gynnas av den generösa användningen av aluminium. Tack vare den vävda ytan är locket särskilt motståndskraftigt mot repor och fett.
Eftersom den bärbara multimediebärbara datorn är utrustad med kraftfulla komponenter valde vi bärbara datorer från olika kategorier för vår jämförelse. Till exempel har både den billigare Dell Inspiron 16 Plus 7610 och den betydligt dyrare ThinkPad X1 Extreme G4 är mycket lika när det gäller funktionerna. Oavsett detta kan Vivobook skilja sig från konkurrenterna tack vare sin utmärkta OLED-skärm.
Potentiella konkurrenter i jämförelse
Gradering | Datum | Modell | Vikt | Höjd | Storlek | Upplösning | Pris |
|---|---|---|---|---|---|---|---|
| 83.7 % v7 (old) | 11/2022 | Asus VivoBook Pro 16X OLED N7600PC-L2026X i7-11370H, GeForce RTX 3050 4GB Laptop GPU | 2 kg | 18.9 mm | 16.00" | 3840x2400 | |
| 84.2 % v7 (old) | 10/2022 | MSI Summit E16 Flip A12UDT-031 i7-1280P, GeForce RTX 3050 Ti Laptop GPU | 1.9 kg | 16.85 mm | 16.00" | 2560x1600 | |
| 89 % v7 (old) | 03/2022 | Microsoft Surface Laptop Studio i7 RTX 3050 Ti i7-11370H, GeForce RTX 3050 Ti Laptop GPU | 1.8 kg | 19 mm | 14.40" | 2400x1600 | |
| 86.7 % v7 (old) | 10/2021 | Dell Inspiron 16 Plus 7610 i7-11800H, GeForce RTX 3050 4GB Laptop GPU | 2 kg | 18.99 mm | 16.00" | 3072x1920 | |
| 89 % v7 (old) | 11/2021 | Lenovo ThinkPad X1 Extreme G4-20Y5CTO1WW (3050 Ti) i7-11800H, GeForce RTX 3050 Ti Laptop GPU | 2 kg | 18.2 mm | 16.00" | 3840x2400 | |
| 83.2 % v7 (old) | Schenker XMG Focus 15 i7-11800H, GeForce RTX 3050 Ti Laptop GPU | 1.9 kg | 22 mm | 15.60" | 1920x1080 |
Hölje - Aluminium överst, underst och i mitten
Även om det kanske inte syns vid första anblicken består nästan hela chassit i Vivobook 16X av aluminium. Basenheten har målats i antracit, medan en mörkgrå beläggning täcker locket. Den senare är matt, mycket robust och drar inte till sig fett. Asus marknadsför detta som en vävbeläggning. Beroende på i vilken vinkel ljuset träffar ytan kan den verka mycket slät eller mycket grov. Det finns en karakteristisk Asus-logotyp i ett avskilt område på baksidan av locket. Designen på den bärbara multimediebärbara datorn är annars relativt okomplicerad.
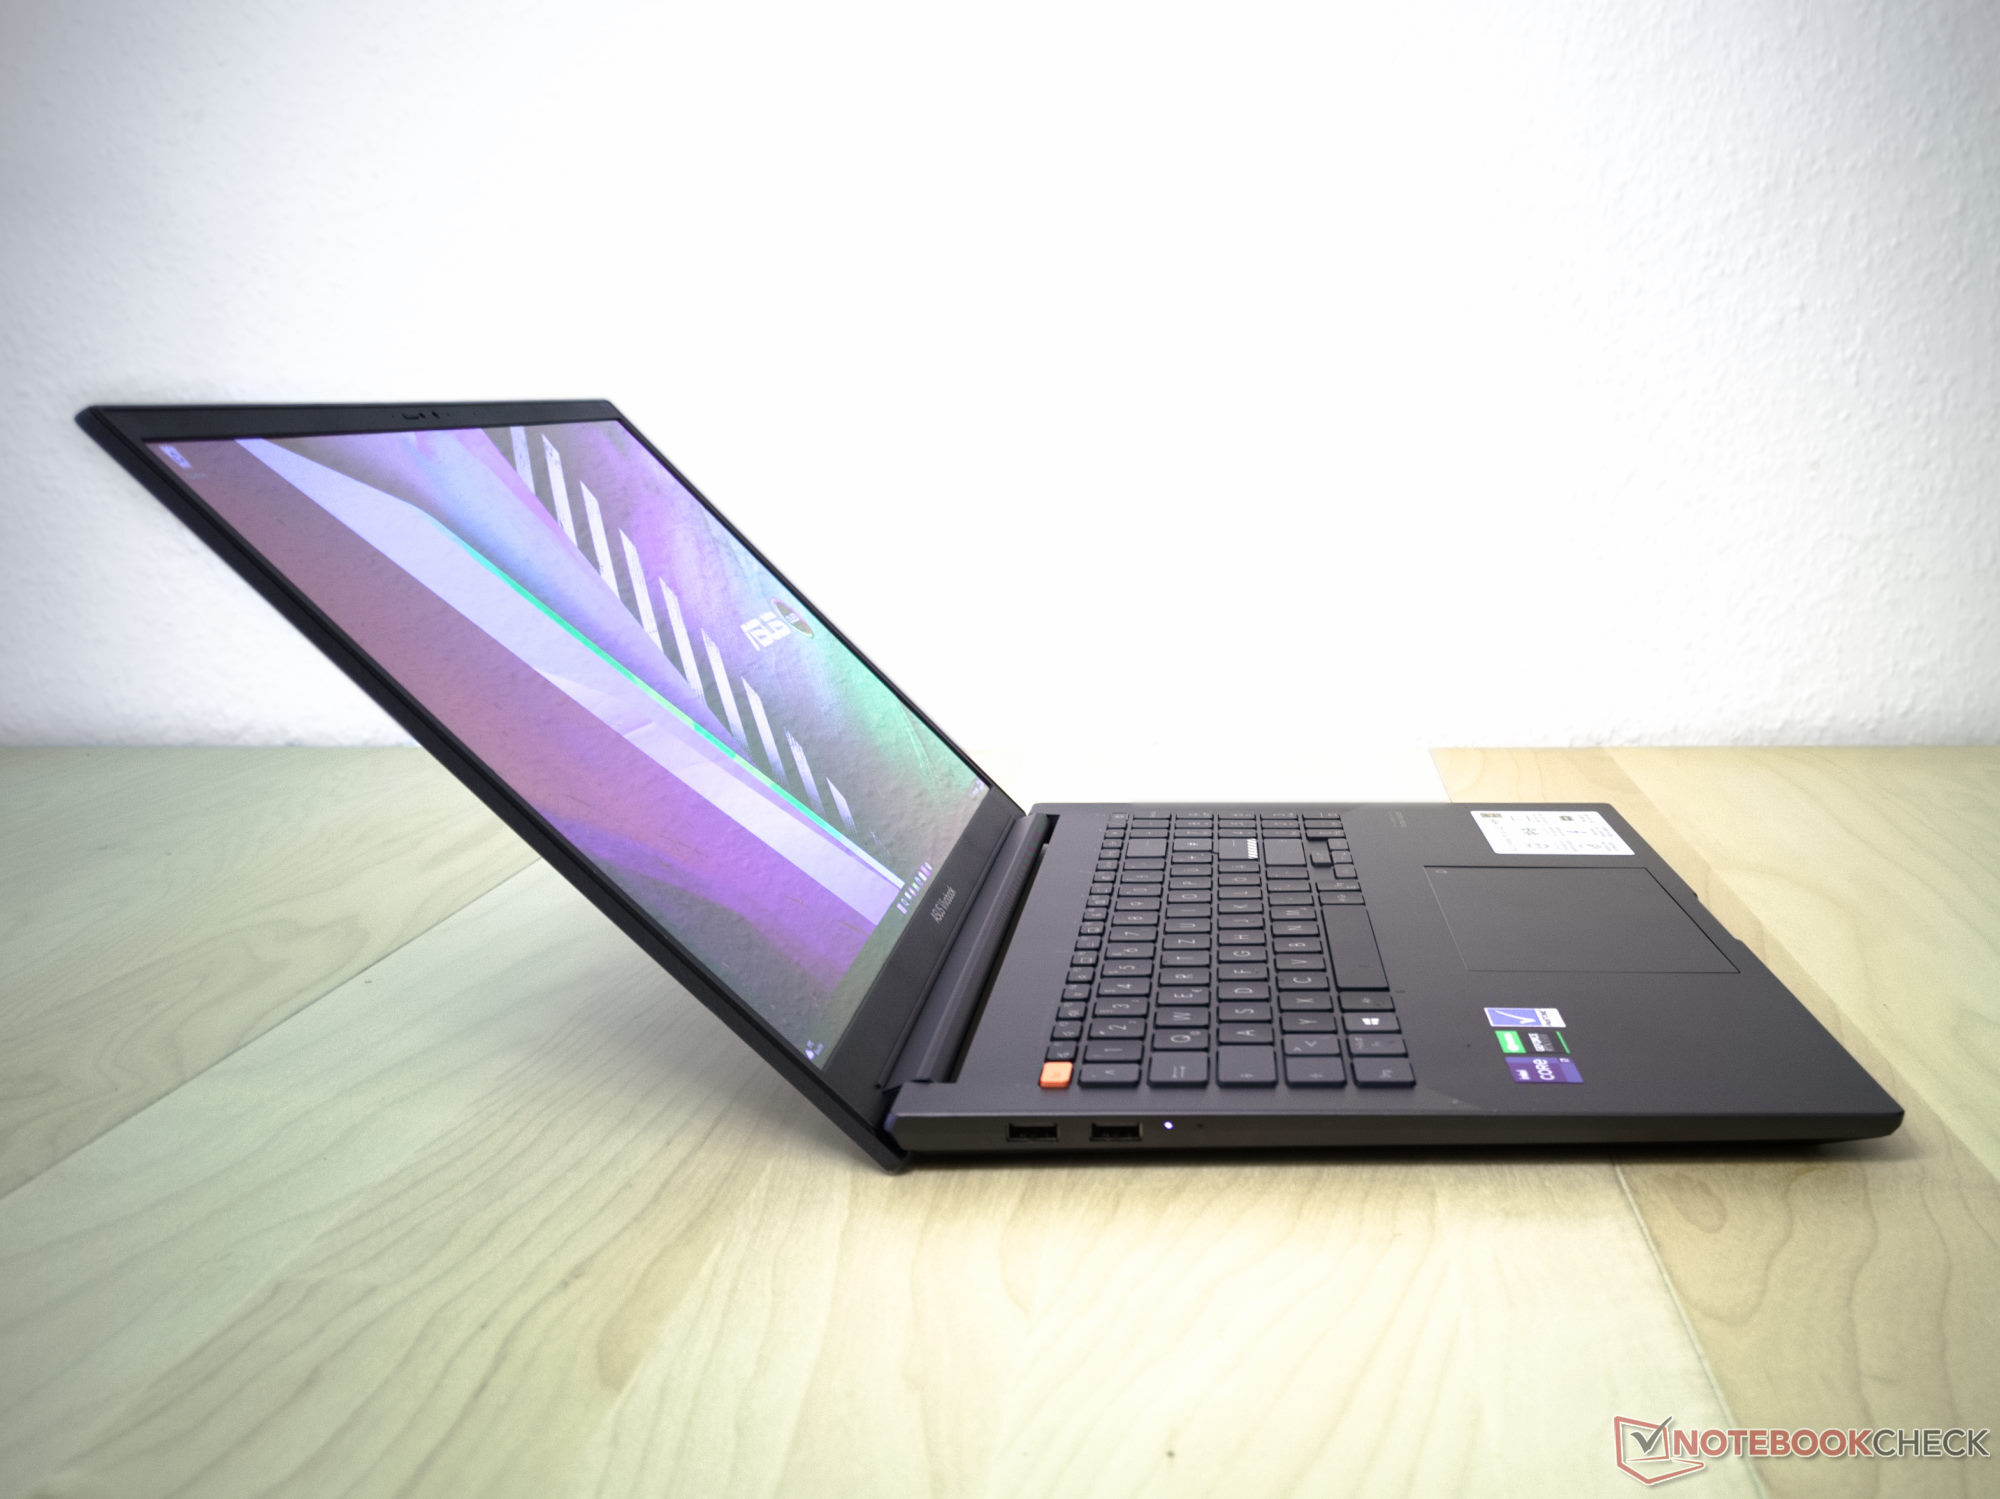
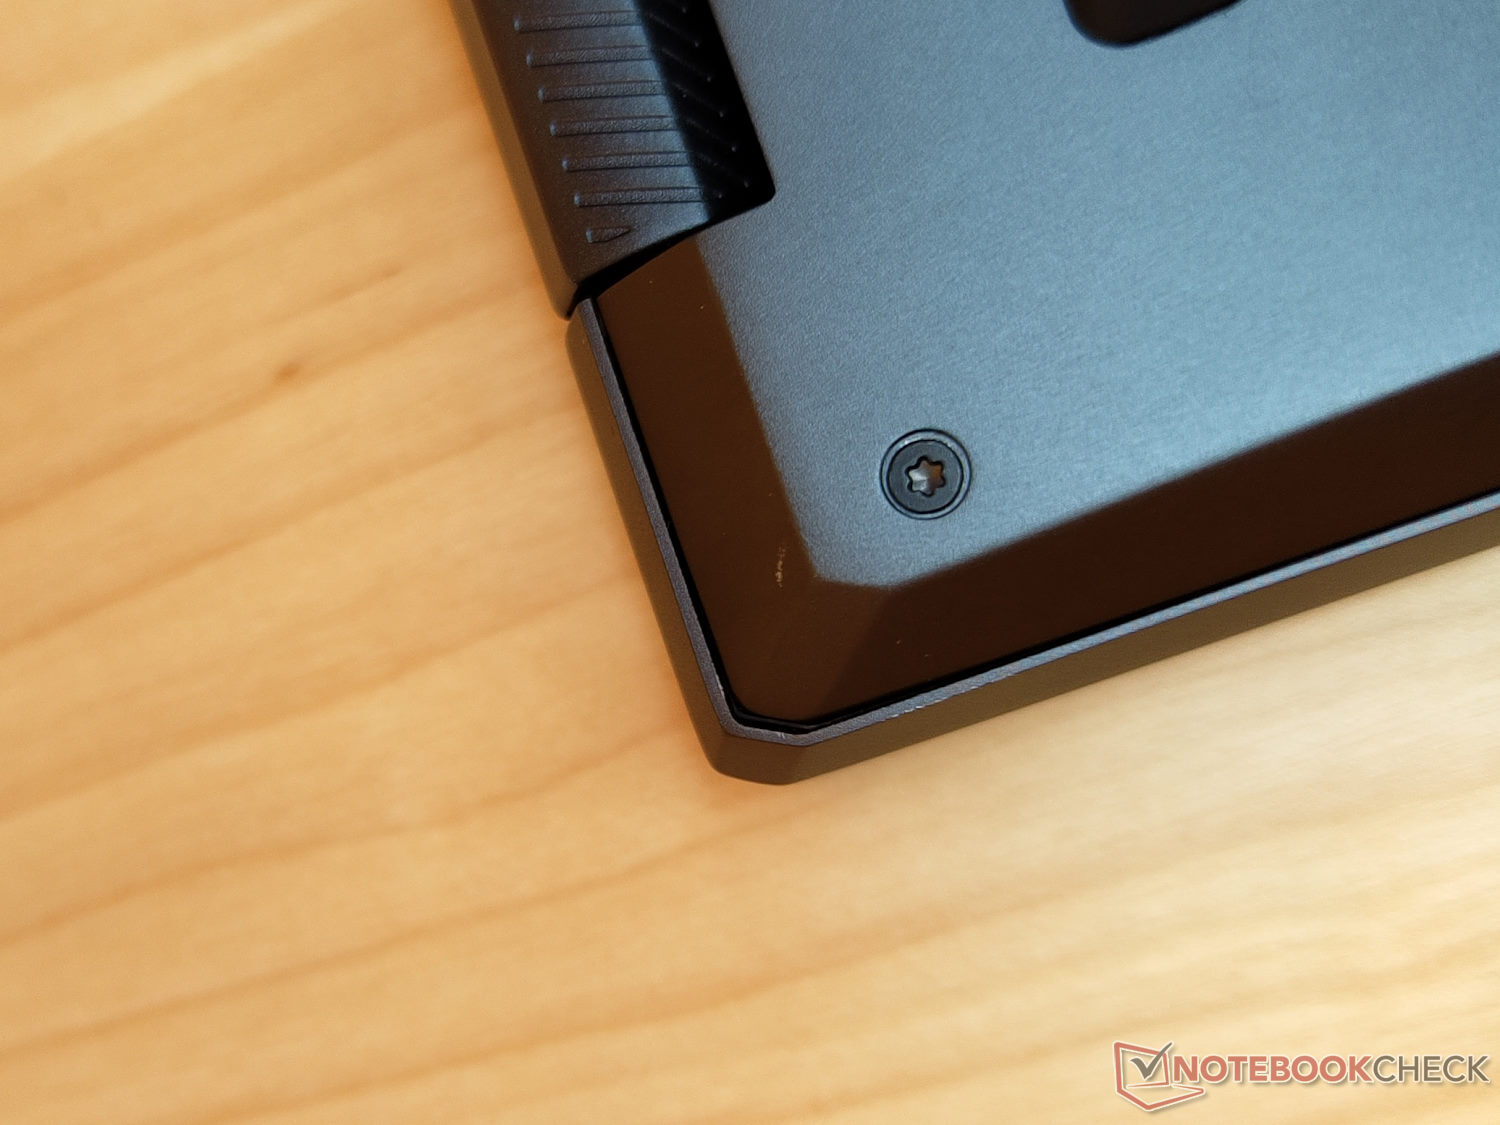
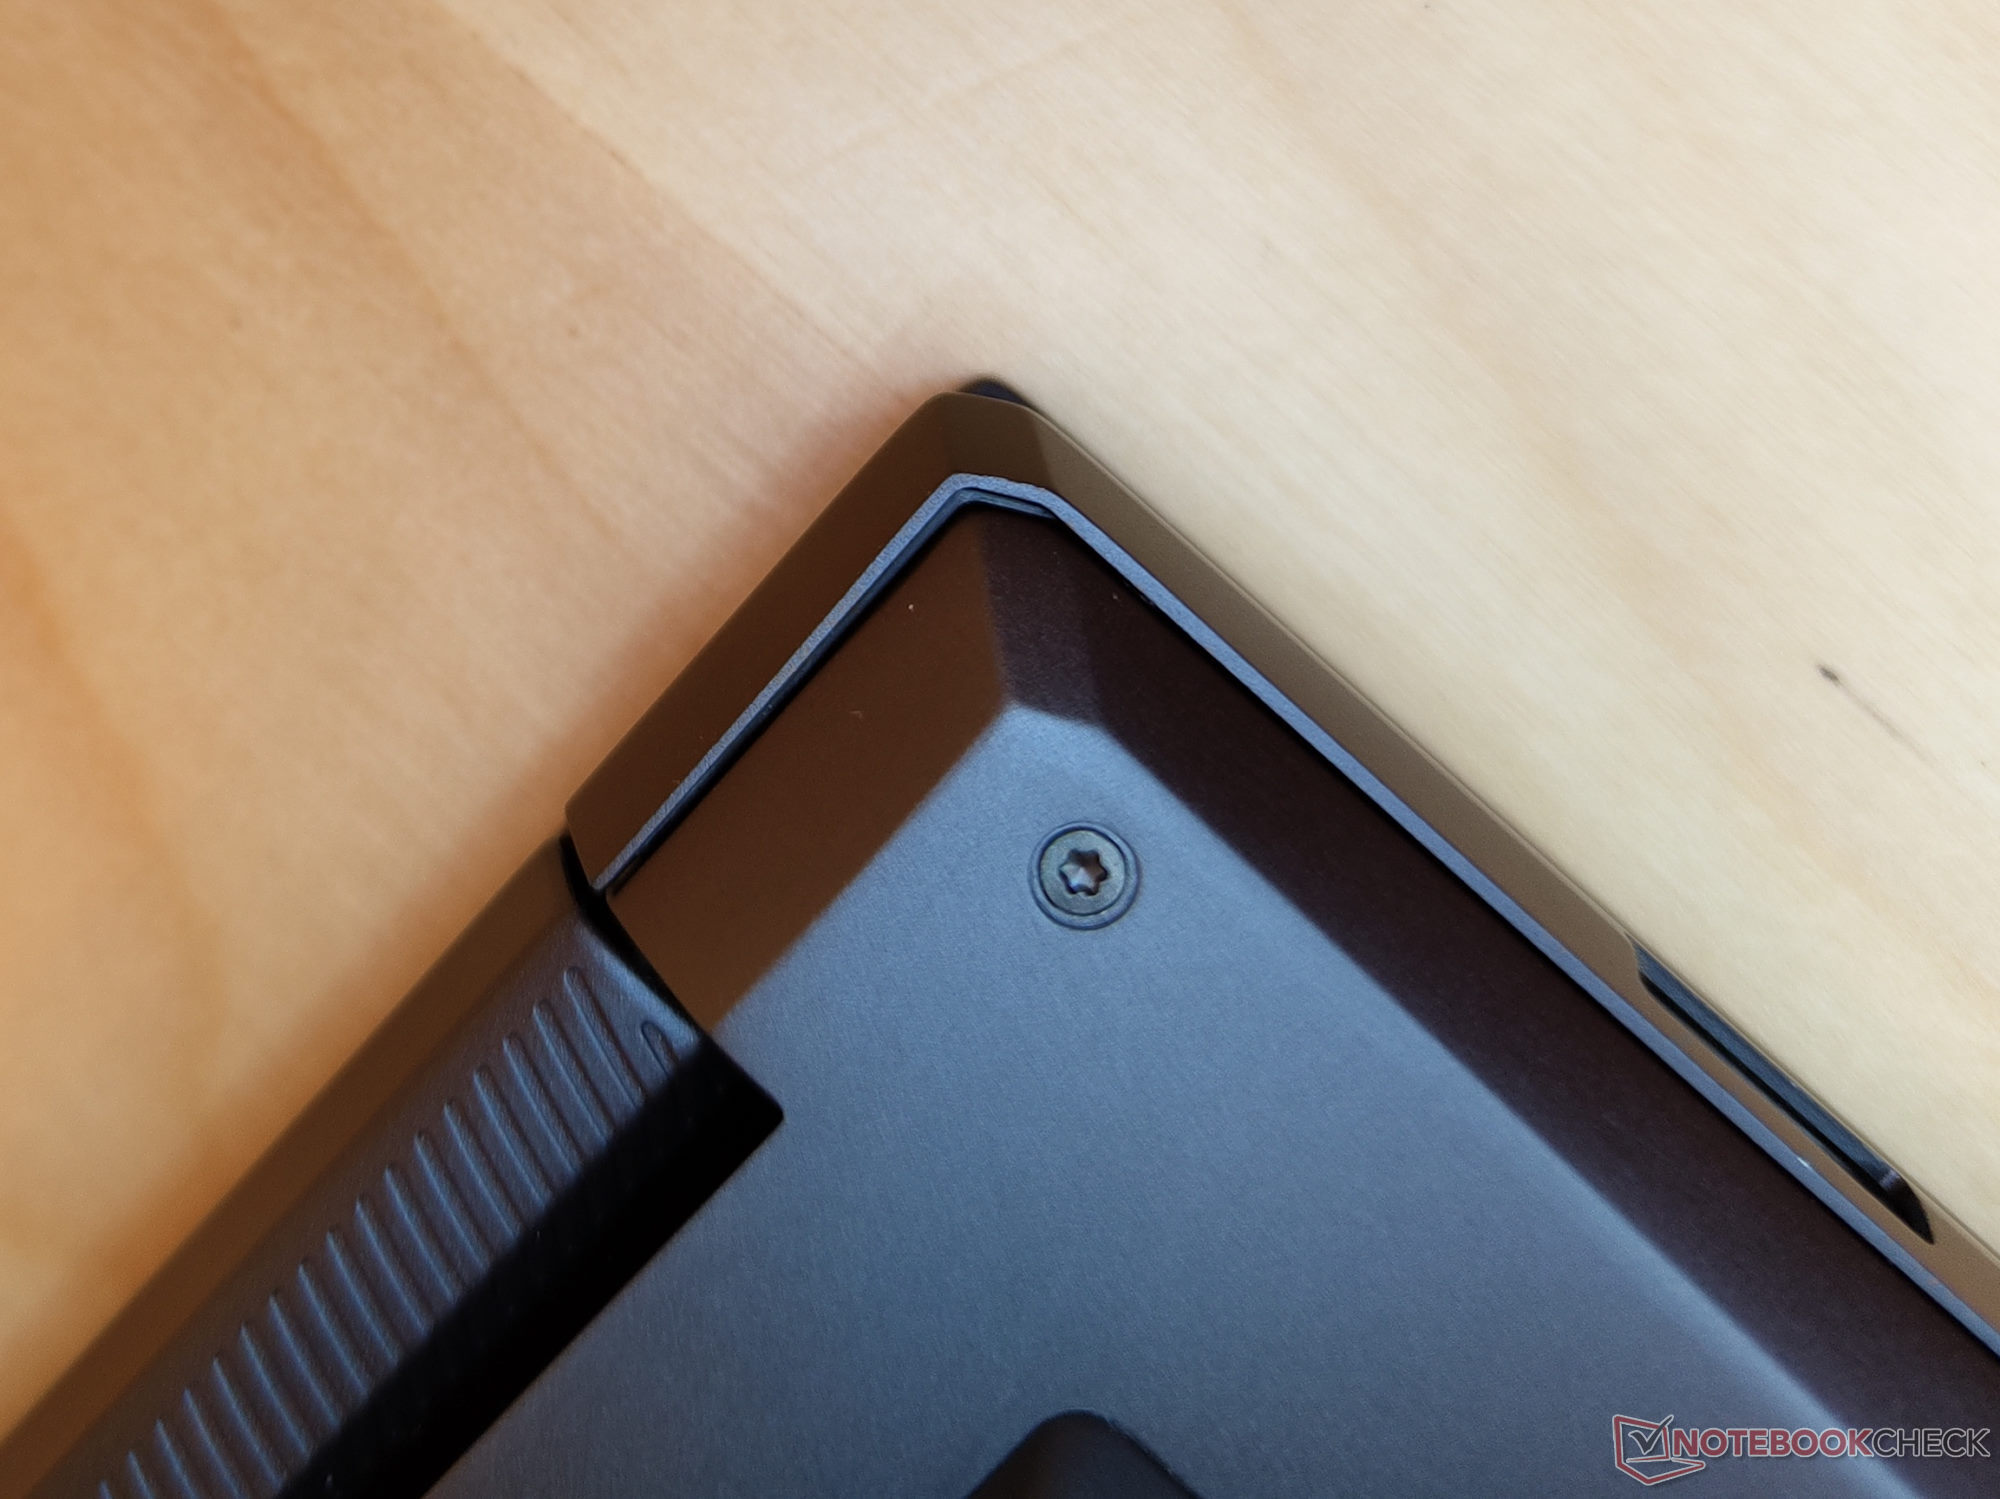
Styvheten hos 16-tumssystemet gynnas märkbart av den generösa användningen av metall. Vi kunde inte vrida den bärbara datorns basenhet på ett meningsfullt sätt från hörnen. Även om samma sak inte riktigt gäller för skärmen märkte vi åtminstone inte av något knarrande. Även om locket kan öppnas upp till en maximal vinkel på cirka 130 grader med en hand, finns det ingen större vinglighet. Tyvärr är inte spelrummen helt jämna på flera ställen. I det nedre vänstra hörnet av klickplattan finns en lucka som blottar fodralets inre delar. På samma sätt finns det flera ställen med ojämna clearances på undersidan. Vårt bildgalleri visar några exempel på de luckor vi hittade. Detta väcker frågan om de större mellanrummen är tänkta att kompensera större värmeutvidgning eller om tillverkningstoleranserna helt enkelt är för stora.
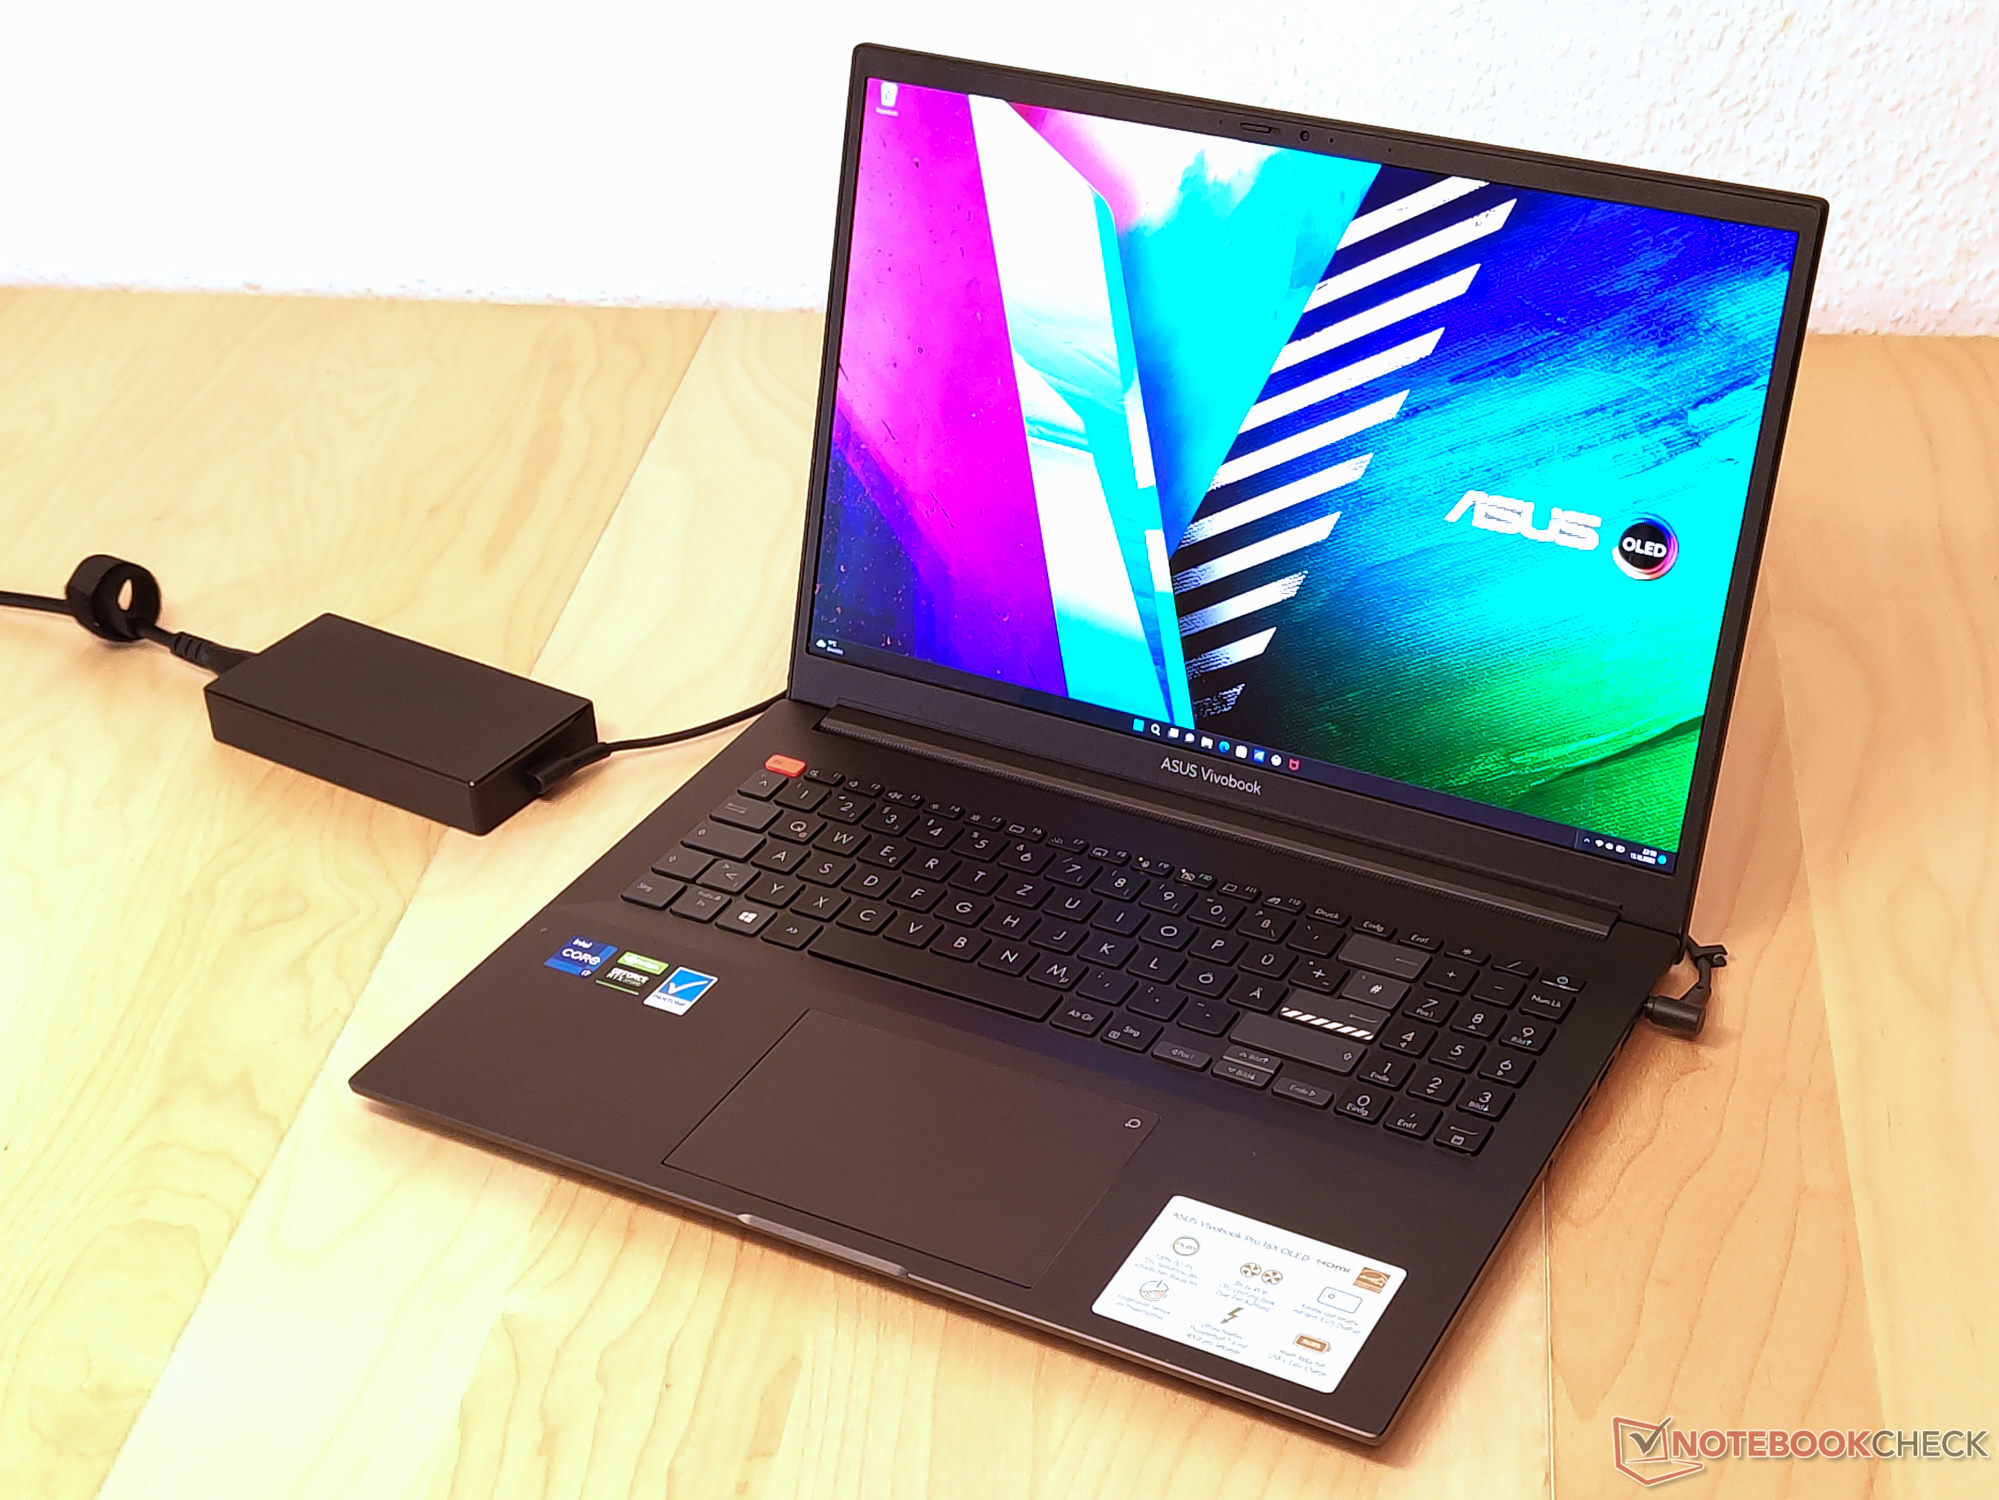
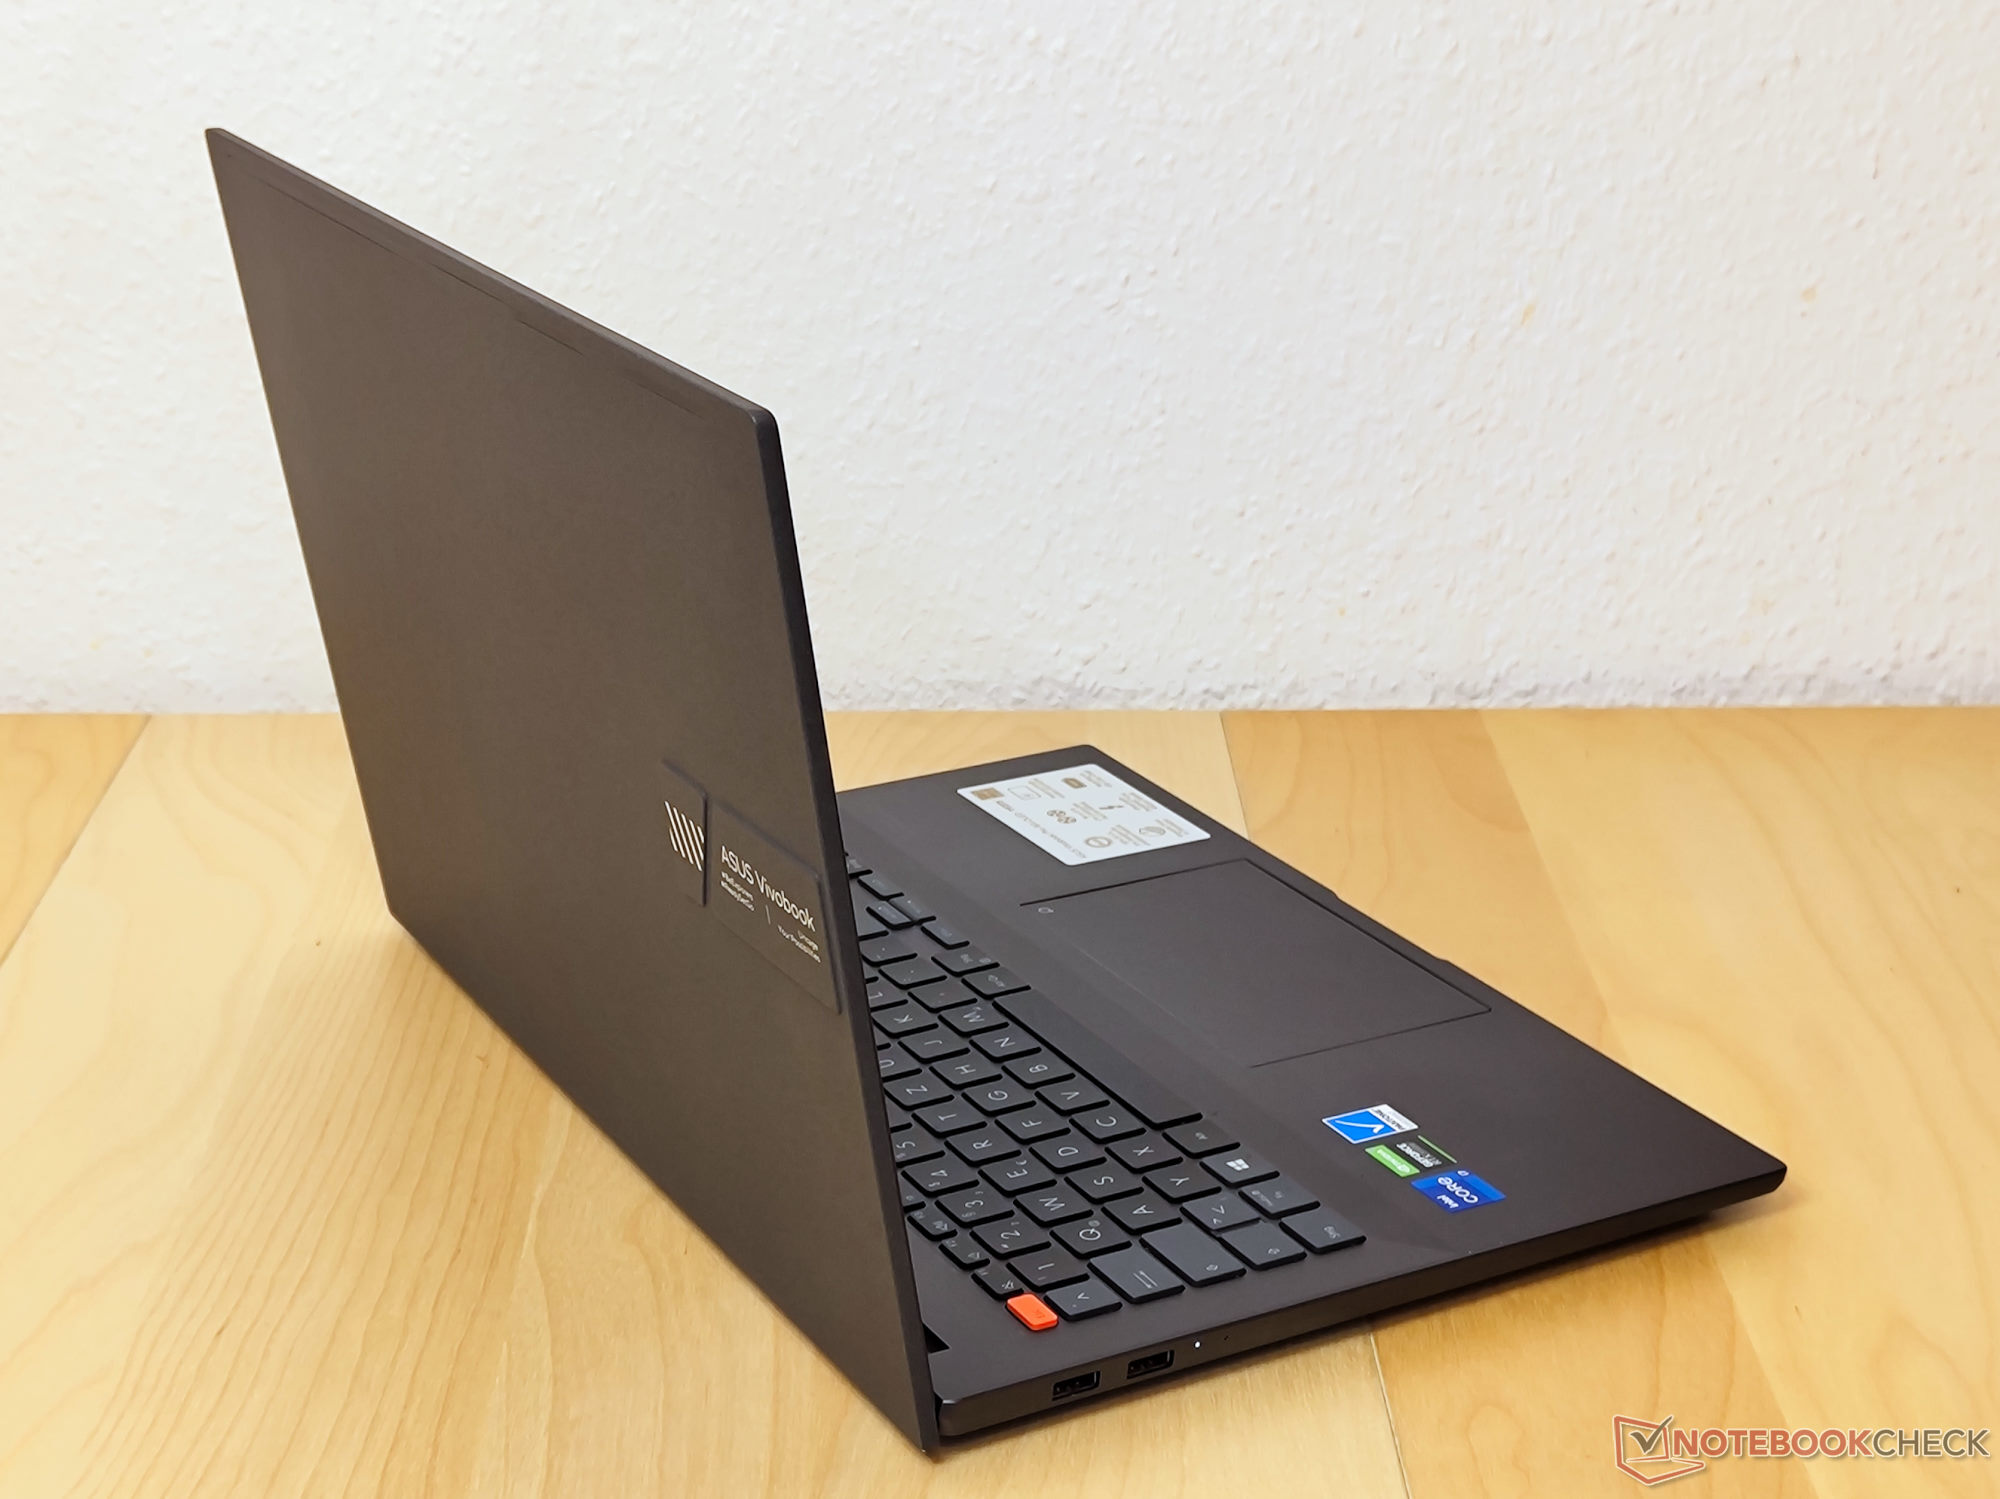
På grund av de ganska smala ramarna tenderar Vivobook 16X OLED att vara något mindre än andra bärbara 16-tumsdatorer trots att den är en 16-tums enhet. Dessutom är den ganska tunn när man tar hänsyn till den dedikerade GPU:n och den kraftfulla CPU:n. Däremot är vikten ganska hög. Med en vikt på 1969 g kan den knappast beskrivas som lätt. Kombinerat med de ytterligare 446 g (~0,98 lb) för nätadaptern och dess kabel kommer Vivobook 16X in på 2,4 kg (~5,29 lb) totalt.
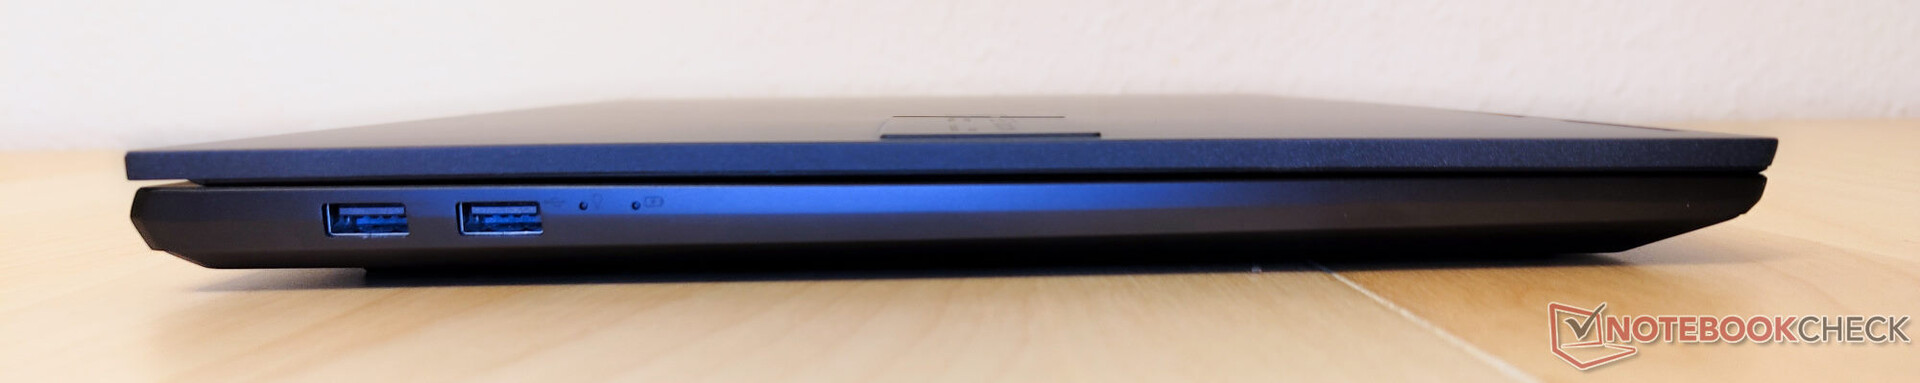
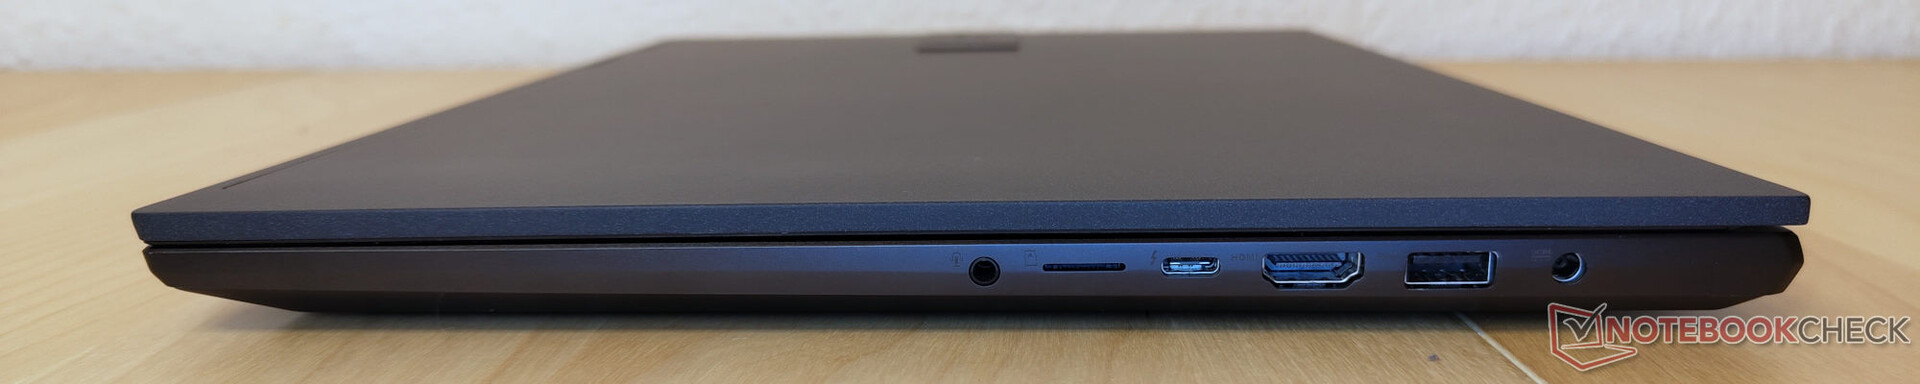
Anslutningsmöjligheter - USB-C med Thunderbolt 4 till höger, USB 2.0 till vänster
Tack vare USB typ-C med Thunderbolt 4 och Power Delivery samt 3x USB typ-A och HDMI 2.1 får användarna stor flexibilitet när det gäller tillbehör. Detta gör den långsamma microSD-kortläsaren till ett rent av oturligt val. För en enhet som riktar sig till innehållsskapare hade en fullstor SD-kortläsare med anständiga överföringshastigheter kunnat passa bättre. De två USB typ-A-portarna till vänster har endast stöd för USB 2.0. De flesta av de användbara portarna finns till höger. För högerhänta användare som vill använda en extern mus kan detta vara en liten olägenhet.
SD-kortläsare
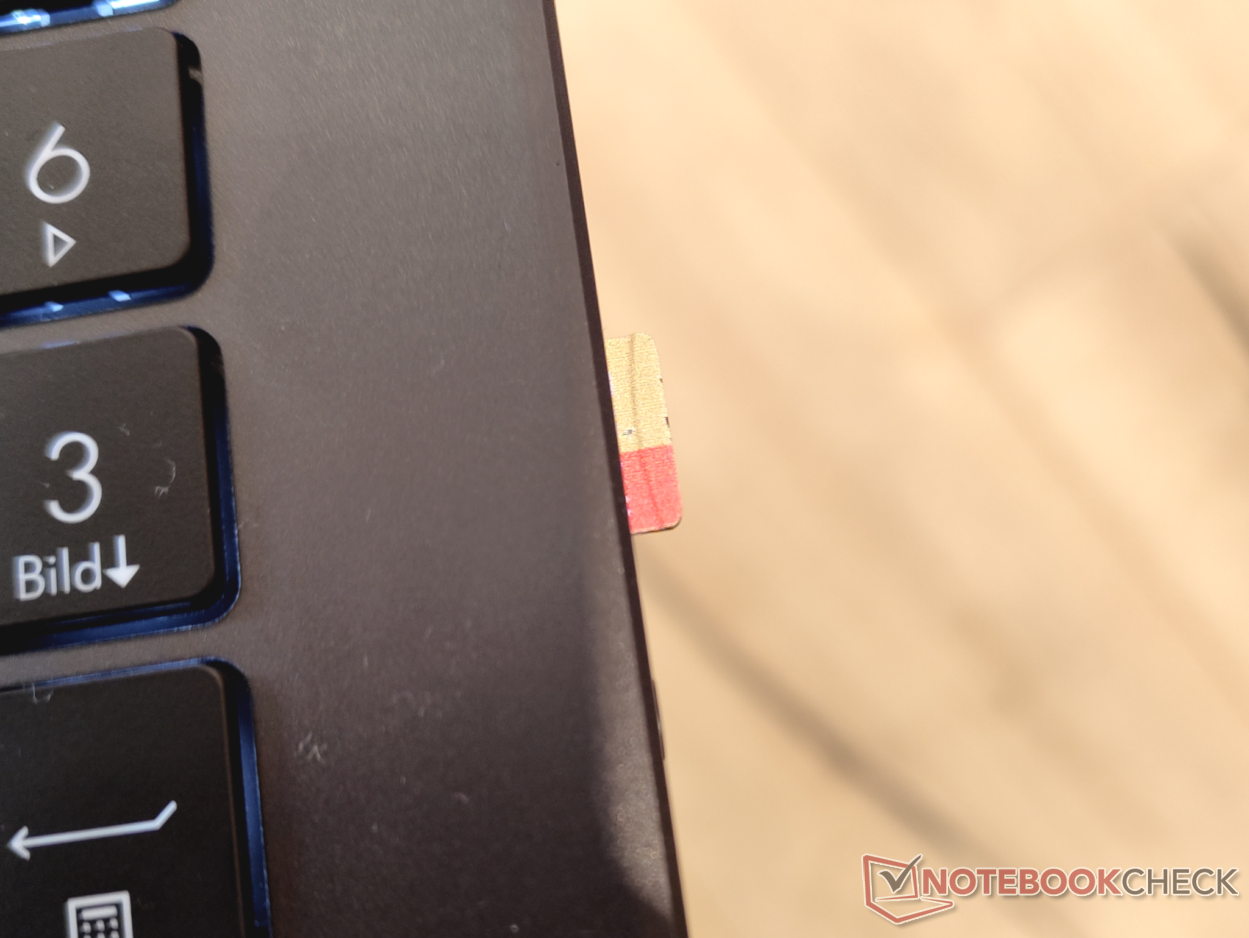
SD-kortläsaren är inte en av Vivobookens styrkor. Eftersom den endast är ansluten via USB 2.0 kan den inte nå bra hastigheter ens med vårt referenskort AV PRO microSD 128 GB V60. Det faktum att inte ens microSD-kort kan sättas in fullt ut är också en viss besvikelse.
| SD Card Reader | |
| average JPG Copy Test (av. of 3 runs) | |
| MSI Summit E16 Flip A12UDT-031 (AV Pro SD microSD 128 GB V60) | |
| Lenovo ThinkPad X1 Extreme G4-20Y5CTO1WW (3050 Ti) (AV Pro V60) | |
| Genomsnitt av klass Multimedia (23 - 531, n=43, senaste 2 åren) | |
| Schenker XMG Focus 15 (AV PRO microSD 128 GB V60) | |
| Asus VivoBook Pro 16X OLED N7600PC-L2026X | |
| Dell Inspiron 16 Plus 7610 (AV PRO microSD 128 GB V60) | |
| maximum AS SSD Seq Read Test (1GB) | |
| Genomsnitt av klass Multimedia (27.9 - 1455, n=42, senaste 2 åren) | |
| Lenovo ThinkPad X1 Extreme G4-20Y5CTO1WW (3050 Ti) (AV Pro V60) | |
| MSI Summit E16 Flip A12UDT-031 (AV Pro SD microSD 128 GB V60) | |
| Schenker XMG Focus 15 (AV PRO microSD 128 GB V60) | |
| Asus VivoBook Pro 16X OLED N7600PC-L2026X | |
| Dell Inspiron 16 Plus 7610 (AV PRO microSD 128 GB V60) | |
Kommunikation
Ett metallchassi försvårar ofta placeringen av Wi-Fi-antennerna för tillverkaren. Detta verkar också vara fallet på Asus Vivobook 16X, eftersom cirka 700 Mb/s för upp- och nedladdning är under vad vi förväntar oss av Wi-Fi 6 och även undermåligt i vår jämförelse.
Webbkamera
Asus använder en webbkamera på 0,9 MP, vilket är ett vanligt val för bärbara datorer för konsumenter. Tyvärr är dess kvalitet lika dålig. Eftersom Lenovo Thinkbook 14 G4 och 15 G4 har visat nyligen finns det utrymme för förbättringar.


")
")
Säkerhet
En fingeravtryckssensor är integrerad i strömknappen. Andra säkerhetsfunktioner är begränsade till Intel Core i7:s TPM 2.0 och andra mjukvarulösningar.
Tillbehör
Paketet med Vivobook 16X OLED innehåller bara det nödvändigaste. Växelströmsadaptern, pappersarbetet och den bärbara datorn är förpackade med små mängder plast.
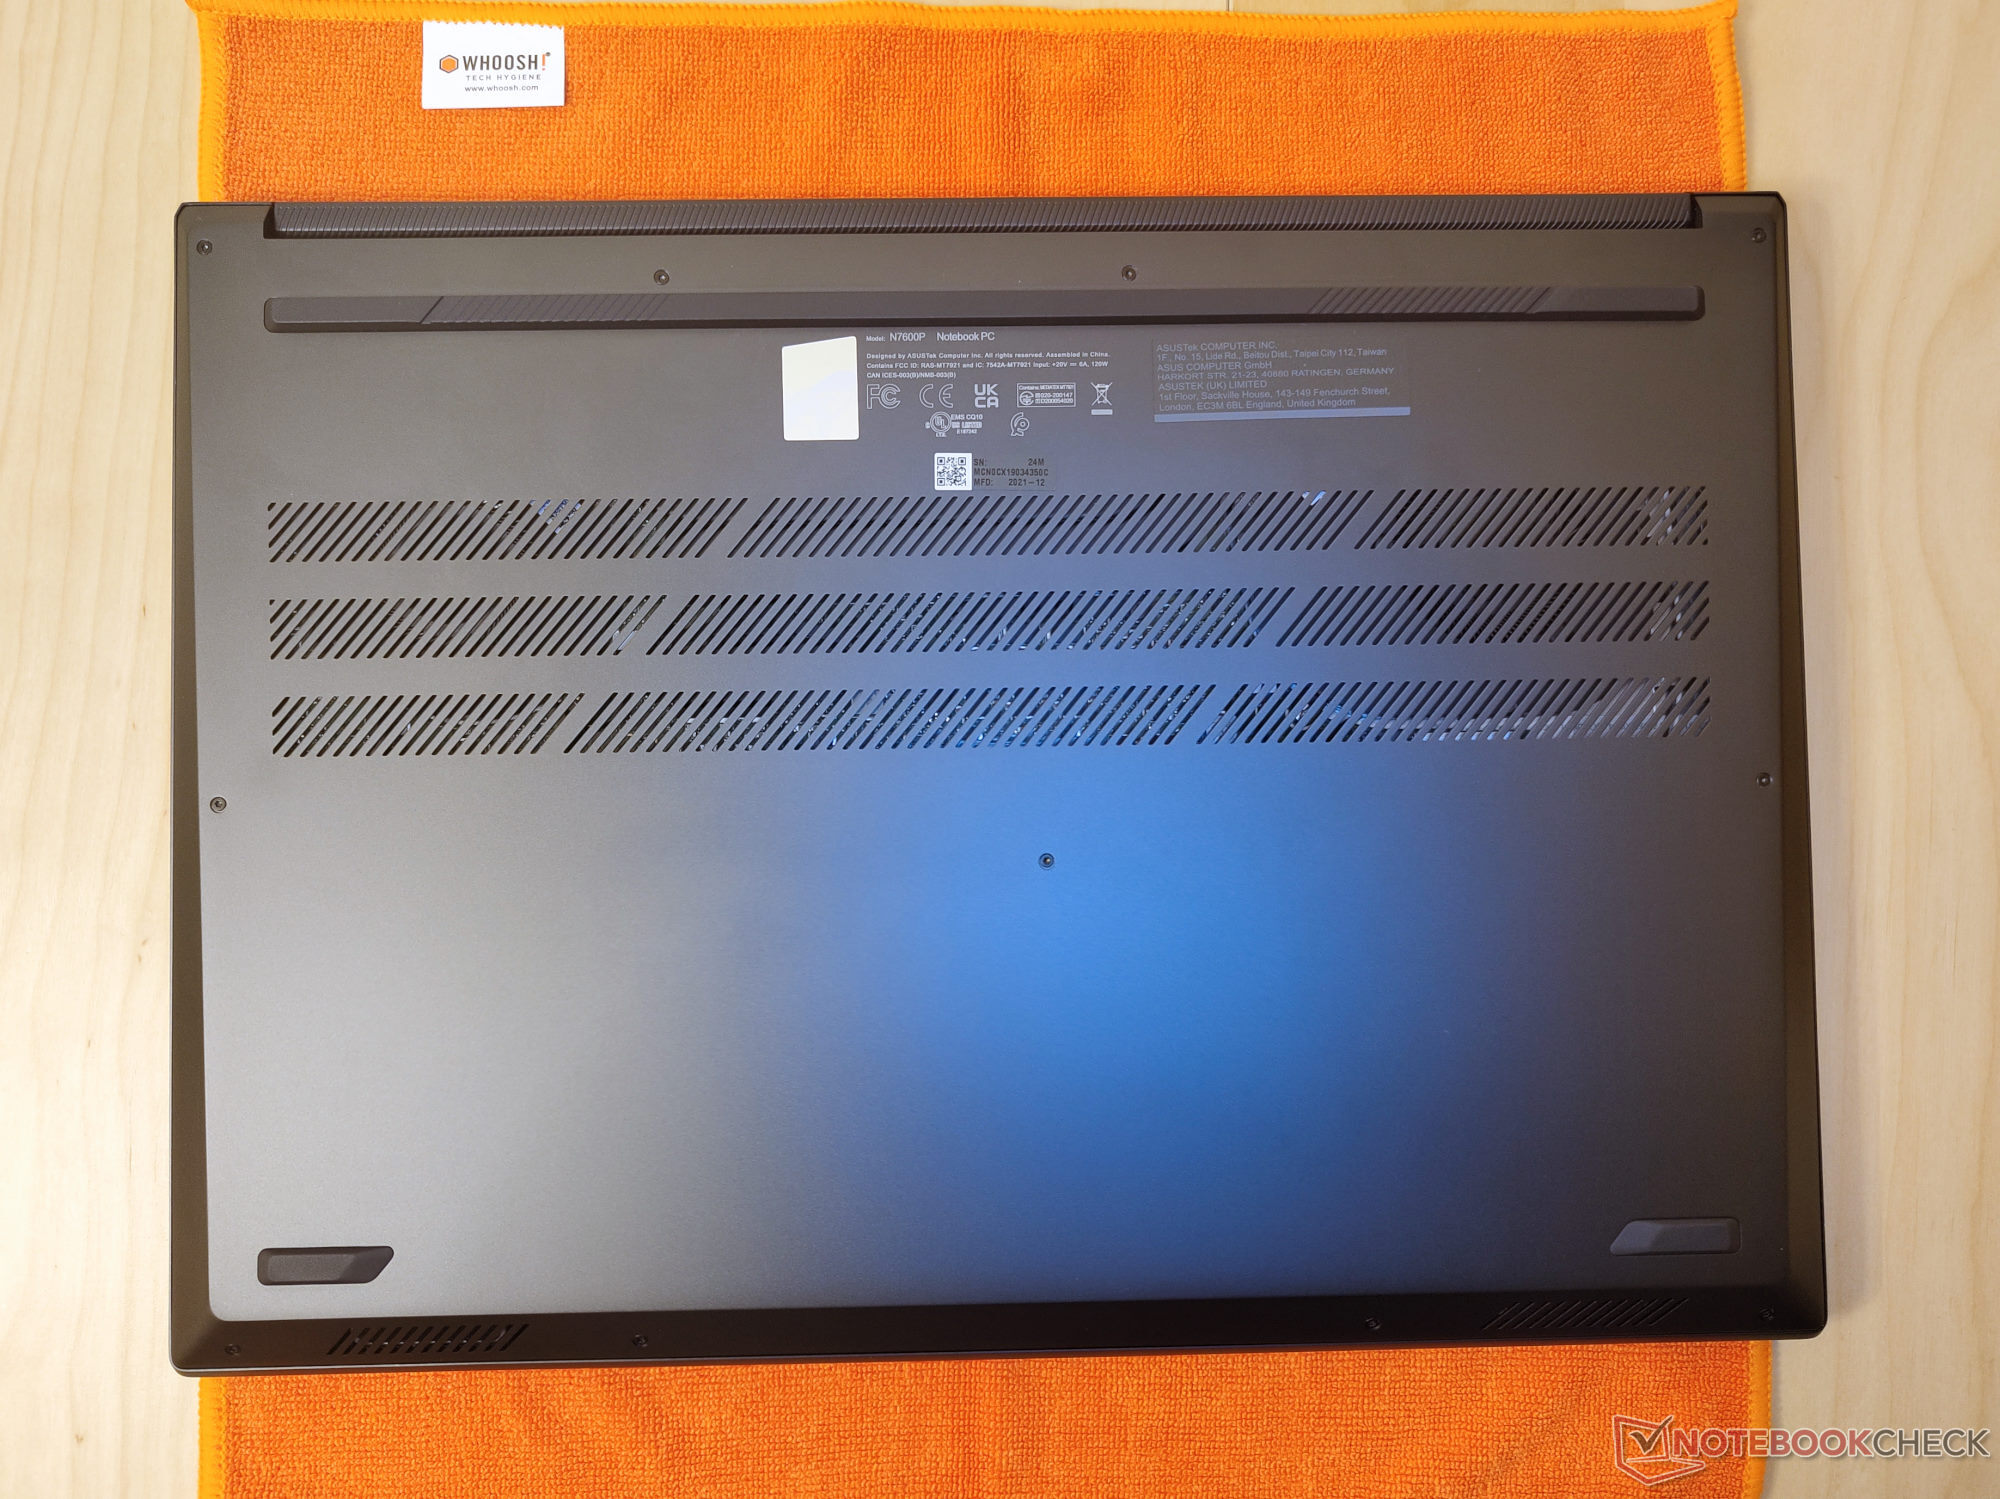
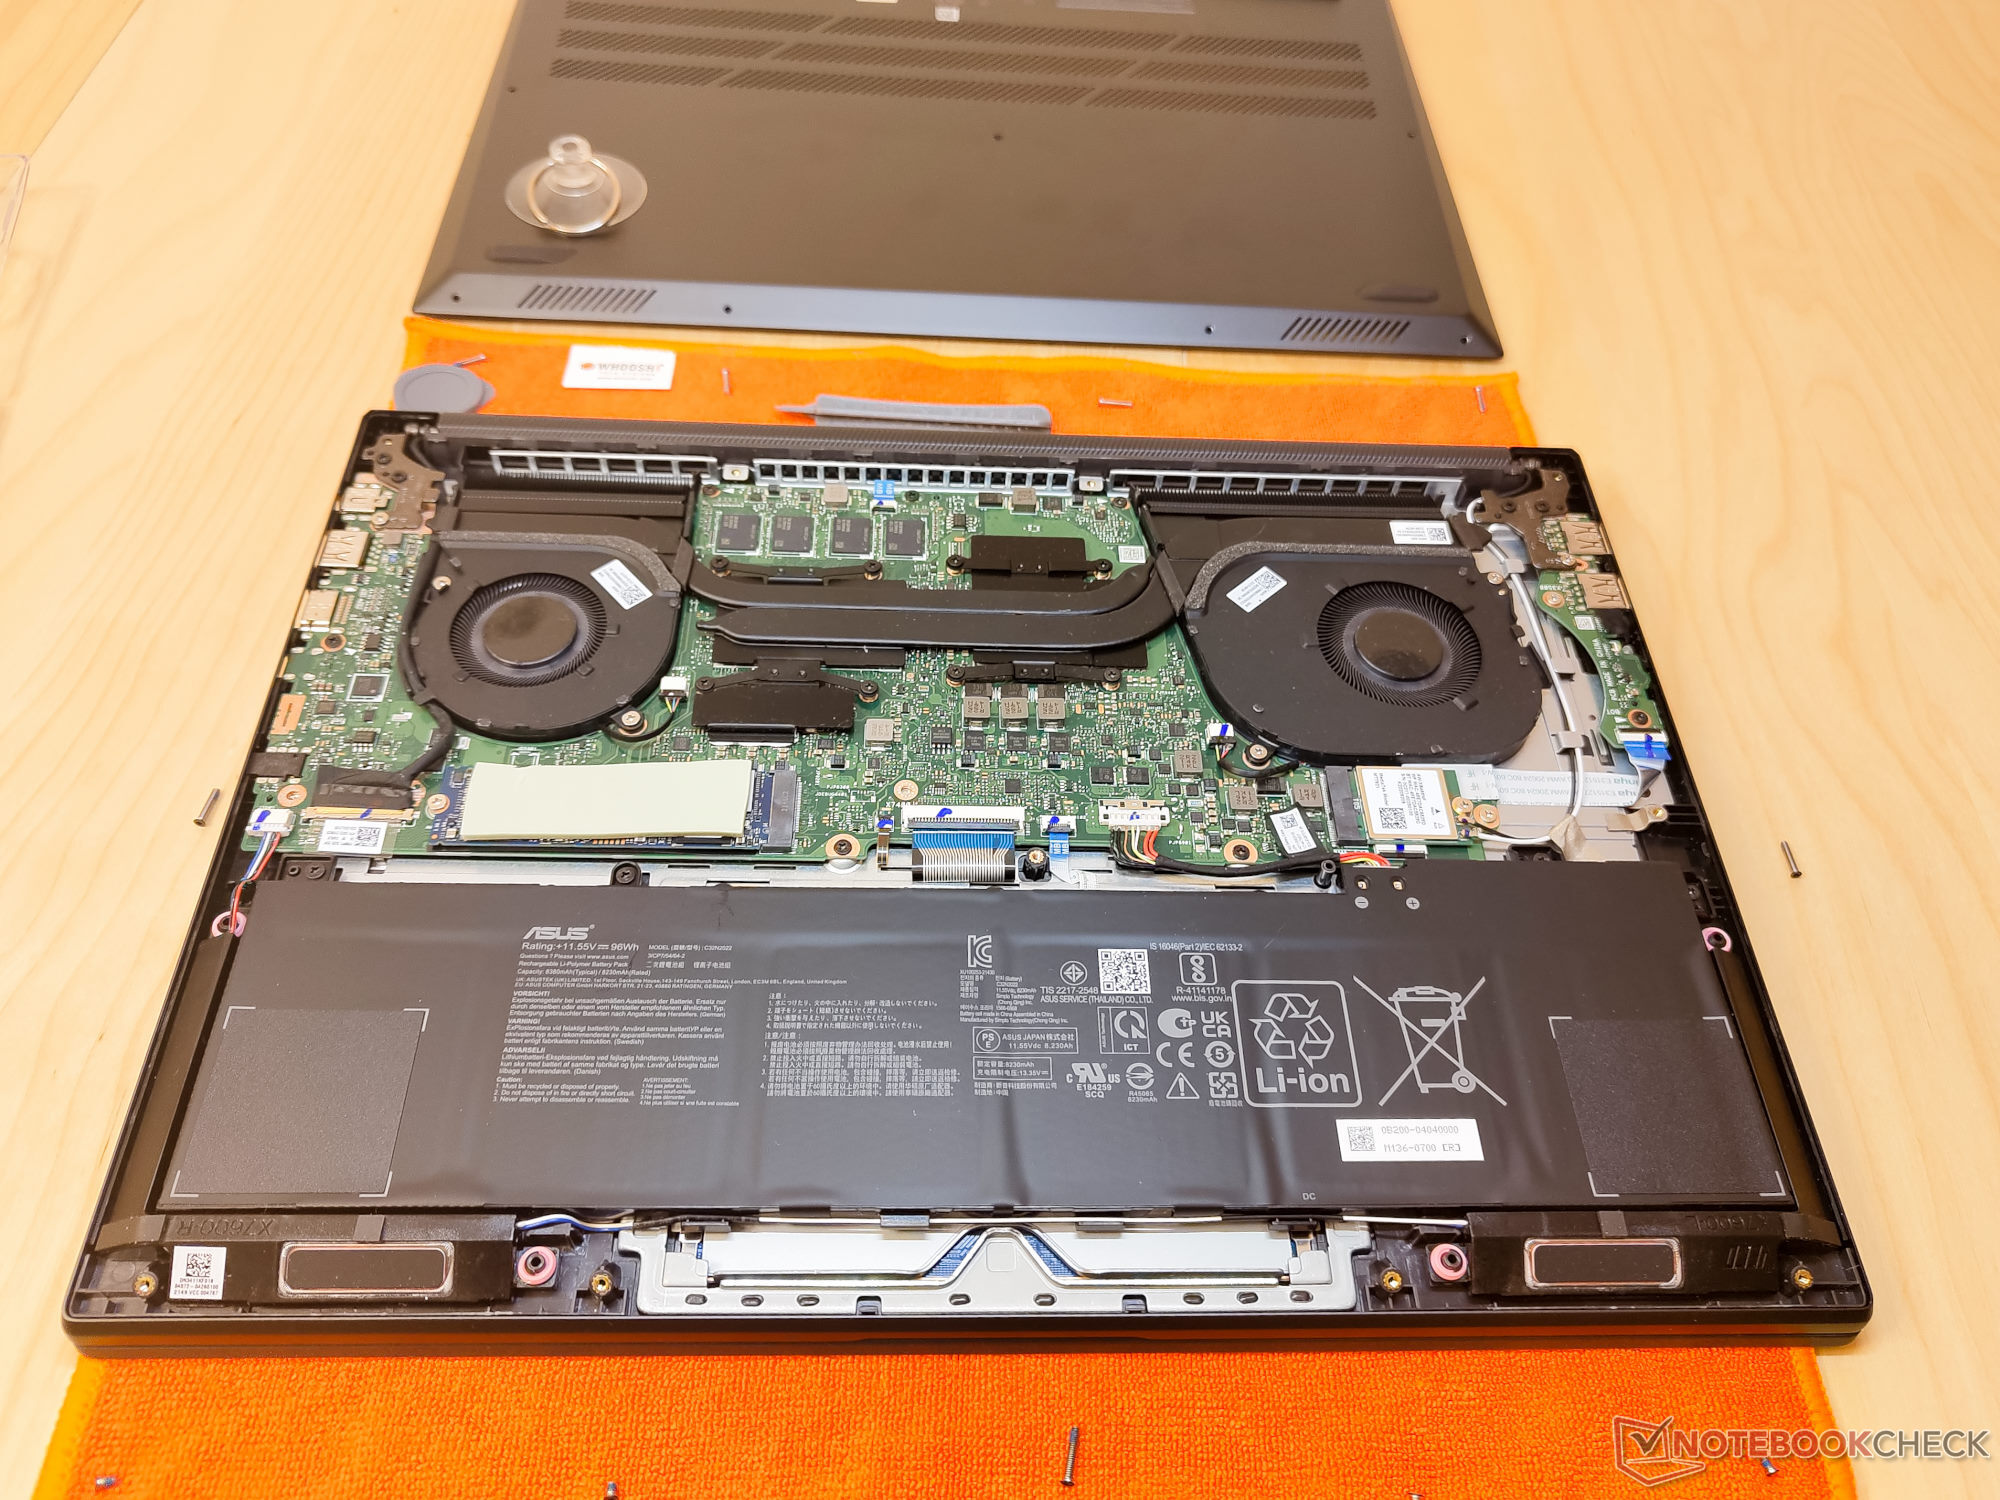
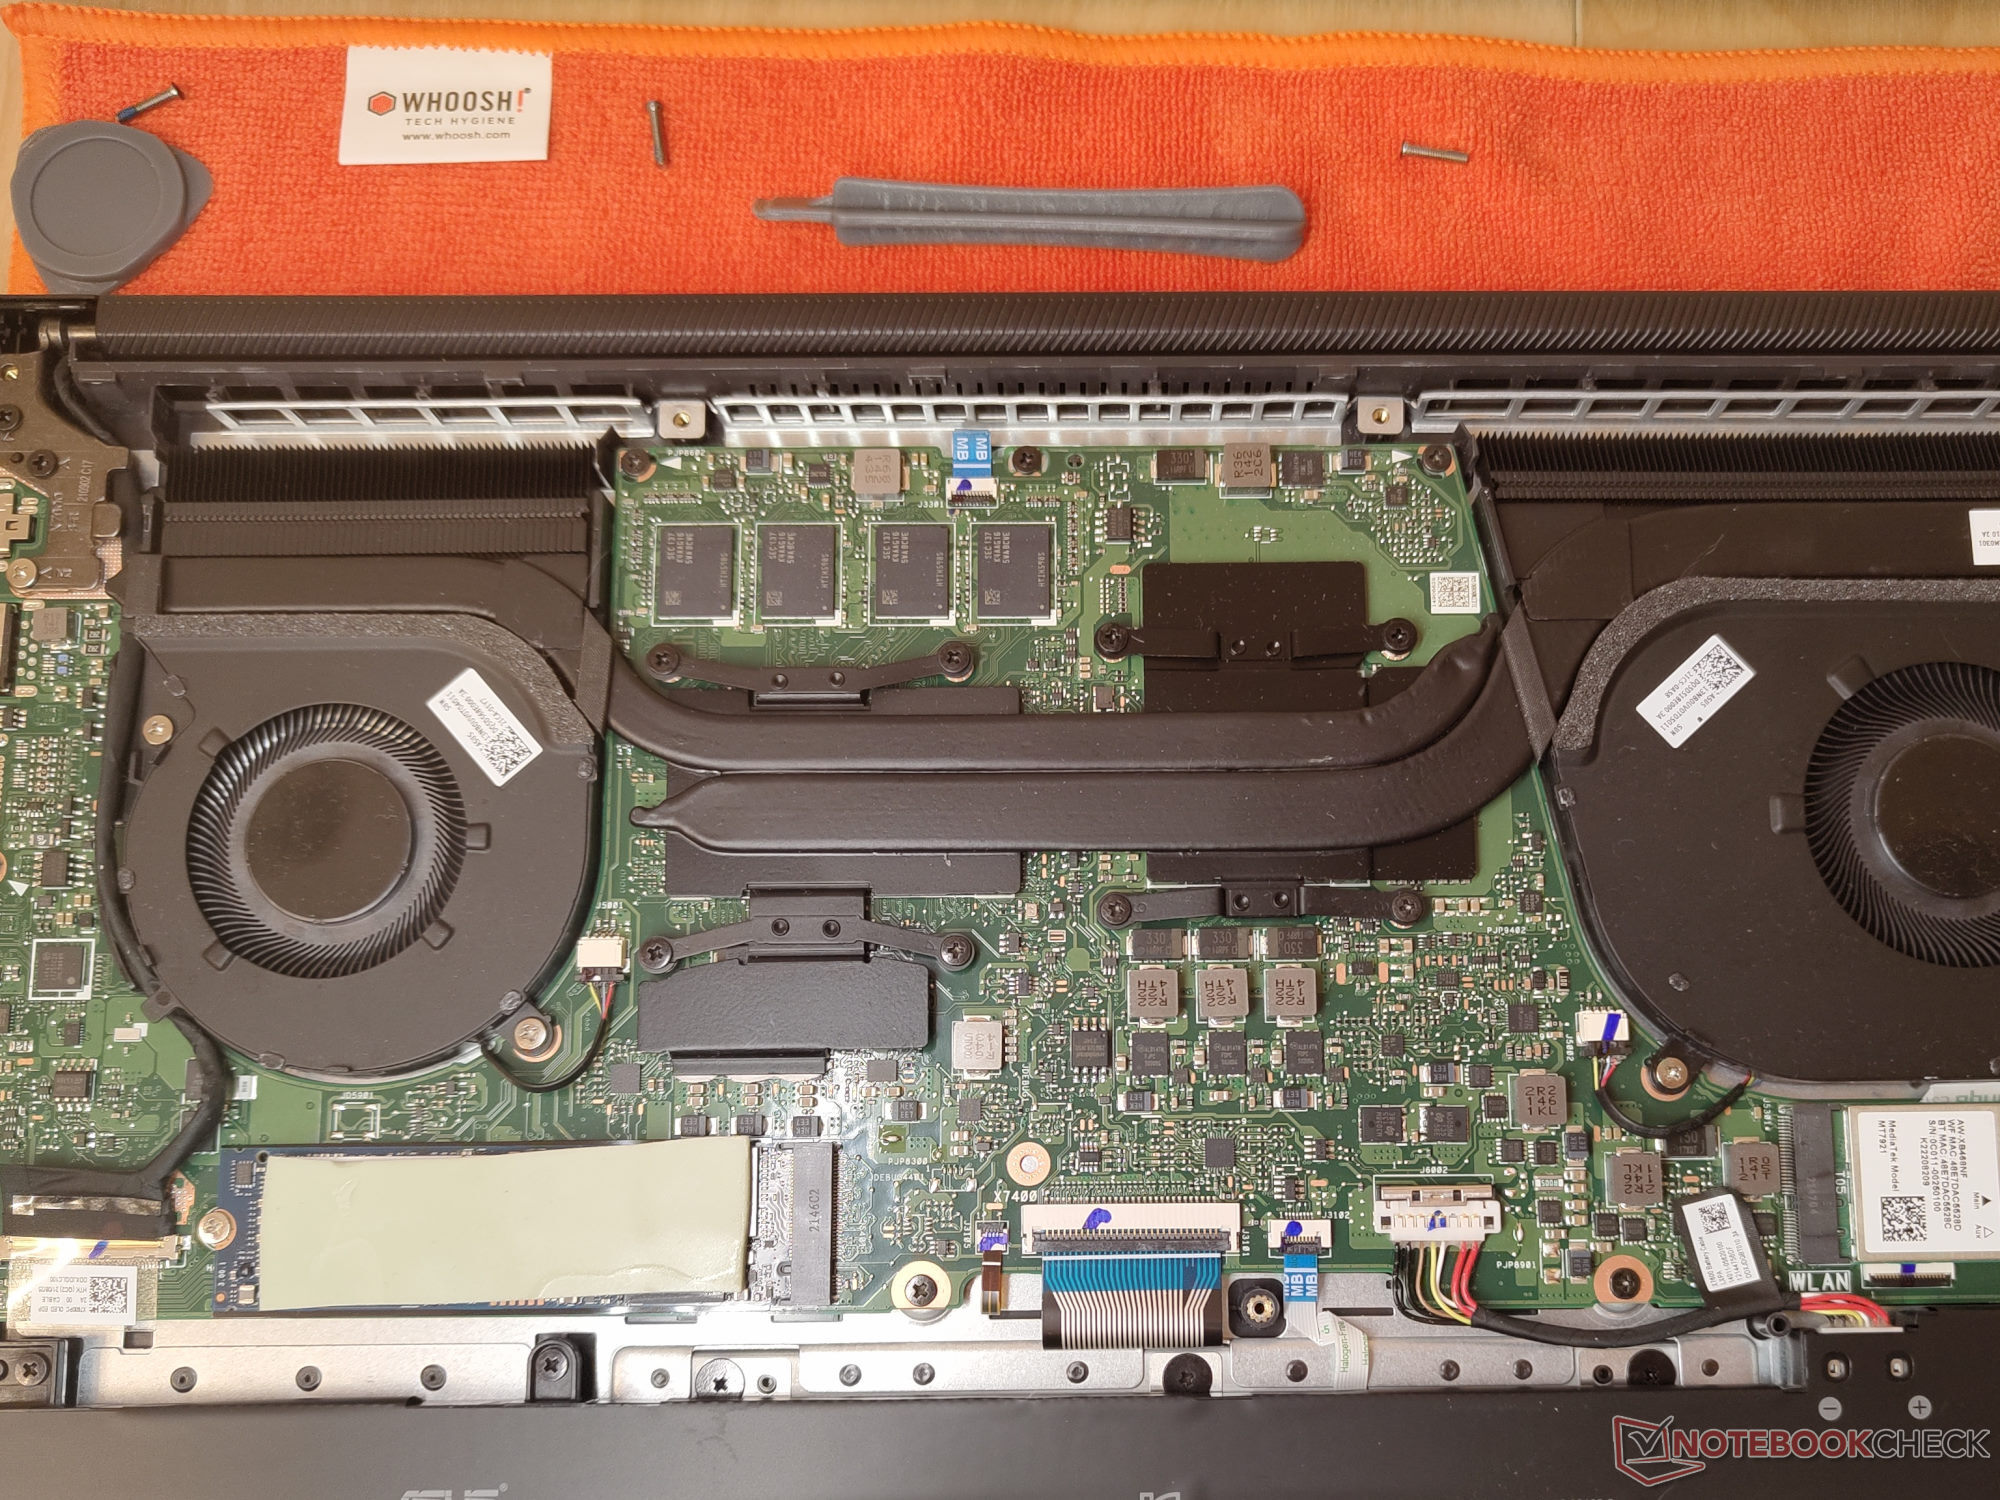
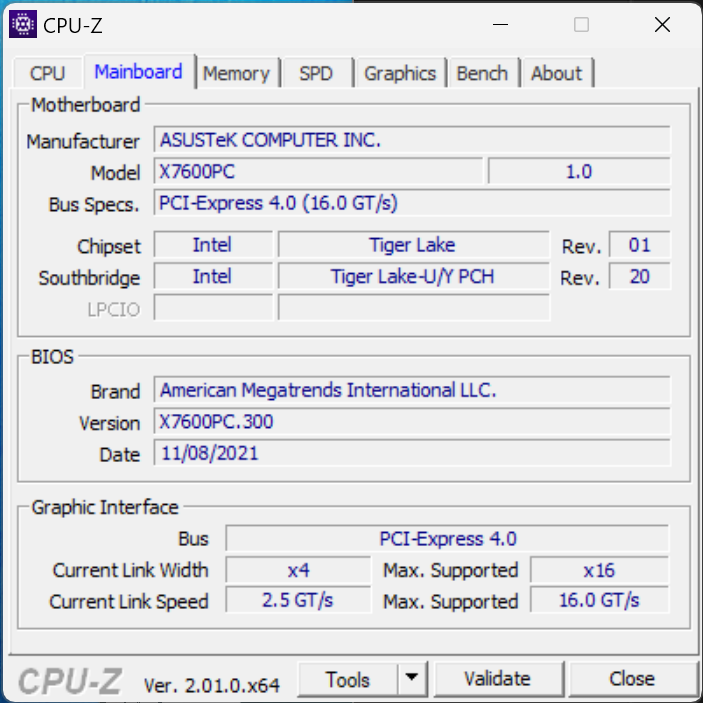
Underhåll
Basenheten fästs med 11 TX5-skruvar. Efter att ha lossat dem kan bottendelen fortfarande inte lätt tas bort. Här rekommenderar vi en sugkopp och en plastspade för att försiktigt lossa locket. 16 GB RAM-minne är fastlödda på moderkortet och kan därför inte uppgraderas. Lätta uppgraderingar är istället begränsade till wifi-modulen och M.2 SSD:n. Det finns inga andra uppgraderbara delar på Vivobook.
Garanti
Vivobook Pro 16X levereras med en begränsad standardgaranti på ett år när den köps i USA.
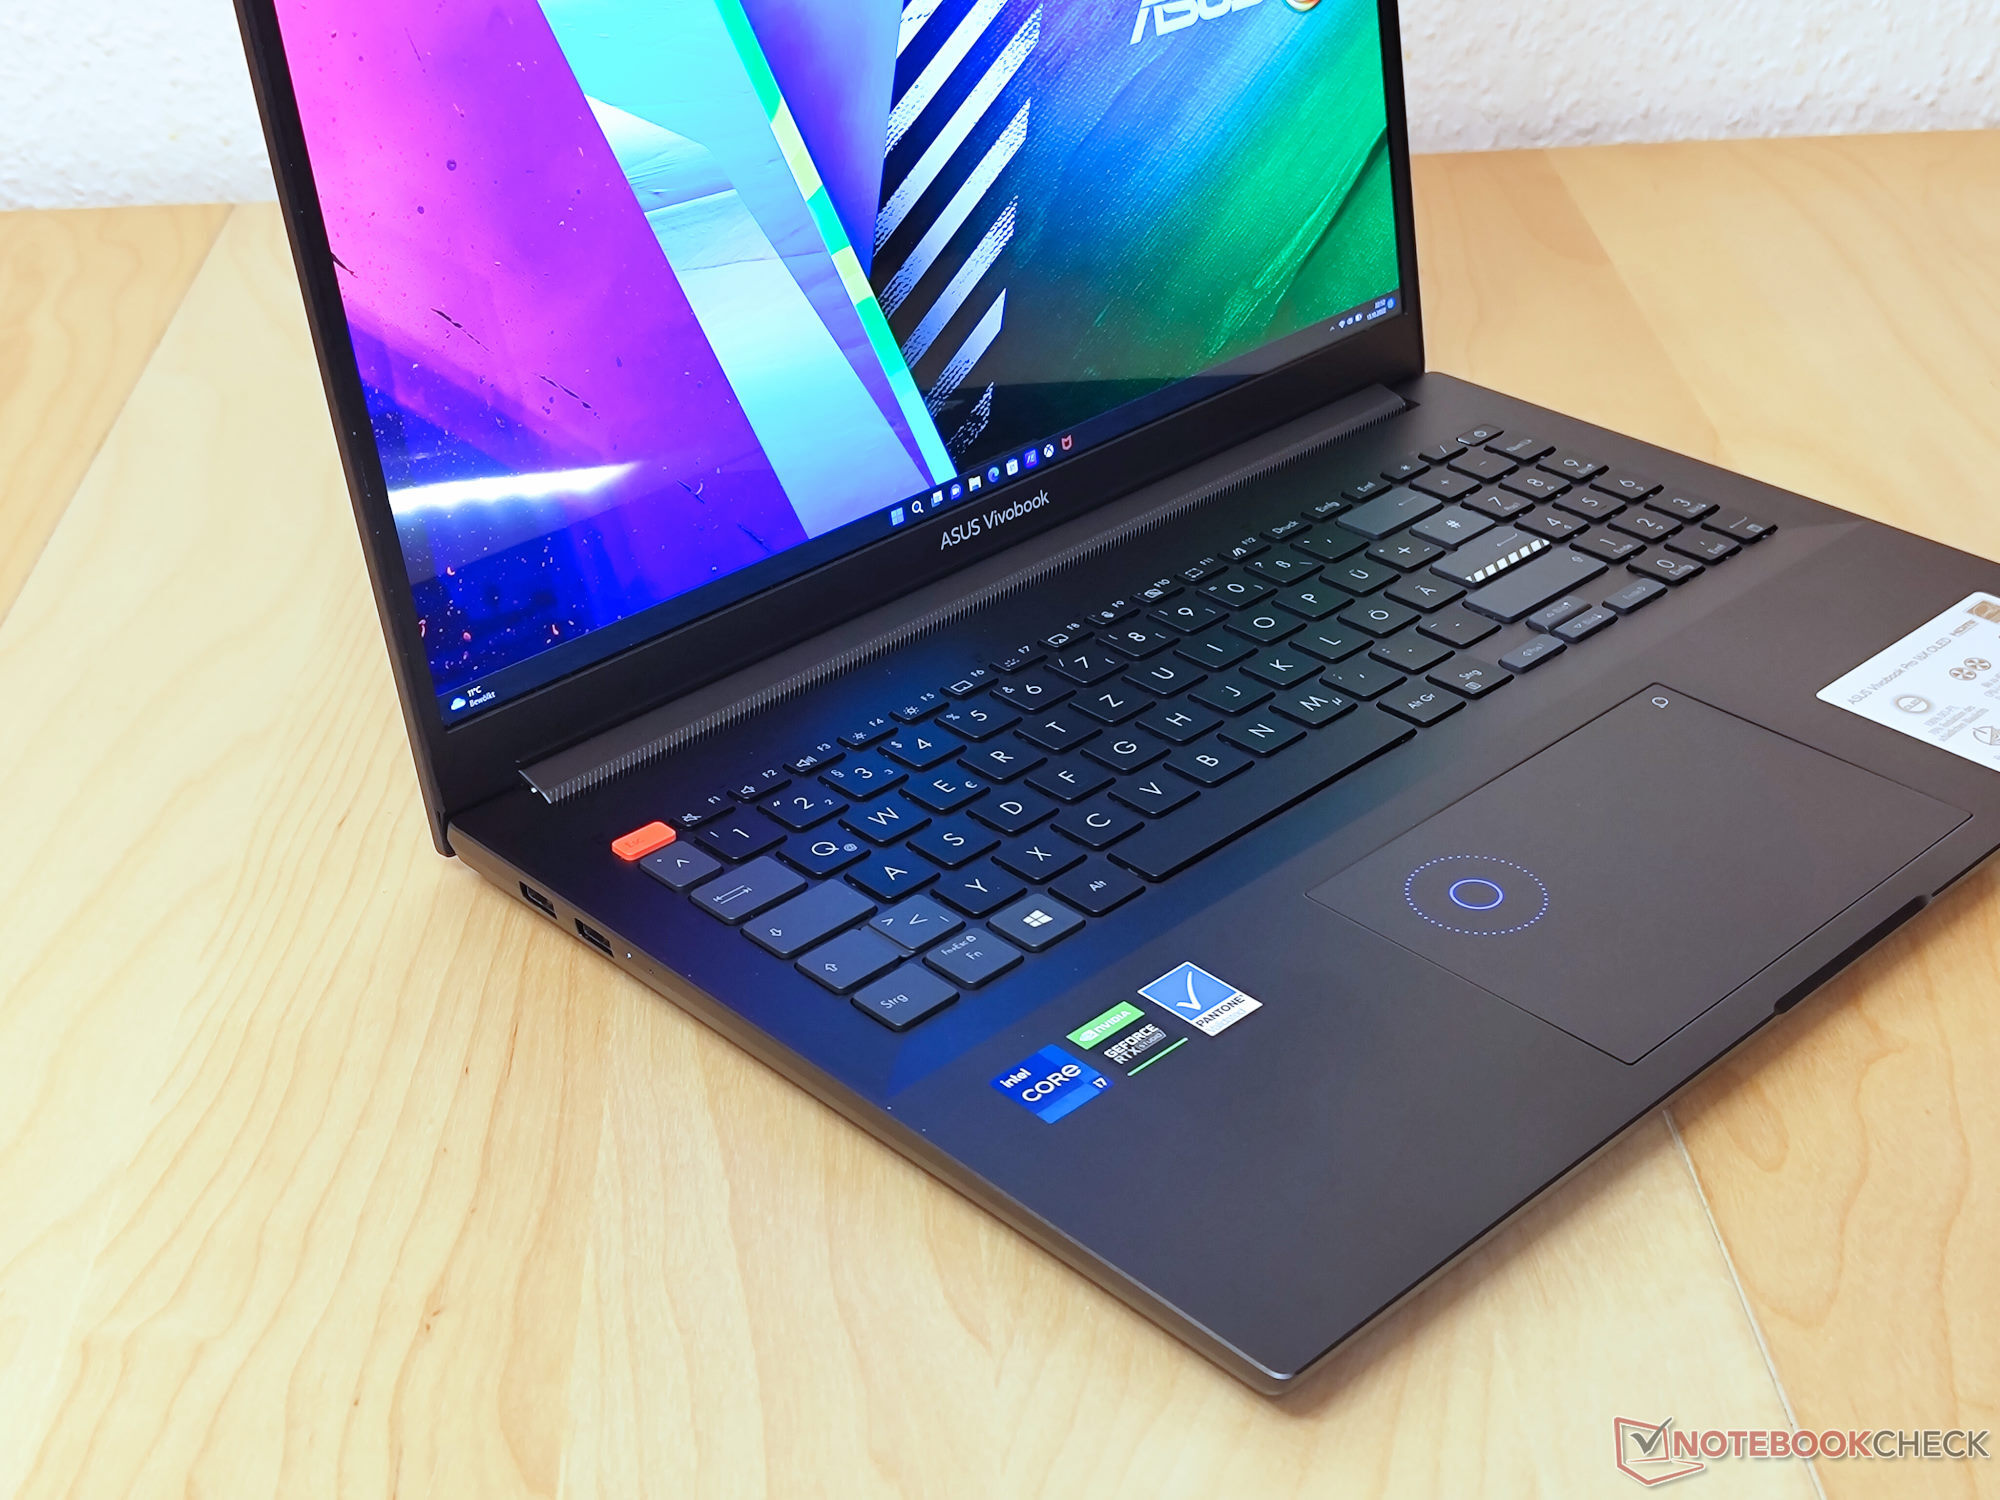
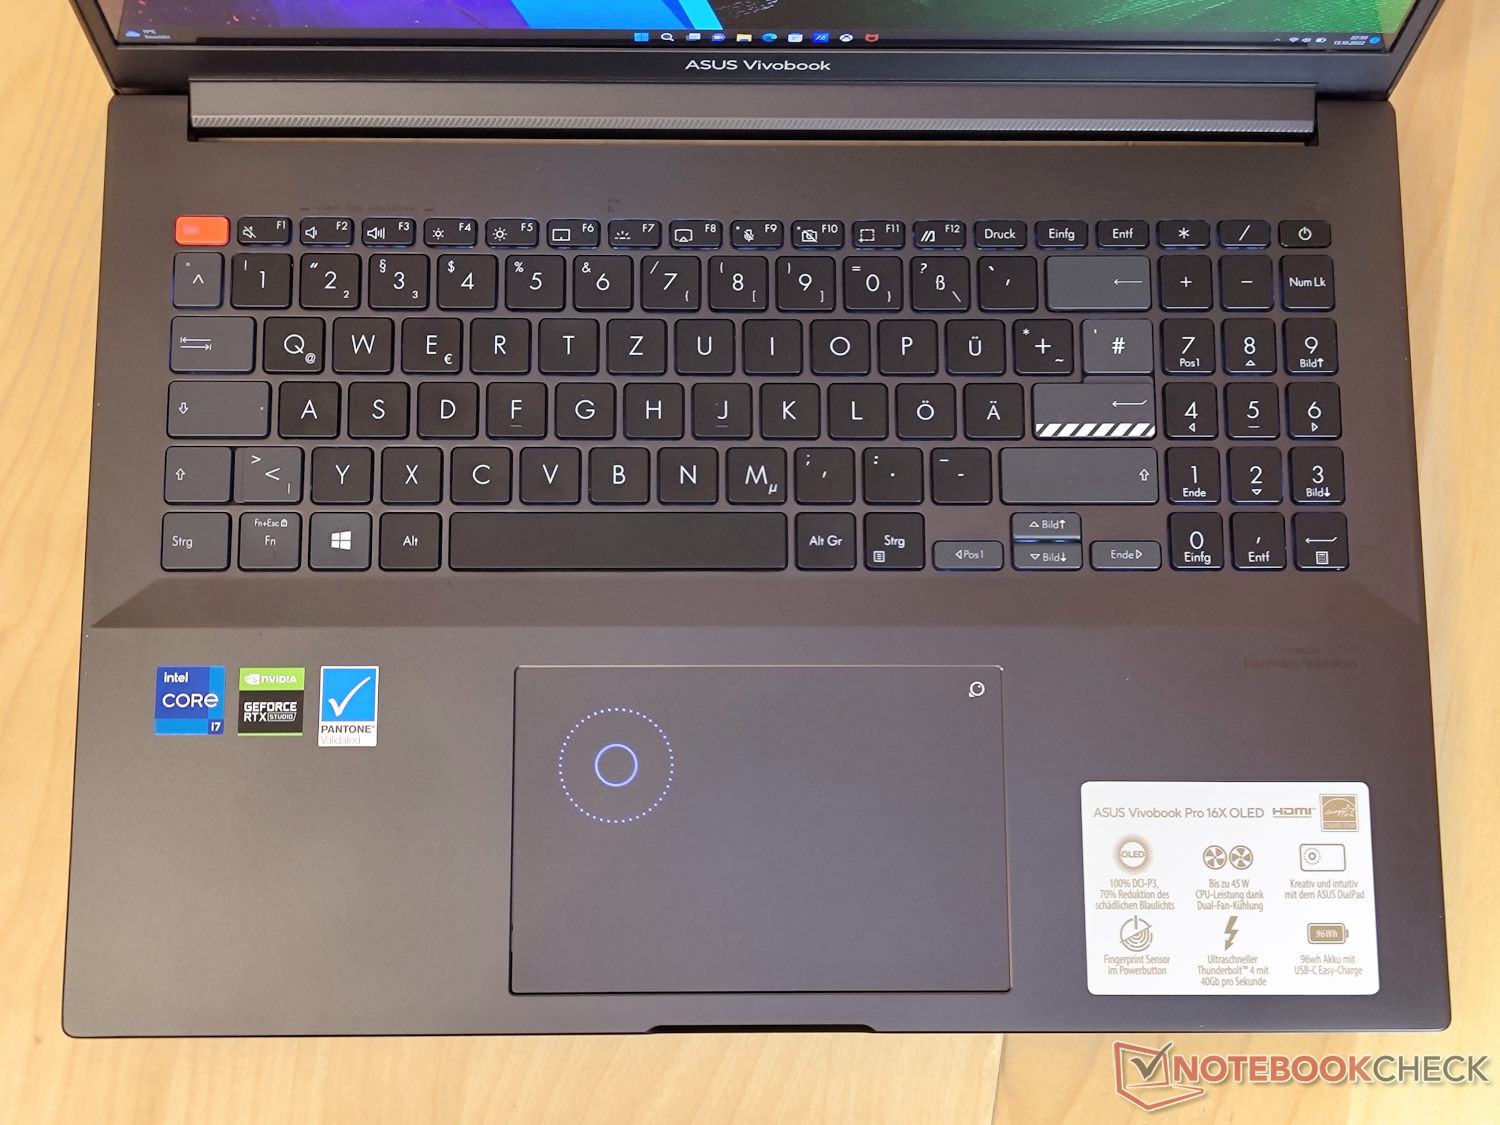
Inmatningsenheter - Asus Dail och ett fullskaligt tangentbord
Tangentbord
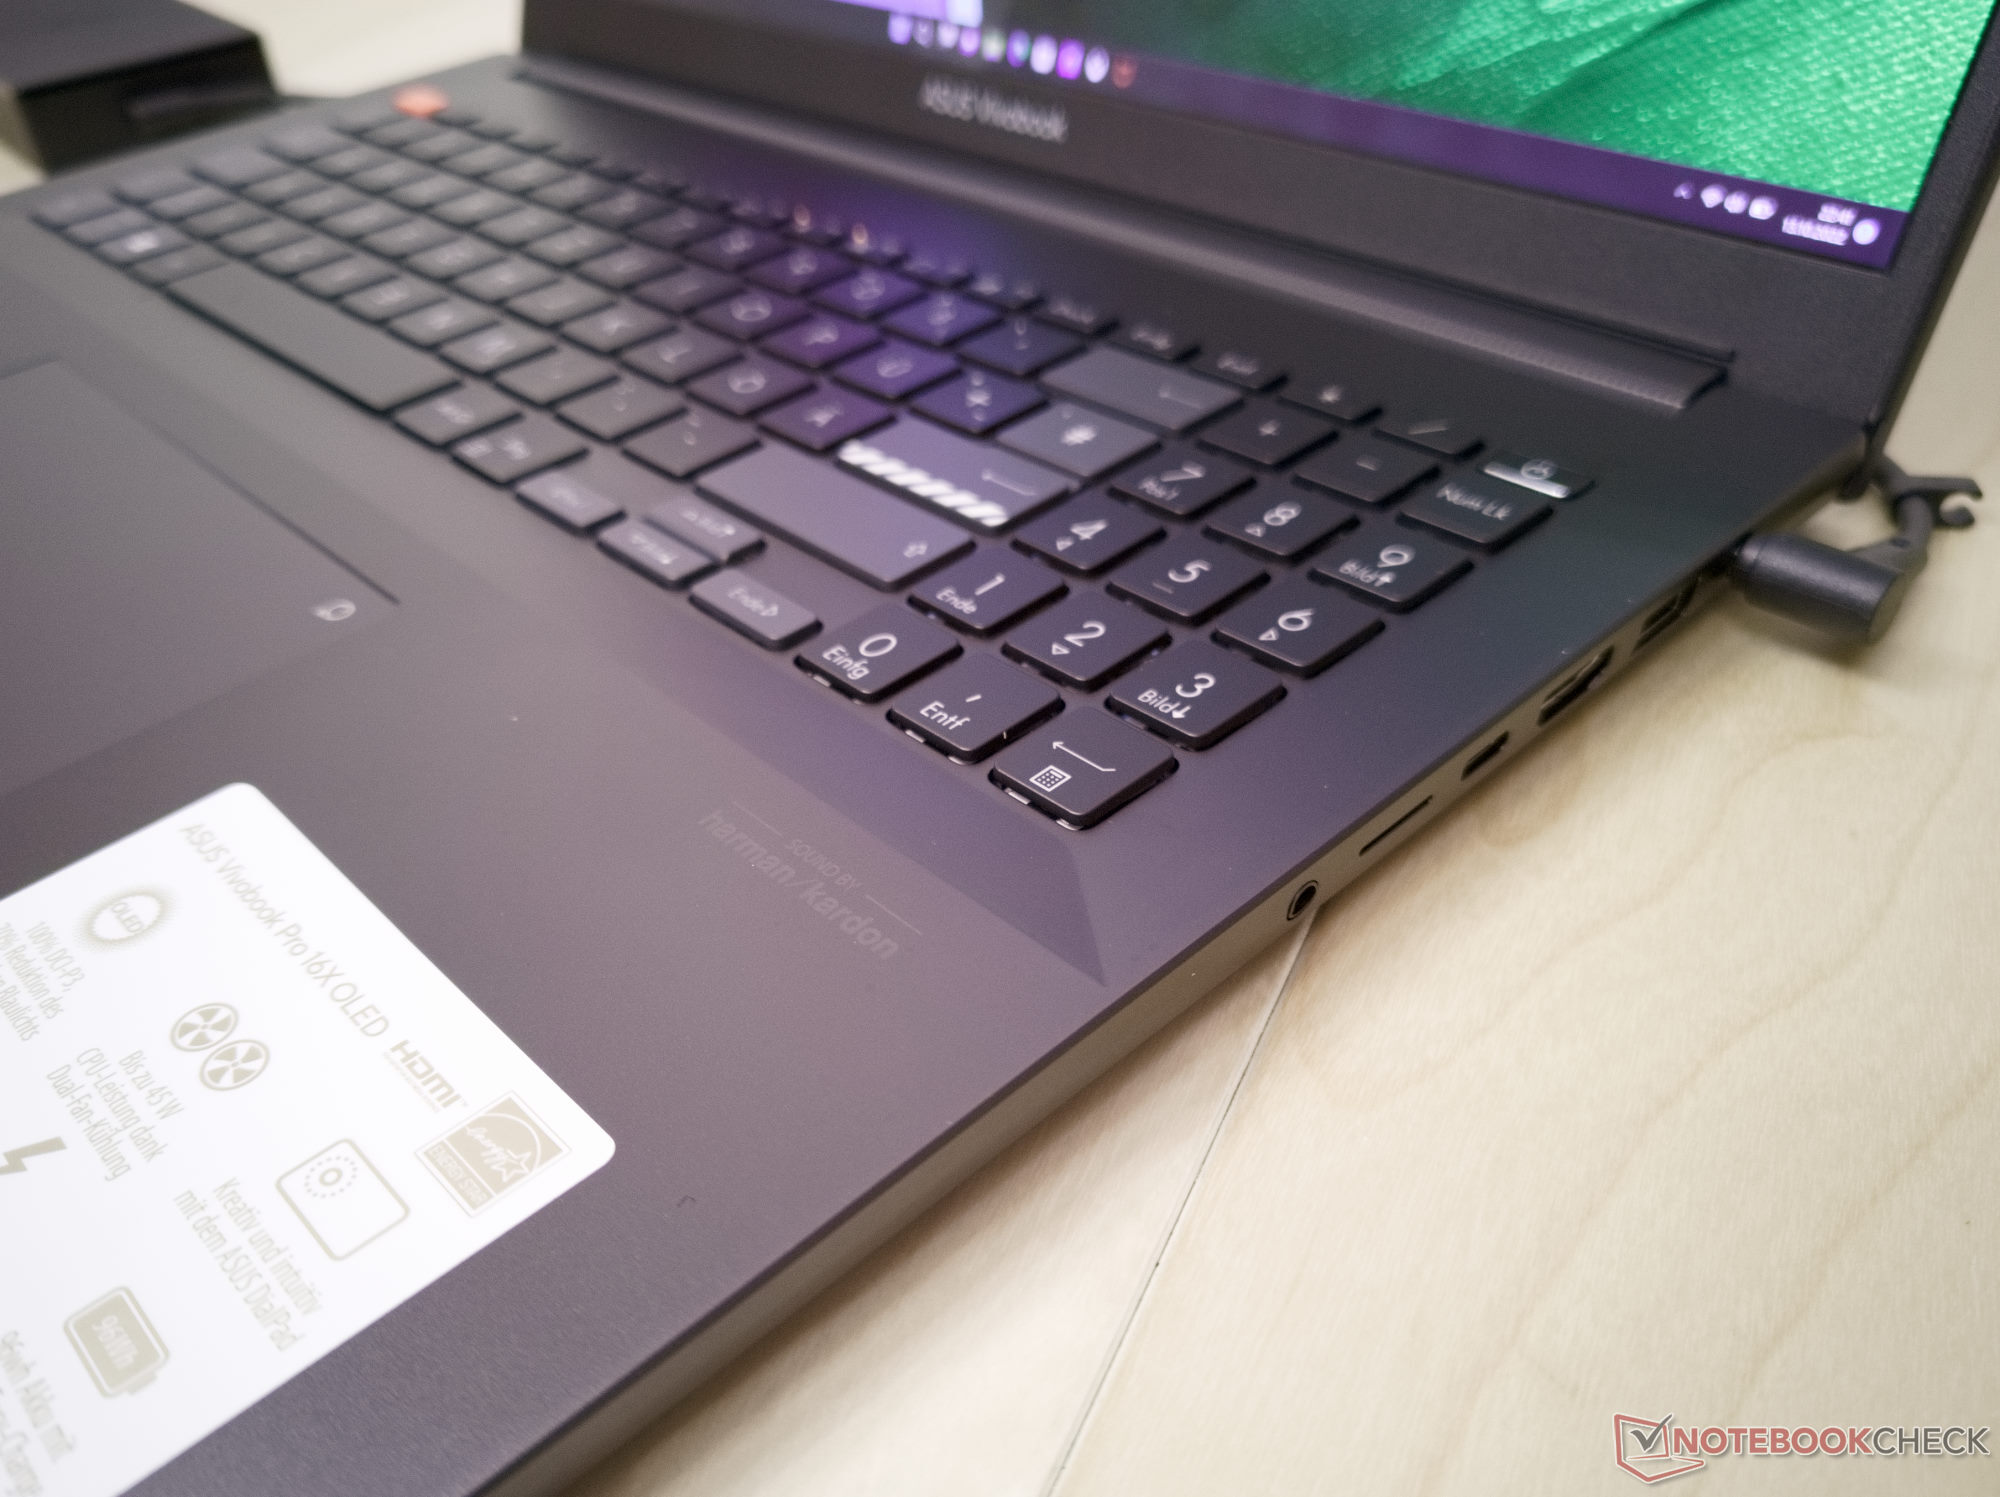
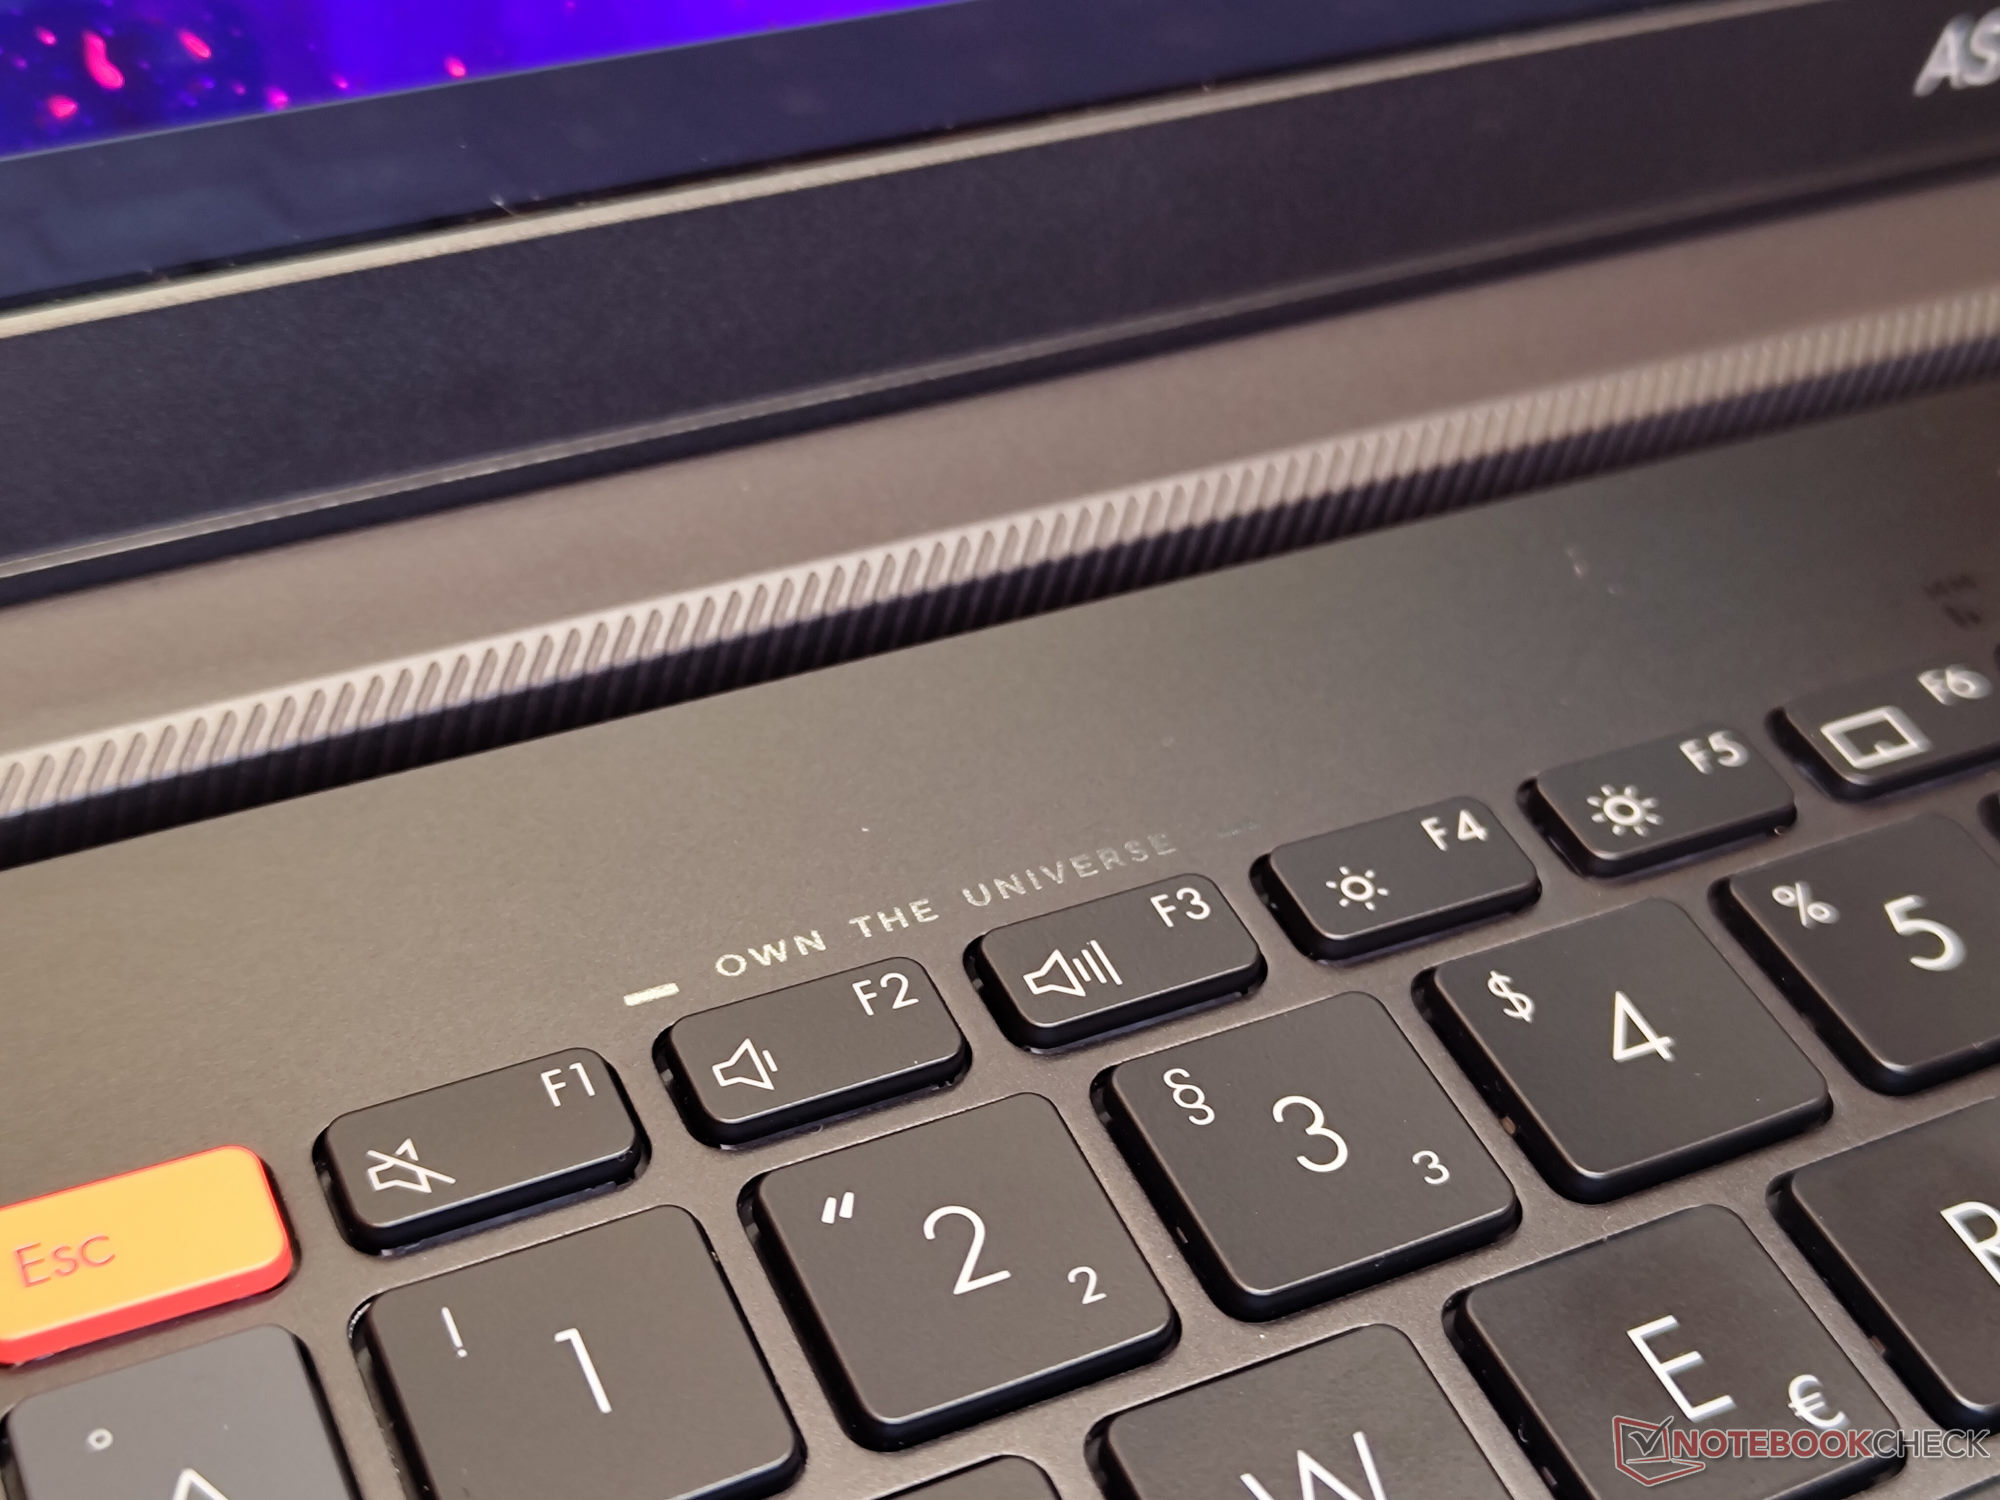
Tangentbordet på Vivobook Pro 16X utnyttjar det tillgängliga utrymmet på den 16-tums bärbara datorn och har en numpad utöver de normalhöga tangenterna. De vanligaste funktionerna kan nås via funktionstangenterna. De 15 mm (~0,59 tum) stora fyrkantiga knapparna har en bekväm rörlighet på 1,6 mm (~0,06 tum) och en bra haptisk återkoppling.
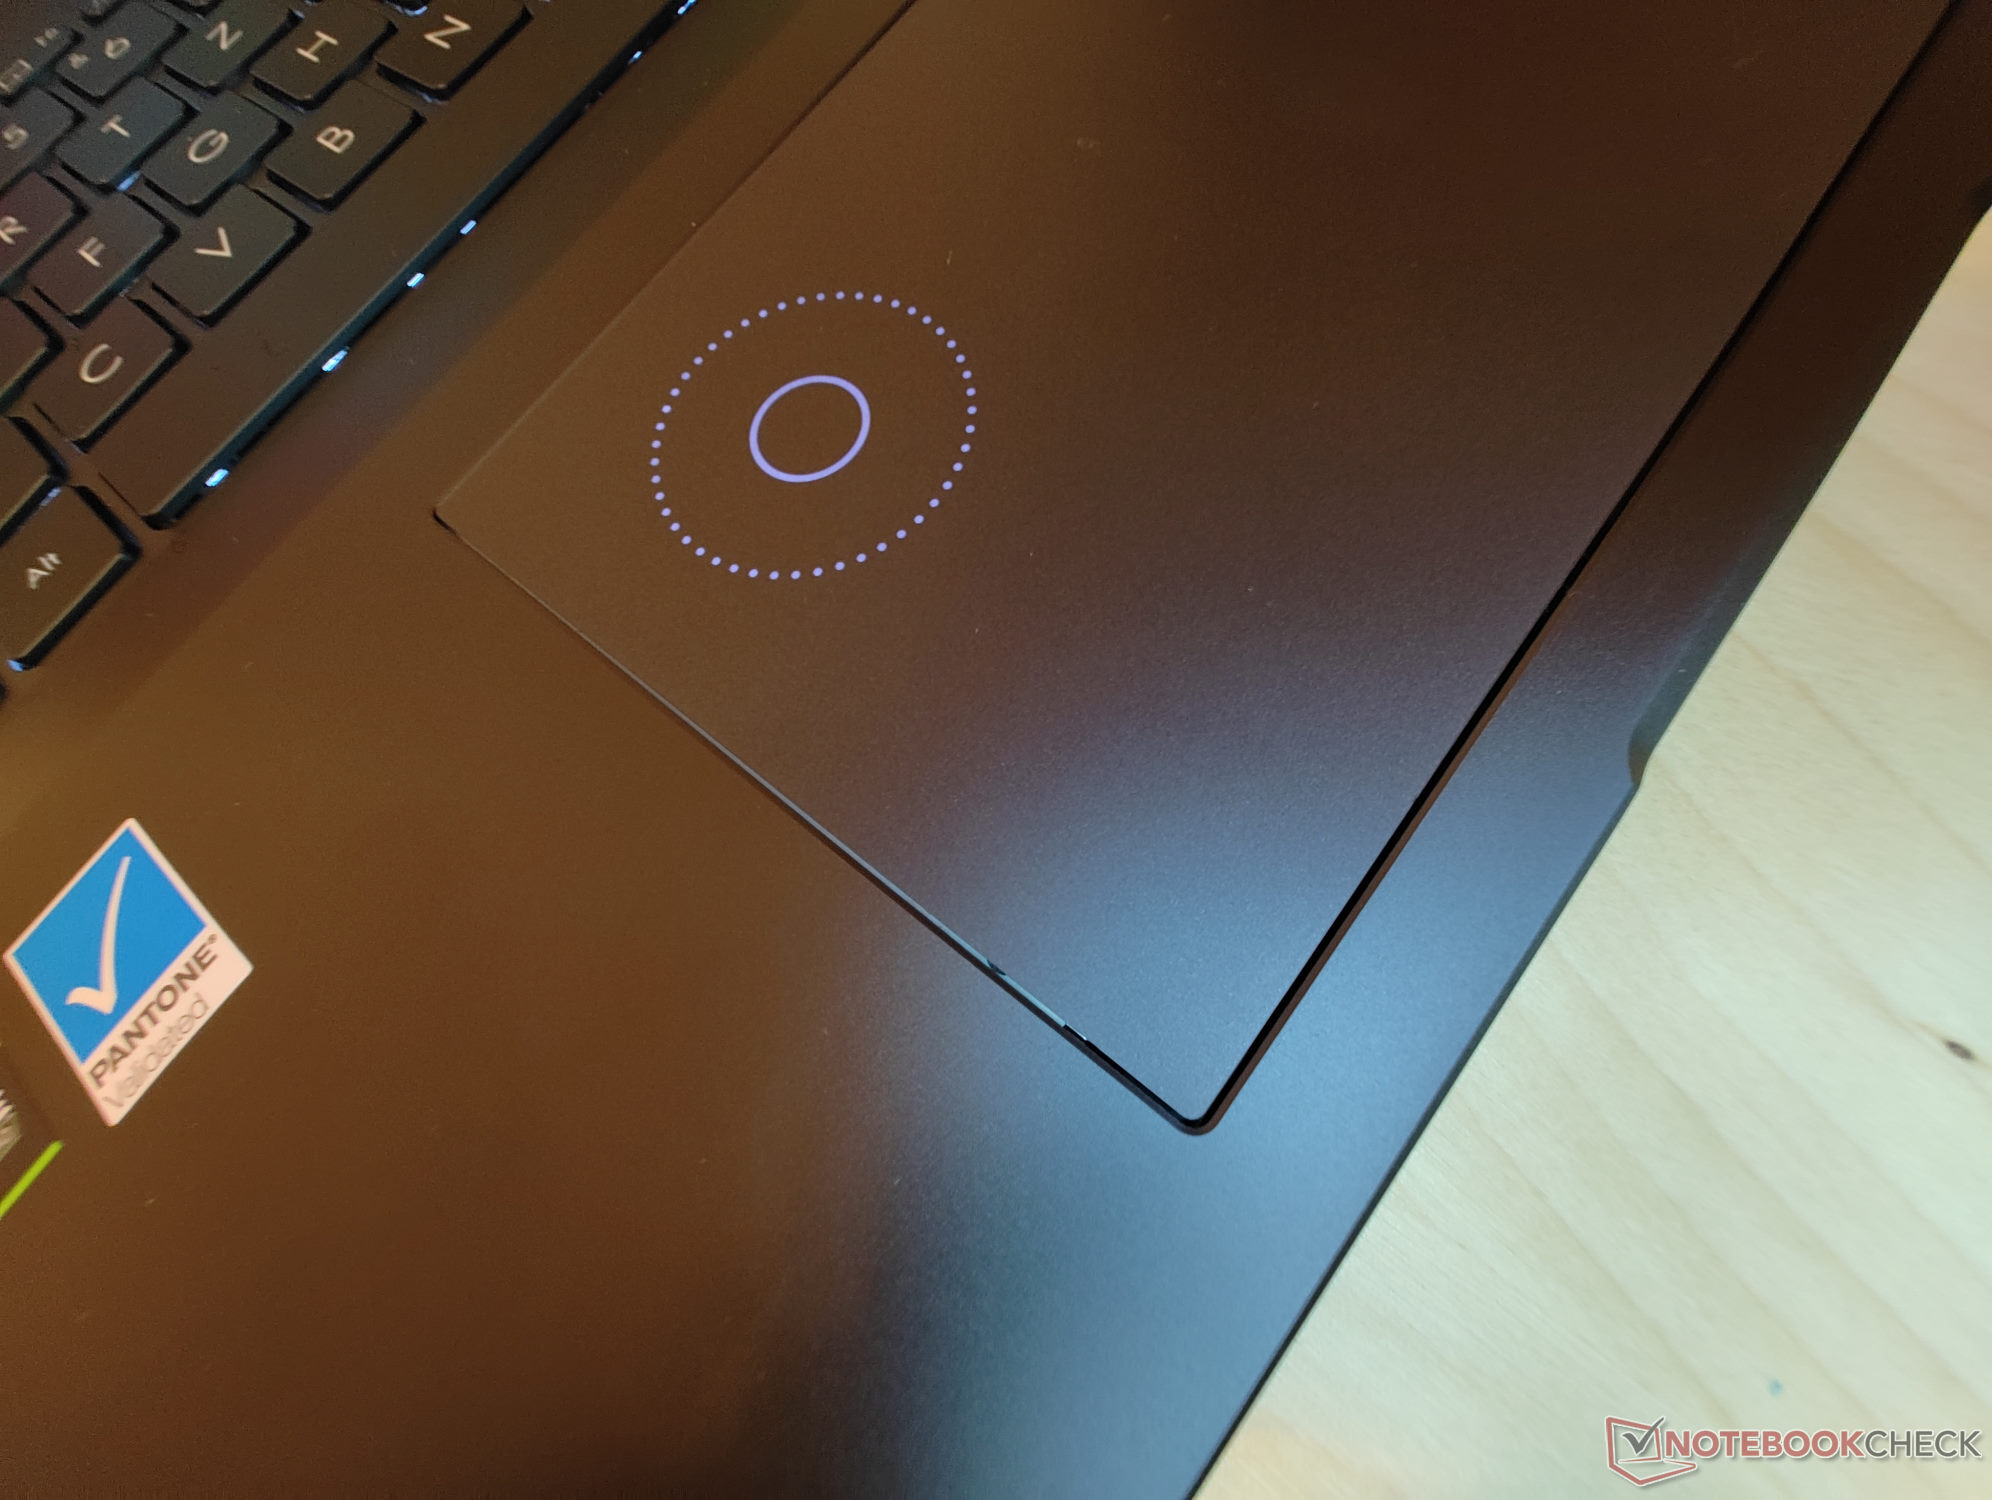
Pekplatta
Precis som på vissa andra Asus-modeller har Vivobook Pro 16X också Asus Dial integrerat i pekplattan. Inmatningsytan gör det möjligt för användare att ändra olika inställningar efter att ha kommit åt funktionen med en svepning nedåt från det övre högra hörnet. Alternativt finns även Microsoft Surface Dial-funktionerna tillgängliga. Klickplattan har en diagonalstorlek på 15,5 cm (~6,10 tum) och goda glidegenskaper, samtidigt som den är mycket responsiv.
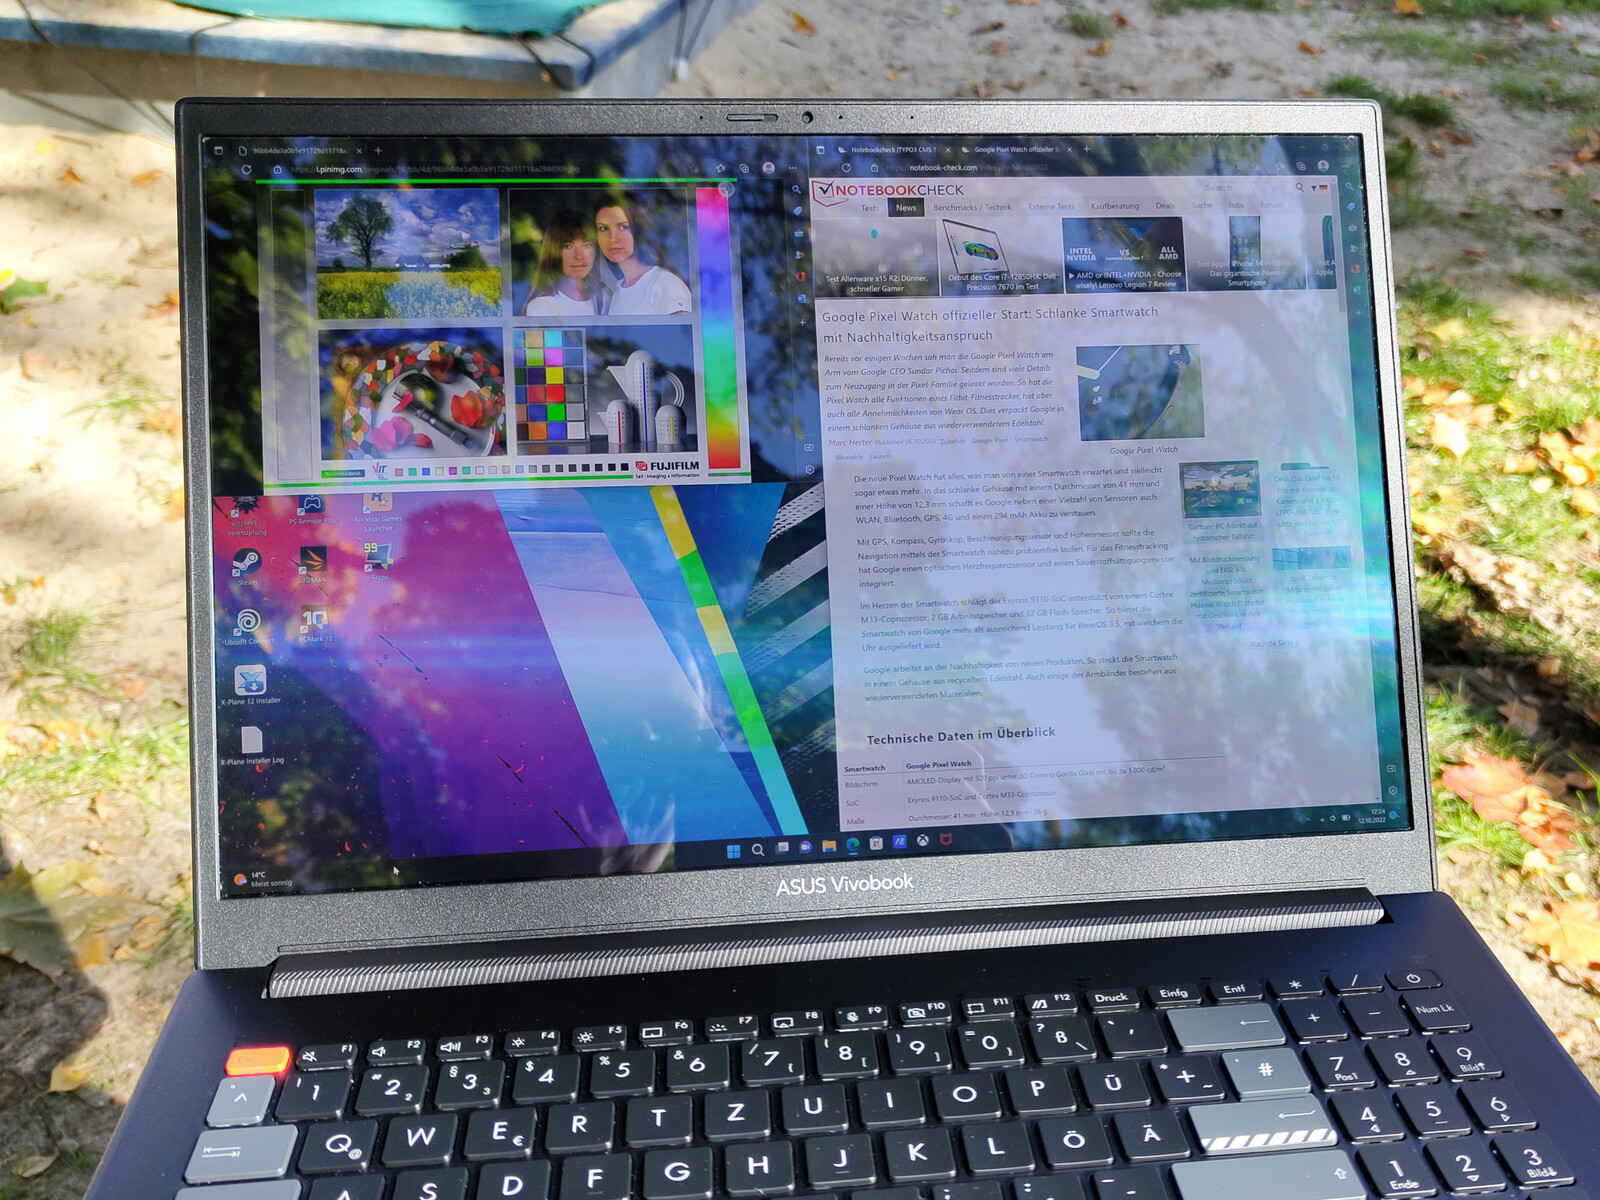
Skärm - Windows PC med 16:10 OLED-skärm

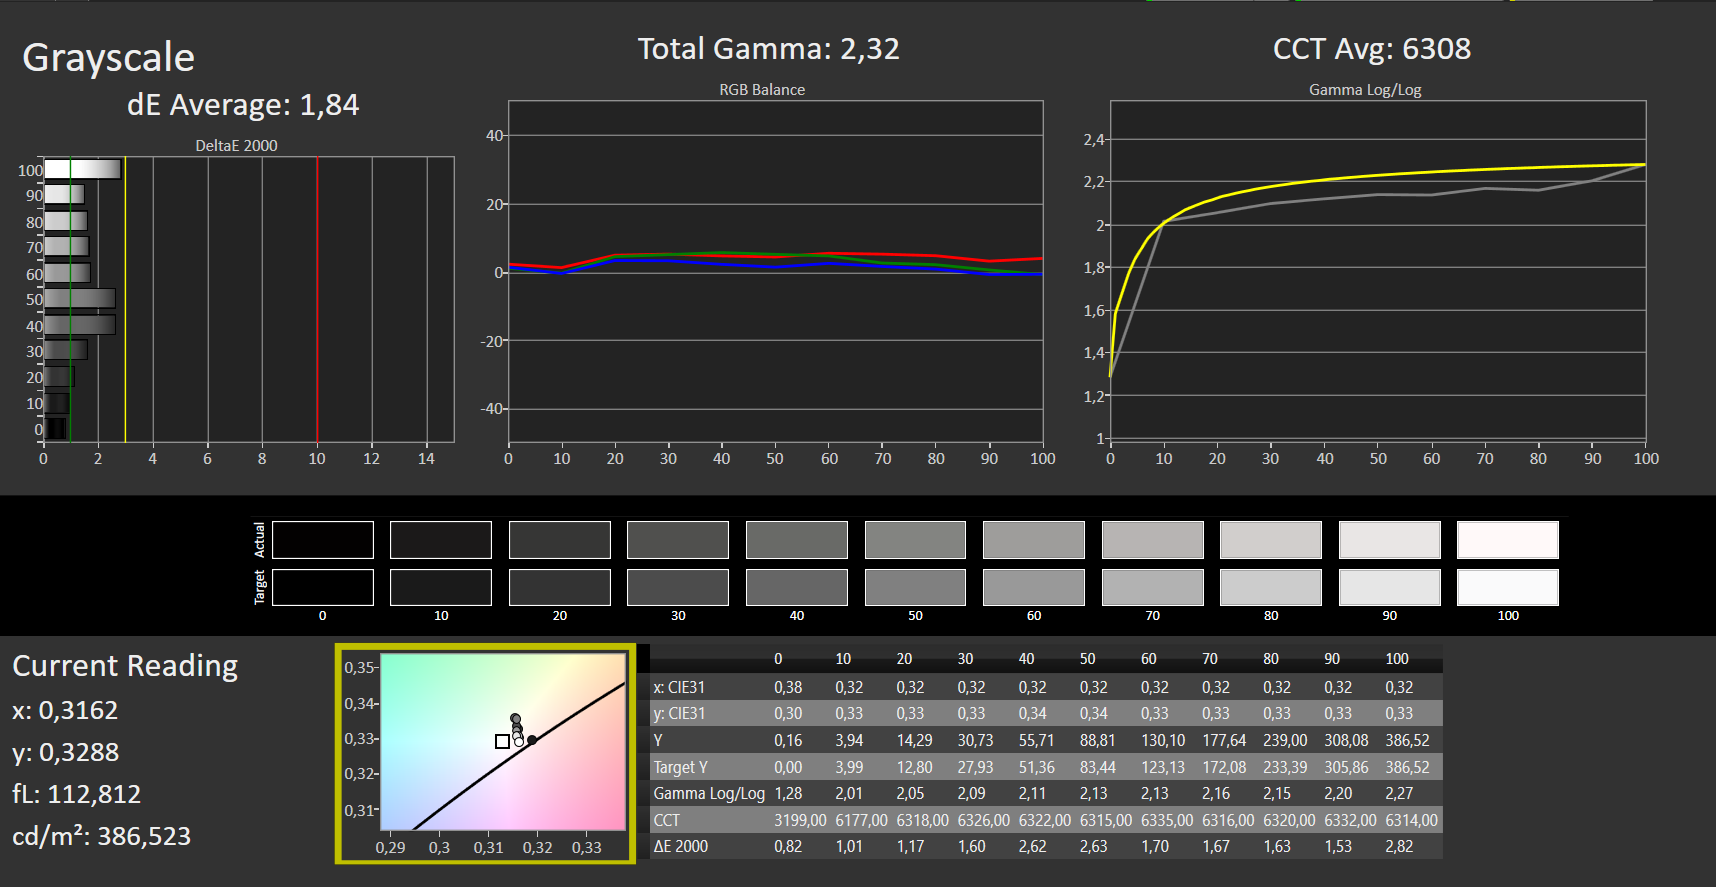
Vivobook Pro 16X OLED:s fantastiska skärm är den överlägset bästa egenskapen - det är både bra och dåligt. Skärmen är Pantone-validerad för en utmärkt färgrymdstäckning med mycket låga färgavvikelser fritt fabrik. 16:10-skärmen erbjuder naturliga färger, en hög maximal ljusstyrka och en inbyggd upplösning på 3840 x 2400 pixlar. Det finns dock även nackdelar med den glansiga OLED-panelen. Bländning och reflektioner är vanliga i solljus eller under suboptimala ljusförhållanden.
Belysningen är mycket jämn, vilket är typiskt för OLED-skärmar. Den maximala avvikelsen från genomsnittet på 390 nits är endast 7 nits. På grund av den underliggande tekniken finns det ingen skärmblödning. På samma sätt är kontrastförhållandet på 2394:1 utmärkt.
| |||||||||||||||||||||||||
Distribution av ljusstyrkan: 96 %
Mitt på batteriet: 383 cd/m²
Kontrast: 14185:1 (Svärta: 0.027 cd/m²)
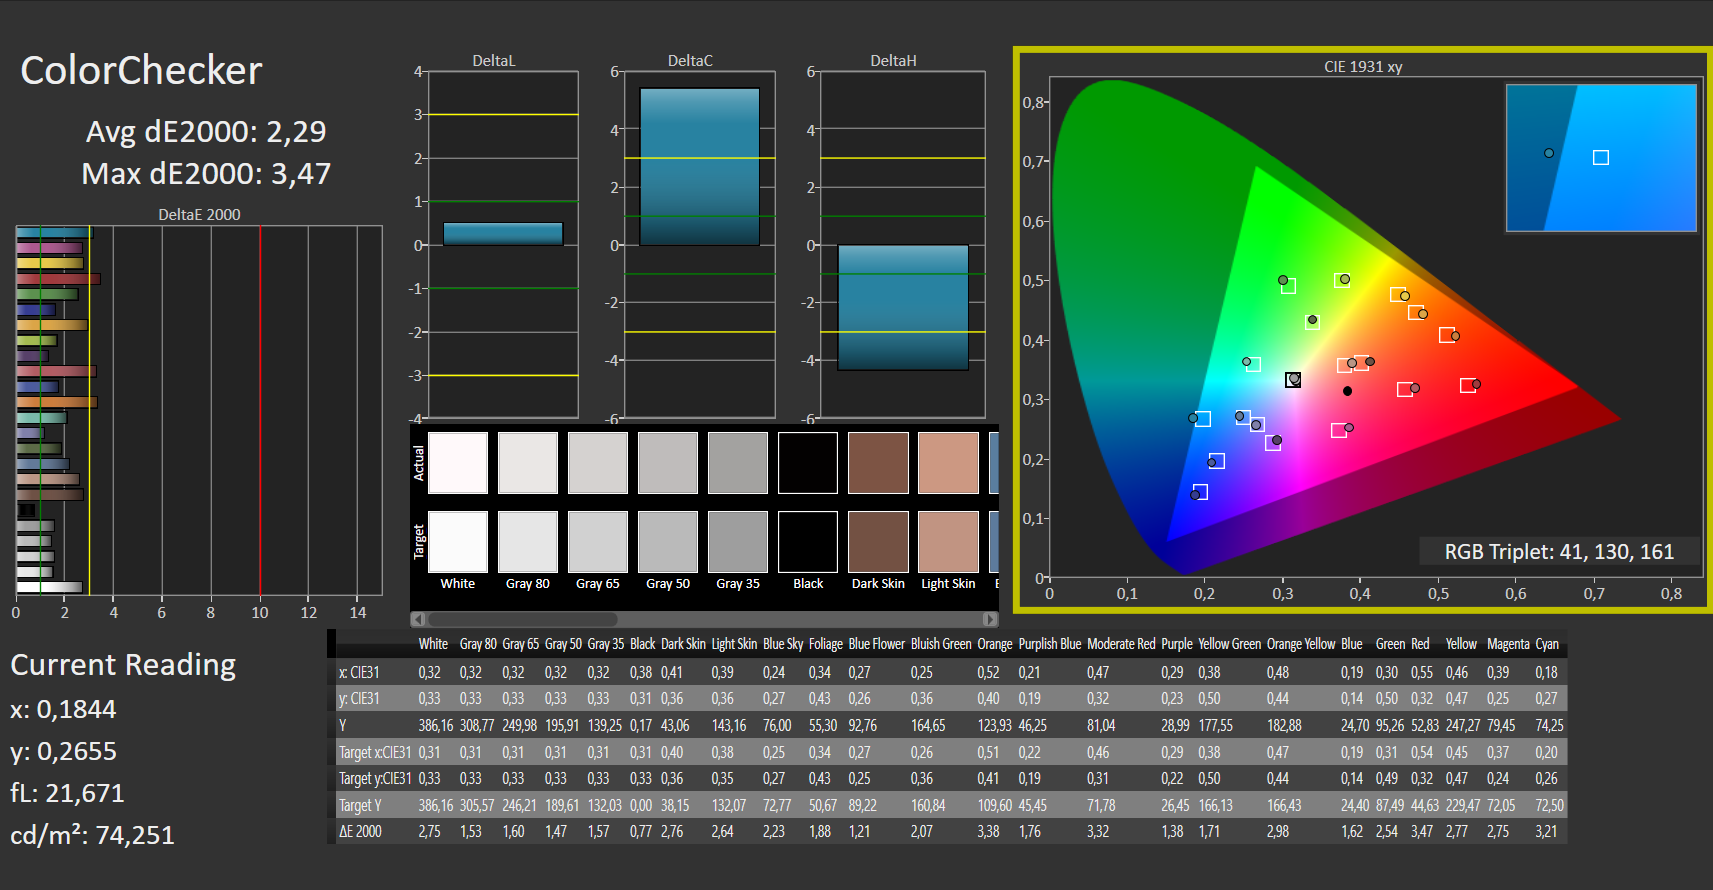
ΔE ColorChecker Calman: 2.29 | ∀{0.5-29.43 Ø4.72}
ΔE Greyscale Calman: 1.84 | ∀{0.09-98 Ø4.97}
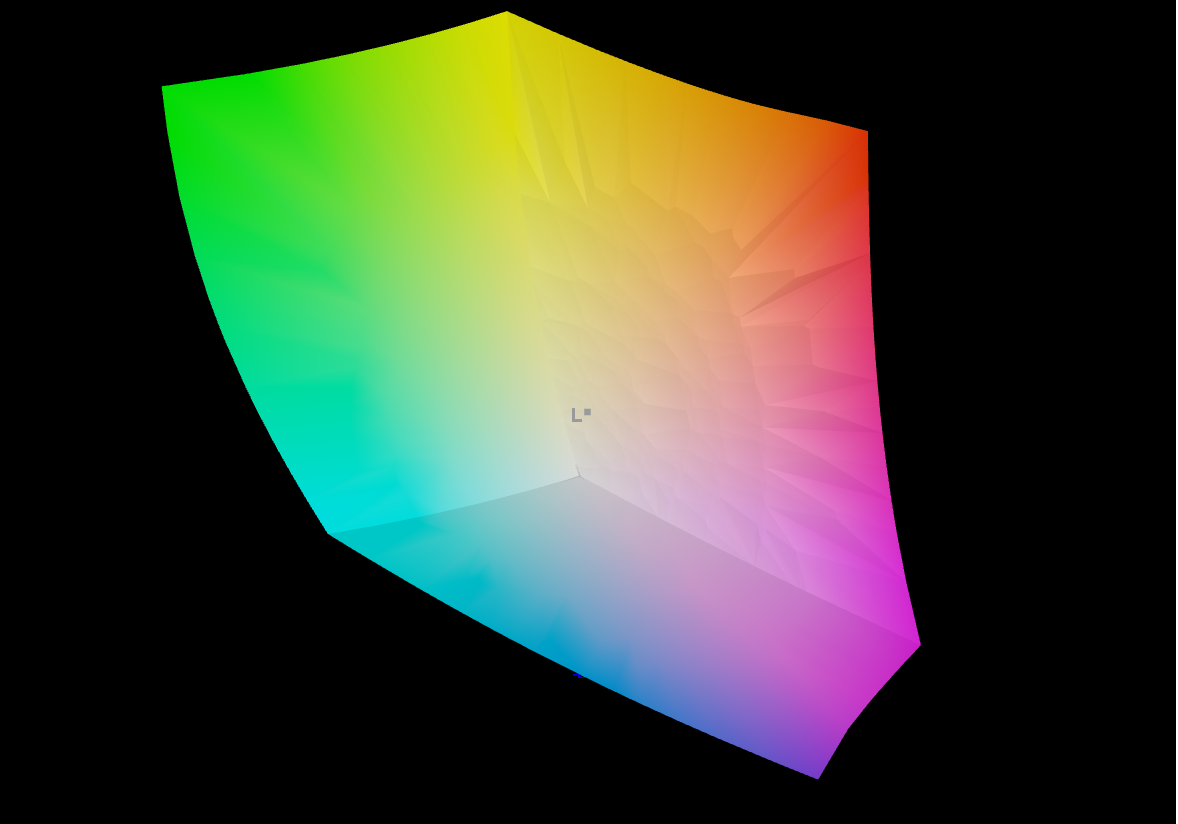
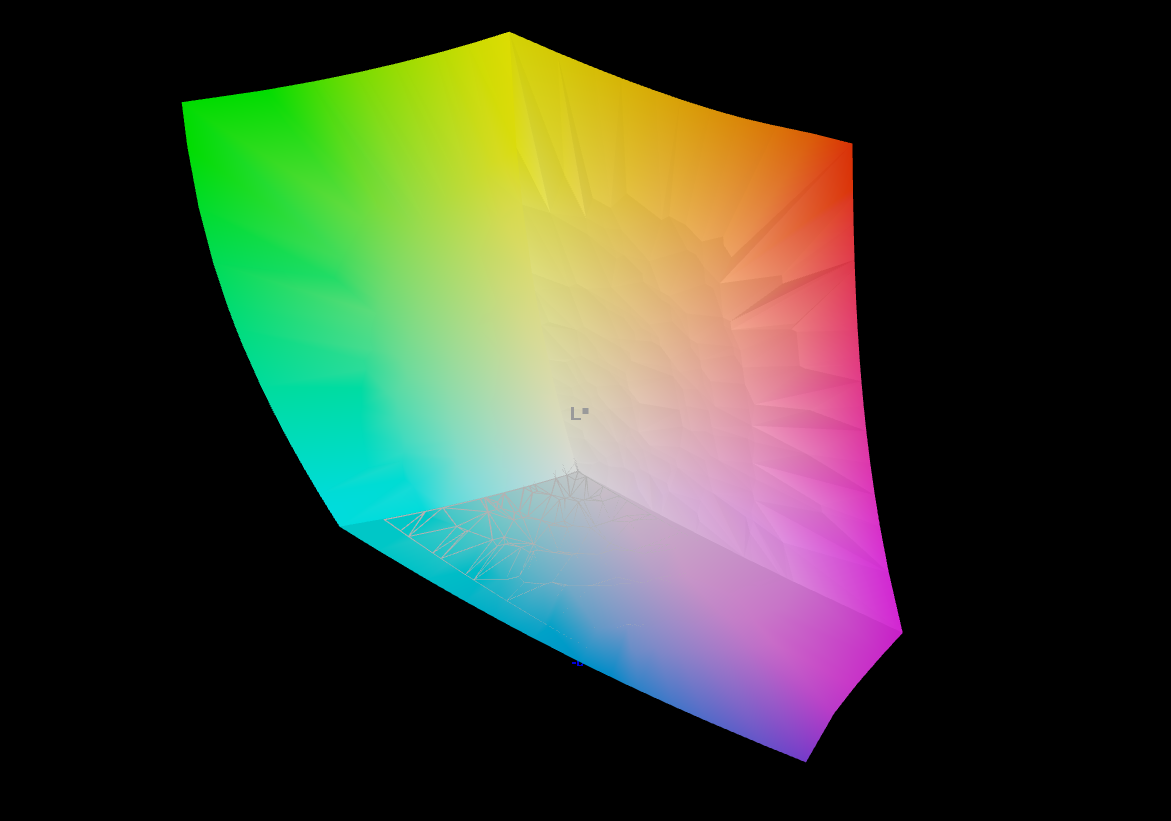
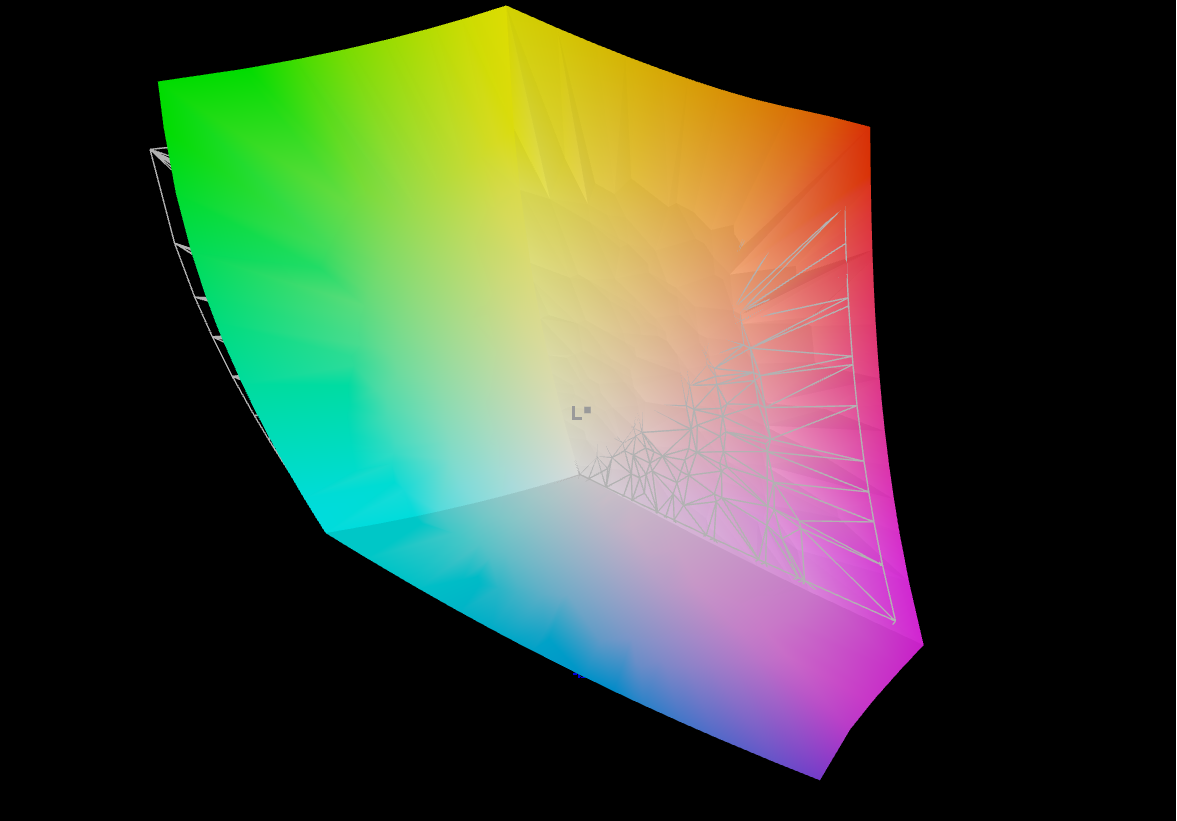
98.05% AdobeRGB 1998 (Argyll 3D)
100% sRGB (Argyll 3D)
99.9% Display P3 (Argyll 3D)
Gamma: 2.32
CCT: 6308 K
| Asus VivoBook Pro 16X OLED N7600PC-L2026X Samsung ATNA60YV02-0, OLED, 3840x2400, 16" | MSI Summit E16 Flip A12UDT-031 AU Optronics B16QAN02.N, IPS, 2560x1600, 16" | Microsoft Surface Laptop Studio i7 RTX 3050 Ti LQ144P1JX01, IPS, 2400x1600, 14.4" | Dell Inspiron 16 Plus 7610 AU Optronics B160QAN, IPS, 3072x1920, 16" | Lenovo ThinkPad X1 Extreme G4-20Y5CTO1WW (3050 Ti) LP160UQ1-SPB1, IPS LED, 3840x2400, 16" | Schenker XMG Focus 15 LG Philips LP156WFG-SPB5, IPS, 1920x1080, 15.6" | |
|---|---|---|---|---|---|---|
| Display | -4% | -13% | -17% | -6% | -24% | |
| Display P3 Coverage (%) | 99.9 | 98.9 -1% | 80.6 -19% | 74.1 -26% | 84.3 -16% | 64.6 -35% |
| sRGB Coverage (%) | 100 | 100 0% | 99.9 0% | 99.4 -1% | 98.3 -2% | 95.3 -5% |
| AdobeRGB 1998 Coverage (%) | 98.05 | 86.5 -12% | 78.5 -20% | 75.8 -23% | 97.8 0% | 66.5 -32% |
| Response Times | -775% | -3420% | -3280% | -3950% | -1020% | |
| Response Time Grey 50% / Grey 80% * (ms) | 1 | 13 ? -1200% | 58.4 ? -5740% | 49.2 ? -4820% | 60 ? -5900% | 18 ? -1700% |
| Response Time Black / White * (ms) | 2 ? | 9 ? -350% | 24 ? -1100% | 36.8 ? -1740% | 42 ? -2000% | 8.8 ? -340% |
| PWM Frequency (Hz) | 247 ? | 5000 ? | ||||
| Screen | -161% | -118% | -114% | -208% | -196% | |
| Brightness middle (cd/m²) | 383 | 314 -18% | 497 30% | 296.8 -23% | 639 67% | 418 9% |
| Brightness (cd/m²) | 390 | 294 -25% | 491 26% | 292 -25% | 612 57% | 376 -4% |
| Brightness Distribution (%) | 96 | 89 -7% | 92 -4% | 87 -9% | 84 -12% | 83 -14% |
| Black Level * (cd/m²) | 0.027 | 0.28 -937% | 0.29 -974% | 0.21 -678% | 0.47 -1641% | 0.41 -1419% |
| Contrast (:1) | 14185 | 1121 -92% | 1714 -88% | 1413 -90% | 1360 -90% | 1020 -93% |
| Colorchecker dE 2000 * | 2.29 | 3.08 -34% | 1.2 48% | 2.56 -12% | 2.2 4% | 1.67 27% |
| Colorchecker dE 2000 max. * | 3.47 | 5.49 -58% | 2.8 19% | 4.76 -37% | 5.3 -53% | 3.88 -12% |
| Greyscale dE 2000 * | 1.84 | 3.99 -117% | 1.9 -3% | 2.6 -41% | 1.7 8% | 2.9 -58% |
| Gamma | 2.32 95% | 2.3 96% | 2.14 103% | 2.07 106% | 2.31 95% | 2.26 97% |
| CCT | 6308 103% | 6219 105% | 6821 95% | 6628 98% | 6390 102% | 6209 105% |
| Colorchecker dE 2000 calibrated * | 0.88 | 0.8 | 1.86 | 1.4 | 0.98 | |
| Totalt genomsnitt (program/inställningar) | -313% /
-219% | -1184% /
-602% | -1137% /
-579% | -1388% /
-737% | -413% /
-283% |
* ... mindre är bättre
En bildskärms Pantone-validering innebär inte nödvändigtvis att den täcker ett brett färgutrymme eller att färgerna är extremt exakta i alla fall. Pantone-färgsystemet infördes för att göra färgerna för produkter och trycksaker mer jämförbara och förutsägbara. Även om färgsystemet, som omfattar 1867 individuella färger för tryck och många fler specifika färger för produkter, är ganska omfattande, täcker det inte nödvändigtvis helt och hållet stora färgrymder som DisplayP3. Därför kan en bildskärm som endast täcker det mindre sRGB-färgutrymmet ändå uppfylla kraven för Pantone-matchningssystemet. Dessutom kan färgavvikelserna utanför Pantone-systemet vara större.
Sammanfattningsvis är det fortfarande värt att fastställa vilka färgrymder en skärm kan visa och vilka användningsfall den lämpar sig för, även om det rör sig om en Pantone-validerad skärm. Kraven för videoredigering kan skilja sig avsevärt från kraven för grafisk design för tryckta medier.
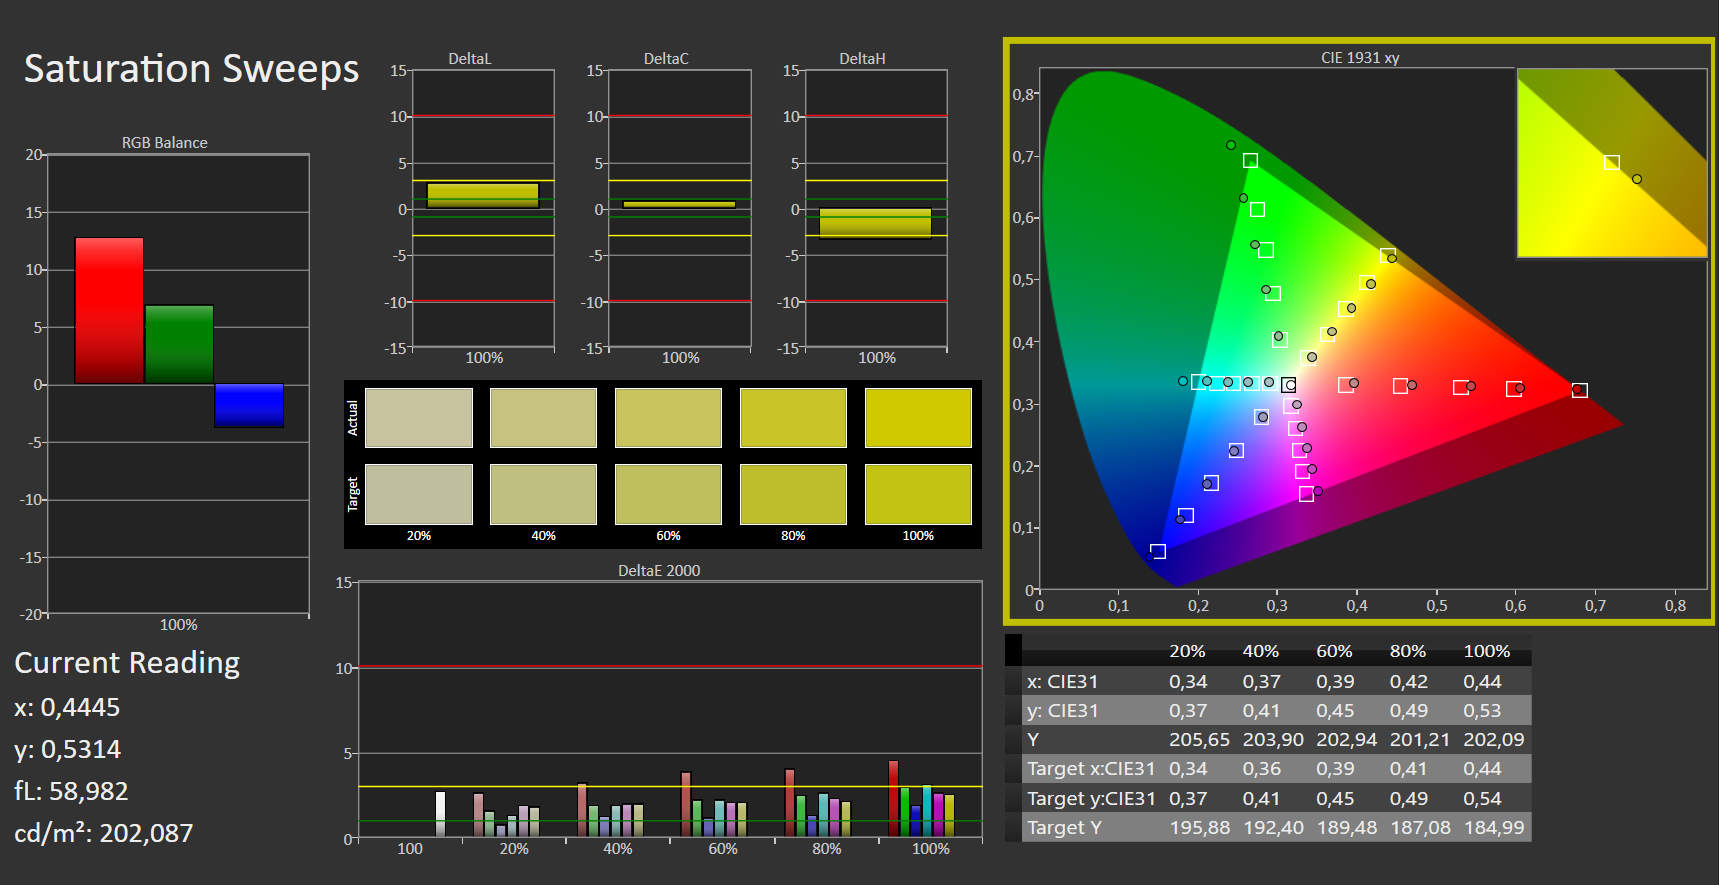
OLED-panelen i Asus Vivobook täcker nästan 100 procent av de tre relevanta färgområdena. Tack vare den goda AdobeRGB- och DisplayP3-täckningen är skärmen väl lämpad för fotografering respektive videoredigering.
Den Pantone-validerade skärmen på Asus Vivobook har en mycket låg färgavvikelse fritt fabrik. I vårt test med programvaran CalMAN ColorChecker överskrider de maximala färgavvikelserna endast något målvärdet deltaE på 3. Med ett genomsnittligt deltaE på 2,29 hamnar skärmen bekvämt i det ideala intervallet.
Visa svarstider
| ↔ Svarstid svart till vitt | ||
|---|---|---|
| 2 ms ... stiga ↗ och falla ↘ kombinerat | ↗ 1 ms stiga |  |
| ↘ 1 ms hösten | ||
| Skärmen visar väldigt snabba svarsfrekvenser i våra tester och borde vara mycket väl lämpad för fartfyllt spel. I jämförelse sträcker sig alla testade enheter från 0.1 (minst) till 240 (maximalt) ms. » 11 % av alla enheter är bättre. Det betyder att den uppmätta svarstiden är bättre än genomsnittet av alla testade enheter (19.9 ms). | ||
| ↔ Svarstid 50 % grått till 80 % grått | ||
| 1 ms ... stiga ↗ och falla ↘ kombinerat | ↗ 0 ms stiga |  |
| ↘ 0 ms hösten | ||
| Skärmen visar väldigt snabba svarsfrekvenser i våra tester och borde vara mycket väl lämpad för fartfyllt spel. I jämförelse sträcker sig alla testade enheter från 0.165 (minst) till 636 (maximalt) ms. » 4 % av alla enheter är bättre. Det betyder att den uppmätta svarstiden är bättre än genomsnittet av alla testade enheter (31.1 ms). | ||
Skärmflimmer / PWM (Puls-Width Modulation)
| Skärmflimmer / PWM upptäckt | 247 Hz | ≤ 50 % ljusstyrka inställning |  |
Displayens bakgrundsbelysning flimrar vid 247 Hz (i värsta fall, t.ex. med PWM) Flimrande upptäckt vid en ljusstyrkeinställning på 50 % och lägre. Det ska inte finnas något flimmer eller PWM över denna ljusstyrkeinställning. Frekvensen för 247 Hz är relativt låg, så känsliga användare kommer sannolikt att märka flimmer och uppleva ansträngda ögon vid den angivna ljusstyrkeinställningen och nedan. Som jämförelse: 52 % av alla testade enheter använder inte PWM för att dämpa skärmen. Om PWM upptäcktes mättes ett medelvärde av 7784 (minst: 5 - maximum: 343500) Hz. | |||
Som vanligt varierar OLED-skärmens flimmer beroende på ljusstyrkan och de bilder som visas. I fallet med Vivobook Pro 16X upptäcker vi endast flimmer vid ljusstyrkor på 50 procent och lägre. Som väntat dimmar inte skärmen samtidigt i sin helhet utan sänker istället bara ljusstyrkan i vissa rader. Detta minskar ögonbelastningen på OLED-skärmen jämfört med en LCD-skärm med samma flimmerfrekvens.


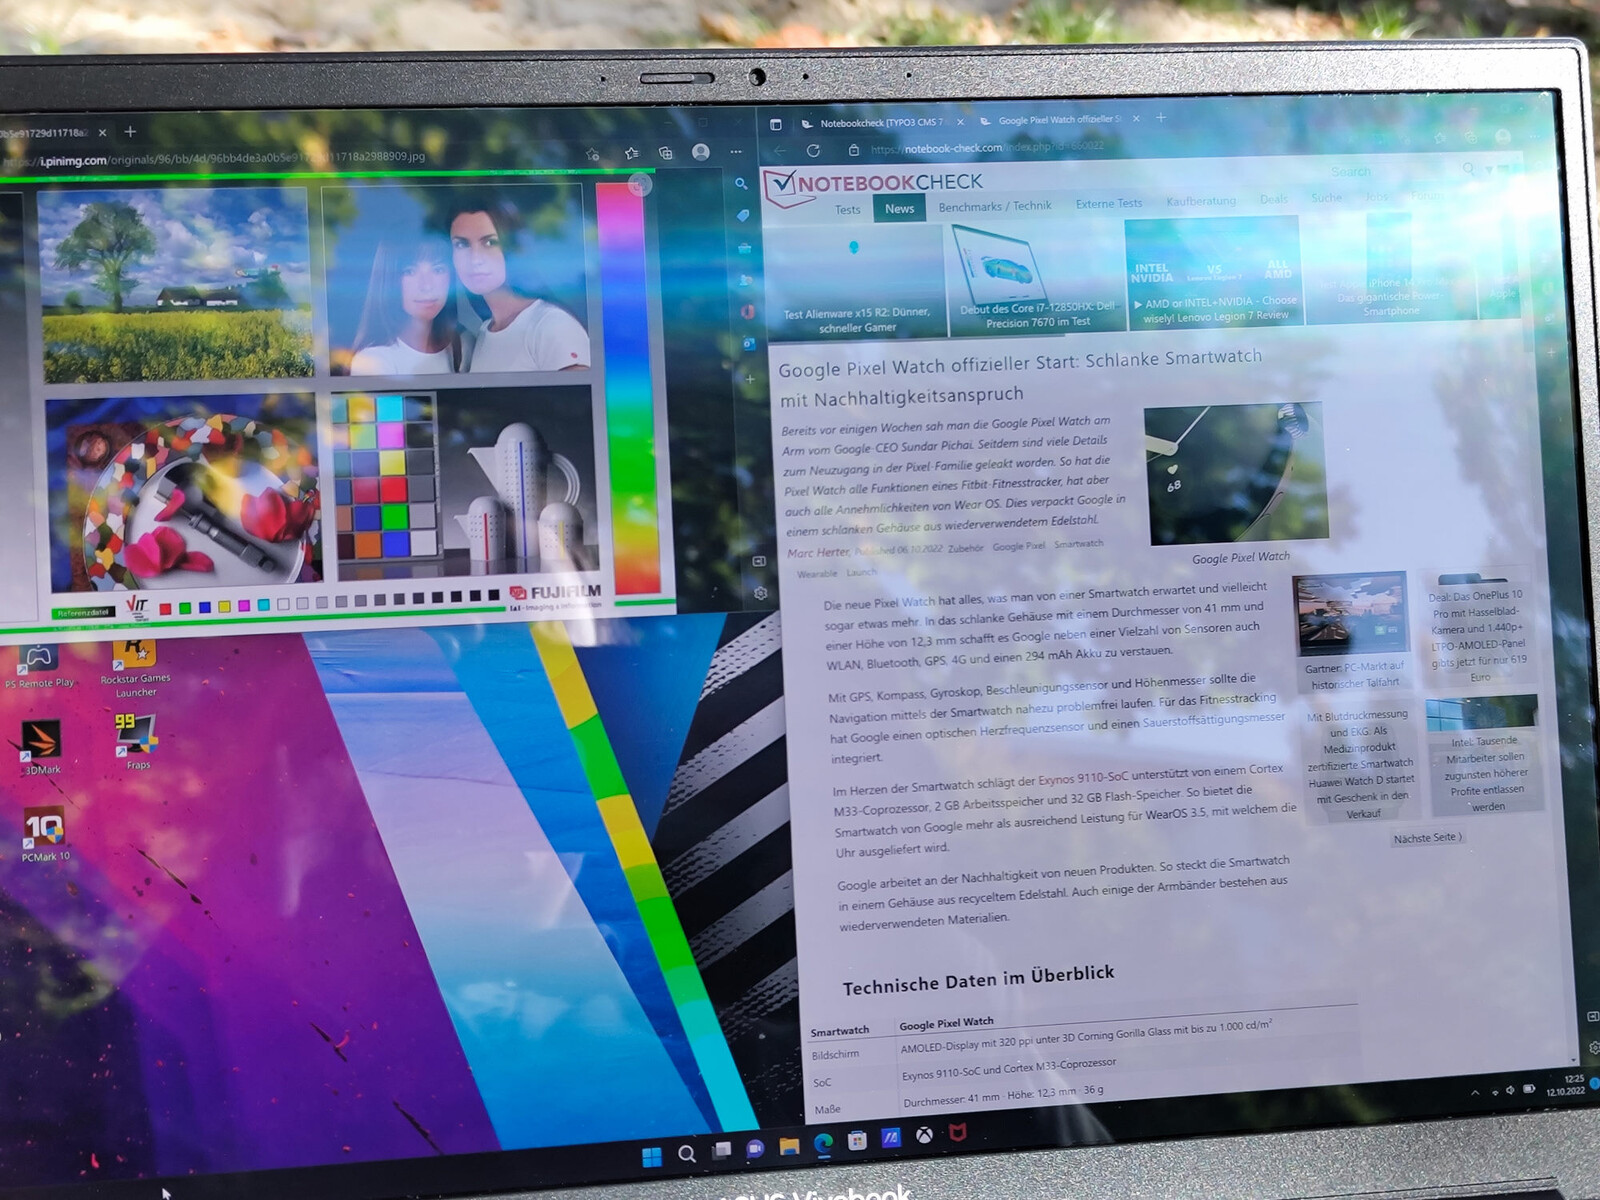
Trots den höga maximala ljusstyrkan är den blanka OLED-skärmen inte lämplig för utomhusbruk. Bländning och reflektioner försämrar den upplevda bildkvaliteten, särskilt när solen skiner. Vid särskilt ogynnsamma vinklar under solen eller andra starka ljuskällor visar OLED-skärmen de karakteristiska, gröna brytningsmönstren.
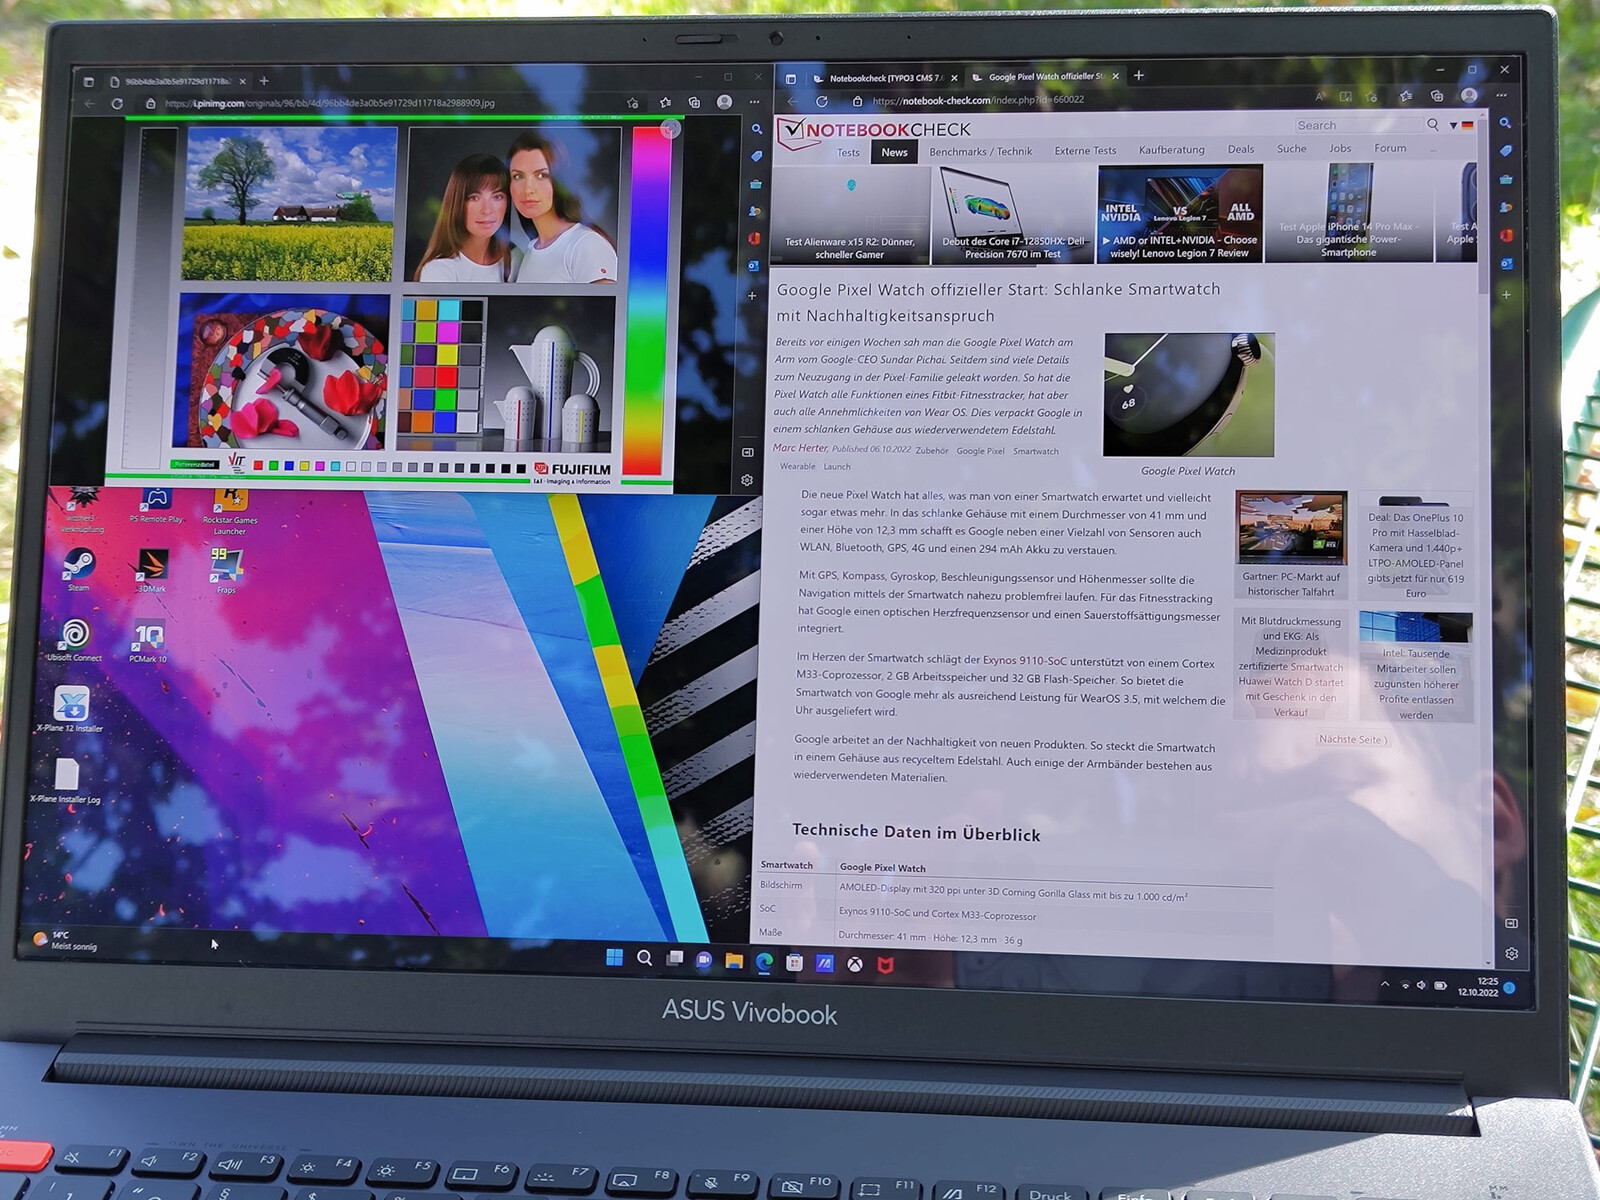
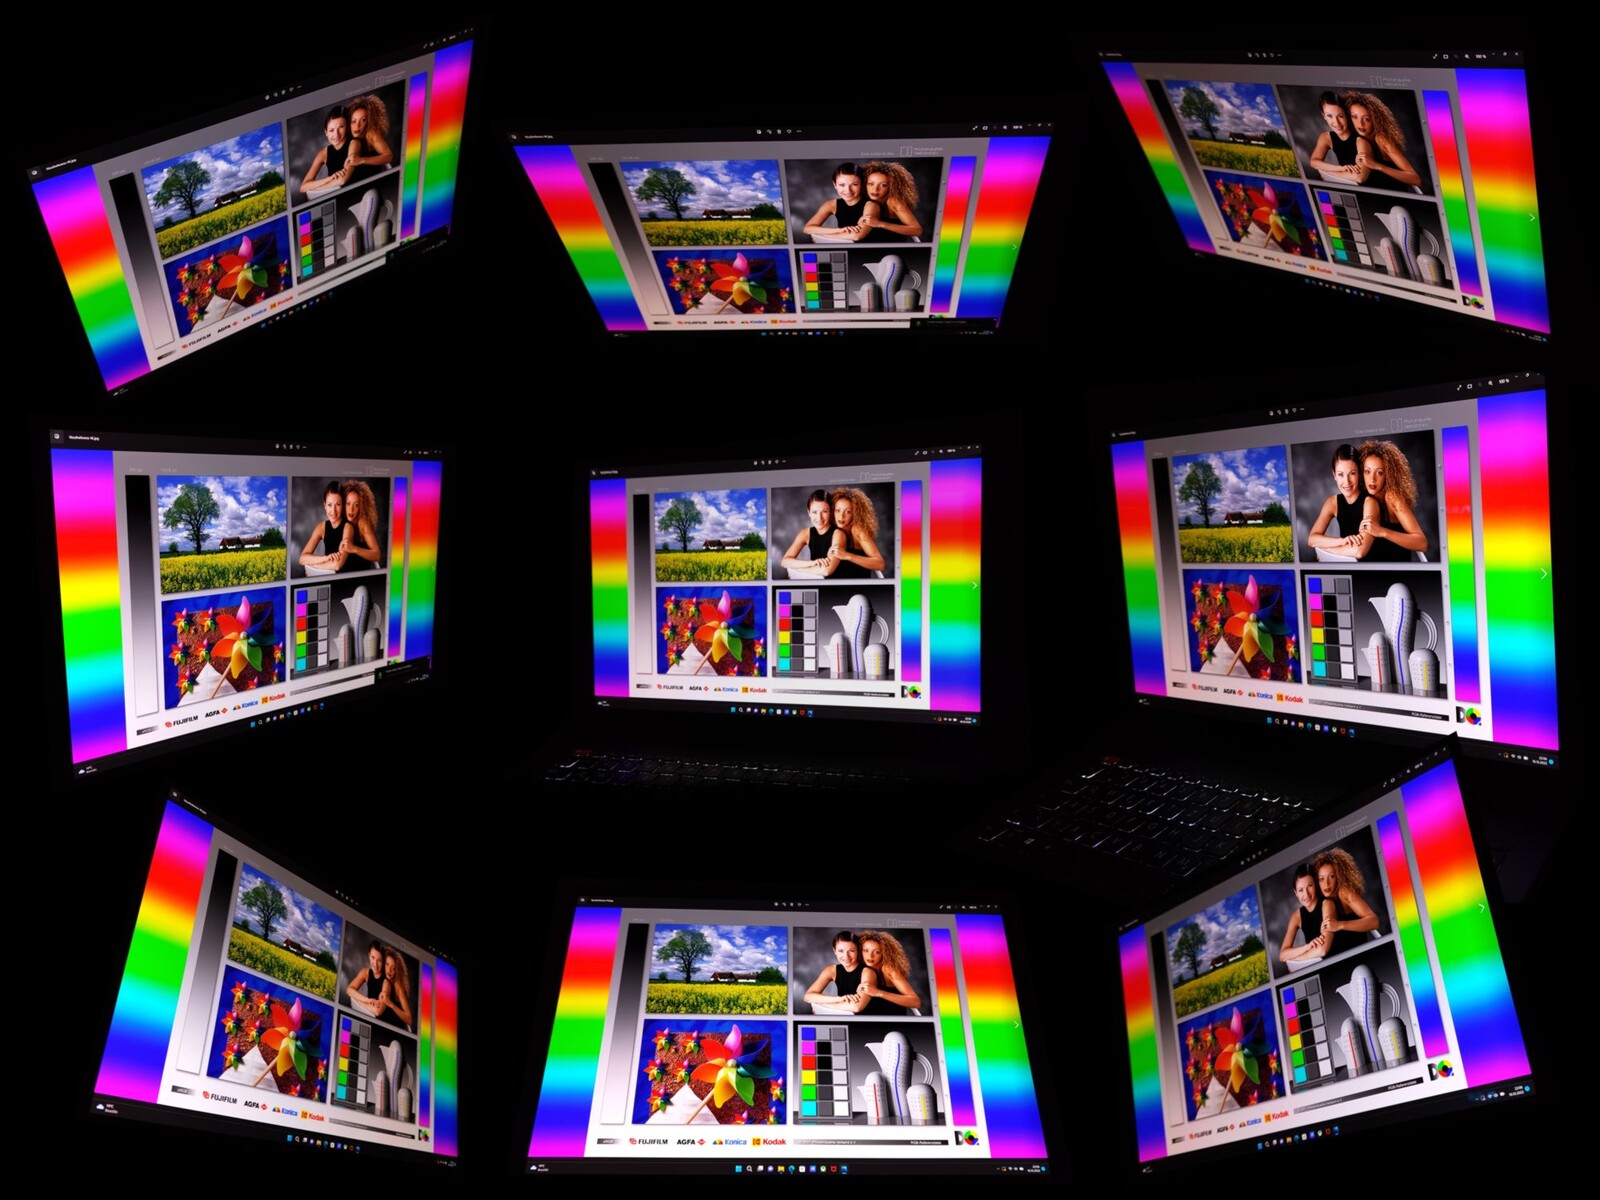
16-tumsskärmen visar inga svagheter i vår analys av betraktningsvinkeln. Även från extrema vinklar är skärmens upplevda ljusstyrka och färgprecision utmärkt.
Prestanda - Glädje och sorg med Nvidia Studio-drivrutinerna
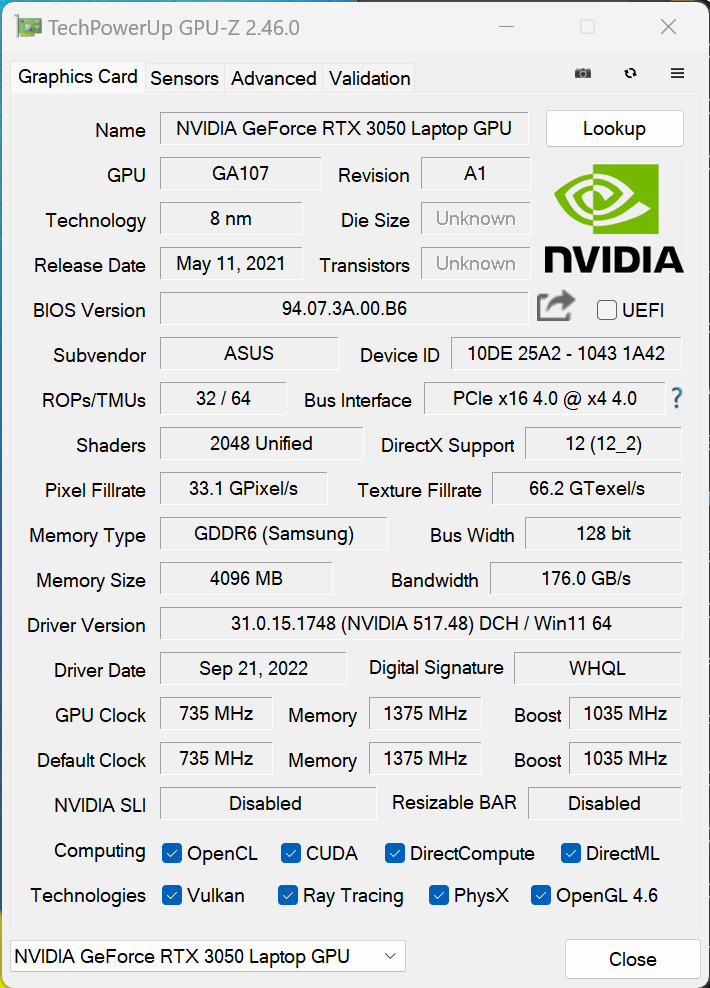
Det finns olika konfigurationer av Asus Vivobook Pro 16X OLED tillgängliga. Förutom Intel-processorer i 11:e och 12:e generationen erbjuder tillverkaren även processorer i AMD-Ryzen-5000- och AMD-Ryzen-6000-serien. DGPU-alternativen sträcker sig från Nvidia GeForce RTX 3050 upp till 3070 Ti GPU.
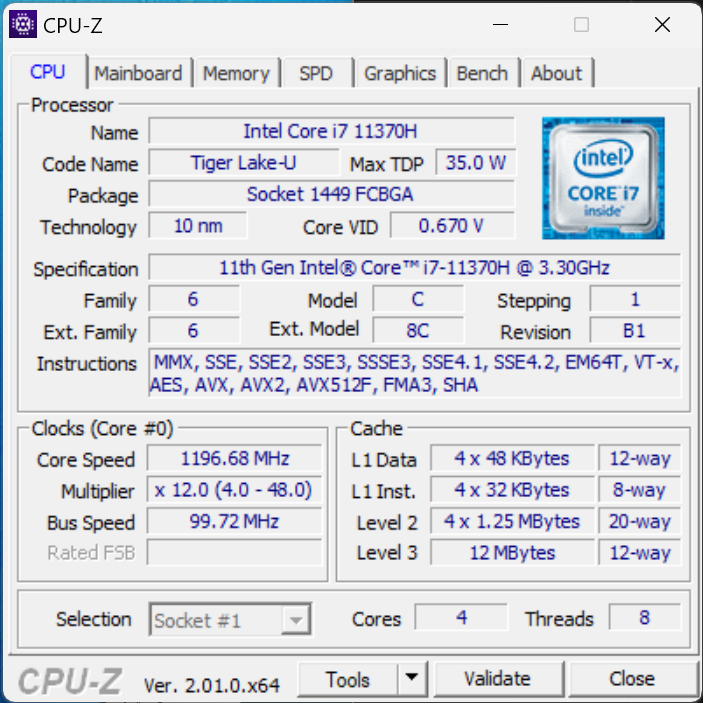
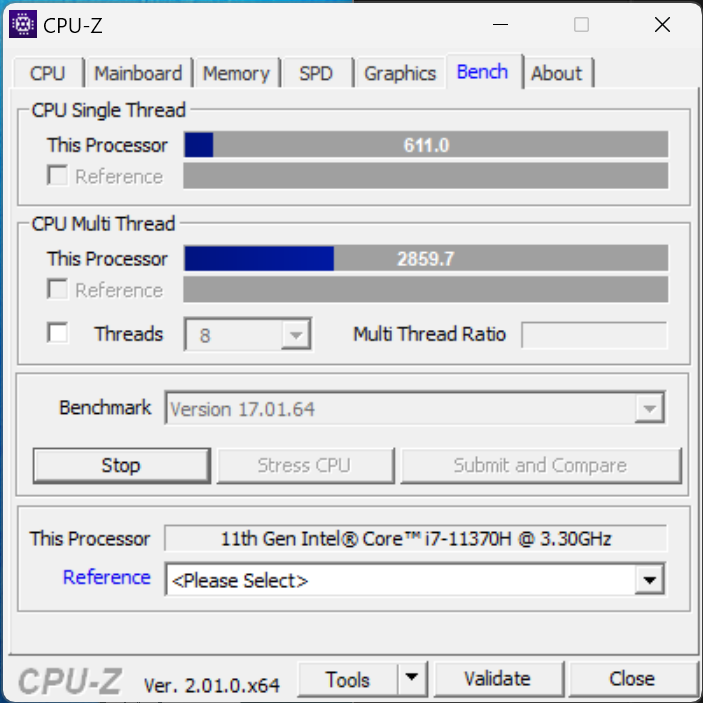
Vår konfiguration bygger på en Intel Core i7 11370H CPU, en GeForce RTX 3050 GPU och 16 GB RAM.
Provningsförhållanden
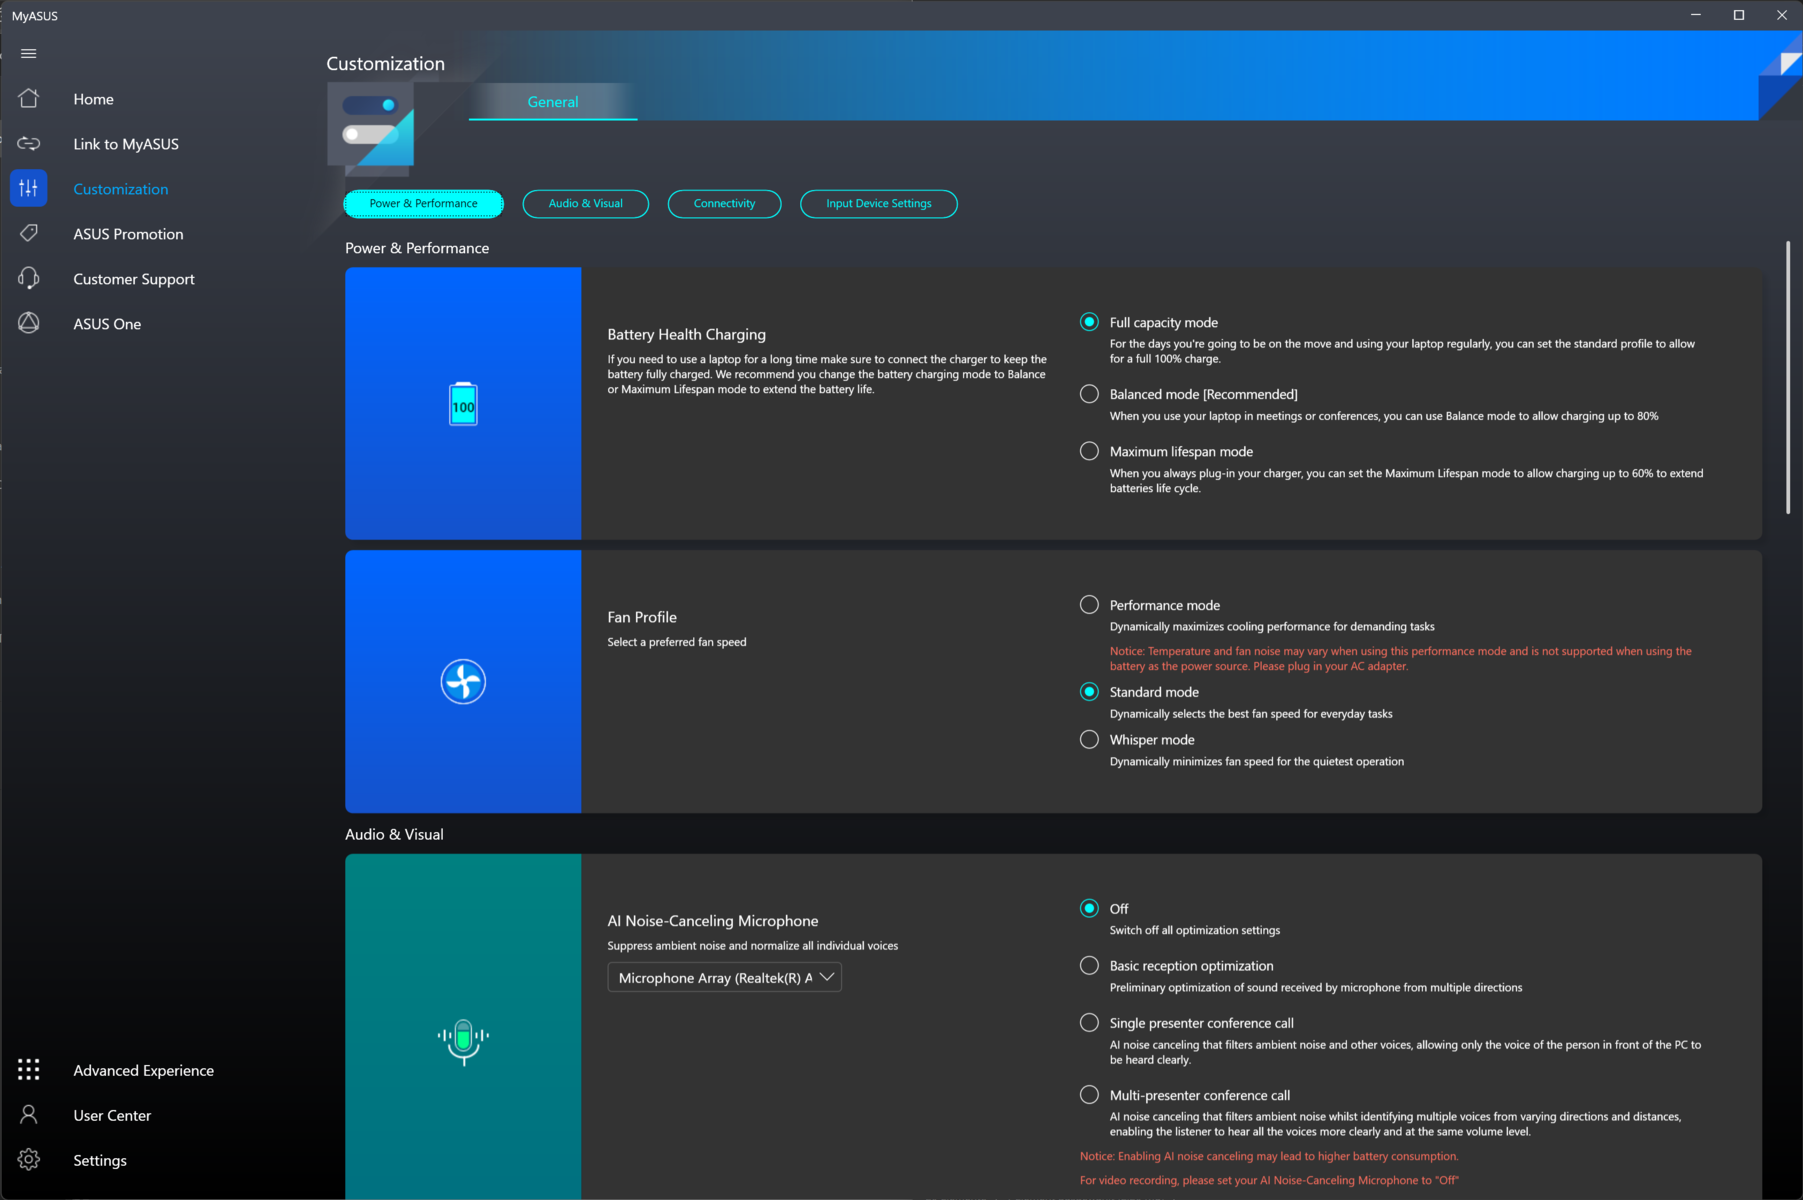
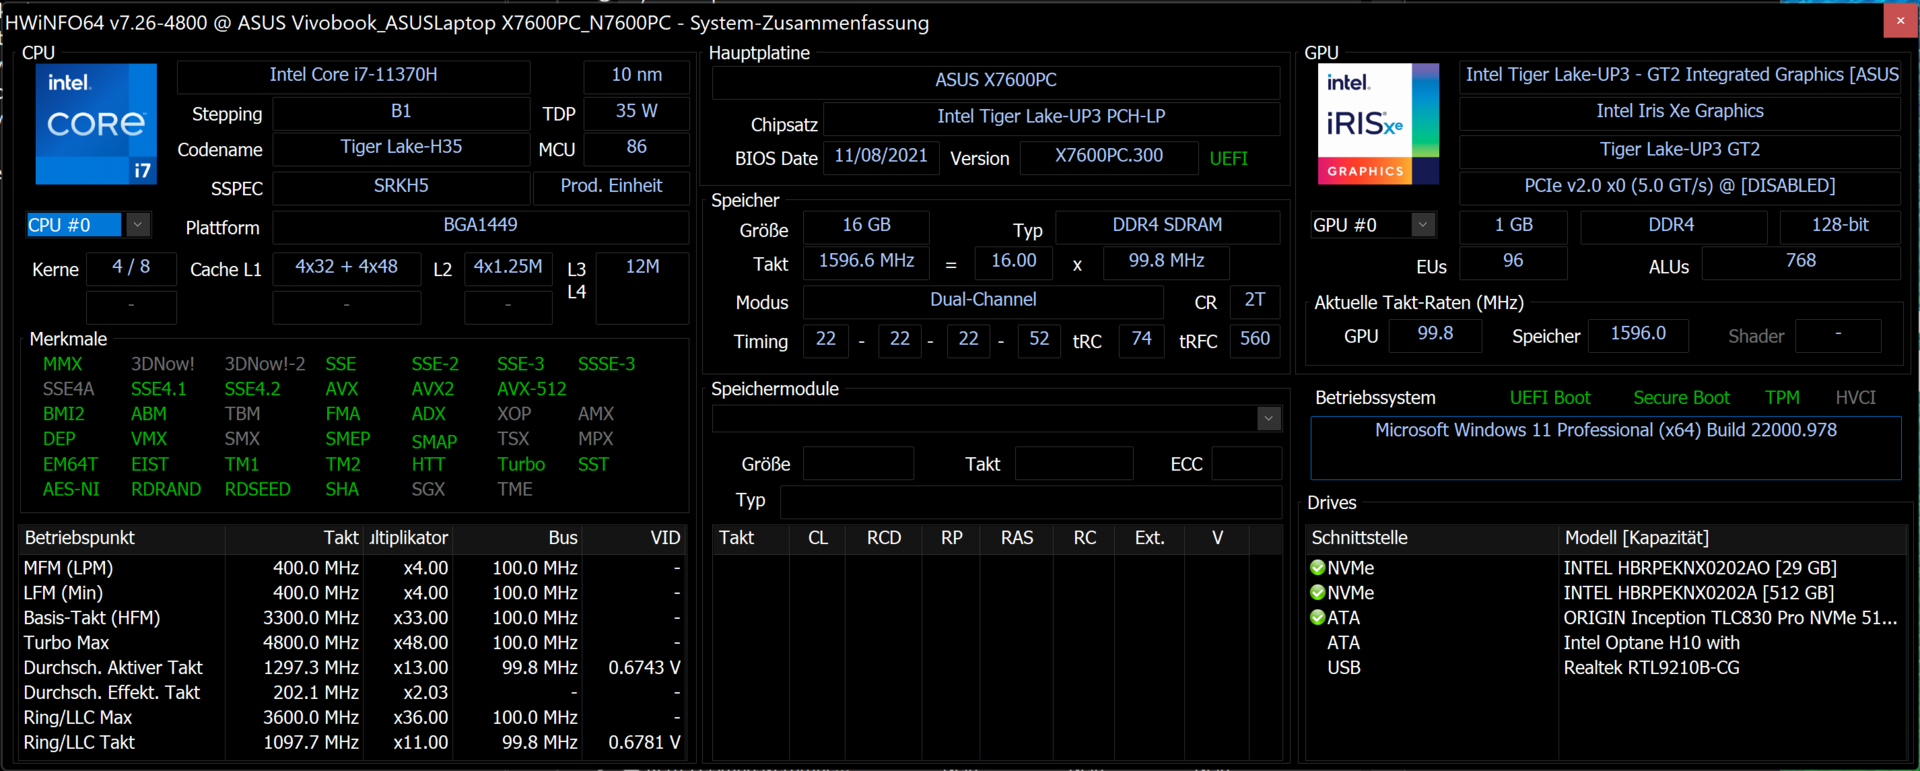
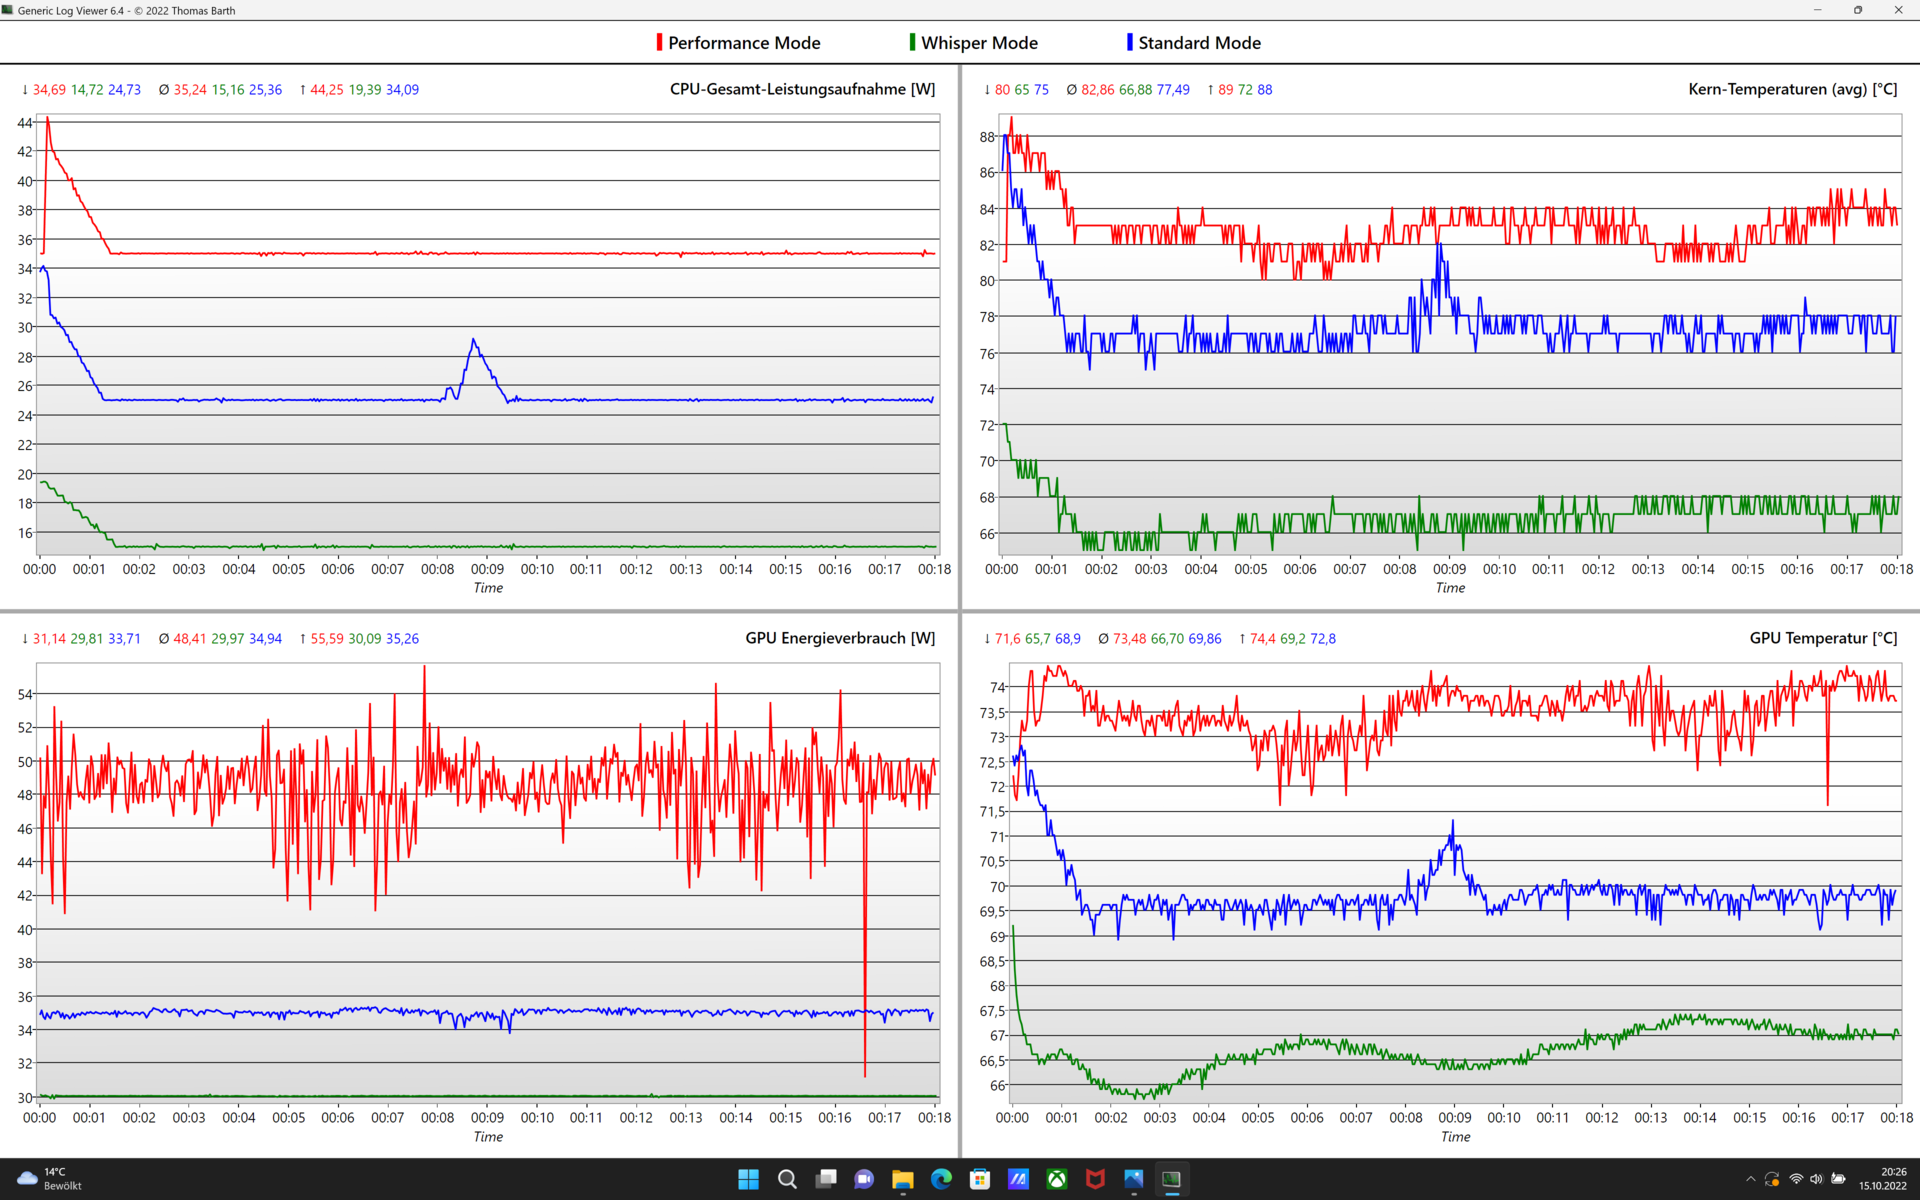
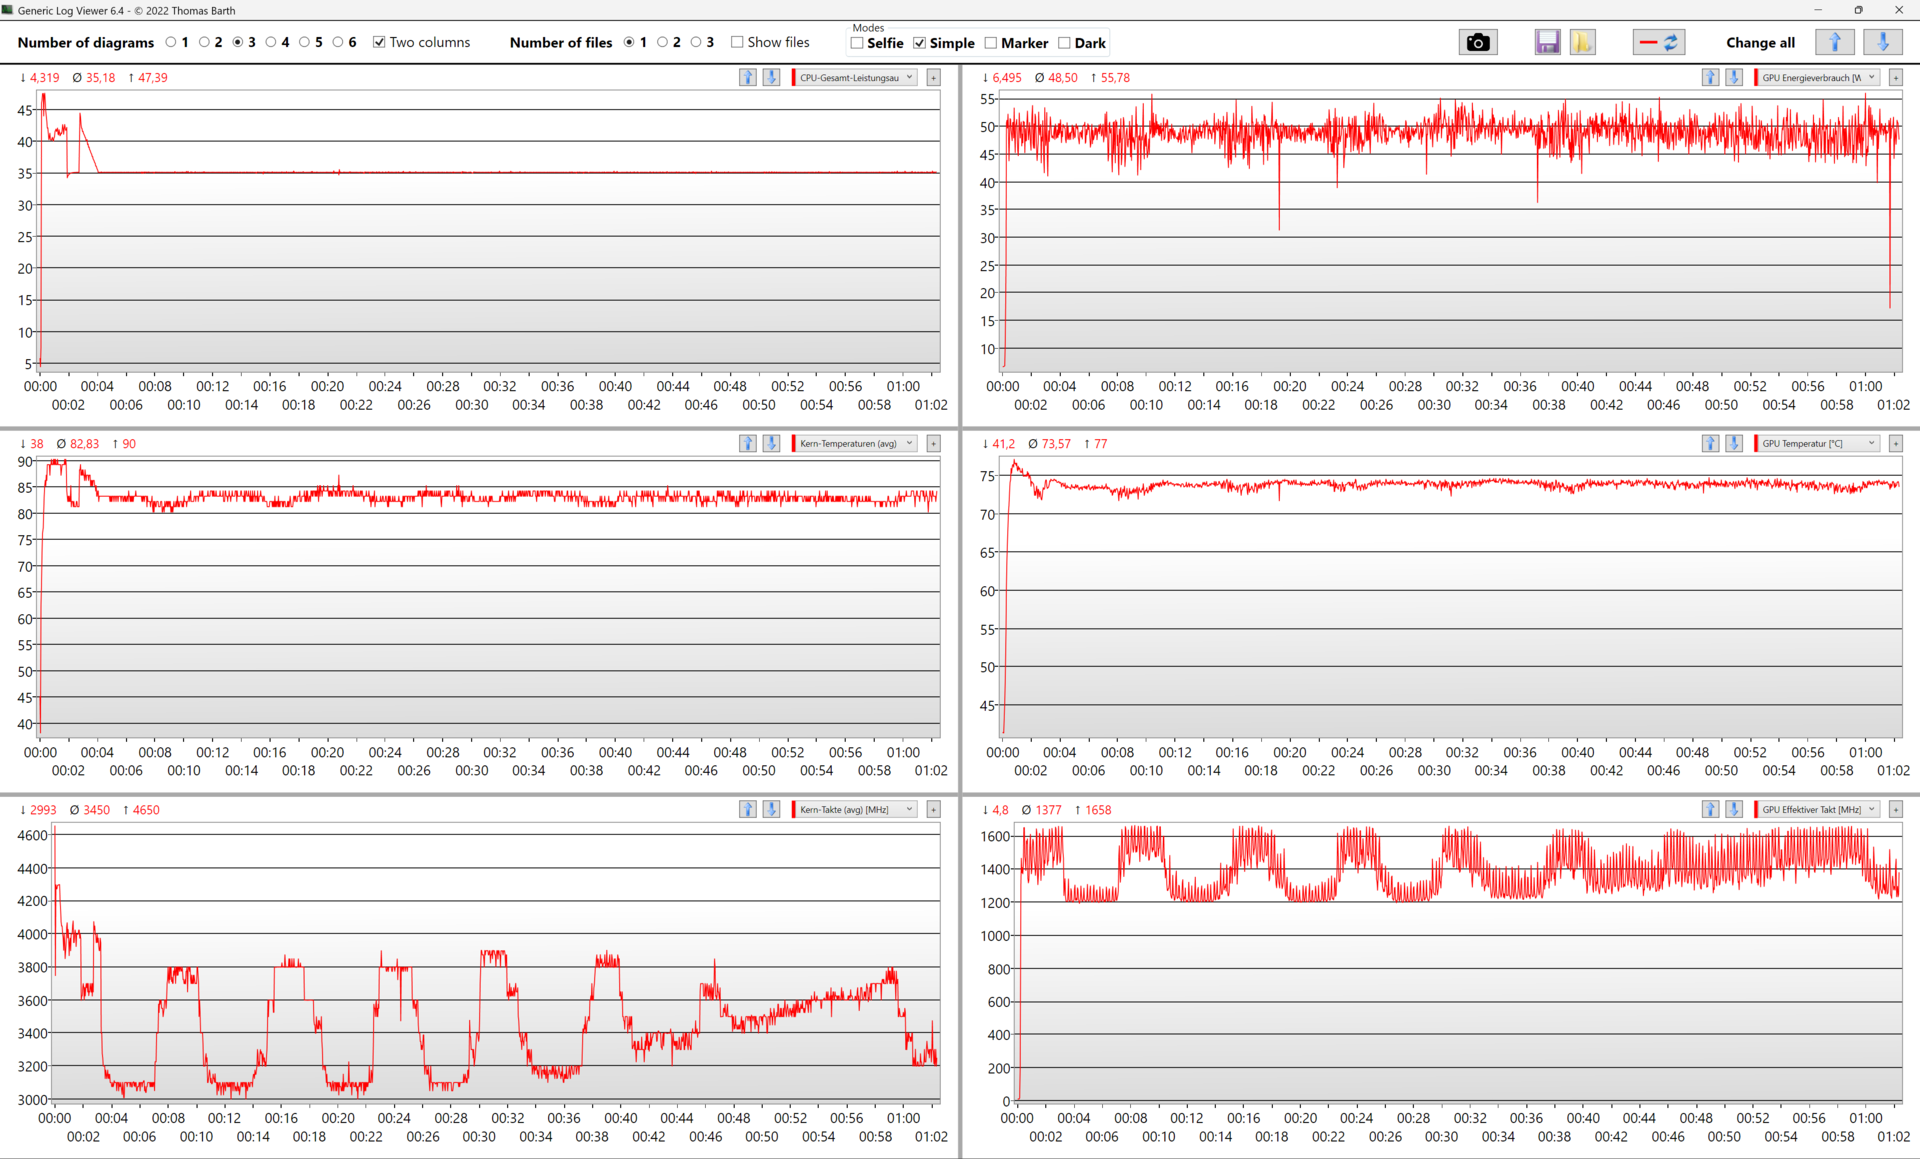
När det gäller den bärbara datorns effektinställningar använder Asus värden som i vissa fall överskrider Intels rekommenderade TDP. Enligt våra loggar ärIntel Core i7 11370Hupp till 45 W under korta perioder. Processorns energiförbrukning kan dock sjunka ner till 25 W, beroende på fläktinställningen. Den dedikerade Nvidia GeForce RTX 3050 GPU:n i Vivobook är begränsad till 50 watt. Modellen verkar vara den mindre Max-Q-varianten av grafikkortet. För att dra hela 50 watt måste grafikkortet använda sig av den effektbudget som det delar med processorn. Den kombinerade förbrukningen får inte överstiga 85 watt i prestandaläge. Samtidigt tillåter standardlägena och whisper-lägena en kombinerad förbrukning på endast 60 respektive 45 watt.
Vi valde Asus prestandaläge innan vi utförde följande benchmarks. För att fastställa batteritiden valde vi energisparläget. För våra bullertester använde vi alla tre fläktlägen.
Processor
Vår testperiod använder en Intel Core i7-11370H-processor. Den här processorn är utformad för smala, men ändå kraftfulla bärbara datorer och TDP kan konfigureras relativt fritt. Med 35 watt överskrider Asus till och med Intels högsta rekommenderade värde. Detta värde uppnås dock endast när endast CPU:n stressas och även då begränsat till bara några minuter. 55 watt boostprestanda innebär att Intel SoC:n har mycket utrymme. Med detta sagt är Asus Vivobook Pro mer av en sprinter än en maratonlöpare. Den höga prestandanivån, som den bärbara datorn kan nå med 11370H, sjunker snabbt efter en kort tid. I7:an från 11:e generationen kan inte heller konkurrera med de betydligt kraftfullare processorerna från Intels 12:e generation.
Eftersom normal användning oftast kräver kortvariga prestandaströmmar är Vivobook behagligt responsiv vid daglig användning. Däremot hamnar den bärbara multimediebärbara datorn på efterkälken i benchmarks vid långvarig belastning.
Cinebench R15 Multi Loop
Cinebench R23: Multi Core | Single Core
Cinebench R20: CPU (Multi Core) | CPU (Single Core)
Cinebench R15: CPU Multi 64Bit | CPU Single 64Bit
Blender: v2.79 BMW27 CPU
7-Zip 18.03: 7z b 4 | 7z b 4 -mmt1
Geekbench 5.5: Multi-Core | Single-Core
HWBOT x265 Benchmark v2.2: 4k Preset
LibreOffice : 20 Documents To PDF
R Benchmark 2.5: Overall mean
| CPU Performance rating | |
| Genomsnitt av klass Multimedia | |
| MSI Summit E16 Flip A12UDT-031 | |
| Lenovo ThinkPad X1 Extreme G4-20Y5CTO1WW (3050 Ti) | |
| Schenker XMG Focus 15 | |
| Dell Inspiron 16 Plus 7610 -2! | |
| Microsoft Surface Laptop Studio i7 RTX 3050 Ti | |
| Genomsnitt Intel Core i7-11370H | |
| Xiaomi Mi NoteBook Pro | |
| Asus VivoBook Pro 16X OLED N7600PC-L2026X | |
| Cinebench R23 / Multi Core | |
| Genomsnitt av klass Multimedia (4861 - 33362, n=80, senaste 2 åren) | |
| MSI Summit E16 Flip A12UDT-031 | |
| Lenovo ThinkPad X1 Extreme G4-20Y5CTO1WW (3050 Ti) | |
| Schenker XMG Focus 15 | |
| Dell Inspiron 16 Plus 7610 | |
| Microsoft Surface Laptop Studio i7 RTX 3050 Ti | |
| Genomsnitt Intel Core i7-11370H (3696 - 6646, n=12) | |
| Xiaomi Mi NoteBook Pro | |
| Asus VivoBook Pro 16X OLED N7600PC-L2026X | |
| Cinebench R23 / Single Core | |
| Genomsnitt av klass Multimedia (1128 - 2459, n=72, senaste 2 åren) | |
| MSI Summit E16 Flip A12UDT-031 | |
| Asus VivoBook Pro 16X OLED N7600PC-L2026X | |
| Lenovo ThinkPad X1 Extreme G4-20Y5CTO1WW (3050 Ti) | |
| Dell Inspiron 16 Plus 7610 | |
| Microsoft Surface Laptop Studio i7 RTX 3050 Ti | |
| Xiaomi Mi NoteBook Pro | |
| Genomsnitt Intel Core i7-11370H (1081 - 1556, n=11) | |
| Schenker XMG Focus 15 | |
| Cinebench R20 / CPU (Multi Core) | |
| Genomsnitt av klass Multimedia (1887 - 12912, n=63, senaste 2 åren) | |
| MSI Summit E16 Flip A12UDT-031 | |
| Lenovo ThinkPad X1 Extreme G4-20Y5CTO1WW (3050 Ti) | |
| Schenker XMG Focus 15 | |
| Dell Inspiron 16 Plus 7610 | |
| Microsoft Surface Laptop Studio i7 RTX 3050 Ti | |
| Genomsnitt Intel Core i7-11370H (1438 - 2578, n=11) | |
| Xiaomi Mi NoteBook Pro | |
| Asus VivoBook Pro 16X OLED N7600PC-L2026X | |
| Cinebench R20 / CPU (Single Core) | |
| Genomsnitt av klass Multimedia (425 - 853, n=63, senaste 2 åren) | |
| MSI Summit E16 Flip A12UDT-031 | |
| Asus VivoBook Pro 16X OLED N7600PC-L2026X | |
| Lenovo ThinkPad X1 Extreme G4-20Y5CTO1WW (3050 Ti) | |
| Dell Inspiron 16 Plus 7610 | |
| Microsoft Surface Laptop Studio i7 RTX 3050 Ti | |
| Genomsnitt Intel Core i7-11370H (475 - 601, n=11) | |
| Xiaomi Mi NoteBook Pro | |
| Schenker XMG Focus 15 | |
| Cinebench R15 / CPU Multi 64Bit | |
| Genomsnitt av klass Multimedia (856 - 5224, n=67, senaste 2 åren) | |
| MSI Summit E16 Flip A12UDT-031 | |
| Lenovo ThinkPad X1 Extreme G4-20Y5CTO1WW (3050 Ti) | |
| Schenker XMG Focus 15 | |
| Dell Inspiron 16 Plus 7610 | |
| Asus VivoBook Pro 16X OLED N7600PC-L2026X | |
| Microsoft Surface Laptop Studio i7 RTX 3050 Ti | |
| Genomsnitt Intel Core i7-11370H (606 - 1086, n=17) | |
| Xiaomi Mi NoteBook Pro | |
| Cinebench R15 / CPU Single 64Bit | |
| Genomsnitt av klass Multimedia (184.8 - 326, n=65, senaste 2 åren) | |
| MSI Summit E16 Flip A12UDT-031 | |
| Lenovo ThinkPad X1 Extreme G4-20Y5CTO1WW (3050 Ti) | |
| Dell Inspiron 16 Plus 7610 | |
| Asus VivoBook Pro 16X OLED N7600PC-L2026X | |
| Asus VivoBook Pro 16X OLED N7600PC-L2026X | |
| Microsoft Surface Laptop Studio i7 RTX 3050 Ti | |
| Xiaomi Mi NoteBook Pro | |
| Genomsnitt Intel Core i7-11370H (162.9 - 233, n=15) | |
| Schenker XMG Focus 15 | |
| Blender / v2.79 BMW27 CPU | |
| Xiaomi Mi NoteBook Pro | |
| Genomsnitt Intel Core i7-11370H (432 - 762, n=11) | |
| Microsoft Surface Laptop Studio i7 RTX 3050 Ti | |
| Asus VivoBook Pro 16X OLED N7600PC-L2026X | |
| MSI Summit E16 Flip A12UDT-031 | |
| Schenker XMG Focus 15 | |
| Dell Inspiron 16 Plus 7610 | |
| Lenovo ThinkPad X1 Extreme G4-20Y5CTO1WW (3050 Ti) | |
| Genomsnitt av klass Multimedia (100 - 557, n=64, senaste 2 åren) | |
| 7-Zip 18.03 / 7z b 4 | |
| Genomsnitt av klass Multimedia (29095 - 130368, n=61, senaste 2 åren) | |
| Lenovo ThinkPad X1 Extreme G4-20Y5CTO1WW (3050 Ti) | |
| Schenker XMG Focus 15 | |
| Dell Inspiron 16 Plus 7610 | |
| MSI Summit E16 Flip A12UDT-031 | |
| Asus VivoBook Pro 16X OLED N7600PC-L2026X | |
| Microsoft Surface Laptop Studio i7 RTX 3050 Ti | |
| Genomsnitt Intel Core i7-11370H (18961 - 28520, n=11) | |
| Xiaomi Mi NoteBook Pro | |
| 7-Zip 18.03 / 7z b 4 -mmt1 | |
| Genomsnitt av klass Multimedia (3666 - 7545, n=62, senaste 2 åren) | |
| Lenovo ThinkPad X1 Extreme G4-20Y5CTO1WW (3050 Ti) | |
| Dell Inspiron 16 Plus 7610 | |
| Asus VivoBook Pro 16X OLED N7600PC-L2026X | |
| Xiaomi Mi NoteBook Pro | |
| Genomsnitt Intel Core i7-11370H (5074 - 5550, n=11) | |
| MSI Summit E16 Flip A12UDT-031 | |
| Schenker XMG Focus 15 | |
| Microsoft Surface Laptop Studio i7 RTX 3050 Ti | |
| Geekbench 5.5 / Multi-Core | |
| Genomsnitt av klass Multimedia (4652 - 20422, n=61, senaste 2 åren) | |
| MSI Summit E16 Flip A12UDT-031 | |
| Schenker XMG Focus 15 | |
| Lenovo ThinkPad X1 Extreme G4-20Y5CTO1WW (3050 Ti) | |
| Microsoft Surface Laptop Studio i7 RTX 3050 Ti | |
| Genomsnitt Intel Core i7-11370H (3828 - 6115, n=10) | |
| Xiaomi Mi NoteBook Pro | |
| Asus VivoBook Pro 16X OLED N7600PC-L2026X | |
| Geekbench 5.5 / Single-Core | |
| Genomsnitt av klass Multimedia (805 - 2974, n=61, senaste 2 åren) | |
| MSI Summit E16 Flip A12UDT-031 | |
| Lenovo ThinkPad X1 Extreme G4-20Y5CTO1WW (3050 Ti) | |
| Xiaomi Mi NoteBook Pro | |
| Microsoft Surface Laptop Studio i7 RTX 3050 Ti | |
| Genomsnitt Intel Core i7-11370H (1376 - 1607, n=10) | |
| Asus VivoBook Pro 16X OLED N7600PC-L2026X | |
| Schenker XMG Focus 15 | |
| HWBOT x265 Benchmark v2.2 / 4k Preset | |
| Genomsnitt av klass Multimedia (5.26 - 36.1, n=62, senaste 2 åren) | |
| Schenker XMG Focus 15 | |
| Lenovo ThinkPad X1 Extreme G4-20Y5CTO1WW (3050 Ti) | |
| Dell Inspiron 16 Plus 7610 | |
| MSI Summit E16 Flip A12UDT-031 | |
| Microsoft Surface Laptop Studio i7 RTX 3050 Ti | |
| Genomsnitt Intel Core i7-11370H (4.98 - 8.82, n=11) | |
| Xiaomi Mi NoteBook Pro | |
| Asus VivoBook Pro 16X OLED N7600PC-L2026X | |
| LibreOffice / 20 Documents To PDF | |
| Microsoft Surface Laptop Studio i7 RTX 3050 Ti | |
| Asus VivoBook Pro 16X OLED N7600PC-L2026X | |
| MSI Summit E16 Flip A12UDT-031 | |
| Genomsnitt av klass Multimedia (23.9 - 146.7, n=63, senaste 2 åren) | |
| Schenker XMG Focus 15 | |
| Dell Inspiron 16 Plus 7610 | |
| Genomsnitt Intel Core i7-11370H (23.6 - 56.5, n=11) | |
| Xiaomi Mi NoteBook Pro | |
| Lenovo ThinkPad X1 Extreme G4-20Y5CTO1WW (3050 Ti) | |
| R Benchmark 2.5 / Overall mean | |
| Schenker XMG Focus 15 | |
| Microsoft Surface Laptop Studio i7 RTX 3050 Ti | |
| Xiaomi Mi NoteBook Pro | |
| Genomsnitt Intel Core i7-11370H (0.544 - 0.596, n=11) | |
| Dell Inspiron 16 Plus 7610 | |
| Asus VivoBook Pro 16X OLED N7600PC-L2026X | |
| Lenovo ThinkPad X1 Extreme G4-20Y5CTO1WW (3050 Ti) | |
| MSI Summit E16 Flip A12UDT-031 | |
| Genomsnitt av klass Multimedia (0.3604 - 0.947, n=62, senaste 2 åren) | |
* ... mindre är bättre
AIDA64: FP32 Ray-Trace | FPU Julia | CPU SHA3 | CPU Queen | FPU SinJulia | FPU Mandel | CPU AES | CPU ZLib | FP64 Ray-Trace | CPU PhotoWorxx
| Performance rating | |
| Genomsnitt av klass Multimedia | |
| Lenovo ThinkPad X1 Extreme G4-20Y5CTO1WW (3050 Ti) | |
| MSI Summit E16 Flip A12UDT-031 | |
| Genomsnitt Intel Core i7-11370H | |
| Microsoft Surface Laptop Studio i7 RTX 3050 Ti | |
| Xiaomi Mi NoteBook Pro | |
| Asus VivoBook Pro 16X OLED N7600PC-L2026X | |
| AIDA64 / FP32 Ray-Trace | |
| Genomsnitt av klass Multimedia (2214 - 50388, n=59, senaste 2 åren) | |
| Lenovo ThinkPad X1 Extreme G4-20Y5CTO1WW (3050 Ti) | |
| MSI Summit E16 Flip A12UDT-031 | |
| Microsoft Surface Laptop Studio i7 RTX 3050 Ti | |
| Genomsnitt Intel Core i7-11370H (5204 - 8413, n=10) | |
| Xiaomi Mi NoteBook Pro | |
| Asus VivoBook Pro 16X OLED N7600PC-L2026X | |
| AIDA64 / FPU Julia | |
| Genomsnitt av klass Multimedia (12867 - 201874, n=60, senaste 2 åren) | |
| MSI Summit E16 Flip A12UDT-031 | |
| Lenovo ThinkPad X1 Extreme G4-20Y5CTO1WW (3050 Ti) | |
| Microsoft Surface Laptop Studio i7 RTX 3050 Ti | |
| Genomsnitt Intel Core i7-11370H (23958 - 34020, n=10) | |
| Xiaomi Mi NoteBook Pro | |
| Asus VivoBook Pro 16X OLED N7600PC-L2026X | |
| AIDA64 / CPU SHA3 | |
| Lenovo ThinkPad X1 Extreme G4-20Y5CTO1WW (3050 Ti) | |
| Genomsnitt av klass Multimedia (653 - 8623, n=60, senaste 2 åren) | |
| MSI Summit E16 Flip A12UDT-031 | |
| Genomsnitt Intel Core i7-11370H (1656 - 2297, n=10) | |
| Microsoft Surface Laptop Studio i7 RTX 3050 Ti | |
| Xiaomi Mi NoteBook Pro | |
| Asus VivoBook Pro 16X OLED N7600PC-L2026X | |
| AIDA64 / CPU Queen | |
| MSI Summit E16 Flip A12UDT-031 | |
| Lenovo ThinkPad X1 Extreme G4-20Y5CTO1WW (3050 Ti) | |
| Genomsnitt av klass Multimedia (13483 - 181505, n=48, senaste 2 åren) | |
| Xiaomi Mi NoteBook Pro | |
| Genomsnitt Intel Core i7-11370H (42086 - 52930, n=10) | |
| Microsoft Surface Laptop Studio i7 RTX 3050 Ti | |
| Asus VivoBook Pro 16X OLED N7600PC-L2026X | |
| AIDA64 / FPU SinJulia | |
| Lenovo ThinkPad X1 Extreme G4-20Y5CTO1WW (3050 Ti) | |
| Genomsnitt av klass Multimedia (1240 - 28794, n=60, senaste 2 åren) | |
| MSI Summit E16 Flip A12UDT-031 | |
| Xiaomi Mi NoteBook Pro | |
| Genomsnitt Intel Core i7-11370H (3755 - 5027, n=10) | |
| Microsoft Surface Laptop Studio i7 RTX 3050 Ti | |
| Asus VivoBook Pro 16X OLED N7600PC-L2026X | |
| AIDA64 / FPU Mandel | |
| Genomsnitt av klass Multimedia (6395 - 105740, n=59, senaste 2 åren) | |
| Lenovo ThinkPad X1 Extreme G4-20Y5CTO1WW (3050 Ti) | |
| MSI Summit E16 Flip A12UDT-031 | |
| Genomsnitt Intel Core i7-11370H (14433 - 20417, n=10) | |
| Microsoft Surface Laptop Studio i7 RTX 3050 Ti | |
| Xiaomi Mi NoteBook Pro | |
| Asus VivoBook Pro 16X OLED N7600PC-L2026X | |
| AIDA64 / CPU AES | |
| Lenovo ThinkPad X1 Extreme G4-20Y5CTO1WW (3050 Ti) | |
| Xiaomi Mi NoteBook Pro | |
| Genomsnitt Intel Core i7-11370H (44267 - 76866, n=10) | |
| Genomsnitt av klass Multimedia (13243 - 126790, n=60, senaste 2 åren) | |
| MSI Summit E16 Flip A12UDT-031 | |
| Asus VivoBook Pro 16X OLED N7600PC-L2026X | |
| Microsoft Surface Laptop Studio i7 RTX 3050 Ti | |
| AIDA64 / CPU ZLib | |
| Genomsnitt av klass Multimedia (167.2 - 2022, n=60, senaste 2 åren) | |
| MSI Summit E16 Flip A12UDT-031 | |
| Lenovo ThinkPad X1 Extreme G4-20Y5CTO1WW (3050 Ti) | |
| Xiaomi Mi NoteBook Pro | |
| Genomsnitt Intel Core i7-11370H (289 - 422, n=10) | |
| Microsoft Surface Laptop Studio i7 RTX 3050 Ti | |
| Asus VivoBook Pro 16X OLED N7600PC-L2026X | |
| AIDA64 / FP64 Ray-Trace | |
| Genomsnitt av klass Multimedia (1014 - 26875, n=60, senaste 2 åren) | |
| Lenovo ThinkPad X1 Extreme G4-20Y5CTO1WW (3050 Ti) | |
| MSI Summit E16 Flip A12UDT-031 | |
| Genomsnitt Intel Core i7-11370H (2756 - 4551, n=10) | |
| Microsoft Surface Laptop Studio i7 RTX 3050 Ti | |
| Xiaomi Mi NoteBook Pro | |
| Asus VivoBook Pro 16X OLED N7600PC-L2026X | |
| AIDA64 / CPU PhotoWorxx | |
| Genomsnitt av klass Multimedia (12860 - 88154, n=60, senaste 2 åren) | |
| MSI Summit E16 Flip A12UDT-031 | |
| Microsoft Surface Laptop Studio i7 RTX 3050 Ti | |
| Genomsnitt Intel Core i7-11370H (15892 - 40069, n=10) | |
| Xiaomi Mi NoteBook Pro | |
| Asus VivoBook Pro 16X OLED N7600PC-L2026X | |
| Lenovo ThinkPad X1 Extreme G4-20Y5CTO1WW (3050 Ti) | |
Systemets prestanda
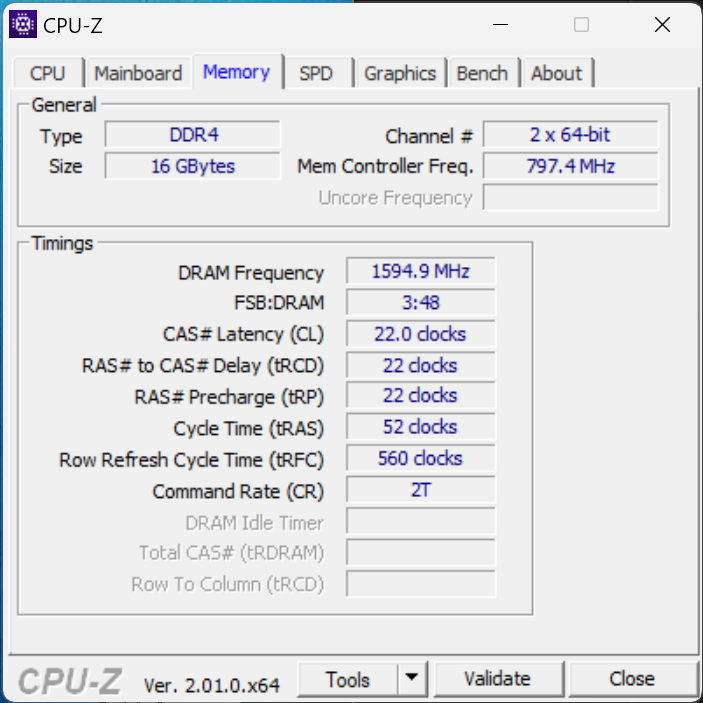
I våra benchmarks för systemprestanda uppnår Vivobook Pro 16X OLED överlag bra resultat. Multimediasystemet ligger långt över genomsnittet. Samtidigt kan Vivobook dock inte riktigt matcha de andra enheterna i vår jämförelse. Den bärbara datorn lider av en minskad prestanda i PCMark 10 och CrossMark på grund av två problem. Ett av dem är inställningen för prestandaprofilen som snabbt begränsar prestandapotentialen hos både CPU och GPU efter en kort tid och det andra problemet är den ganska långsamma hastigheten hos den bärbara datorns RAM-minne. Som ett resultat av detta är AIDA-minnestestresultaten relativt låga och latenserna höga.
Oavsett detta är Vivobook Pro mycket responsiv vid daglig användning och kan hantera tillfälliga krävande uppgifter utan problem. De flesta benchmarks belastar en bärbar dator betydligt hårdare än ett normalt arbetsflöde.
CrossMark: Overall | Productivity | Creativity | Responsiveness
| PCMark 10 / Score | |
| Genomsnitt av klass Multimedia (4325 - 10386, n=57, senaste 2 åren) | |
| Lenovo ThinkPad X1 Extreme G4-20Y5CTO1WW (3050 Ti) | |
| Schenker XMG Focus 15 | |
| Dell Inspiron 16 Plus 7610 | |
| MSI Summit E16 Flip A12UDT-031 | |
| Schenker Vision 14 | |
| Asus VivoBook Pro 16X OLED N7600PC-L2026X | |
| Genomsnitt Intel Core i7-11370H, NVIDIA GeForce RTX 3050 4GB Laptop GPU (n=1) | |
| Microsoft Surface Laptop Studio i7 RTX 3050 Ti | |
| Lenovo IdeaPad Slim 7i Pro 14IHU5 | |
| Xiaomi Mi NoteBook Pro | |
| PCMark 10 / Essentials | |
| Lenovo ThinkPad X1 Extreme G4-20Y5CTO1WW (3050 Ti) | |
| Genomsnitt av klass Multimedia (8025 - 11664, n=56, senaste 2 åren) | |
| Lenovo IdeaPad Slim 7i Pro 14IHU5 | |
| Schenker XMG Focus 15 | |
| Xiaomi Mi NoteBook Pro | |
| Dell Inspiron 16 Plus 7610 | |
| MSI Summit E16 Flip A12UDT-031 | |
| Schenker Vision 14 | |
| Asus VivoBook Pro 16X OLED N7600PC-L2026X | |
| Genomsnitt Intel Core i7-11370H, NVIDIA GeForce RTX 3050 4GB Laptop GPU (n=1) | |
| Microsoft Surface Laptop Studio i7 RTX 3050 Ti | |
| PCMark 10 / Productivity | |
| Genomsnitt av klass Multimedia (7323 - 18233, n=56, senaste 2 åren) | |
| Schenker Vision 14 | |
| Schenker XMG Focus 15 | |
| Asus VivoBook Pro 16X OLED N7600PC-L2026X | |
| Genomsnitt Intel Core i7-11370H, NVIDIA GeForce RTX 3050 4GB Laptop GPU (n=1) | |
| Lenovo ThinkPad X1 Extreme G4-20Y5CTO1WW (3050 Ti) | |
| Dell Inspiron 16 Plus 7610 | |
| Microsoft Surface Laptop Studio i7 RTX 3050 Ti | |
| MSI Summit E16 Flip A12UDT-031 | |
| Xiaomi Mi NoteBook Pro | |
| Lenovo IdeaPad Slim 7i Pro 14IHU5 | |
| PCMark 10 / Digital Content Creation | |
| Genomsnitt av klass Multimedia (3651 - 16240, n=56, senaste 2 åren) | |
| Schenker XMG Focus 15 | |
| Lenovo ThinkPad X1 Extreme G4-20Y5CTO1WW (3050 Ti) | |
| Dell Inspiron 16 Plus 7610 | |
| MSI Summit E16 Flip A12UDT-031 | |
| Schenker Vision 14 | |
| Asus VivoBook Pro 16X OLED N7600PC-L2026X | |
| Genomsnitt Intel Core i7-11370H, NVIDIA GeForce RTX 3050 4GB Laptop GPU (n=1) | |
| Microsoft Surface Laptop Studio i7 RTX 3050 Ti | |
| Lenovo IdeaPad Slim 7i Pro 14IHU5 | |
| Xiaomi Mi NoteBook Pro | |
| CrossMark / Overall | |
| Genomsnitt av klass Multimedia (866 - 2728, n=66, senaste 2 åren) | |
| MSI Summit E16 Flip A12UDT-031 | |
| Schenker Vision 14 | |
| Microsoft Surface Laptop Studio i7 RTX 3050 Ti | |
| Xiaomi Mi NoteBook Pro | |
| Asus VivoBook Pro 16X OLED N7600PC-L2026X | |
| Genomsnitt Intel Core i7-11370H, NVIDIA GeForce RTX 3050 4GB Laptop GPU (n=1) | |
| CrossMark / Productivity | |
| Genomsnitt av klass Multimedia (931 - 2489, n=66, senaste 2 åren) | |
| MSI Summit E16 Flip A12UDT-031 | |
| Schenker Vision 14 | |
| Xiaomi Mi NoteBook Pro | |
| Microsoft Surface Laptop Studio i7 RTX 3050 Ti | |
| Asus VivoBook Pro 16X OLED N7600PC-L2026X | |
| Genomsnitt Intel Core i7-11370H, NVIDIA GeForce RTX 3050 4GB Laptop GPU (n=1) | |
| CrossMark / Creativity | |
| Genomsnitt av klass Multimedia (907 - 3465, n=66, senaste 2 åren) | |
| MSI Summit E16 Flip A12UDT-031 | |
| Microsoft Surface Laptop Studio i7 RTX 3050 Ti | |
| Schenker Vision 14 | |
| Xiaomi Mi NoteBook Pro | |
| Asus VivoBook Pro 16X OLED N7600PC-L2026X | |
| Genomsnitt Intel Core i7-11370H, NVIDIA GeForce RTX 3050 4GB Laptop GPU (n=1) | |
| CrossMark / Responsiveness | |
| MSI Summit E16 Flip A12UDT-031 | |
| Genomsnitt av klass Multimedia (605 - 2024, n=66, senaste 2 åren) | |
| Schenker Vision 14 | |
| Xiaomi Mi NoteBook Pro | |
| Microsoft Surface Laptop Studio i7 RTX 3050 Ti | |
| Asus VivoBook Pro 16X OLED N7600PC-L2026X | |
| Genomsnitt Intel Core i7-11370H, NVIDIA GeForce RTX 3050 4GB Laptop GPU (n=1) | |
| PCMark 10 Score | 5619 poäng | |
Hjälp | ||
| AIDA64 / Memory Copy | |
| Genomsnitt av klass Multimedia (21158 - 132135, n=60, senaste 2 åren) | |
| MSI Summit E16 Flip A12UDT-031 | |
| Microsoft Surface Laptop Studio i7 RTX 3050 Ti | |
| Genomsnitt Intel Core i7-11370H (32035 - 64524, n=10) | |
| Lenovo ThinkPad X1 Extreme G4-20Y5CTO1WW (3050 Ti) | |
| Xiaomi Mi NoteBook Pro | |
| Asus VivoBook Pro 16X OLED N7600PC-L2026X | |
| AIDA64 / Memory Read | |
| Genomsnitt av klass Multimedia (19699 - 174586, n=60, senaste 2 åren) | |
| MSI Summit E16 Flip A12UDT-031 | |
| Microsoft Surface Laptop Studio i7 RTX 3050 Ti | |
| Genomsnitt Intel Core i7-11370H (37216 - 62417, n=10) | |
| Lenovo ThinkPad X1 Extreme G4-20Y5CTO1WW (3050 Ti) | |
| Xiaomi Mi NoteBook Pro | |
| Asus VivoBook Pro 16X OLED N7600PC-L2026X | |
| AIDA64 / Memory Write | |
| Genomsnitt av klass Multimedia (17733 - 134998, n=60, senaste 2 åren) | |
| Microsoft Surface Laptop Studio i7 RTX 3050 Ti | |
| MSI Summit E16 Flip A12UDT-031 | |
| Genomsnitt Intel Core i7-11370H (36920 - 65610, n=10) | |
| Lenovo ThinkPad X1 Extreme G4-20Y5CTO1WW (3050 Ti) | |
| Asus VivoBook Pro 16X OLED N7600PC-L2026X | |
| Xiaomi Mi NoteBook Pro | |
| AIDA64 / Memory Latency | |
| MSI Summit E16 Flip A12UDT-031 | |
| Genomsnitt av klass Multimedia (7 - 535, n=59, senaste 2 åren) | |
| Microsoft Surface Laptop Studio i7 RTX 3050 Ti | |
| Asus VivoBook Pro 16X OLED N7600PC-L2026X | |
| Genomsnitt Intel Core i7-11370H (73.4 - 103, n=10) | |
| Lenovo ThinkPad X1 Extreme G4-20Y5CTO1WW (3050 Ti) | |
| Xiaomi Mi NoteBook Pro | |
| Dell Inspiron 16 Plus 7610 | |
* ... mindre är bättre
DPC-latenstid
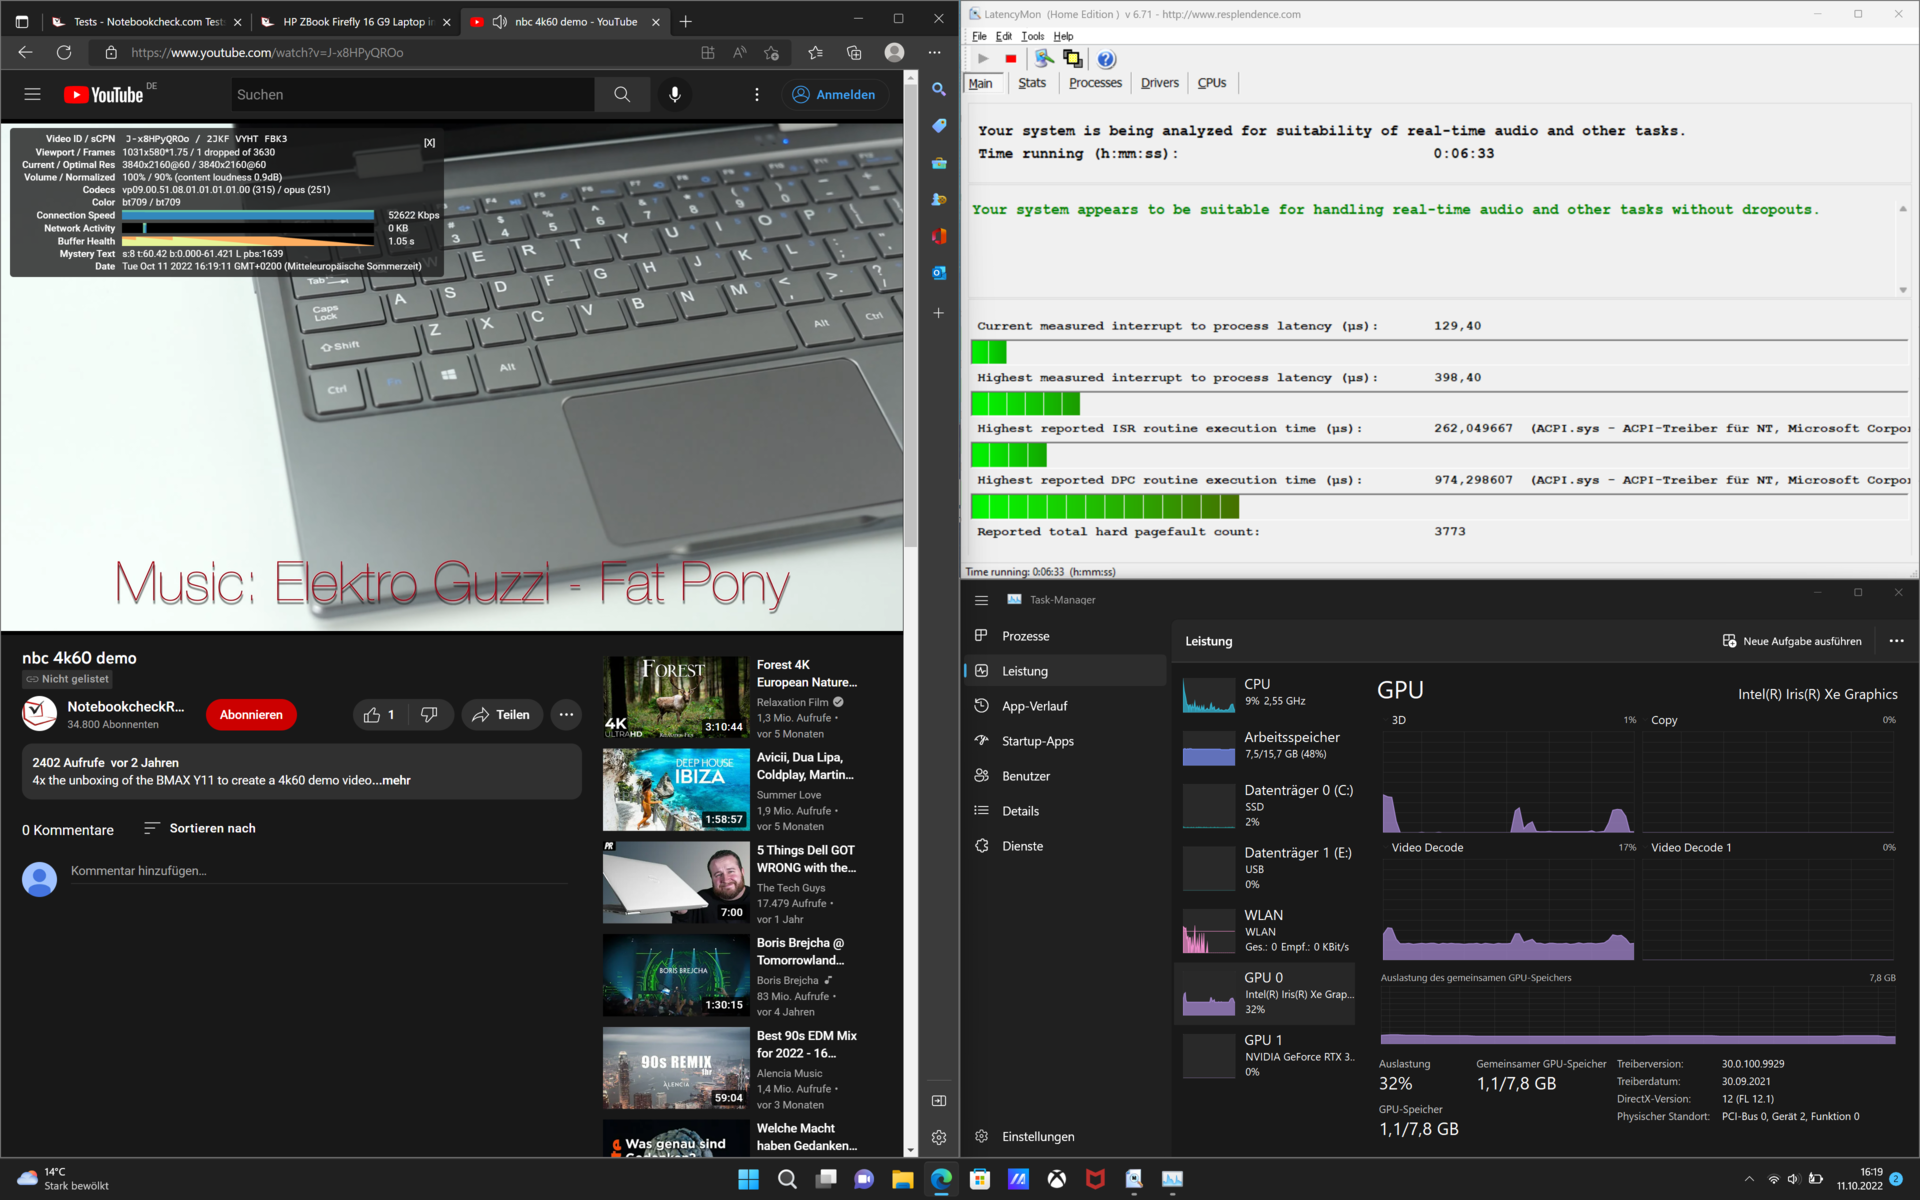
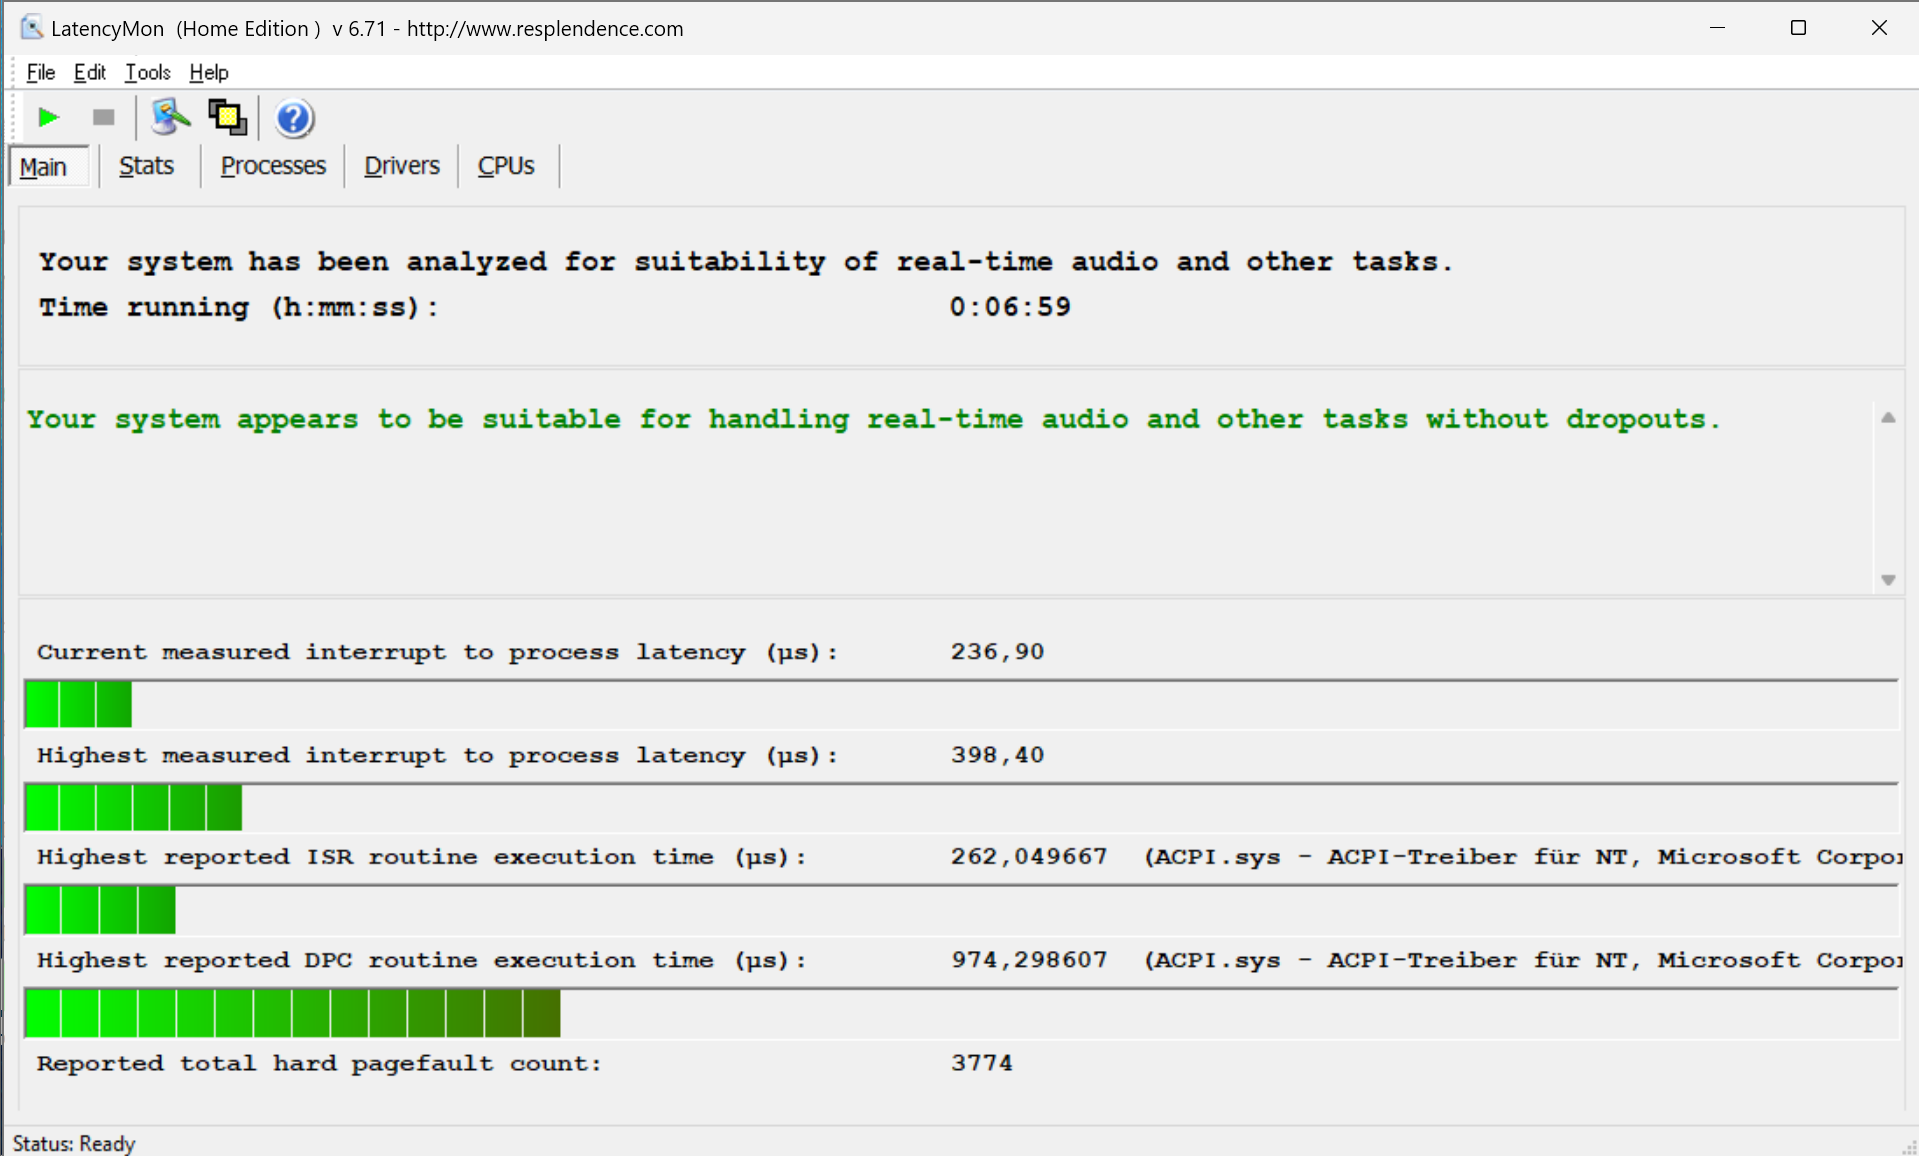
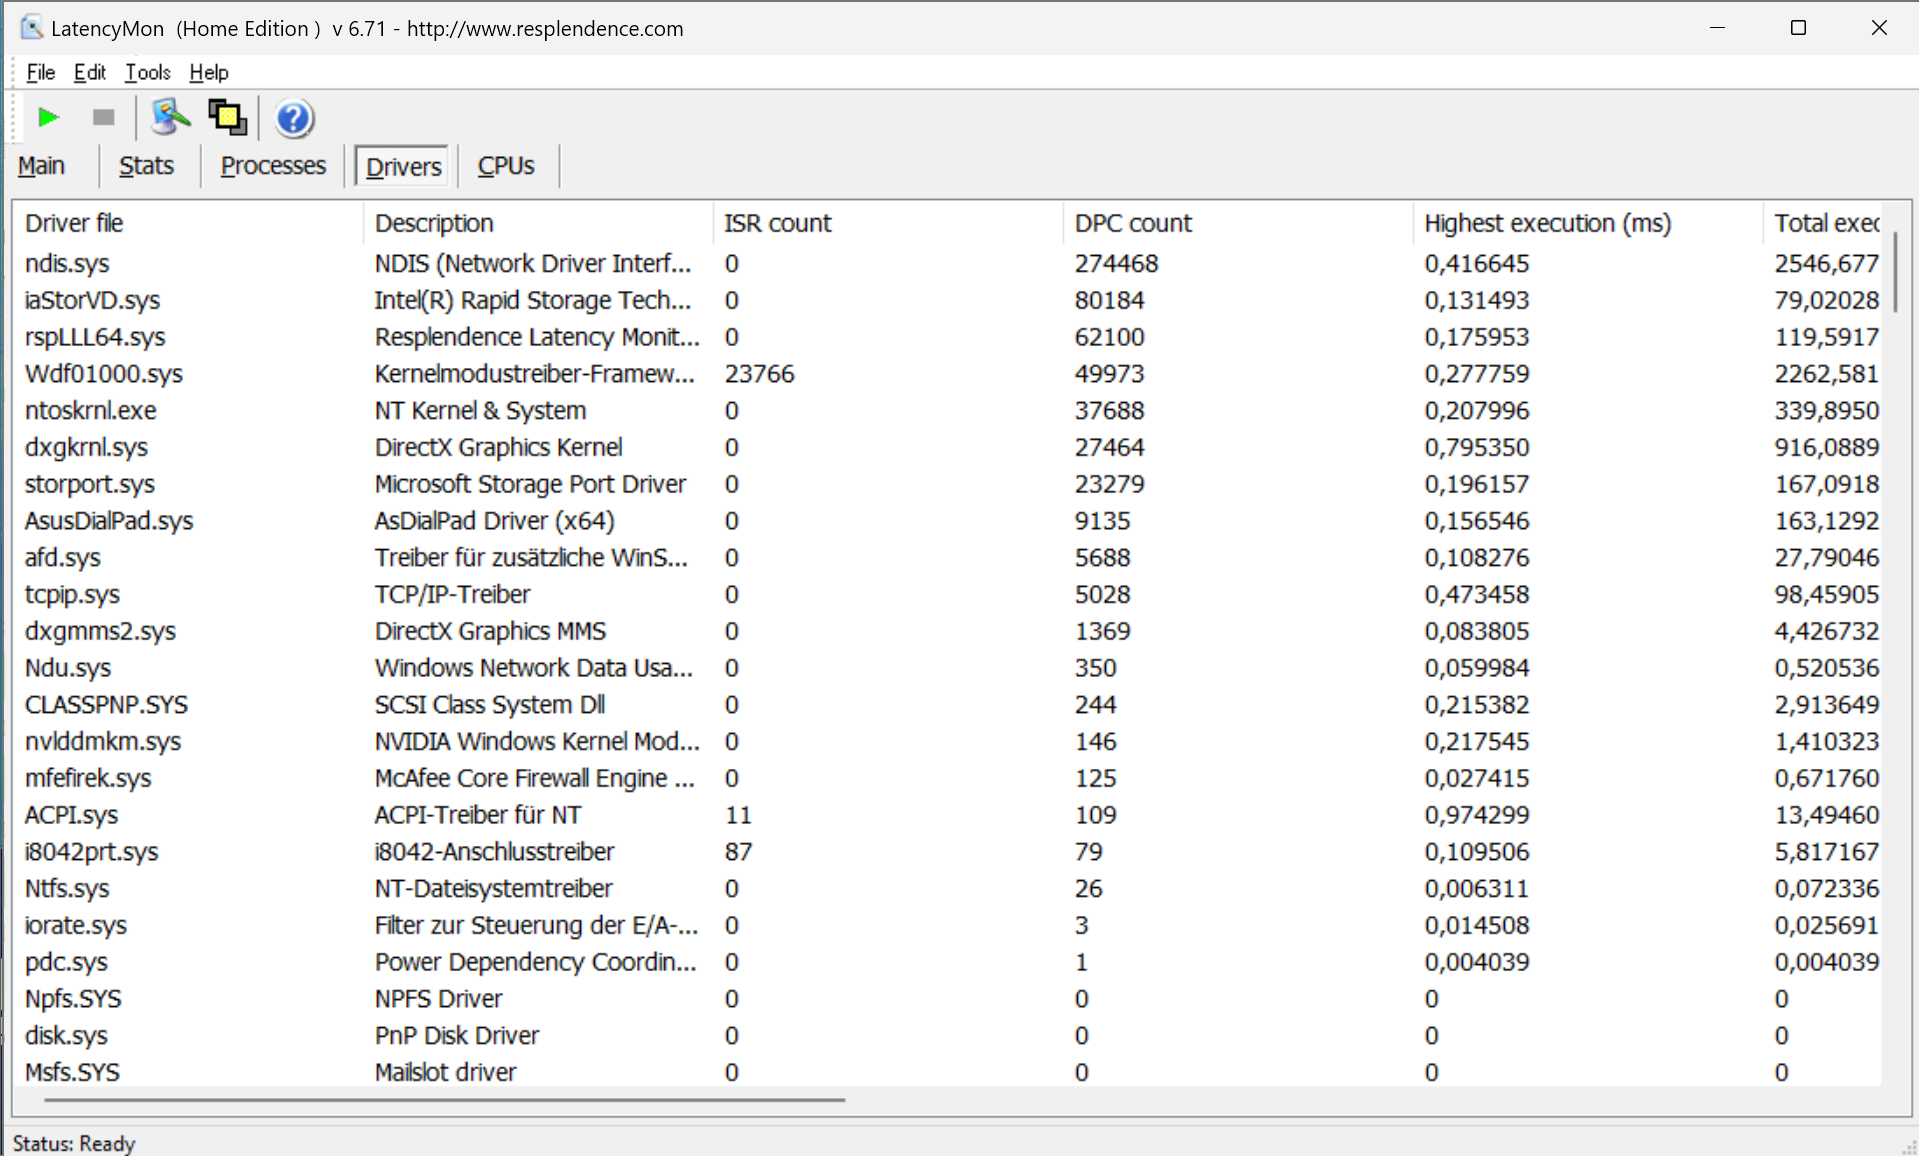
Innan vi utförde våra benchmarks uppdaterade vi enheten med alla tillgängliga drivrutiner och de senaste Windows-uppdateringarna. På Vivobook Pro 16X resulterar detta i mycket låga DPC-latenstider. Vi registrerade en tappad bild under videouppspelning av en 4K YouTube-video med 60 Hz. Med den nuvarande mjukvaru- och hårdvarukonfigurationen fungerar den bärbara datorn mycket bra.
| DPC Latencies / LatencyMon - interrupt to process latency (max), Web, Youtube, Prime95 | |
| Dell Inspiron 16 Plus 7610 | |
| Lenovo ThinkPad X1 Extreme G4-20Y5CTO1WW (3050 Ti) | |
| MSI Summit E16 Flip A12UDT-031 | |
| Microsoft Surface Laptop Studio i7 RTX 3050 Ti | |
| Schenker XMG Focus 15 | |
| Asus VivoBook Pro 16X OLED N7600PC-L2026X | |
* ... mindre är bättre
Lösning för lagring
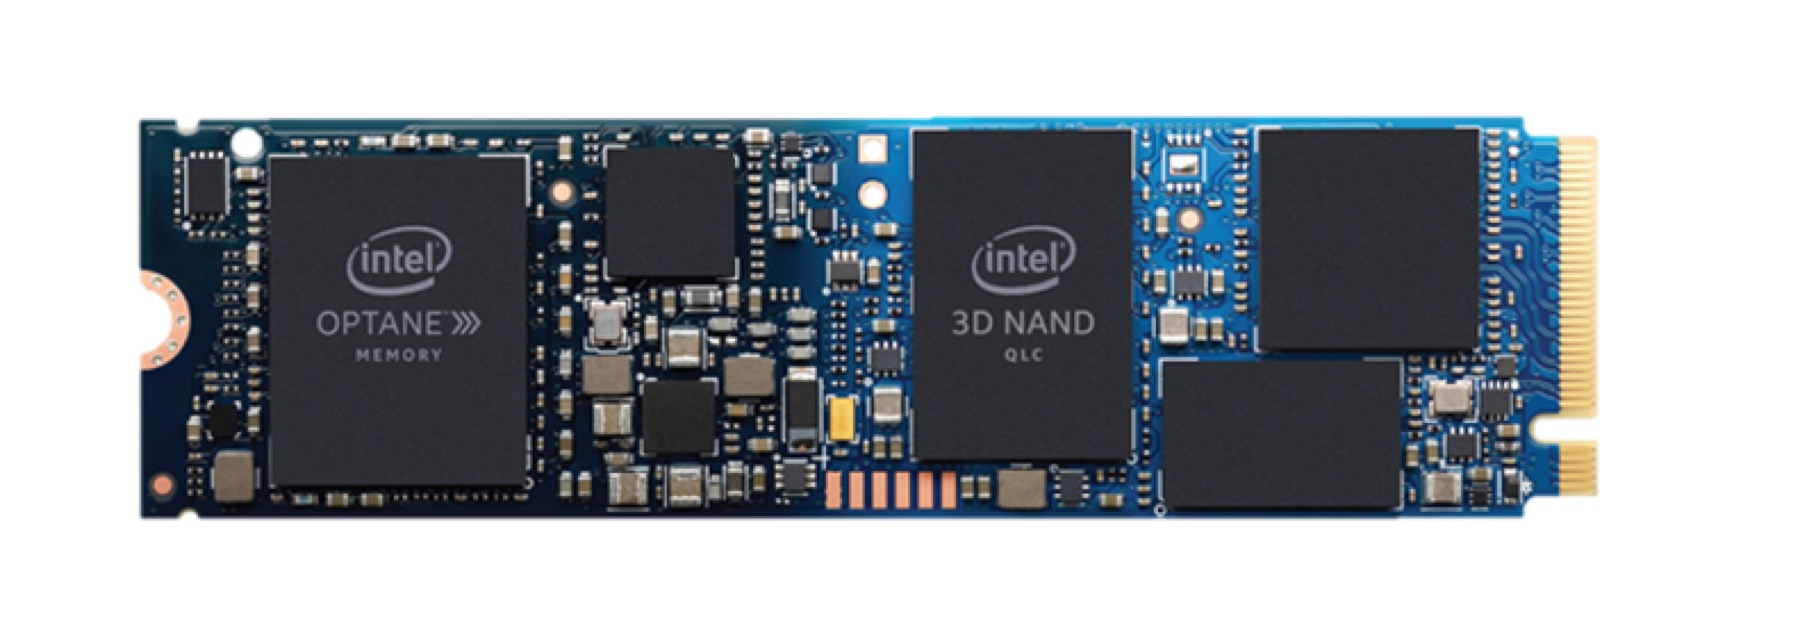
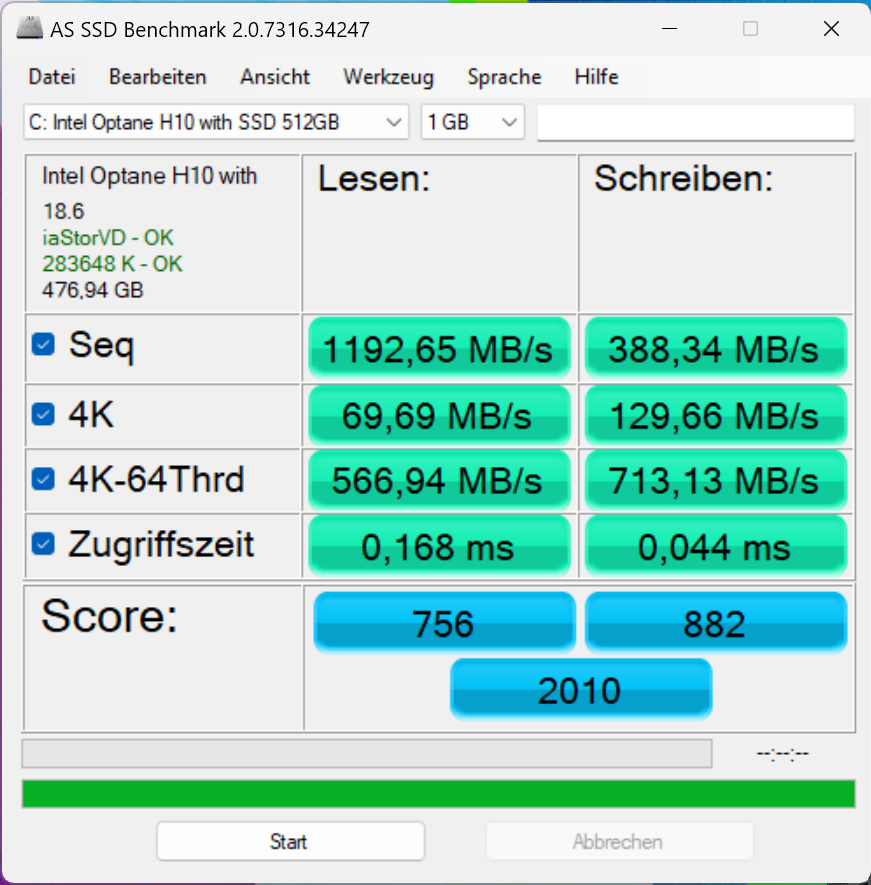
Intels Optane Memory H10 NVMe SSD är ett intressant koncept. Det finns två olika minnestyper och styrenheter på kretskortet. Nära gränssnittssidan finns en 512 GB Intel QLC 3D NAND-minnesmodul med en lämplig styrenhet. På baksidan av M.2-2280-minnet finns en 32-GB Intel Optane-minnesmodul. Trots detta är det inte längre ett av de snabbaste enhetsalternativen. I vår SSD- och HDD-tabell, är Intelmodulen nu en av de lägsta platserna. Det bör noteras att enheten med Intel Optane-teknik först introducerades 2019, vilket gör den tre år gammal i skrivande stund. NVMe SSD-enheten med integrerad Optane-cache med låg latenstid är endast ansluten via PCIe3.0x4, i stället för det numera vanliga PCIe 4.0.
Vår DiskSpd-läseslinga visar snabbt SSD:ns interna layout. Så snart minneskontrollen registrerar frekvent åtkomst till en viss fil överförs den till Optane-minnet och nås därifrån. Detta resulterar i en betydande prestandaförstärkning.

* ... mindre är bättre
Disk Throttling: DiskSpd Read Loop, Queue Depth 8
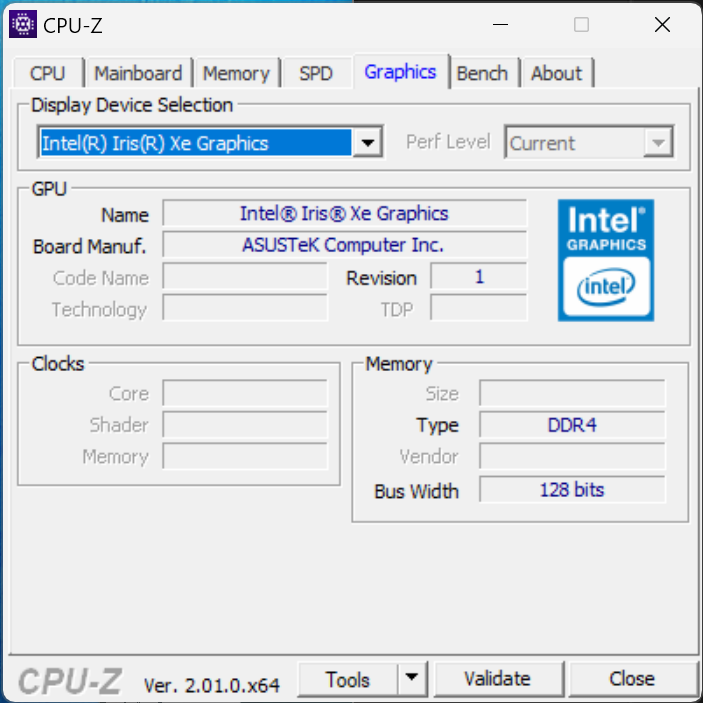
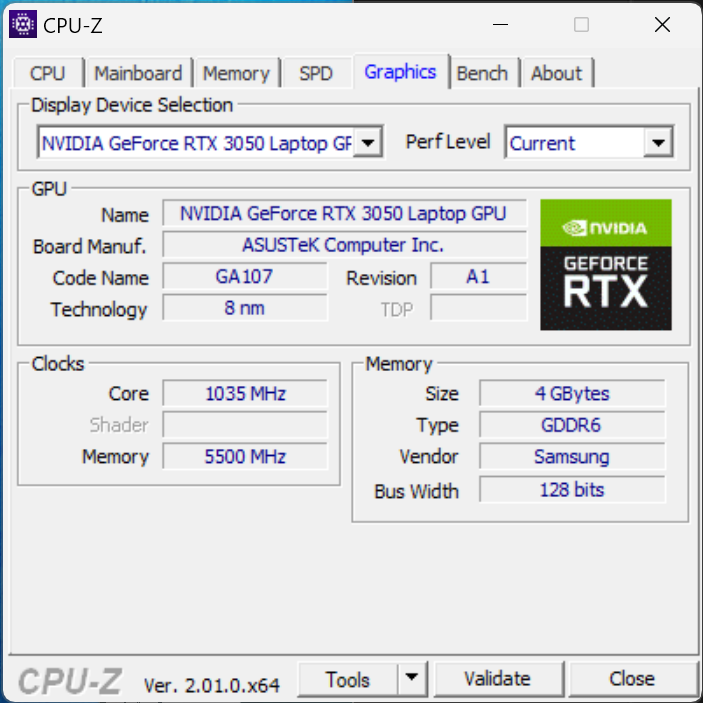
GPU-prestanda
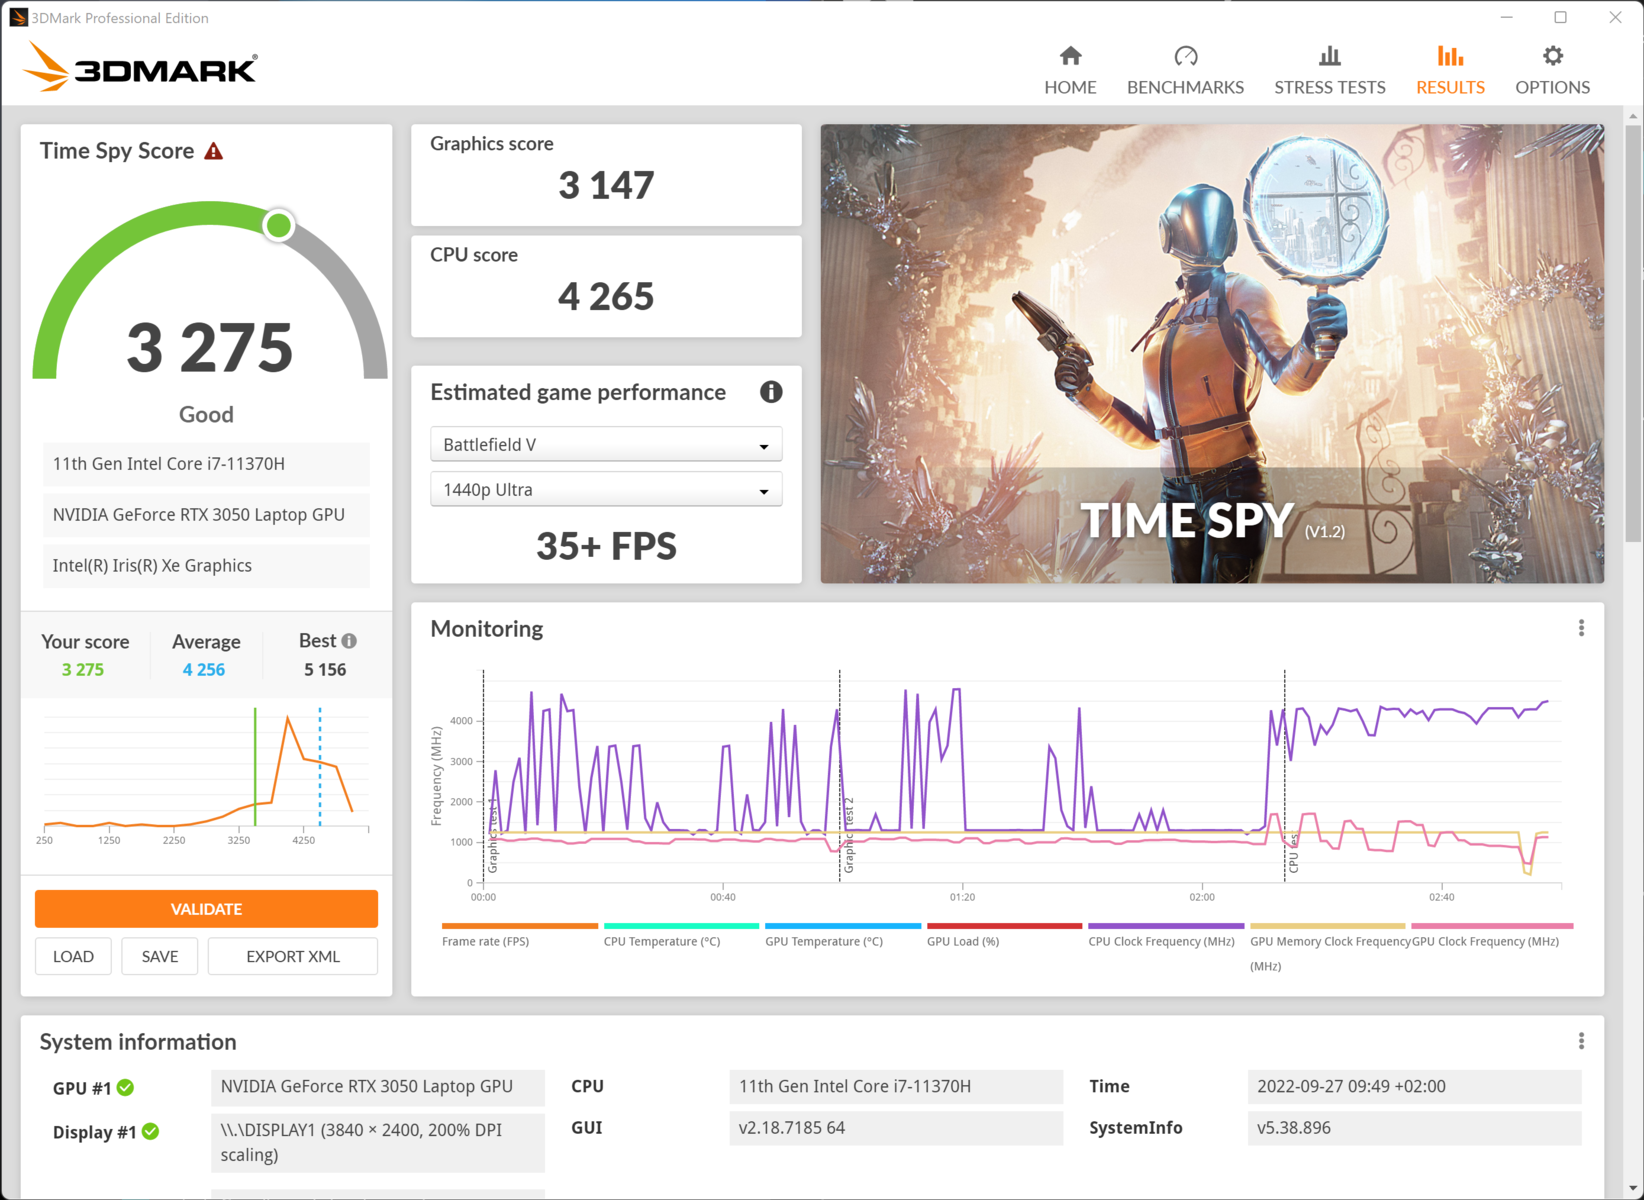
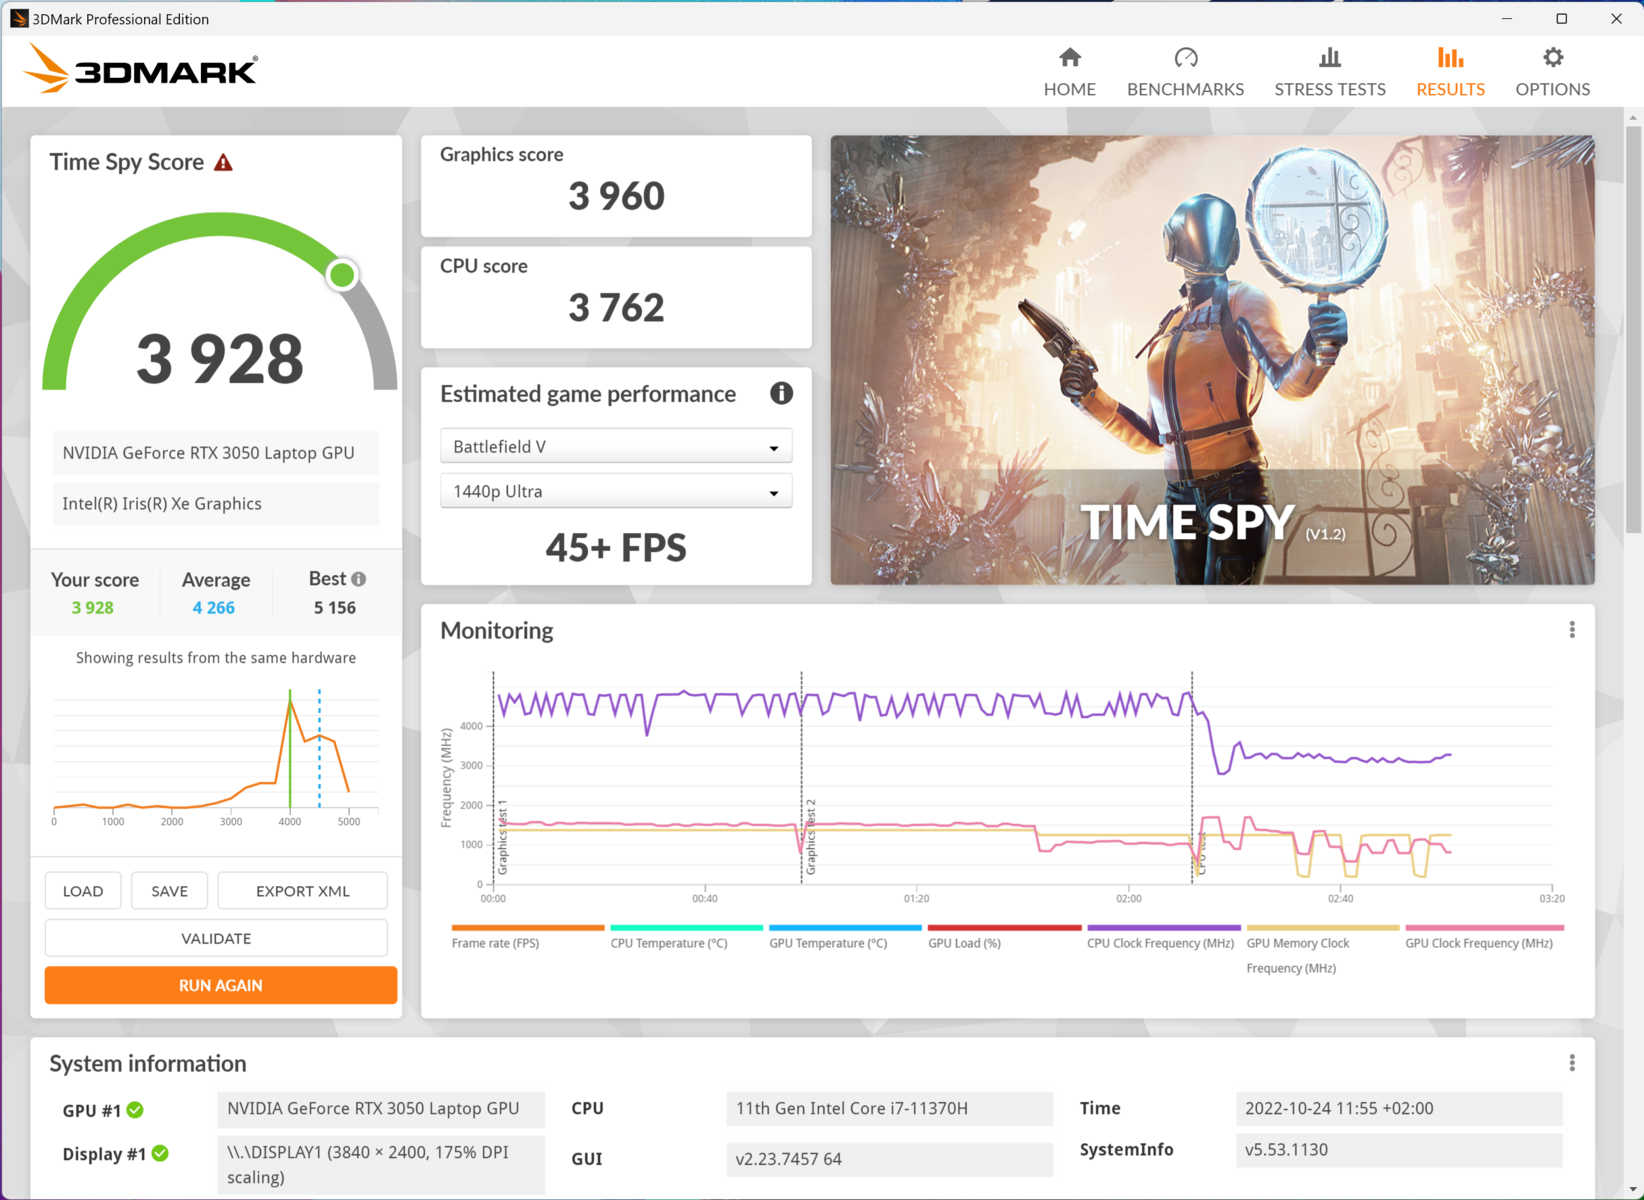
Vivobook använder både iGPU:n i Intel Core i7 och Nvidia GeForce RTX 3050. Under arbetsbelastningar utan krav är iGPU:n aktiv. Under tiden ansvarar GeForce dGPU för mer krävande uppgifter. I våra tester registrerade vi en toppförbrukning på 50 watt från GPU:n. Även om prestandan är bra bör det noteras att detta är det svagaste alternativet från Nvidias RTX 3000-serie. Som vårt Blender-test visar kan GPU:n snabbt rendera scener. Däremot når den inte upp till våra förväntningar i 3DMark-benchmarks. Detta kan bero på den installerade drivrutinen Nvidia Studio. Den är mindre optimerad för spelprestanda. I gengäld får många professionella program som Blender, Autodesk Maya och Adobe Illustrator en prestandaförstärkning. En officiell översikt på över de program som stöds av Nvidia Studio-drivrutinerna, finns på tillverkarens webbplats.
Prestandan i batteriläge är begränsad. Här sjunker TGP till cirka 25 watt. Detta innebär ungefär en halvering av grafikprestandan. 3DMark-benchmarkresultaten påverkas dock förvånansvärt nog inte så allvarligt som förväntat.
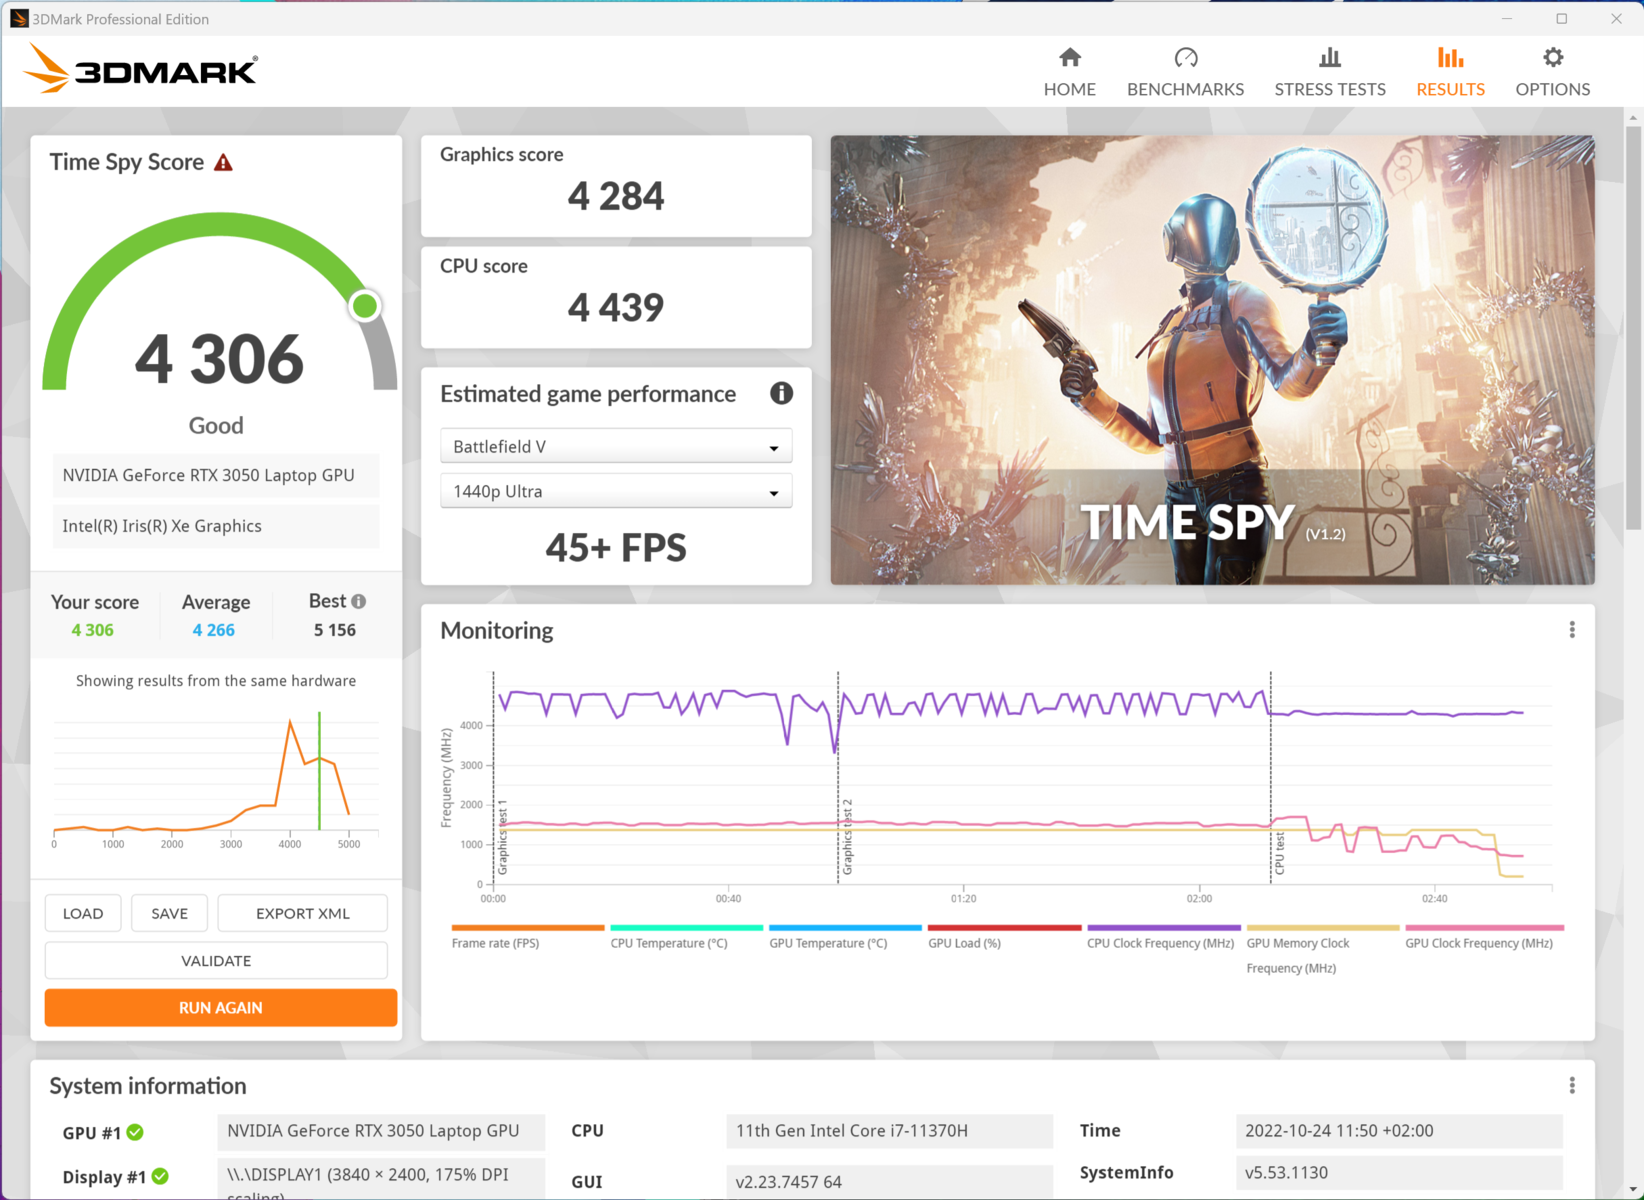
| 3DMark 11 Performance | 13624 poäng | |
| 3DMark Ice Storm Standard Score | 34267 poäng | |
| 3DMark Cloud Gate Standard Score | 20526 poäng | |
| 3DMark Fire Strike Score | 9732 poäng | |
| 3DMark Time Spy Score | 4310 poäng | |
Hjälp | ||
* ... mindre är bättre
Spelprestanda
Prestandan är tillräcklig för mer än 60 FPS i Full HD i nästan alla spel vi testade. Far Cry 5 är ett undantag. Spelet visar ett fel som indikerar att Nvidia Studio-drivrutinerna inte stöds. F1 2022 visar ett liknande felmeddelande.
Prestandareserverna hos 3050 är knappt tillräckliga för den höga nativa upplösningen hos 4K OLED-skärmen. Även om bildfrekvenserna fortfarande kan vara acceptabla i vissa fall, är vår översikt "Datorspel på bärbara grafikkort" visar att RTX 3050 tenderar att falla under 30 FPS vid 4K.
Även om Vivobook uppnår genomsnittliga resultat totalt sett jämfört med andra enheter i vår jämförelse, lyckas den bärbara multimediebärbara datorn överträffa vissa alternativ med den nominellt snabbare 3050 Ti.
| låg | med. | hög | ultra | QHD | 4K | |
|---|---|---|---|---|---|---|
| GTA V (2015) | 146.6 | 100.4 | 54.9 | |||
| The Witcher 3 (2015) | 193.3 | 117.8 | 61.3 | 47 | ||
| Dota 2 Reborn (2015) | 120.7 | 111.4 | 103.7 | 100.3 | 62.4 | |
| Final Fantasy XV Benchmark (2018) | 62 | 64.8 | 44.4 | 30.2 | ||
| X-Plane 11.11 (2018) | 95.3 | 78.4 | 66.9 | 41.4 | ||
| Far Cry 5 (2018) | 37 | 36 | 35 | 47 | ||
| Strange Brigade (2018) | 244 | 112.5 | 92.4 | 78.9 | ||
| F1 22 (2022) | 112.7 | 104.3 | 75 | 21.8 |
Utsläpp - den bärbara datorn kan vara tyst
Bullerutsläpp
Även om Vivobook inte är helt tyst, är den ganska tyst under de flesta belastningar. Vid normal användning överstiger den bärbara datorn inte 40 dB(A). Ljudnivån ökar till upp till 62,9 dB(A) endast när man spelar spel eller utför andra datorintensiva uppgifter. Fläktarna kan vara störande i dessa scenarier, särskilt eftersom ljudet är relativt högt. I whisper-läget förblir fläktarna mycket tysta eller står stilla.
Oavsett fläktläge försöker fläktkontrollen hålla fläkthastigheterna låga så länge som möjligt. Även om detta är fördelaktigt för ljudnivåerna i Vivobook Pro är det till nackdel för prestandan vid belastning.
Ljudnivå
| Låg belastning |
| 30 / 30 / 30 dB(A) |
| Hög belastning |
| 57.6 / 62.9 dB(A) |
 | ||
30 dB tyst 40 dB(A) hörbar 50 dB(A) högt ljud |
||
min: | ||
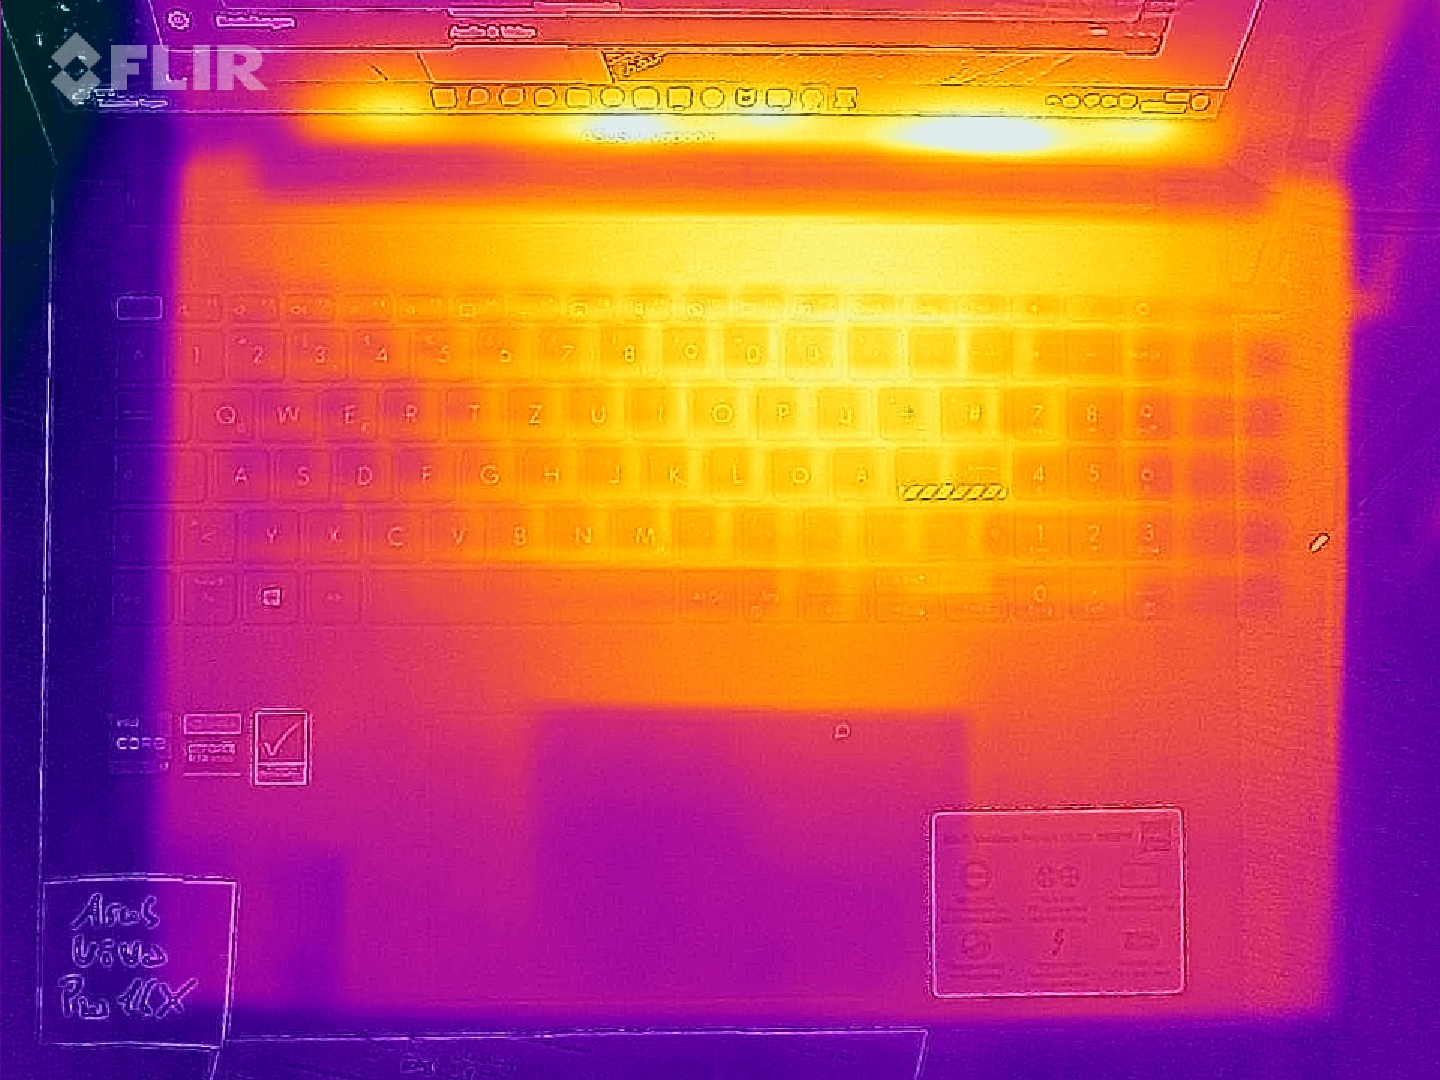
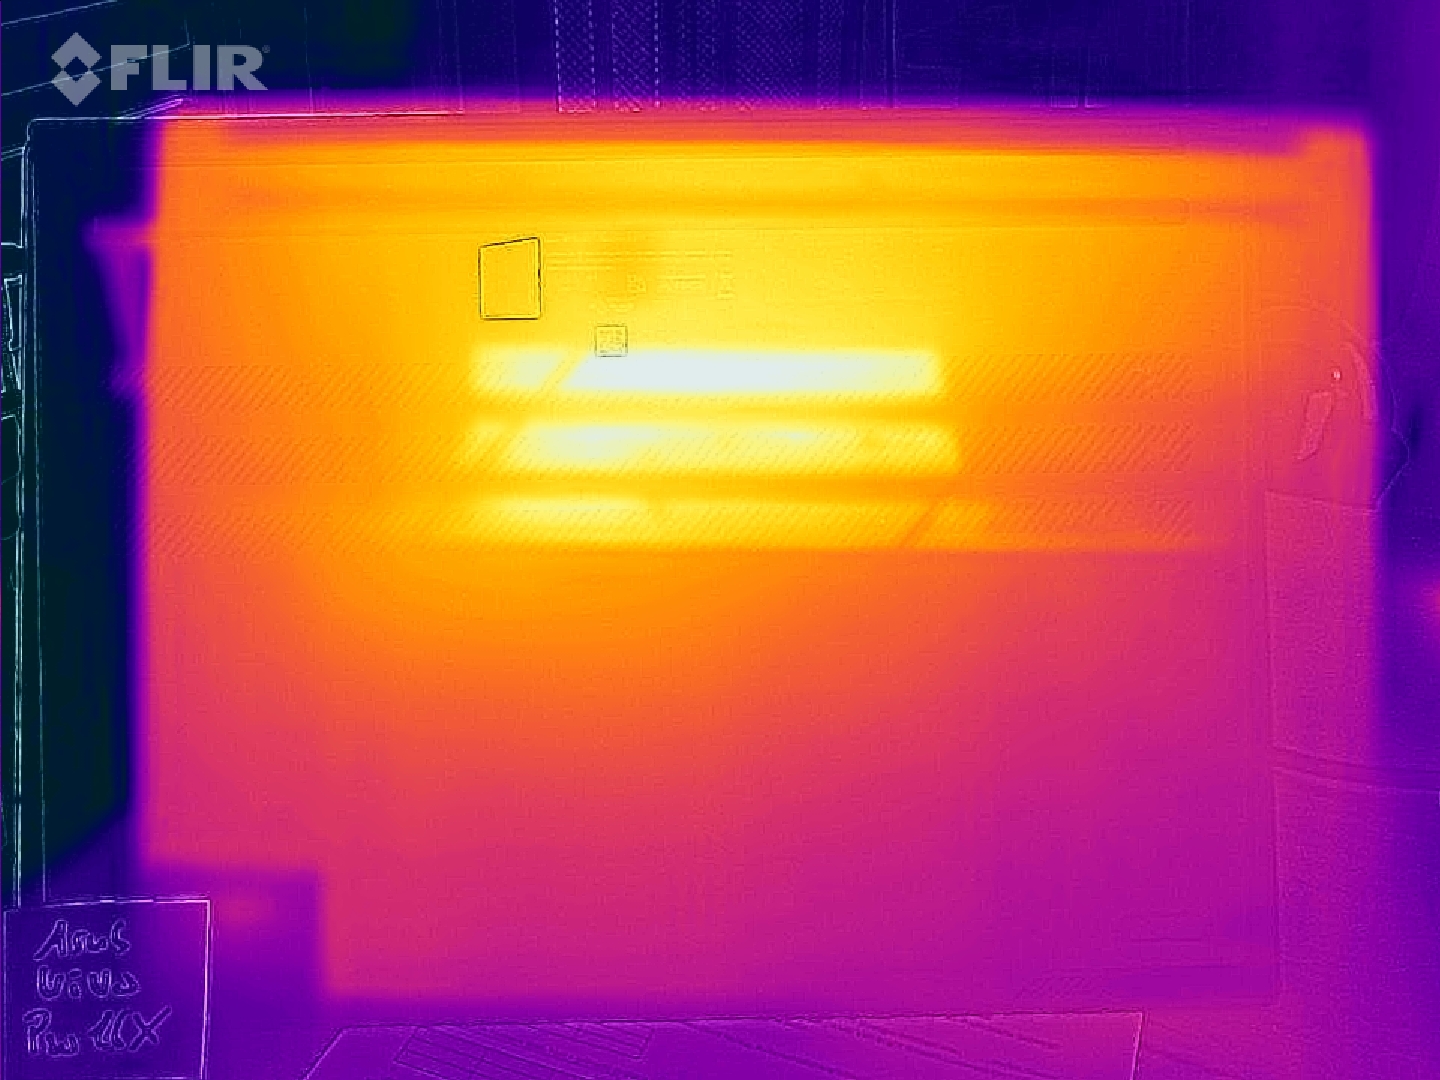
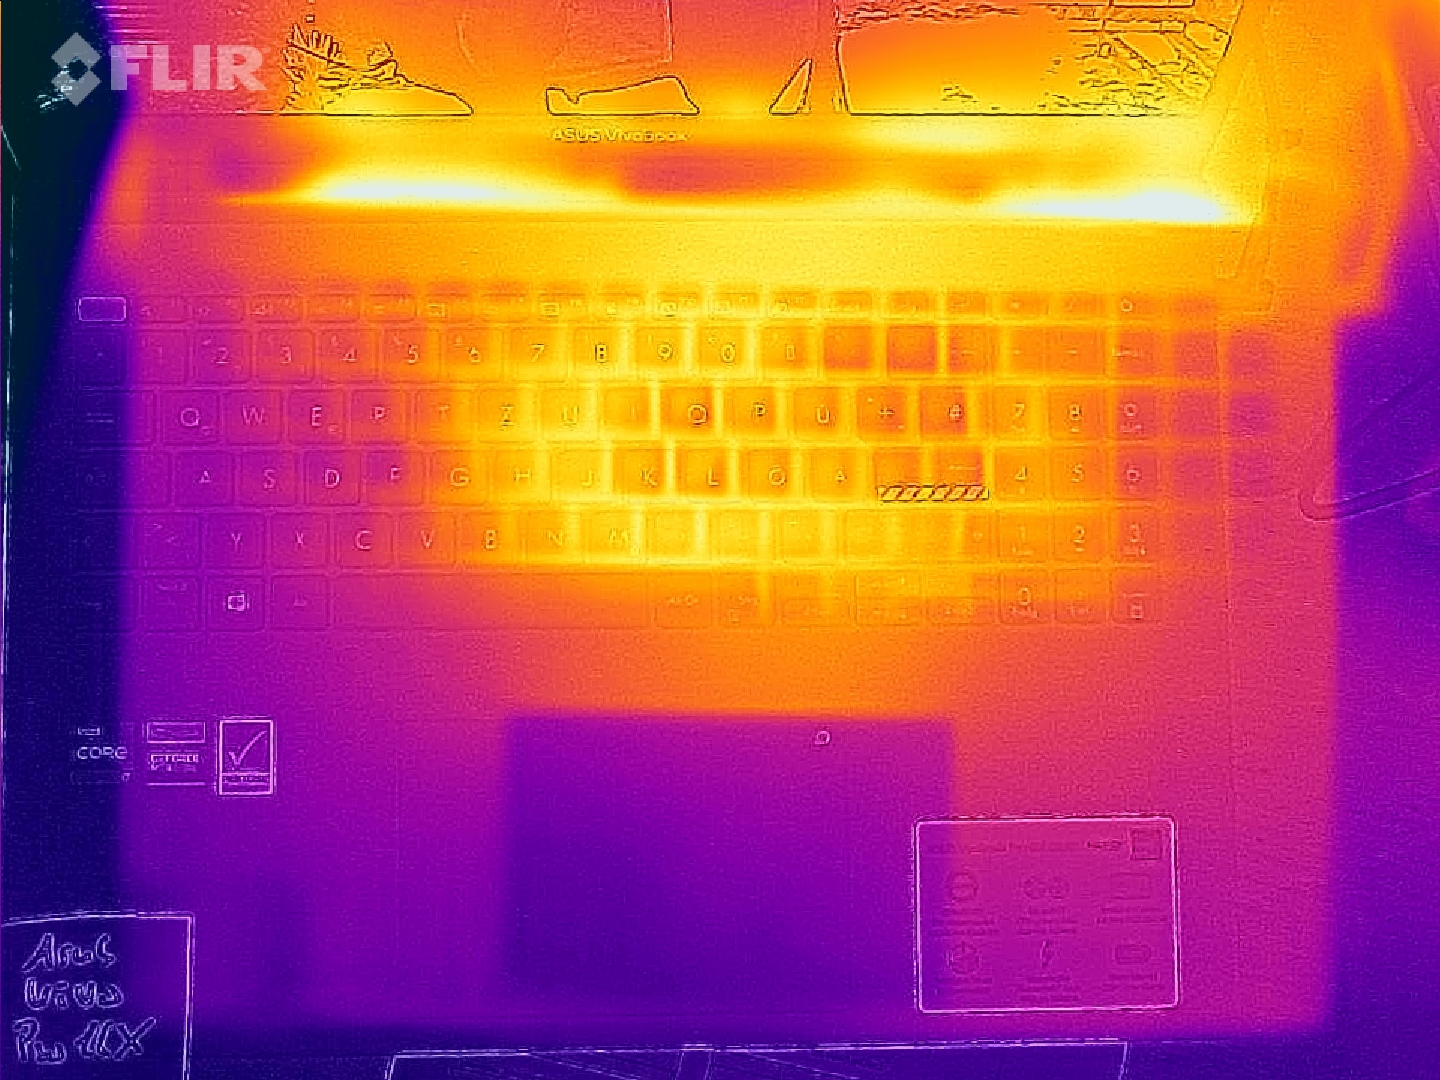
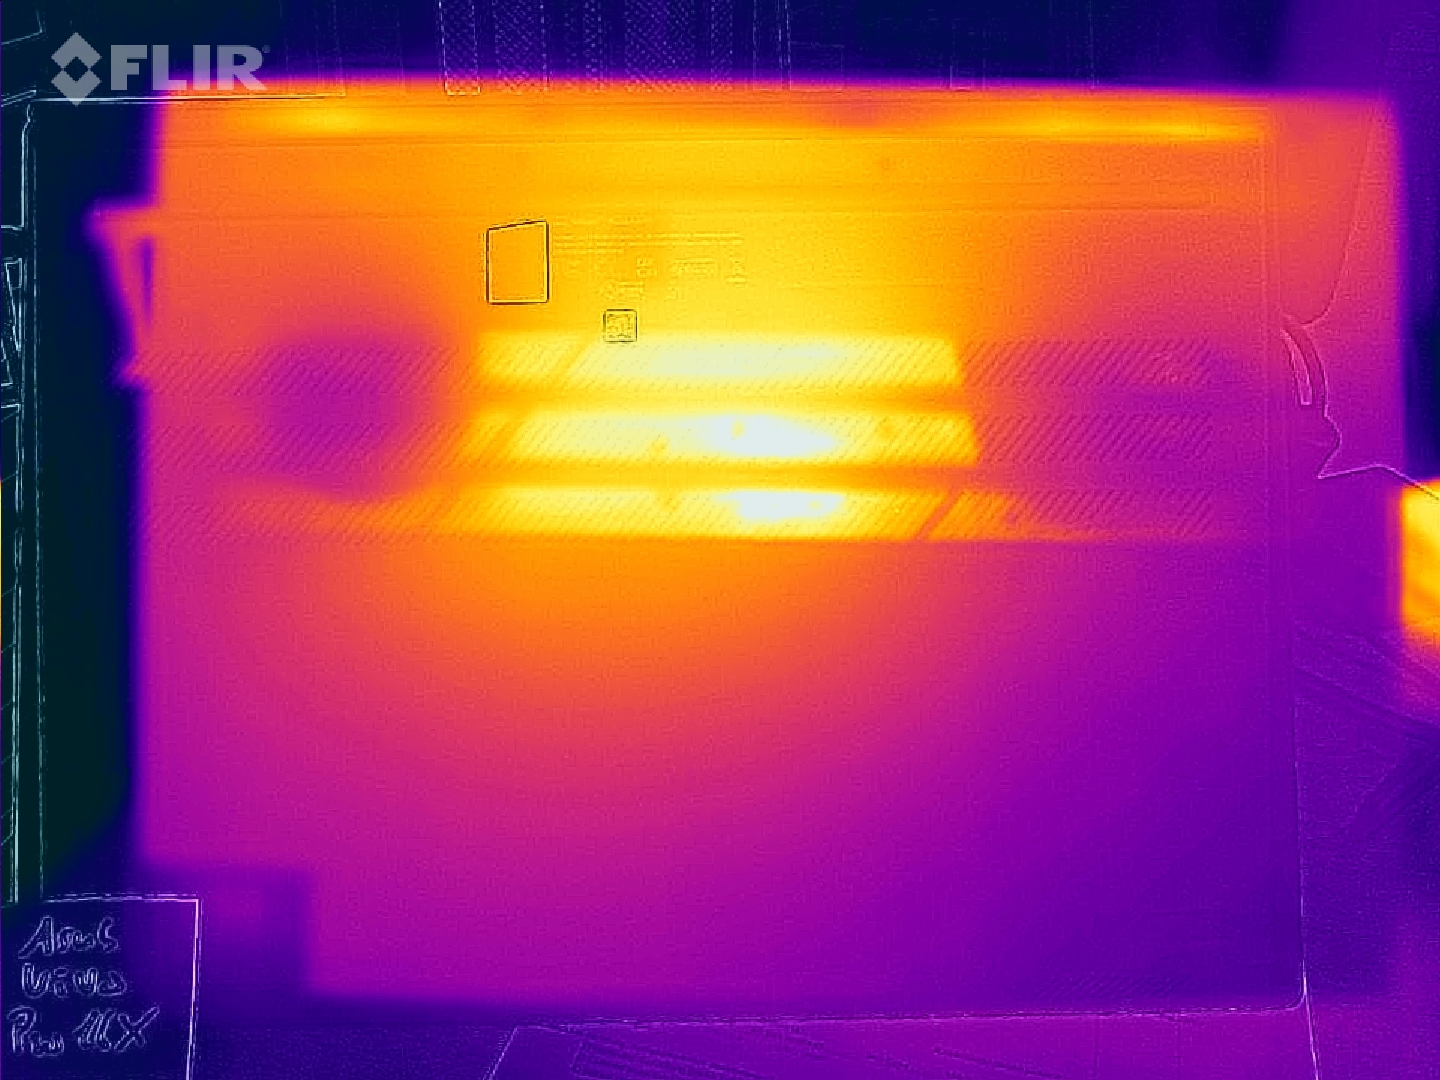
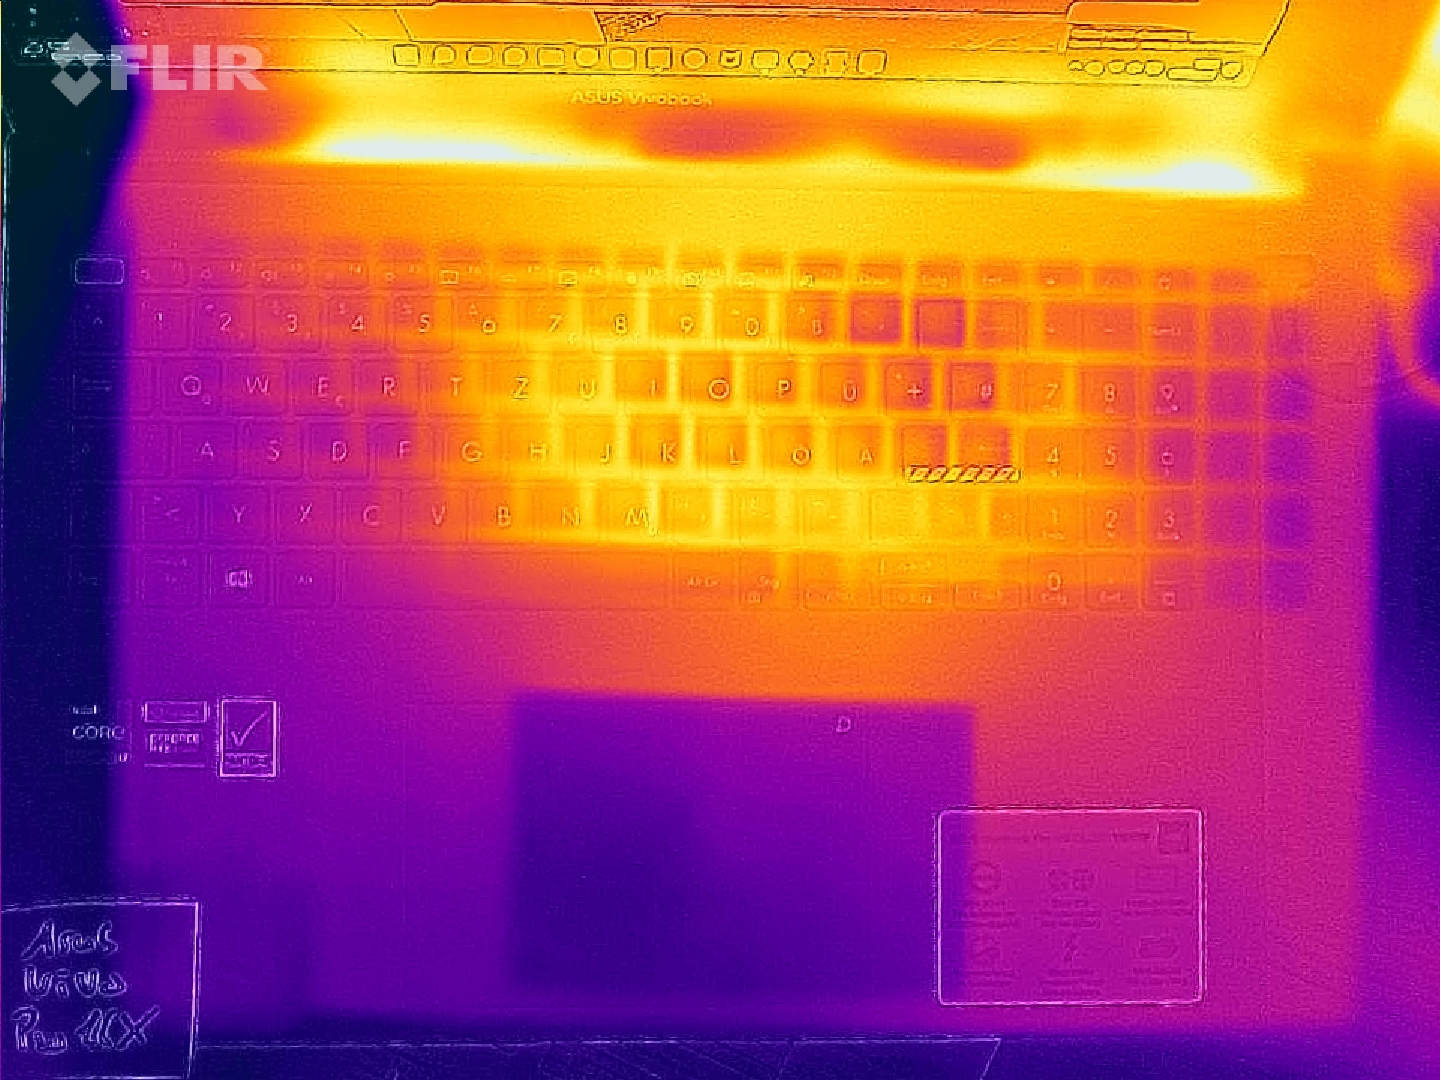
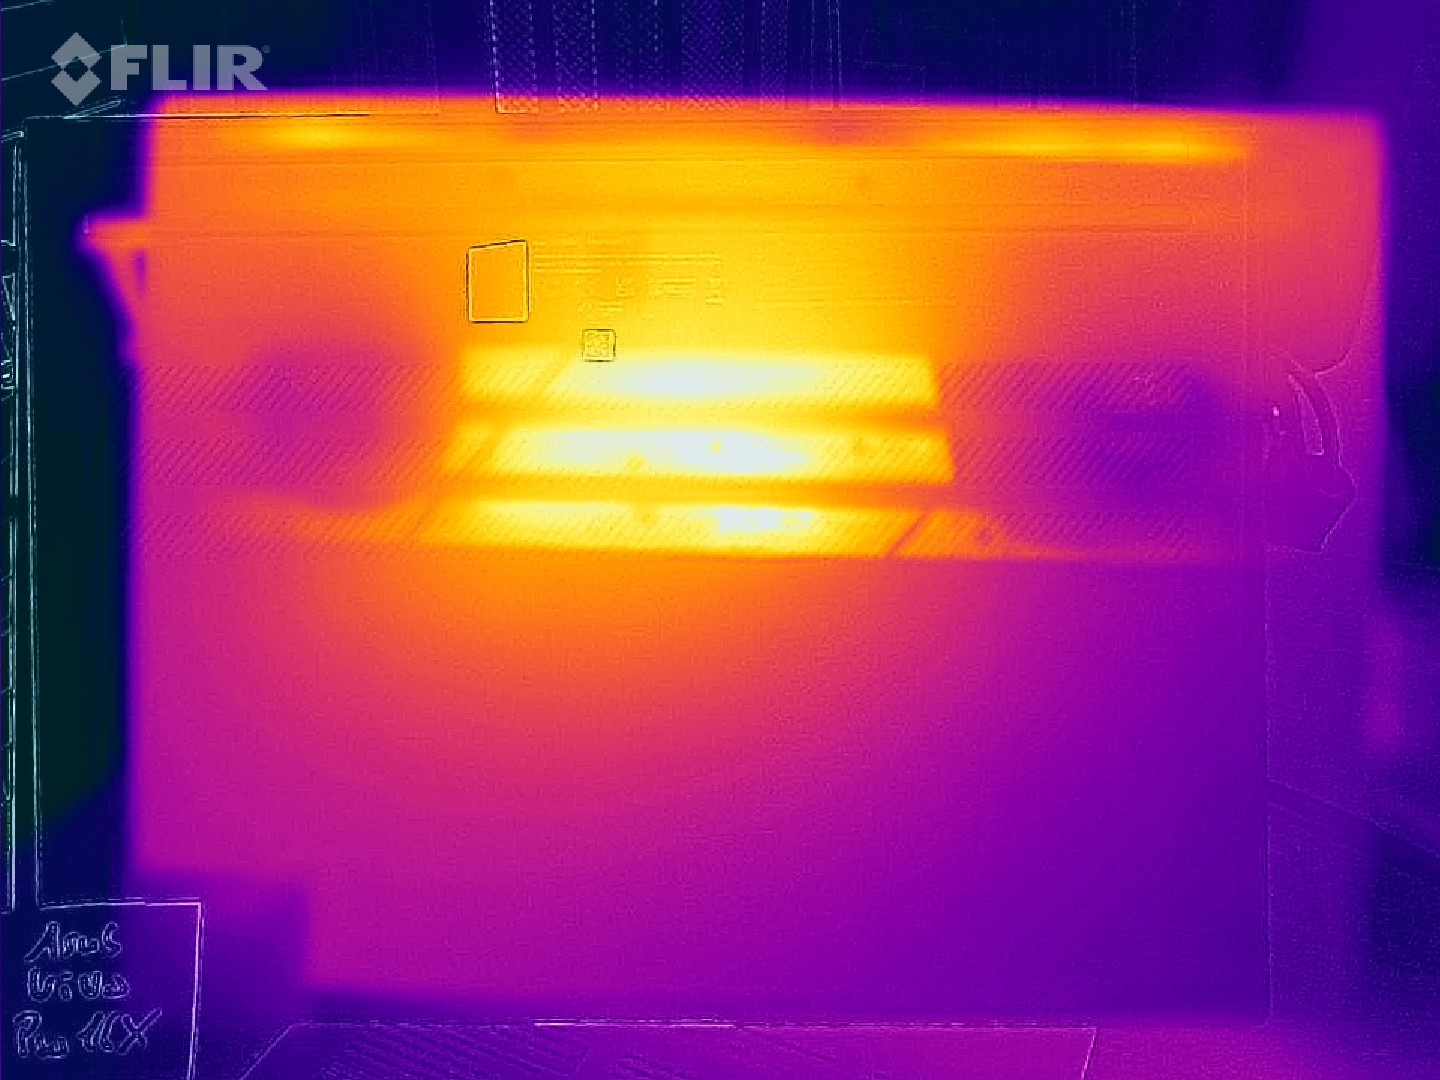
Temperaturer
Yttemperaturerna på Vivobook är överlag rimliga, även om vi uppmätte temperaturer på över 30 °C på handflatan under belastning i en måttlig rumstemperatur. Vid belastning kan varma punkter påsidan undersidan bli obehagligt varma. 50 °C (122 °F) på undersidan är för högt för att vara bekvämt vid användning i knät under längre perioder. Lyckligtvis är området med heta punkter i mitten av den bärbara datorn ganska litet. Därför kan Vivobook Pro fortfarande placeras på ett sätt där detta inte är något problem.
| Asus VivoBook Pro 16X OLED N7600PC-L2026X GeForce RTX 3050 4GB Laptop GPU, i7-11370H, Intel Optane Memory H10 with Solid State Storage 32GB + 512GB HBRPEKNX0202A(L/H) | MSI Summit E16 Flip A12UDT-031 GeForce RTX 3050 Ti Laptop GPU, i7-1280P, Samsung PM9A1 MZVL22T0HBLB | Microsoft Surface Laptop Studio i7 RTX 3050 Ti GeForce RTX 3050 Ti Laptop GPU, i7-11370H, SK Hynix PC711 1TB HFS001TDE9X084N | Dell Inspiron 16 Plus 7610 GeForce RTX 3050 4GB Laptop GPU, i7-11800H, Kingston OM3PDP3512B | Lenovo ThinkPad X1 Extreme G4-20Y5CTO1WW (3050 Ti) GeForce RTX 3050 Ti Laptop GPU, i7-11800H, Samsung PM9A1 MZVL21T0HCLR | Schenker XMG Focus 15 GeForce RTX 3050 Ti Laptop GPU, i7-11800H, Samsung SSD 970 EVO Plus 1TB | |
|---|---|---|---|---|---|---|
| Noise | 13% | 21% | 16% | 19% | -2% | |
| av / miljö * (dB) | 25.15 | 25 1% | 24.7 2% | 24.4 3% | 23.52 6% | 24 5% |
| Idle Minimum * (dB) | 30 | 25 17% | 24.7 18% | 24.4 19% | 23.52 22% | 25 17% |
| Idle Average * (dB) | 30 | 25 17% | 24.7 18% | 24.4 19% | 23.52 22% | 30 -0% |
| Idle Maximum * (dB) | 30 | 28.9 4% | 24.7 18% | 24.4 19% | 23.52 22% | 43 -43% |
| Load Average * (dB) | 57.6 | 49.3 14% | 33.2 42% | 48.3 16% | 42.9 26% | 56 3% |
| Load Maximum * (dB) | 62.9 | 48.2 23% | 46.7 26% | 48.9 22% | 52.45 17% | 58 8% |
| Witcher 3 ultra * (dB) | 44.5 | 48.9 | 52.5 | 56 |
* ... mindre är bättre
(±) Den maximala temperaturen på ovansidan är 40.6 °C / 105 F, jämfört med genomsnittet av 36.8 °C / 98 F , allt från 21 till 71 °C för klassen Multimedia.
(-) Botten värms upp till maximalt 53 °C / 127 F, jämfört med genomsnittet av 39.1 °C / 102 F
(+) Vid tomgångsbruk är medeltemperaturen för ovansidan 26.3 °C / 79 F, jämfört med enhetsgenomsnittet på 31.3 °C / ### class_avg_f### F.
(±) När du spelar The Witcher 3 är medeltemperaturen för ovansidan 33.7 °C / 93 F, jämfört med enhetsgenomsnittet på 31.3 °C / ## #class_avg_f### F.
(+) Handledsstöden och pekplattan är kallare än hudtemperaturen med maximalt 30.6 °C / 87.1 F och är därför svala att ta på.
(±) Medeltemperaturen för handledsstödsområdet på liknande enheter var 28.7 °C / 83.7 F (-1.9 °C / -3.4 F).
| Asus VivoBook Pro 16X OLED N7600PC-L2026X Intel Core i7-11370H, NVIDIA GeForce RTX 3050 4GB Laptop GPU | MSI Summit E16 Flip A12UDT-031 Intel Core i7-1280P, NVIDIA GeForce RTX 3050 Ti Laptop GPU | Microsoft Surface Laptop Studio i7 RTX 3050 Ti Intel Core i7-11370H, NVIDIA GeForce RTX 3050 Ti Laptop GPU | Dell Inspiron 16 Plus 7610 Intel Core i7-11800H, NVIDIA GeForce RTX 3050 4GB Laptop GPU | Lenovo ThinkPad X1 Extreme G4-20Y5CTO1WW (3050 Ti) Intel Core i7-11800H, NVIDIA GeForce RTX 3050 Ti Laptop GPU | Schenker XMG Focus 15 Intel Core i7-11800H, NVIDIA GeForce RTX 3050 Ti Laptop GPU | Xiaomi Mi NoteBook Pro Intel Core i7-11370H, Intel Iris Xe Graphics G7 96EUs | |
|---|---|---|---|---|---|---|---|
| Heat | -6% | 15% | -14% | -5% | -17% | -7% | |
| Maximum Upper Side * (°C) | 40.6 | 49.2 -21% | 42.3 -4% | 46.4 -14% | 49 -21% | 43 -6% | 48 -18% |
| Maximum Bottom * (°C) | 53 | 50.2 5% | 38.2 28% | 54.8 -3% | 44.4 16% | 46 13% | 45.8 14% |
| Idle Upper Side * (°C) | 29 | 29.4 -1% | 23.4 19% | 31.4 -8% | 32.1 -11% | 39 -34% | 32.2 -11% |
| Idle Bottom * (°C) | 28.3 | 30 -6% | 23.5 17% | 36.6 -29% | 29.8 -5% | 40 -41% | 32.2 -14% |
* ... mindre är bättre
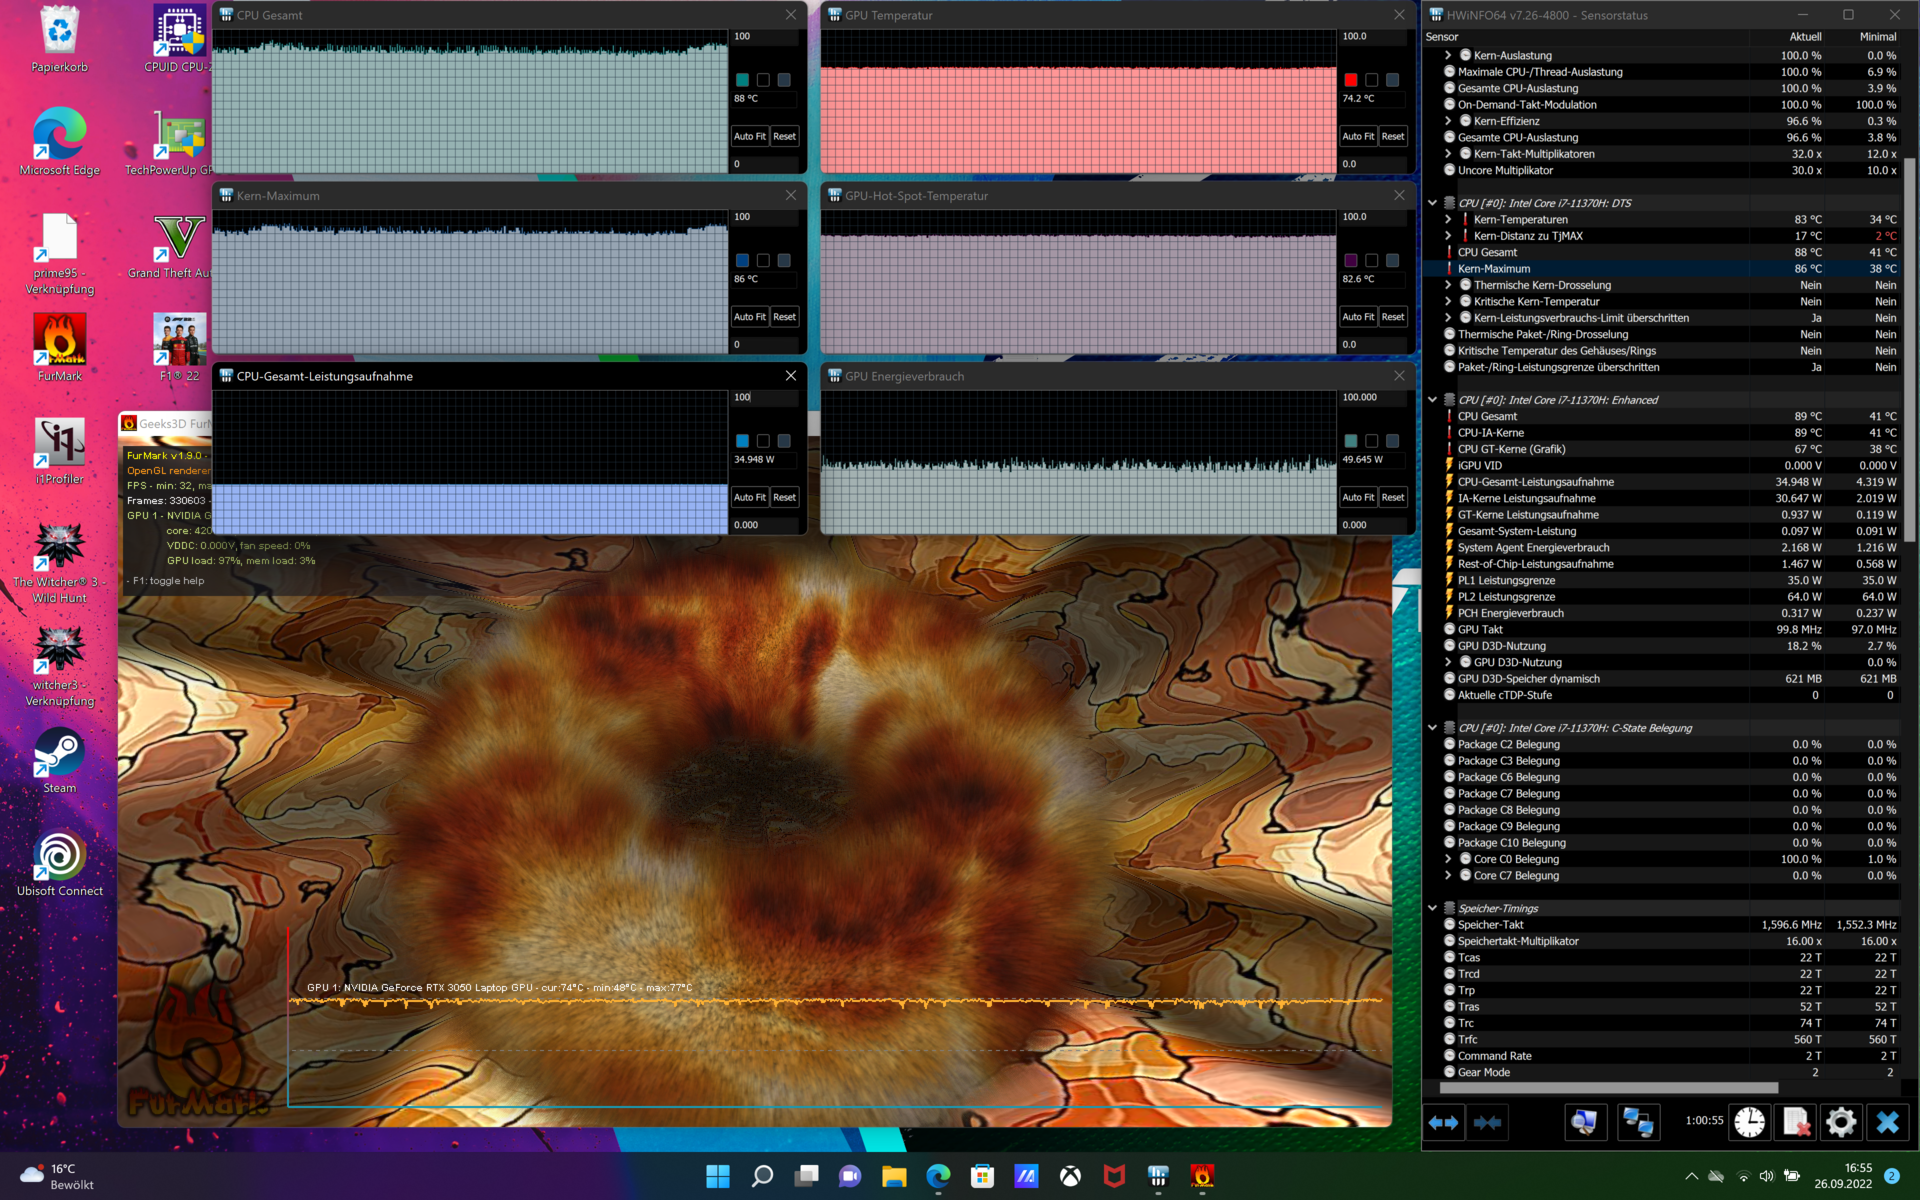
Stresstest
Vivobook Pro 16X:s prestanda sjunker kraftigt under de första två minuterna. Därefter är den bärbara datorns prestanda konstant. Detta kan också betraktas som ett särskilt långt boostfönster. Processorn börjar stresstestet med imponerande 46 watt och sjunker sedan långsamt till 35 watt. Detta motsvarar den teoretiska maximala PL1 för Intel Core i7-11370H. Temperaturerna förblir okritiska även under kontinuerlig stress. Ingen av sensorerna rapporterar över 90 °C (194 °F). Som ett resultat av detta förblir yttemperaturerna för det mesta också behagliga.
Högtalare
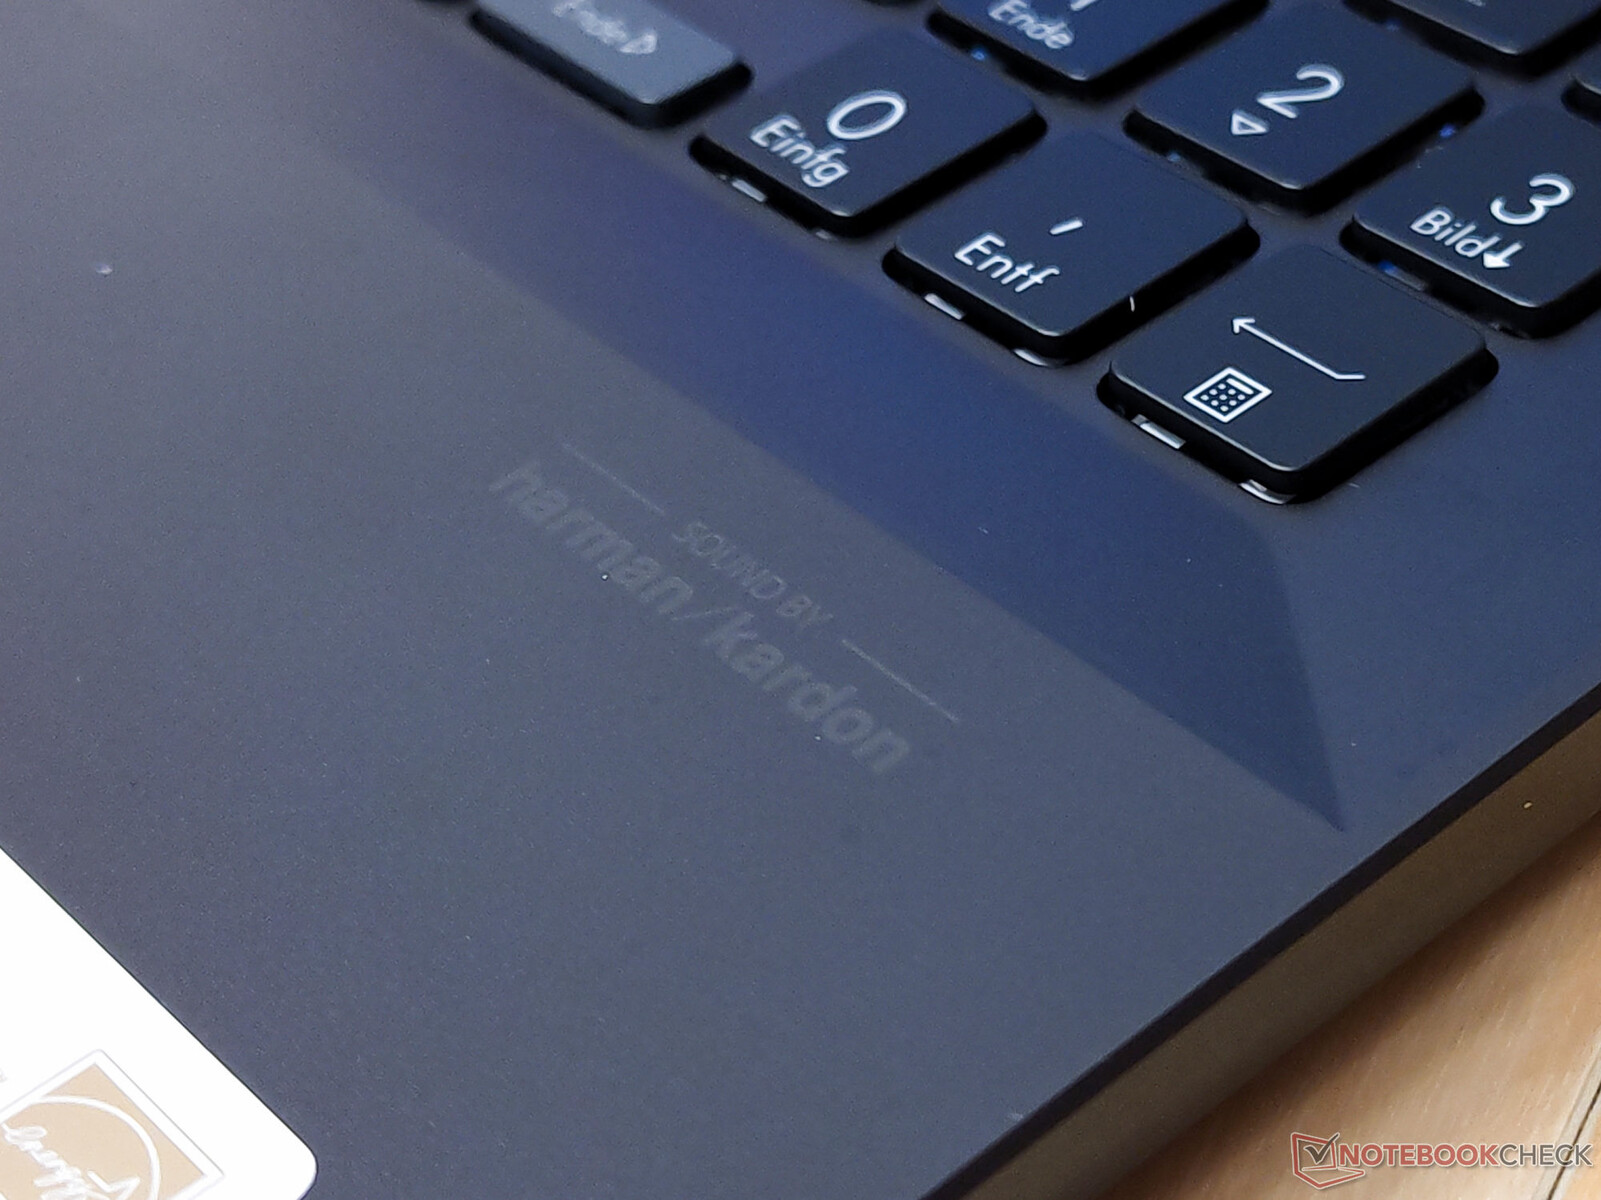
Vivobook har svårt att producera linjärt ljud. Trots logotypen "Sound by Harman/Kardon" är ljudupplevelsen relativt dålig. De små högtalarna saknar bas. Den betydande övermoduleringen av högre frekvenser är ett mycket större problem. De är ofta för högljudda även vid lägre volymnivåer. I detta avseende finns det utrymme för förbättringar.
Asus VivoBook Pro 16X OLED N7600PC-L2026X ljudanalys
(+) | högtalare kan spela relativt högt (89 dB)
Bas 100 - 315 Hz
(-) | nästan ingen bas - i genomsnitt 19.4% lägre än medianen
(±) | linjäriteten för basen är genomsnittlig (7.8% delta till föregående frekvens)
Mellan 400 - 2000 Hz
(+) | balanserad mellan - endast 1.3% från medianen
(+) | mids är linjära (2.7% delta till föregående frekvens)
Högsta 2 - 16 kHz
(±) | högre toppar - i genomsnitt 7.7% högre än medianen
(+) | toppar är linjära (6.8% delta till föregående frekvens)
Totalt 100 - 16 000 Hz
(±) | linjäriteten för det totala ljudet är genomsnittlig (16% skillnad mot median)
Jämfört med samma klass
» 41% av alla testade enheter i den här klassen var bättre, 6% liknande, 53% sämre
» Den bästa hade ett delta på 5%, genomsnittet var 17%, sämst var 45%
Jämfört med alla testade enheter
» 25% av alla testade enheter var bättre, 5% liknande, 70% sämre
» Den bästa hade ett delta på 4%, genomsnittet var 24%, sämst var 134%
MSI Summit E16 Flip A12UDT-031 ljudanalys
(±) | högtalarljudstyrkan är genomsnittlig men bra (79.8 dB)
Bas 100 - 315 Hz
(-) | nästan ingen bas - i genomsnitt 23.6% lägre än medianen
(-) | basen är inte linjär (15.1% delta till föregående frekvens)
Mellan 400 - 2000 Hz
(±) | högre mellan - i genomsnitt 5.6% högre än median
(±) | linjäriteten för mids är genomsnittlig (7.4% delta till föregående frekvens)
Högsta 2 - 16 kHz
(±) | högre toppar - i genomsnitt 5.6% högre än medianen
(+) | toppar är linjära (4.5% delta till föregående frekvens)
Totalt 100 - 16 000 Hz
(±) | linjäriteten för det totala ljudet är genomsnittlig (22.6% skillnad mot median)
Jämfört med samma klass
» 68% av alla testade enheter i den här klassen var bättre, 5% liknande, 27% sämre
» Den bästa hade ett delta på 6%, genomsnittet var 20%, sämst var 57%
Jämfört med alla testade enheter
» 67% av alla testade enheter var bättre, 6% liknande, 28% sämre
» Den bästa hade ett delta på 4%, genomsnittet var 24%, sämst var 134%
Schenker XMG Focus 15 ljudanalys
(±) | högtalarljudstyrkan är genomsnittlig men bra (78 dB)
Bas 100 - 315 Hz
(-) | nästan ingen bas - i genomsnitt 25.5% lägre än medianen
(±) | linjäriteten för basen är genomsnittlig (8.4% delta till föregående frekvens)
Mellan 400 - 2000 Hz
(+) | balanserad mellan - endast 4.9% från medianen
(+) | mids är linjära (5.6% delta till föregående frekvens)
Högsta 2 - 16 kHz
(+) | balanserade toppar - endast 1.7% från medianen
(+) | toppar är linjära (4.1% delta till föregående frekvens)
Totalt 100 - 16 000 Hz
(±) | linjäriteten för det totala ljudet är genomsnittlig (20% skillnad mot median)
Jämfört med samma klass
» 70% av alla testade enheter i den här klassen var bättre, 7% liknande, 23% sämre
» Den bästa hade ett delta på 6%, genomsnittet var 18%, sämst var 132%
Jämfört med alla testade enheter
» 51% av alla testade enheter var bättre, 8% liknande, 41% sämre
» Den bästa hade ett delta på 4%, genomsnittet var 24%, sämst var 134%
Energihantering - Inga rekordlånga körtider trots batteriet på 96 Wh
Energiförbrukning
Vivobook Pro 16X OLED visar rimliga förbrukningsvärden i våra tester. Naturligtvis kräver den kraftfulla hårdvaran något mer ström när du utför krävande uppgifter. Vid tomgångskörning ökar energiförbrukningen för Asus bärbara dator något med några watt jämfört med andra enheter i vår jämförelse. Vi fann dock ofta att bärbara datorer med OLED-skärmar hade en liten nackdel i den här aspekten jämfört med LCD-modeller.
| Av/Standby | |
| Låg belastning | |
| Hög belastning |
|
Förklaring:
min: | |
| Asus VivoBook Pro 16X OLED N7600PC-L2026X i7-11370H, GeForce RTX 3050 4GB Laptop GPU, Intel Optane Memory H10 with Solid State Storage 32GB + 512GB HBRPEKNX0202A(L/H), OLED, 3840x2400, 16" | MSI Summit E16 Flip A12UDT-031 i7-1280P, GeForce RTX 3050 Ti Laptop GPU, Samsung PM9A1 MZVL22T0HBLB, IPS, 2560x1600, 16" | Microsoft Surface Laptop Studio i7 RTX 3050 Ti i7-11370H, GeForce RTX 3050 Ti Laptop GPU, SK Hynix PC711 1TB HFS001TDE9X084N, IPS, 2400x1600, 14.4" | Dell Inspiron 16 Plus 7610 i7-11800H, GeForce RTX 3050 4GB Laptop GPU, Kingston OM3PDP3512B, IPS, 3072x1920, 16" | Lenovo ThinkPad X1 Extreme G4-20Y5CTO1WW (3050 Ti) i7-11800H, GeForce RTX 3050 Ti Laptop GPU, Samsung PM9A1 MZVL21T0HCLR, IPS LED, 3840x2400, 16" | Schenker XMG Focus 15 i7-11800H, GeForce RTX 3050 Ti Laptop GPU, Samsung SSD 970 EVO Plus 1TB, IPS, 1920x1080, 15.6" | Genomsnitt NVIDIA GeForce RTX 3050 4GB Laptop GPU | Genomsnitt av klass Multimedia | |
|---|---|---|---|---|---|---|---|---|
| Power Consumption | -12% | 30% | -12% | -47% | -89% | -2% | 13% | |
| Idle Minimum * (Watt) | 8.9 | 9.8 -10% | 2.6 71% | 7.7 13% | 10.3 -16% | 23 -158% | 7.17 ? 19% | 5.69 ? 36% |
| Idle Average * (Watt) | 10.2 | 15.3 -50% | 7.1 30% | 10.7 -5% | 22.06 -116% | 25 -145% | 10.4 ? -2% | 10.1 ? 1% |
| Idle Maximum * (Watt) | 12 | 16.3 -36% | 7.9 34% | 16.8 -40% | 23 -92% | 29 -142% | 14.8 ? -23% | 12.3 ? -3% |
| Load Average * (Watt) | 94 | 87 7% | 76.8 18% | 100.39 -7% | 102.57 -9% | 106 -13% | 89.7 ? 5% | 65.3 ? 31% |
| Witcher 3 ultra * (Watt) | 93.1 | 86.1 8% | 83 11% | 108 -16% | 106 -14% | 128 -37% | ||
| Load Maximum * (Watt) | 112 | 100 11% | 97.3 13% | 129 -15% | 147.8 -32% | 156 -39% | 124.8 ? -11% | 112.5 ? -0% |
* ... mindre är bättre
Consumption Witcher 3 / Stress Test
Consumption external Monitor
Batteritid
Tack vare den höga batterikapaciteten på 96 Wh kan man förvänta sig en lång batteritid. Kapaciteten når nästan upp till den lagstadgade gränsen för en bärbar dator. Den högupplösta 16-tums OLED-skärmen med hög upplösning är dock klart generös när det gäller användningen av batteriets resurser. Vid maximal ljusstyrka klarar vår Asus-testenhet endast cirka 6:30 timmar i vårt verkliga Wi-Fi-test. Att minska ljusstyrkan till 150 nits ger redan 2 timmars längre drifttid. En populär energibesparingsmetod för OLED-skärmar är att tvinga fram ett mörkt läge när det är möjligt. Varje ljust område på skärmen förbrukar ström. Eftersom många stora vita områden ofta visas under vårt test för webbsökning är det särskilt oförlåtande för OLED-skärmar.
| Asus VivoBook Pro 16X OLED N7600PC-L2026X i7-11370H, GeForce RTX 3050 4GB Laptop GPU, 96 Wh | MSI Summit E16 Flip A12UDT-031 i7-1280P, GeForce RTX 3050 Ti Laptop GPU, 82 Wh | Microsoft Surface Laptop Studio i7 RTX 3050 Ti i7-11370H, GeForce RTX 3050 Ti Laptop GPU, 58 Wh | Dell Inspiron 16 Plus 7610 i7-11800H, GeForce RTX 3050 4GB Laptop GPU, 86 Wh | Lenovo ThinkPad X1 Extreme G4-20Y5CTO1WW (3050 Ti) i7-11800H, GeForce RTX 3050 Ti Laptop GPU, 90 Wh | Schenker XMG Focus 15 i7-11800H, GeForce RTX 3050 Ti Laptop GPU, 49 Wh | Genomsnitt av klass Multimedia | |
|---|---|---|---|---|---|---|---|
| Batteridrifttid | -18% | -34% | 44% | -38% | -53% | 44% | |
| Reader / Idle (h) | 11.1 | 20.5 85% | 6.5 -41% | 25.2 ? 127% | |||
| WiFi v1.3 (h) | 8.7 | 7.1 -18% | 8 -8% | 9.9 14% | 6.6 -24% | 3.9 -55% | 12 ? 38% |
| Load (h) | 2.5 | 1 -60% | 3.3 32% | 1.2 -52% | 0.9 -64% | 1.675 ? -33% | |
| H.264 (h) | 12.3 | 6.7 | 16.4 ? |
För
Emot
Omdöme - Genomsnittlig prestanda, enastående skärm
Skärmen på Asus Vivobook Pro 16X OLED är utan tvekan dess bästa egenskap. OLED-panelen lyser med naturliga färger och mycket snabba svarstider. Dess nackdelar är nästan helt begränsade till utomhusbruk. Den bärbara datorns funktioner motsvarar mestadels våra förväntningar på en bärbar dator för multimedia i övre mellanklassen. Med det sagt är den något tröga Optane-lagringen och det lägre versionsnumret på USB-portarna till vänster en viss besvikelse. USB 2.0 är föråldrat med dagens mått mätt.
Aluminiumchassit är subtilt men visuellt tilltalande. Vävbeläggningen är förvånansvärt resistent mot fett, behaglig att röra vid och alltid en intressant syn att se. Tyvärr har Asus tappat bollen när det gäller byggkvaliteten. Helhetsintrycket lider av ojämna friktioner på flera områden.
Den fantastiska OLED-skärmen på Asus Vivobook Pro 16X drar till sig uppmärksamheten. Men den bärbara datorn erbjuder också en medelhög till hög prestandanivå och ett totalt sett hyggligt hölje. Paketet avrundas med intressanta funktioner som Asus Dial.
När det gäller priset placerar cirka 1600 USD Vivobook i det övre mellansegmentet. I förhållande till andra enheter i den här kategorin är funktionerna, byggkvaliteten och designen adekvata. Samtidigt är Dell Inspiron 16 Plus 7610 är betydligt billigare. Den senare erbjuder liknande funktioner, en bra IPS-skärm och kan köpas för strax över 1000 USD från olika återförsäljare. Med detta sagt finns andra konfigurationer av Asus Vivobook 16X också tillgängliga för betydligt mindre, beroende på modell.
Pris och tillgänglighet
En liknande konfiguration av Asus Vivobook finns på Amazon.com för cirka 1 500 USD. På Newegg finns samma konfiguration, men med 16 GB i stället för 32 GB RAM, på till salu för 999 USD (ordinarie pris 1399 USD).
Asus VivoBook Pro 16X OLED N7600PC-L2026X
- 11/07/2022 v7 (old)
Marc Herter
Price comparison

