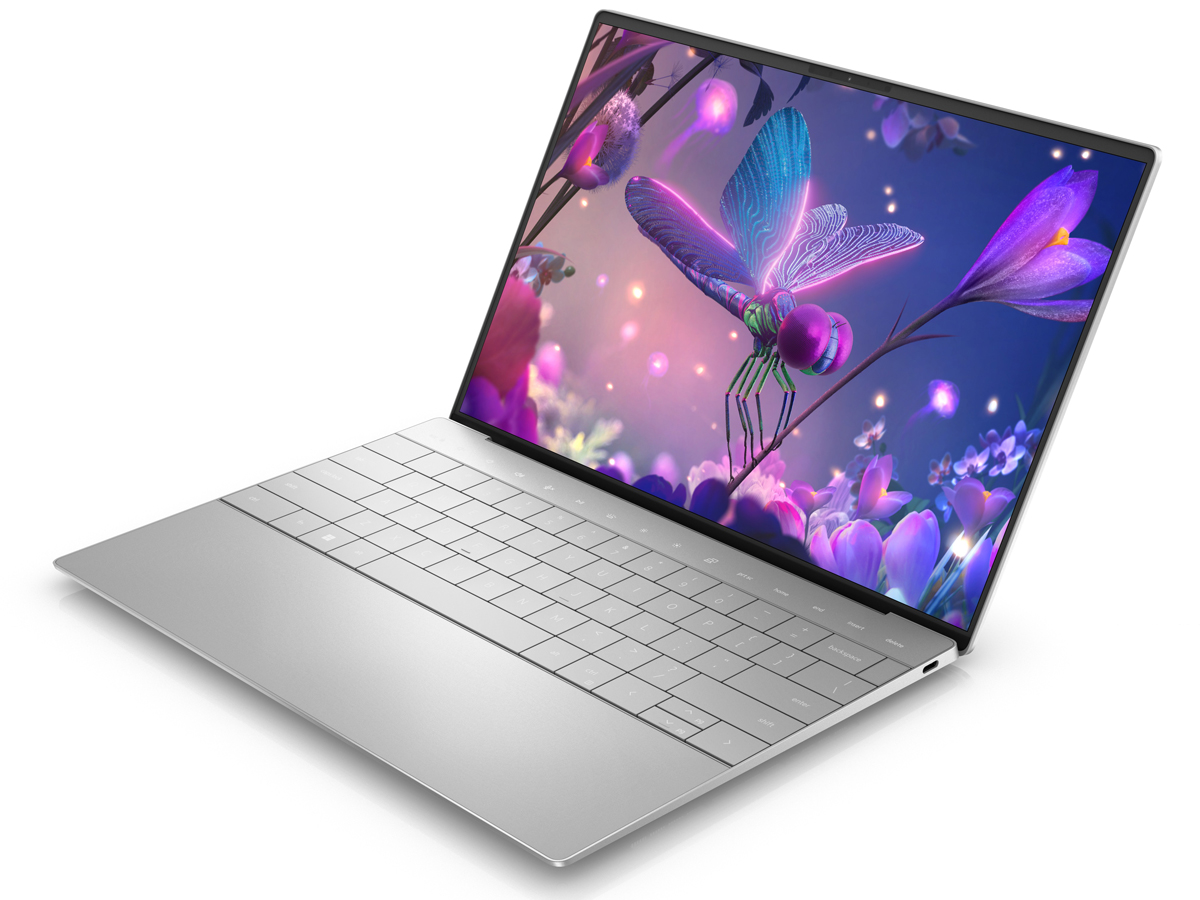
Recension av alla tre varianter av Dell XPS 13 Plus 9320 - Core i5-1240P, i7-1260P eller i7-1280P OLED?
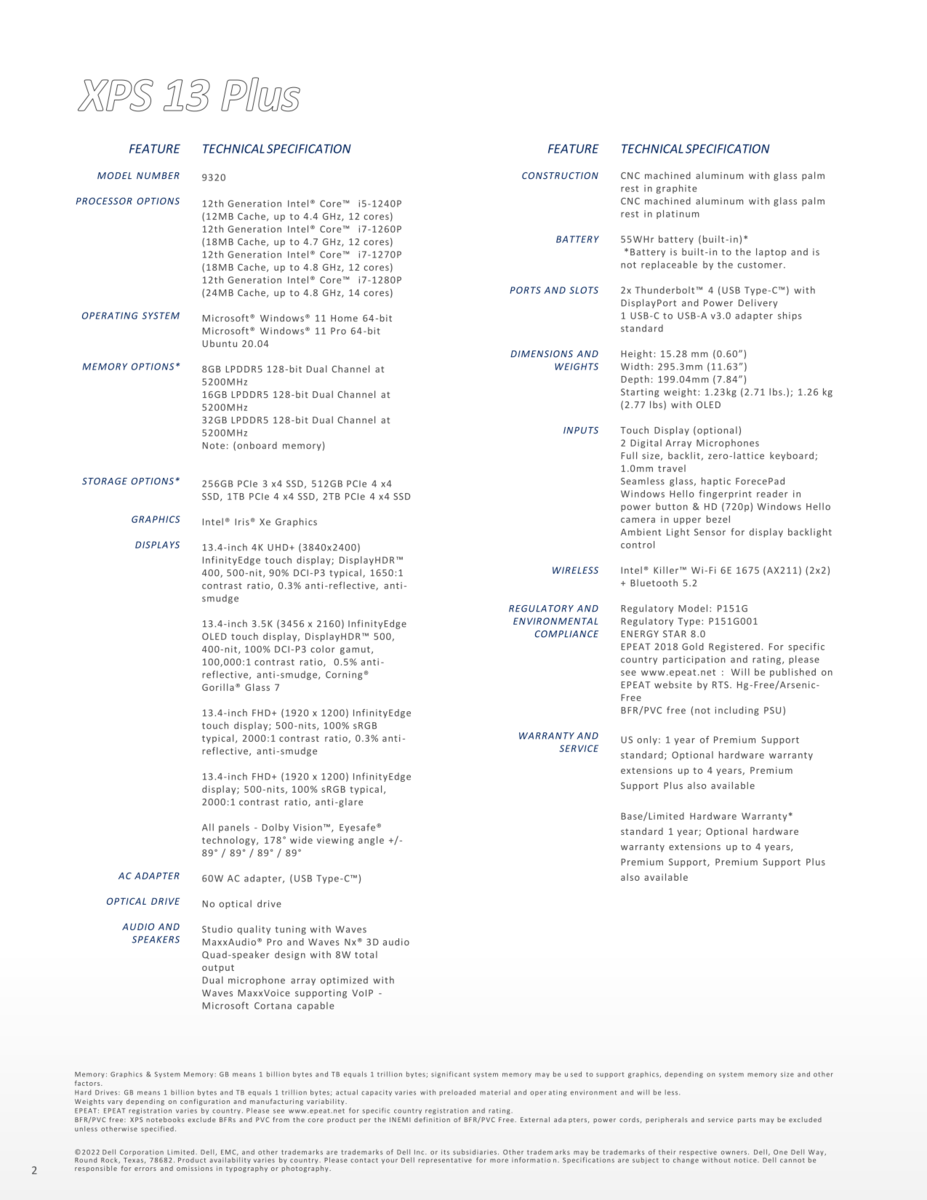
Efter den första presentationen på CES 2022 levereras 2022 XPS 13 Plus nu med tre processoralternativ att välja mellan (Core i5-1240P, Core i7-1260P och Core i7-1280P) tillsammans med tre olika skärmupplösningar (1920 x 1200 IPS, 3456 x 2160 OLED och 3840 x 2400 IPS). Vi har redan testat i5-1240P, i7-1260P, 1200p IPS och 2400p IPS-konfigurationerna, vilket gör att endast i7-1280P 2160p OLED SKU återstår
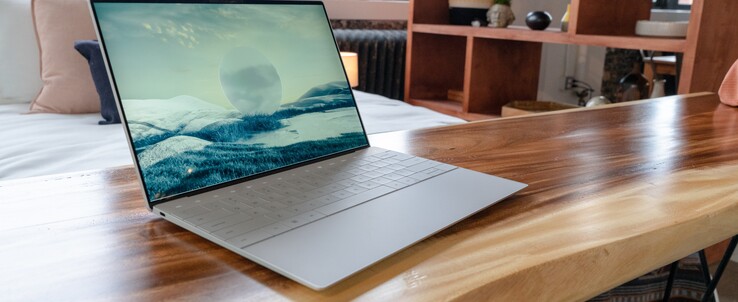
Den här granskningen fokuserar på konfigurationen i7-1280P och 2160p OLED och de skillnader som användare kan förvänta sig mellan den och de andra alternativen för XPS 13 Plus. Som konfigurerad säljs enheten för närvarande för 1750 USD. Vi rekommenderar att du kollar in vår befintliga två recensioner om XPS 13 Plus för att lära dig mer om modellens fysiska egenskaper
Fler recensioner om Dell
Potentiella konkurrenter i jämförelse
Gradering | Datum | Modell | Vikt | Höjd | Storlek | Upplösning | Pris |
|---|---|---|---|---|---|---|---|
| 87.3 % v7 (old) | 09/2022 | Dell XPS 13 Plus 9320 i7-1280P OLED i7-1280P, Iris Xe G7 96EUs | 1.3 kg | 15.28 mm | 13.40" | 3456x2160 | |
| 86.1 % v7 (old) | 08/2022 | Dell XPS 13 Plus 9320 i5-1240p i5-1240P, Iris Xe G7 80EUs | 1.2 kg | 15.3 mm | 13.40" | 1920x1200 | |
| 88.2 % v7 (old) | 08/2022 | Dell XPS 13 9315, i5-1230U i5-1230U, Iris Xe G7 80EUs | 1.2 kg | 14 mm | 13.40" | 1920x1200 | |
| 86.9 % v7 (old) | 07/2022 | Dell XPS 13 Plus 9320 4K i7-1260P, Iris Xe G7 96EUs | 1.2 kg | 15.3 mm | 13.40" | 3840x2400 | |
| 86.7 % v7 (old) | 09/2021 | Dell XPS 13 9310 2-in-1 i7-1165G7, Iris Xe G7 96EUs | 1.3 kg | 14.35 mm | 13.40" | 1920x1200 | |
| 88.3 % v7 (old) | 06/2021 | Dell XPS 13 9310 OLED i7-1185G7, Iris Xe G7 96EUs | 1.2 kg | 14.8 mm | 13.40" | 3456x2160 |
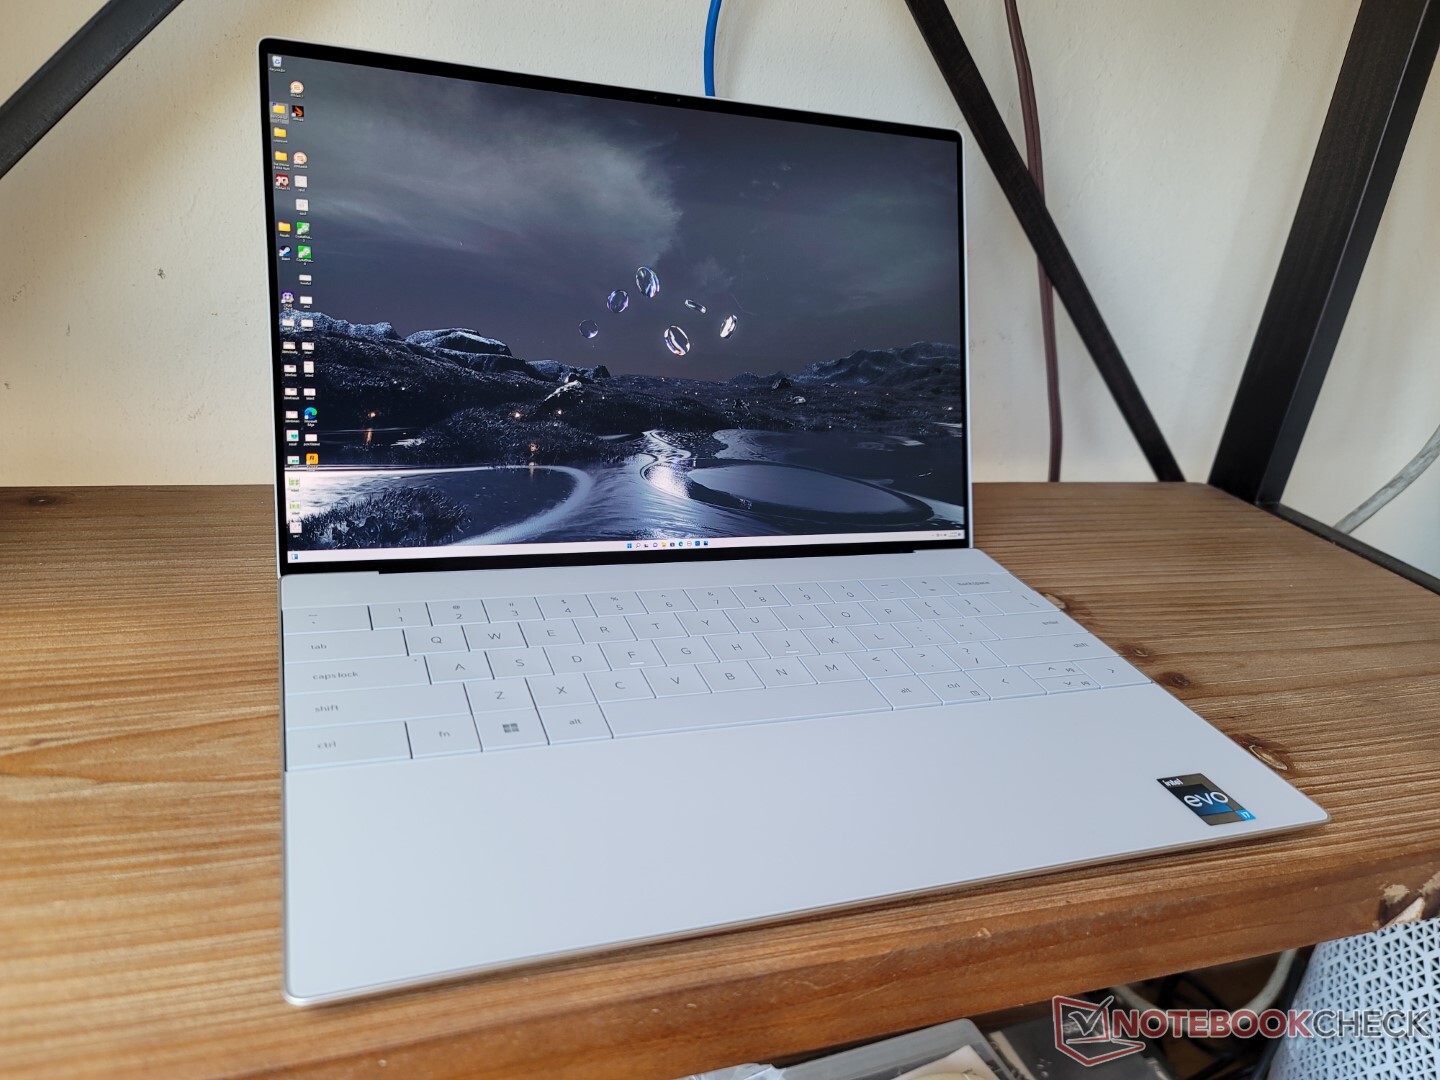
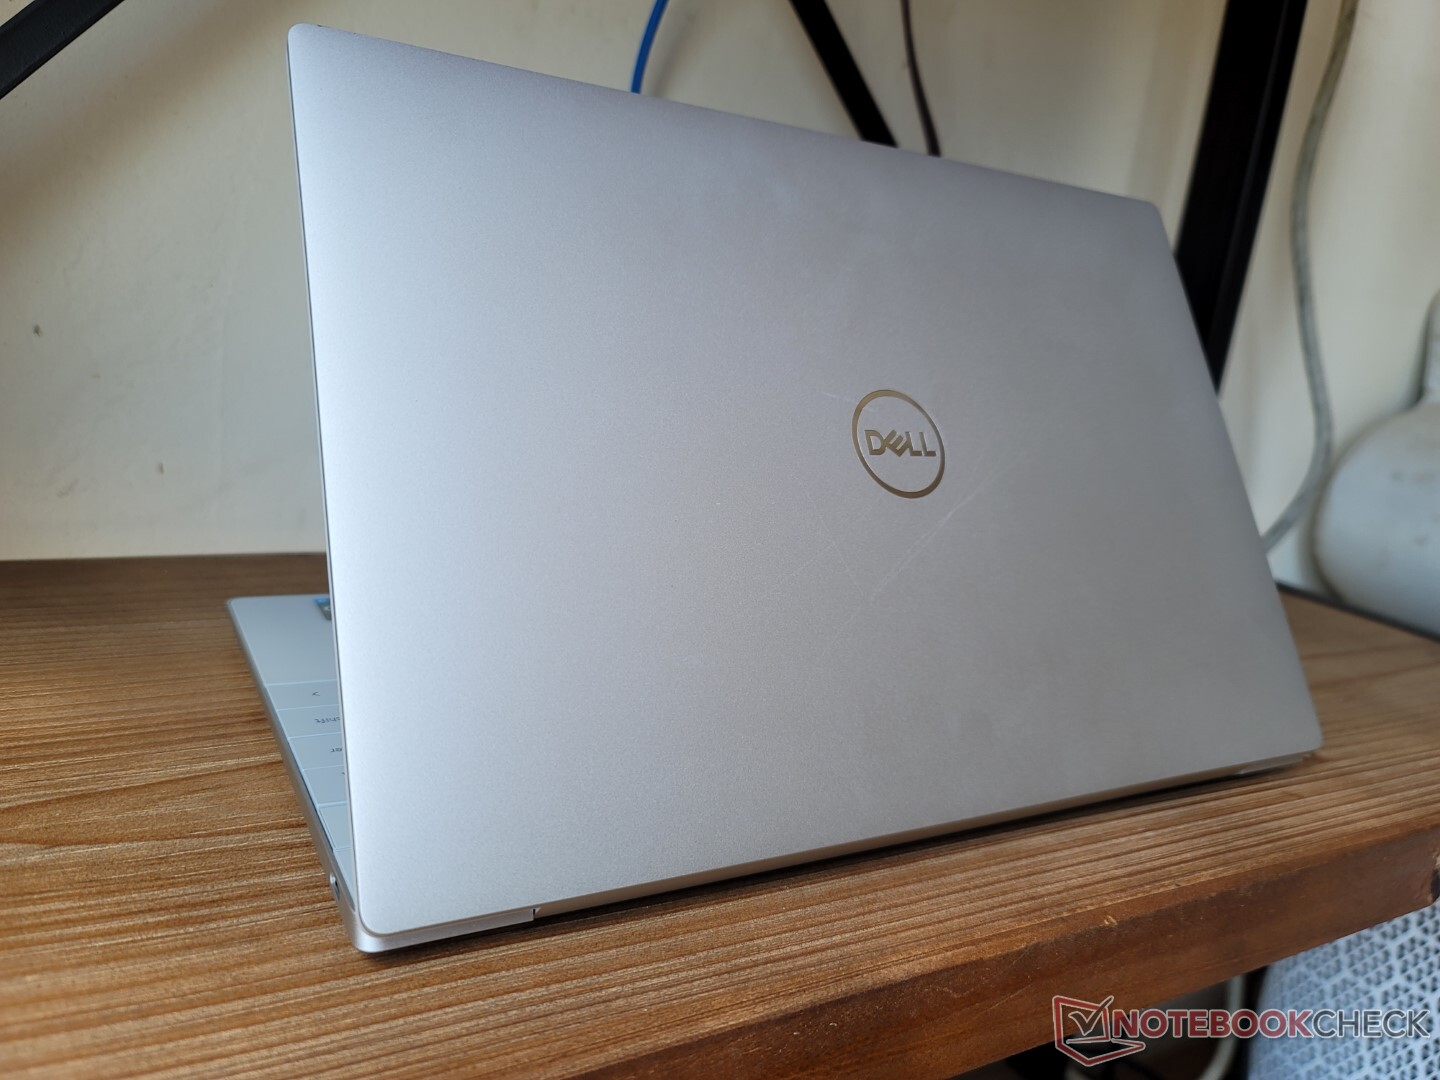
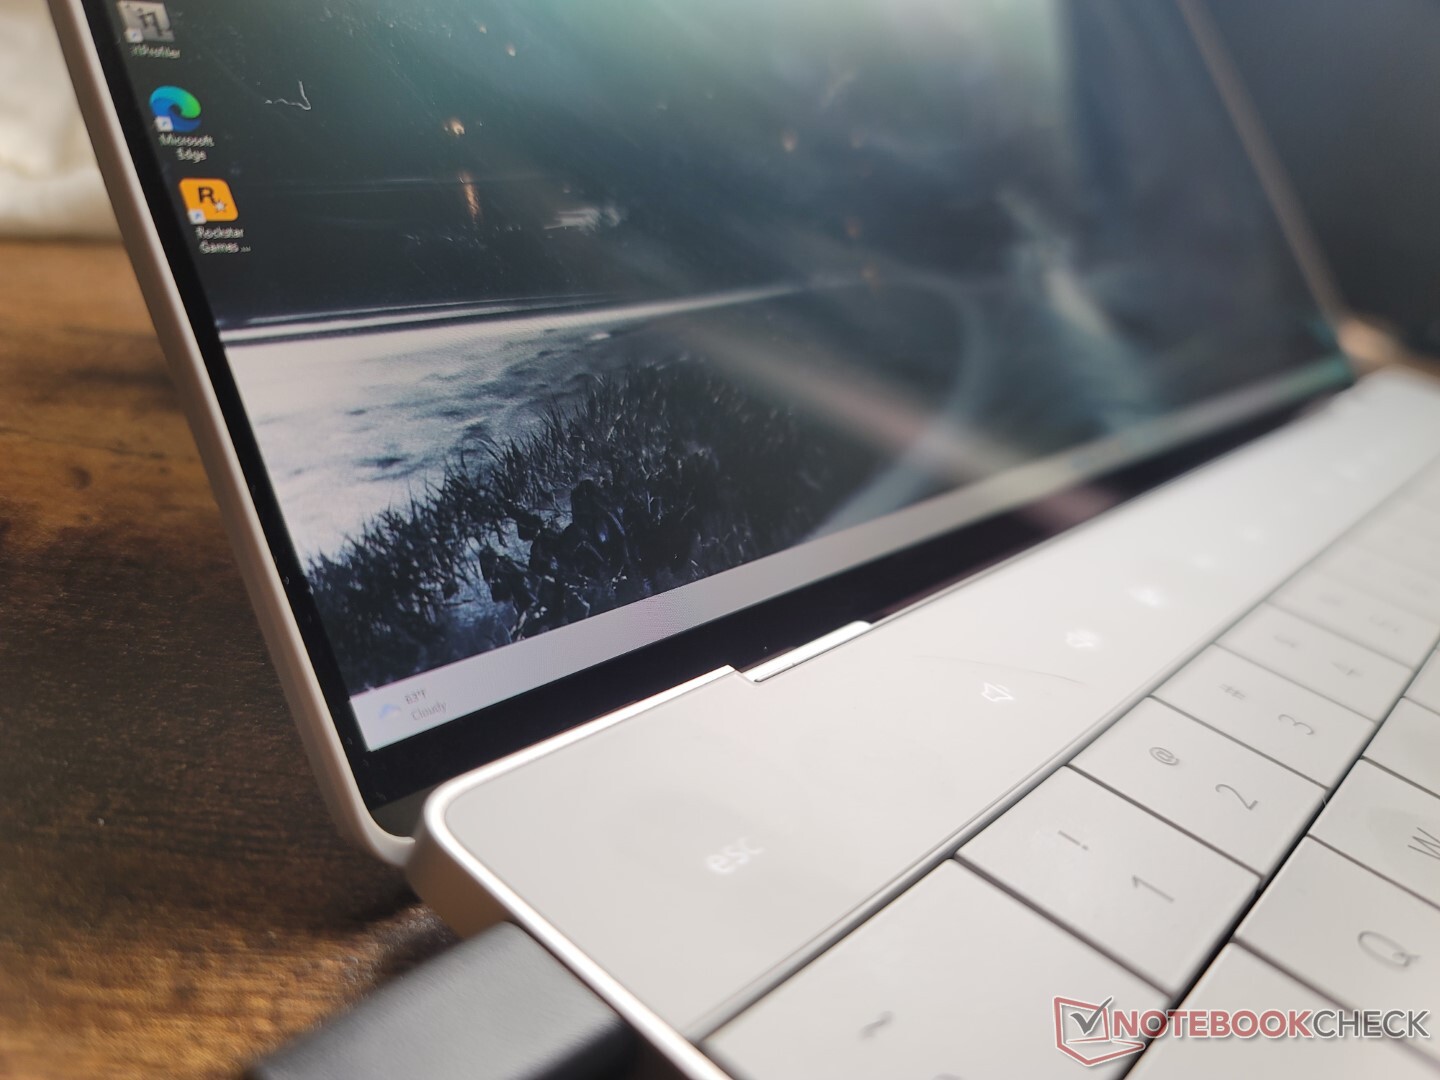
Hölje
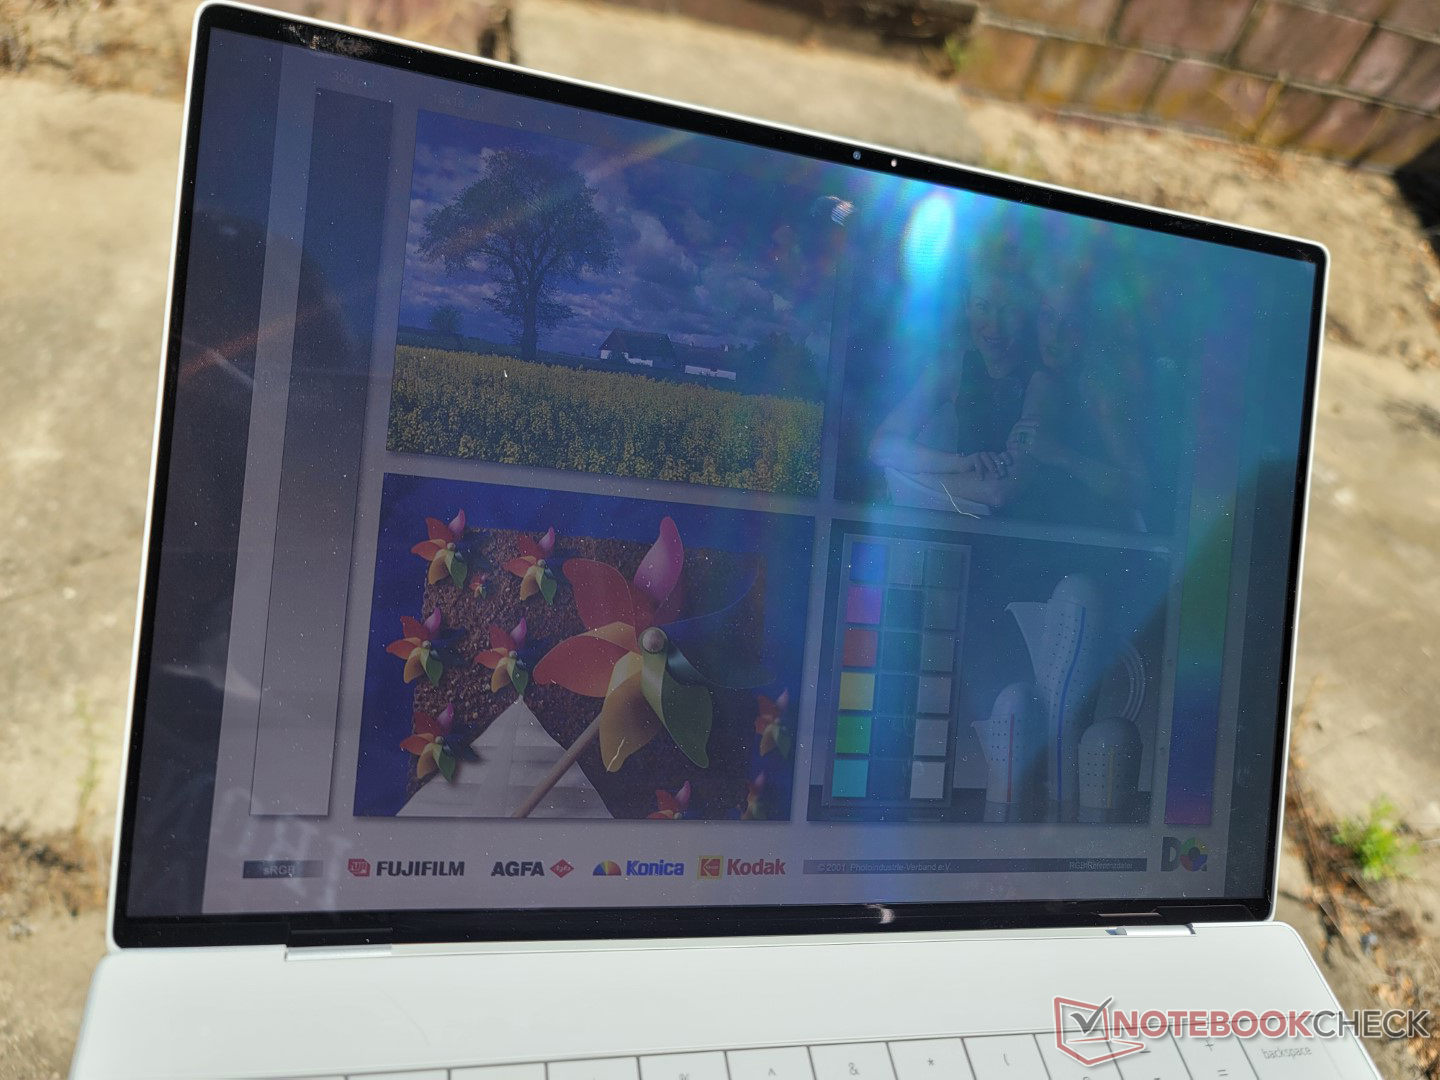
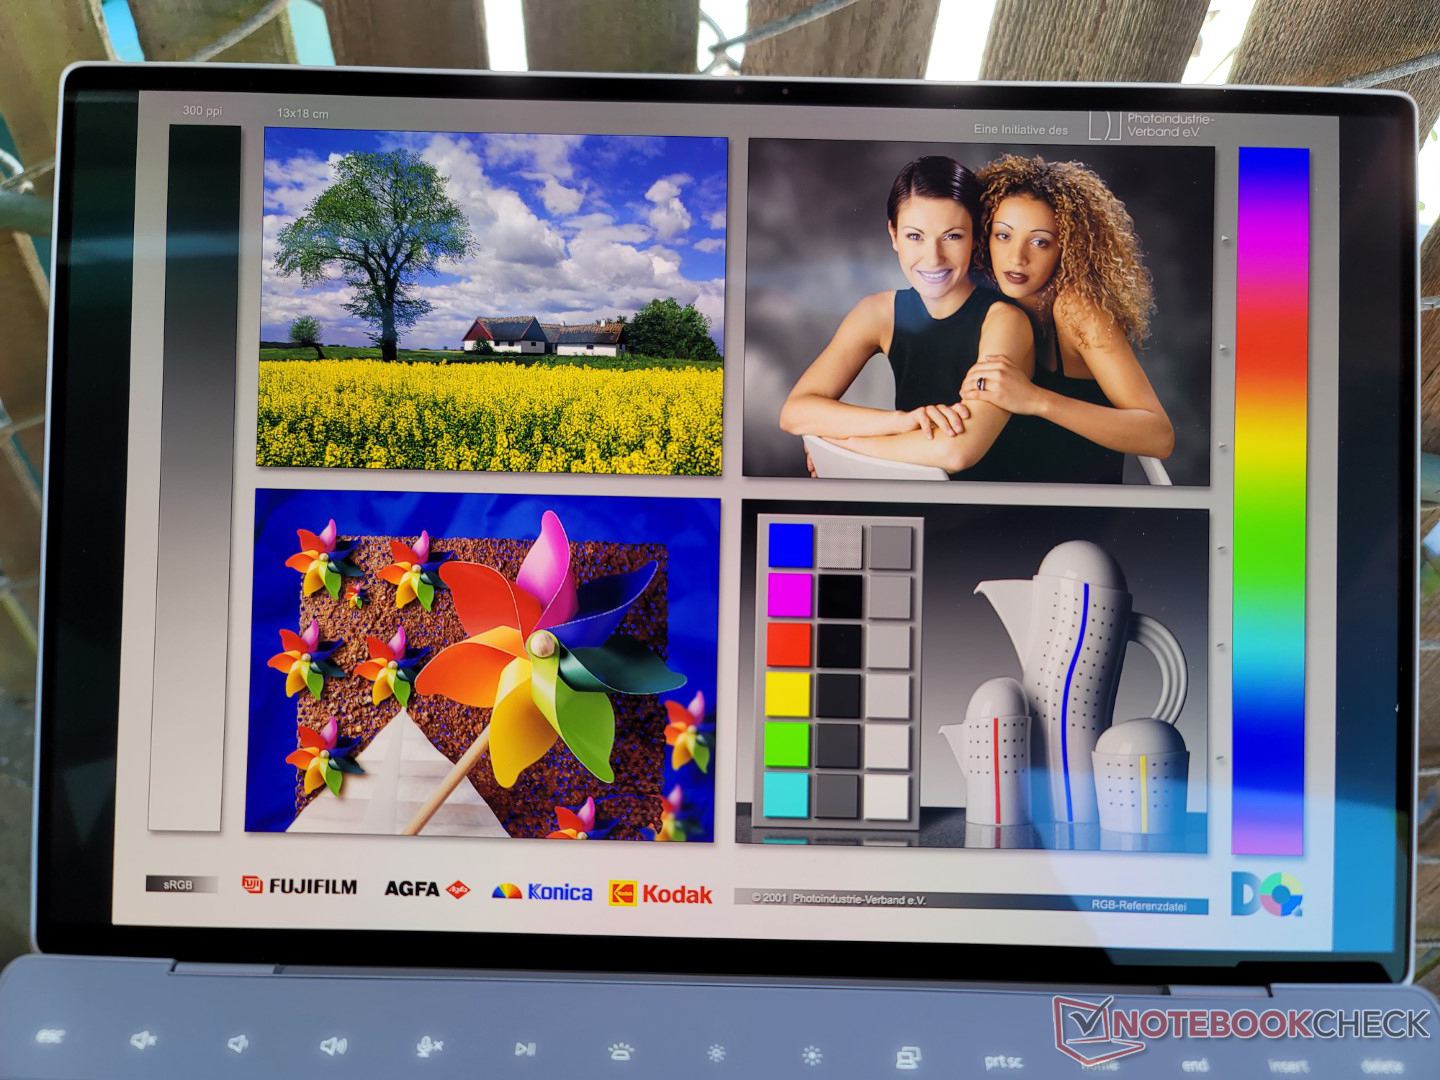
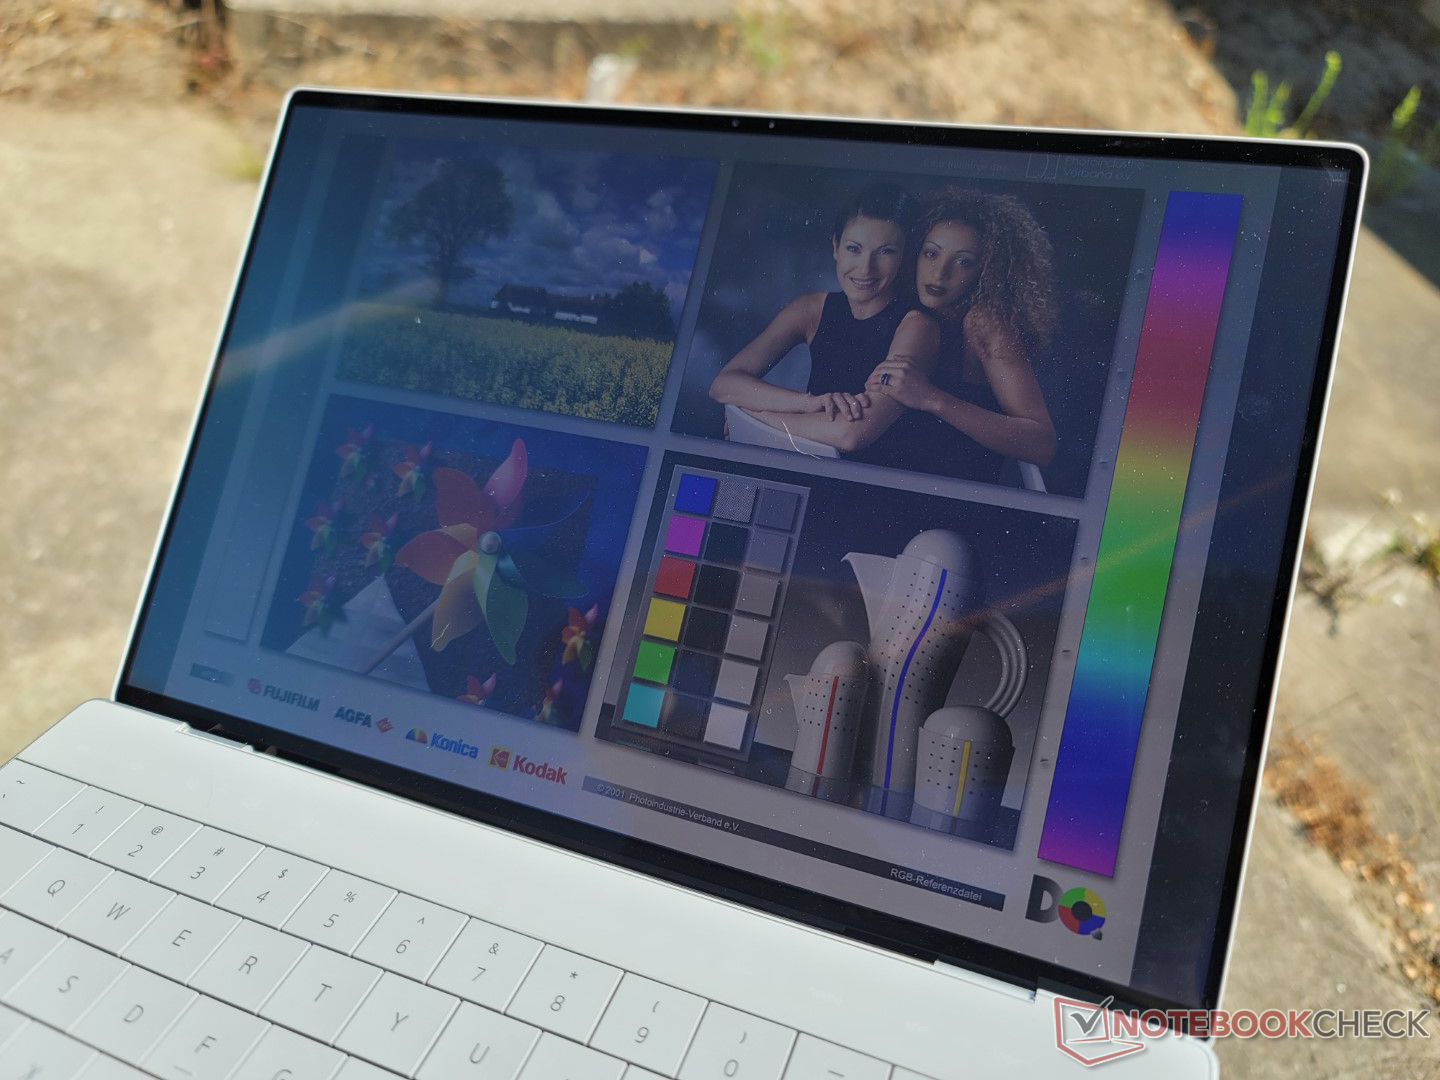
Skärm
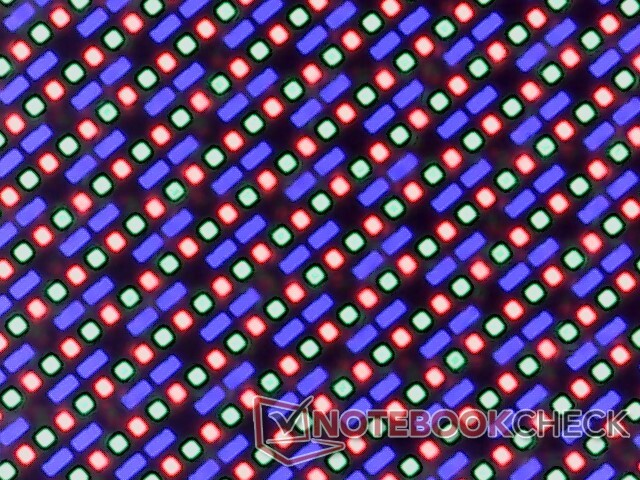
OLED-panelen är inte det bästa alternativet, eftersom den har både fördelar och nackdelar jämfört med IPS-paneler. Fördelarna är bland annat bättre jämnhet i ljusstyrkan, djupare svarta nivåer, full P3-täckning och betydligt snabbare svarstider i svartvitt och grått. Nackdelarna är bl.a. att skärmen flimrar och att den maximala ljusstyrkan är 100 nit lägre. Skillnaden i ljusstyrka bör inte vara något problem om man arbetar inomhus, men IPS-panelerna är något lättare för ögonen om man arbetar utomhus.
Observera att OLED-panelen här är nästan exakt densamma som den som användes i den senaste generationen XPS 13 9310 (Samsung 134XK04 jämfört med Samsung 134XK01). Om du har sett XPS 13 9310 OLED tidigare vet du exakt vad du kan förvänta dig av XPS 13 Plus 9320 OLED.
| |||||||||||||||||||||||||
Distribution av ljusstyrkan: 98 %
Mitt på batteriet: 371.8 cd/m²
Kontrast: ∞:1 (Svärta: 0 cd/m²)
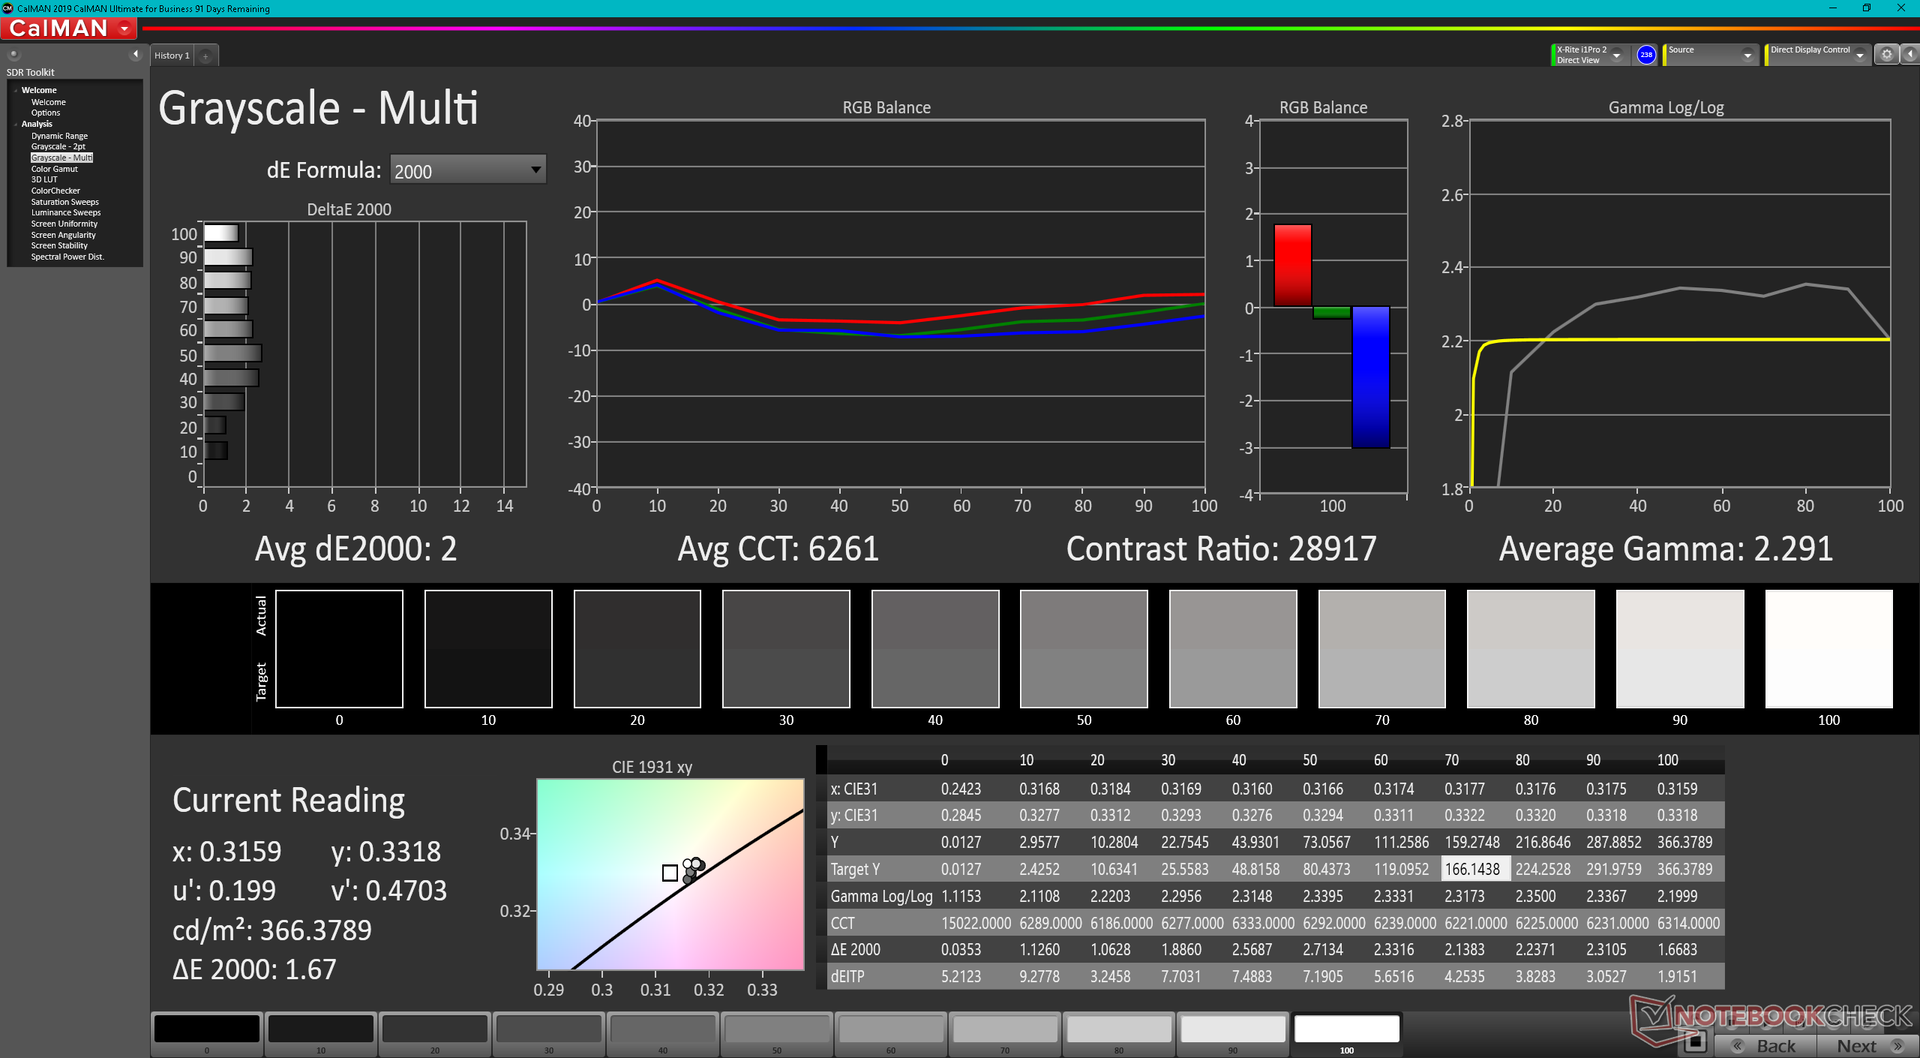
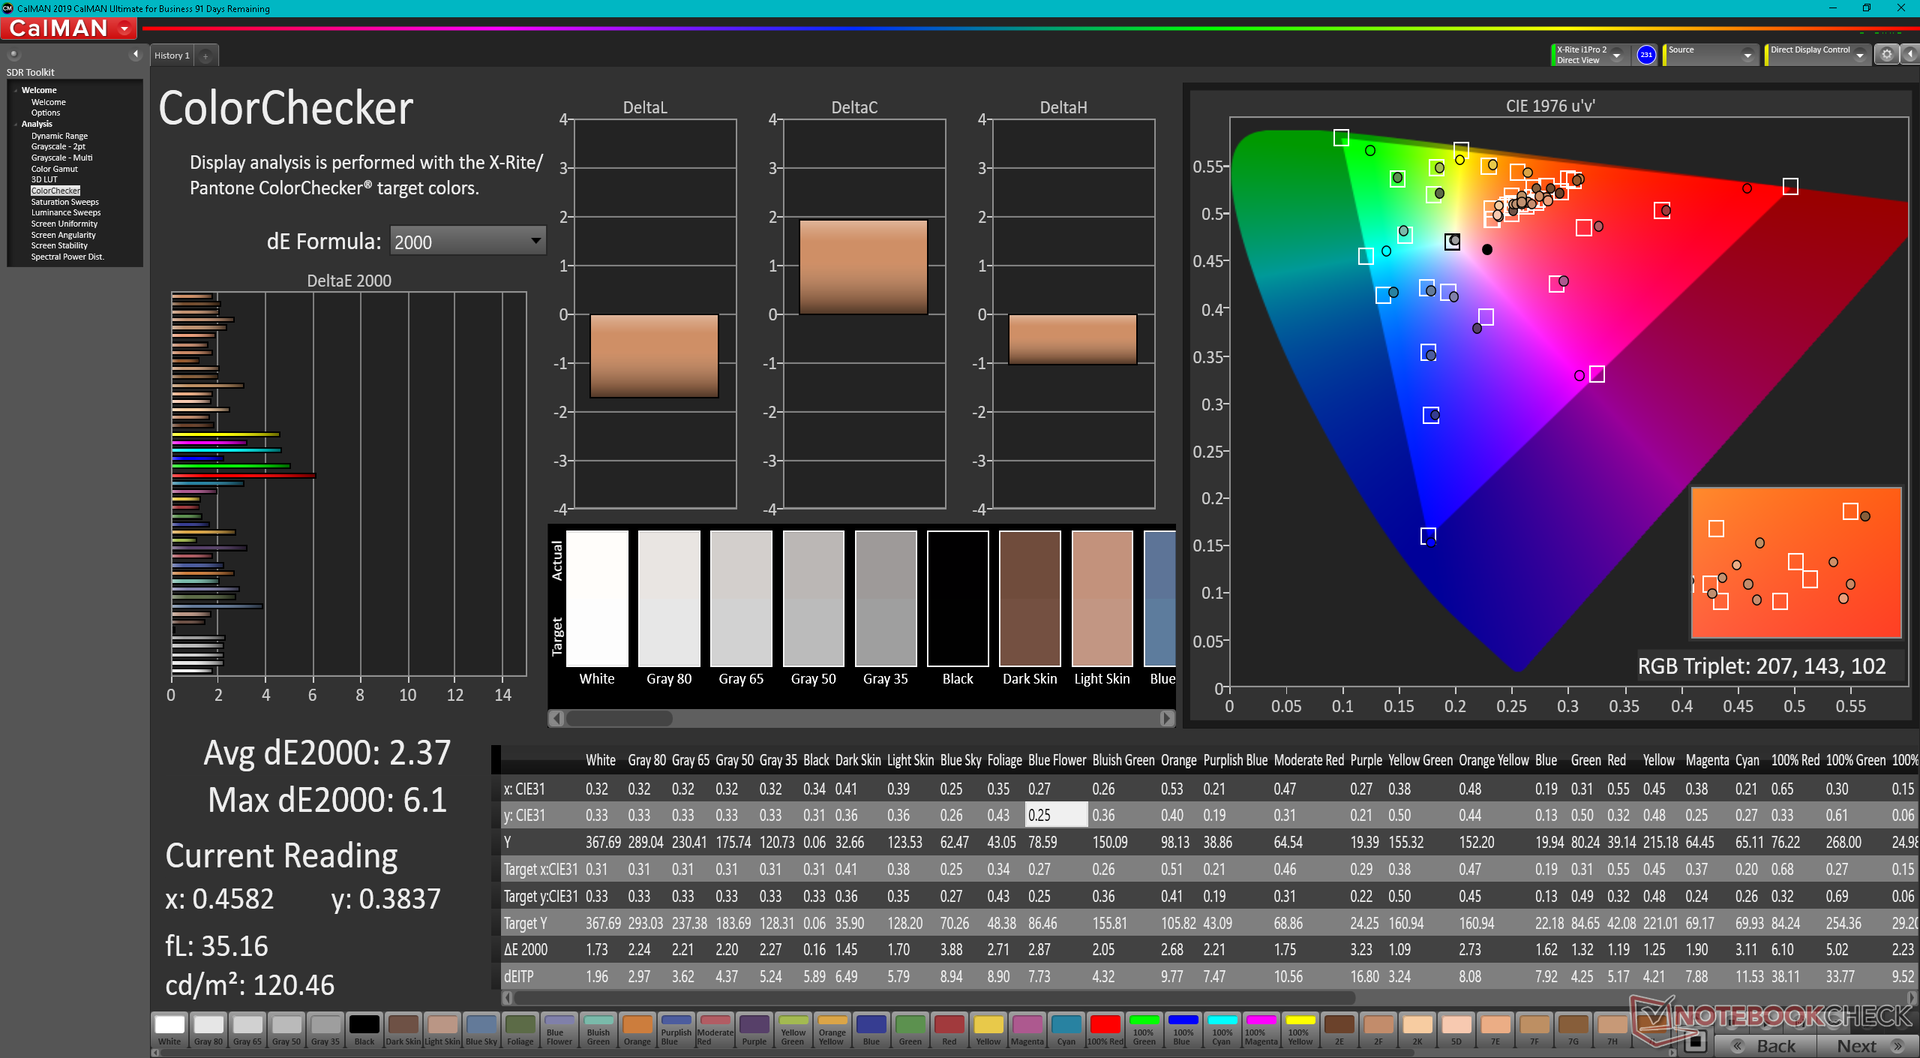
ΔE ColorChecker Calman: 2.37 | ∀{0.5-29.43 Ø4.72}
ΔE Greyscale Calman: 2 | ∀{0.09-98 Ø4.97}
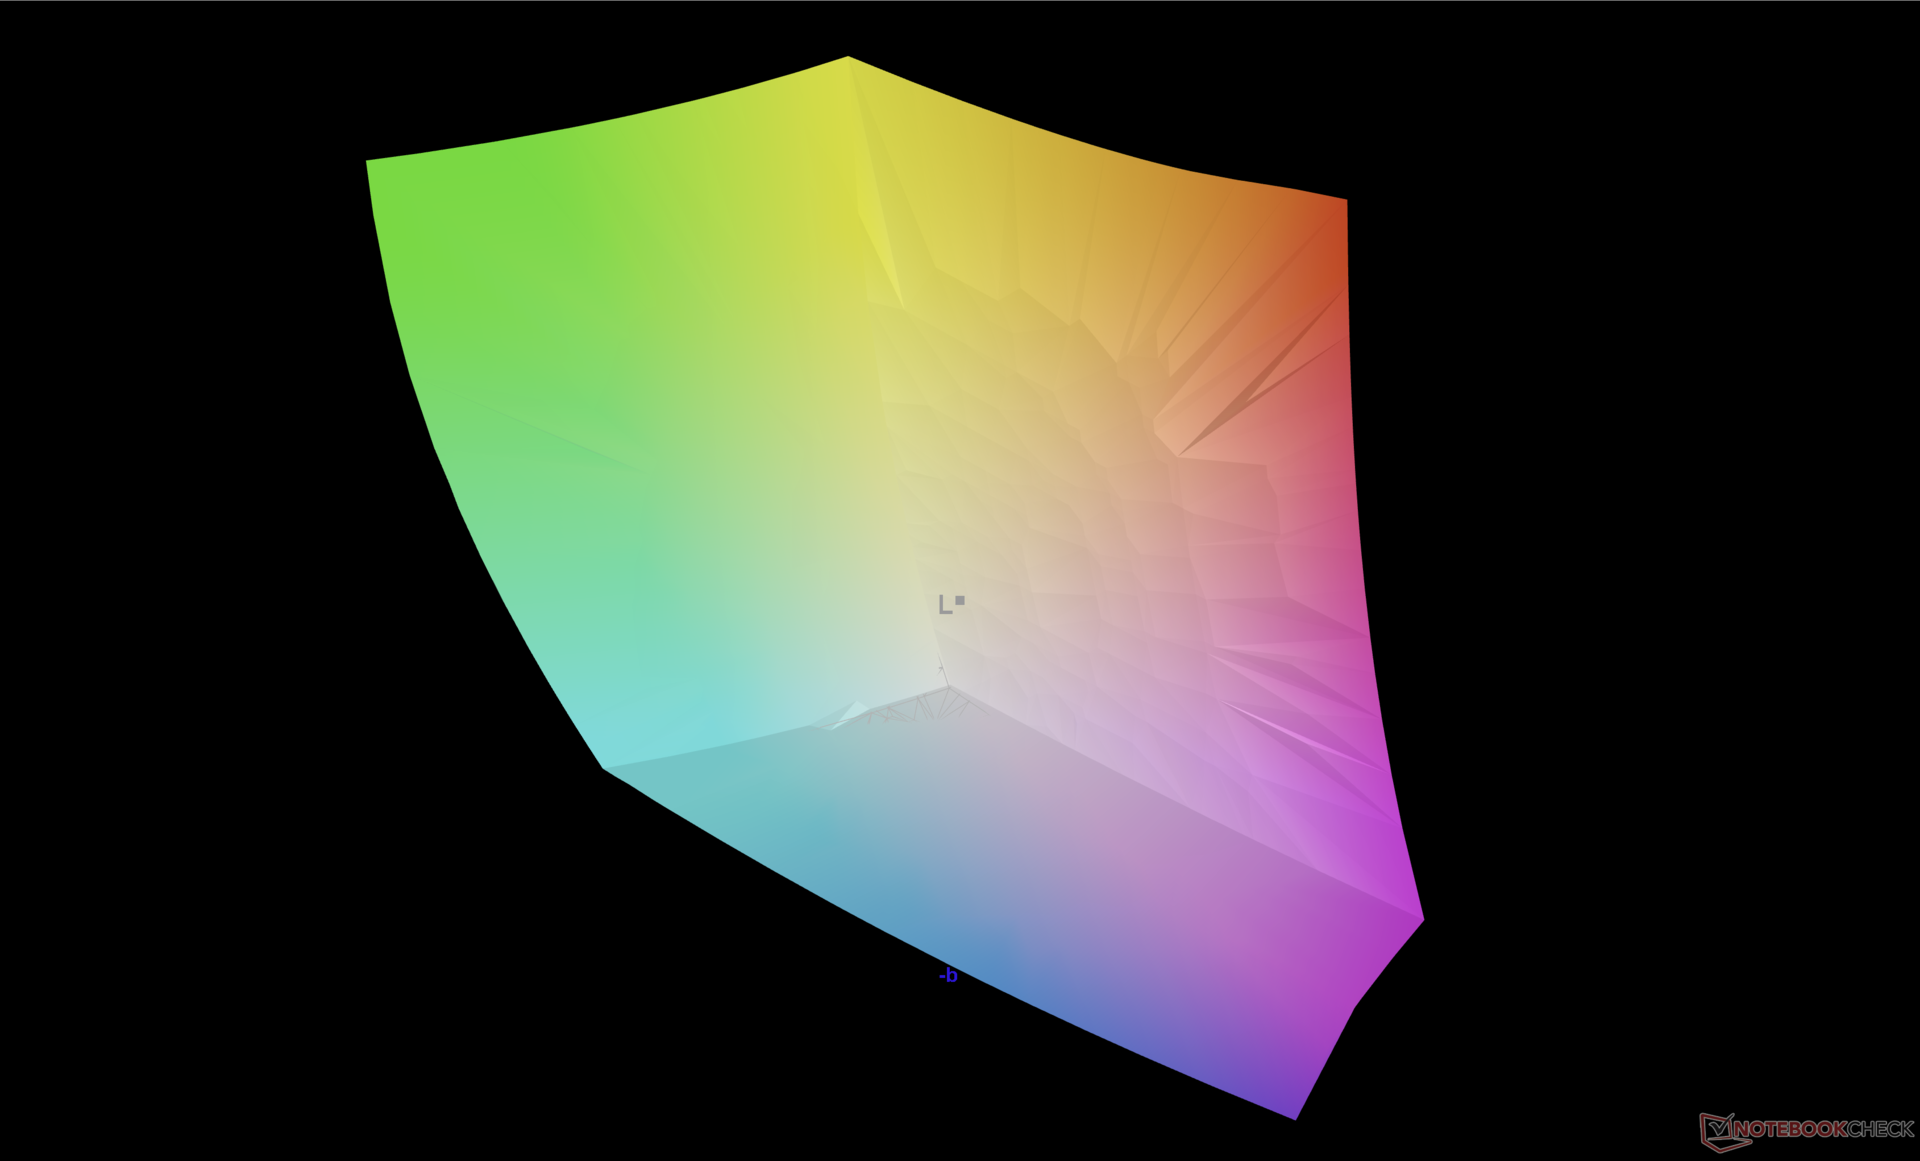
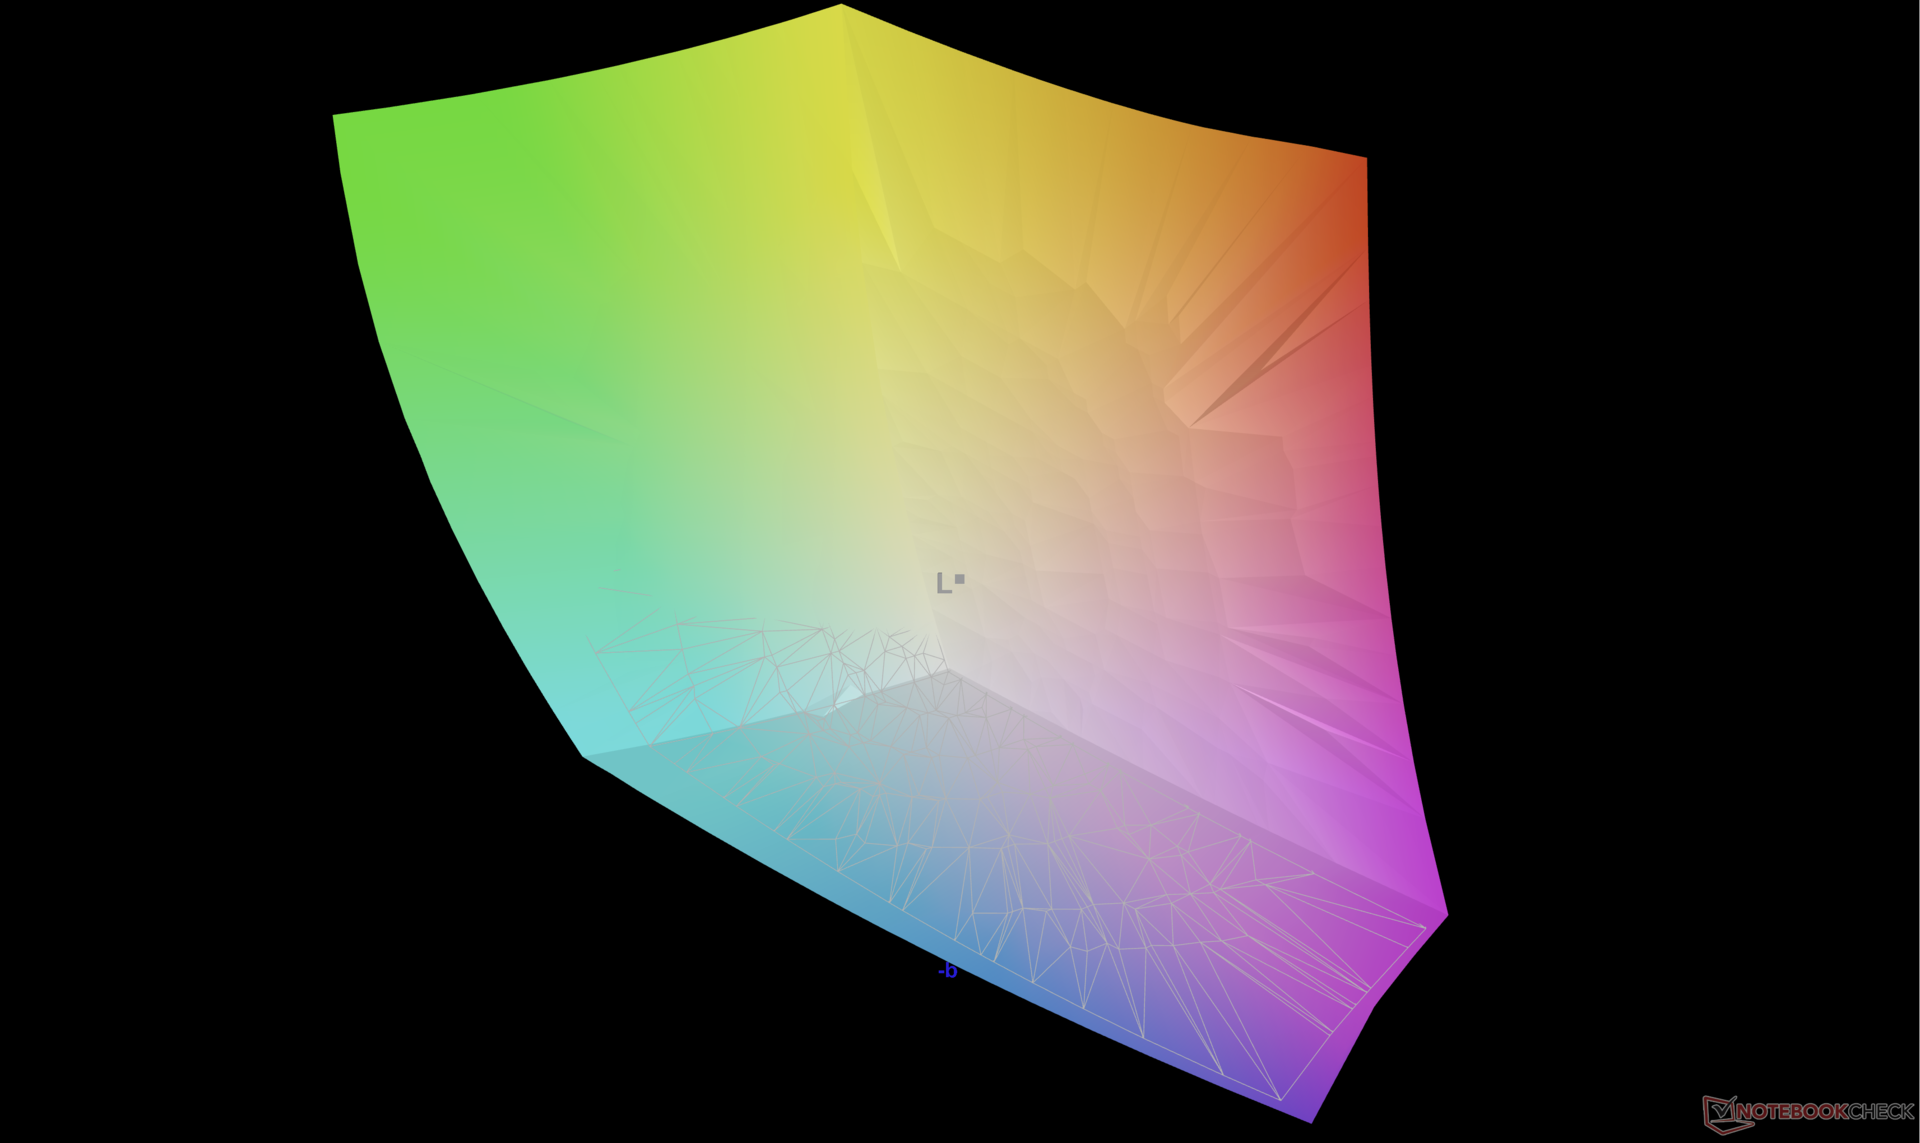
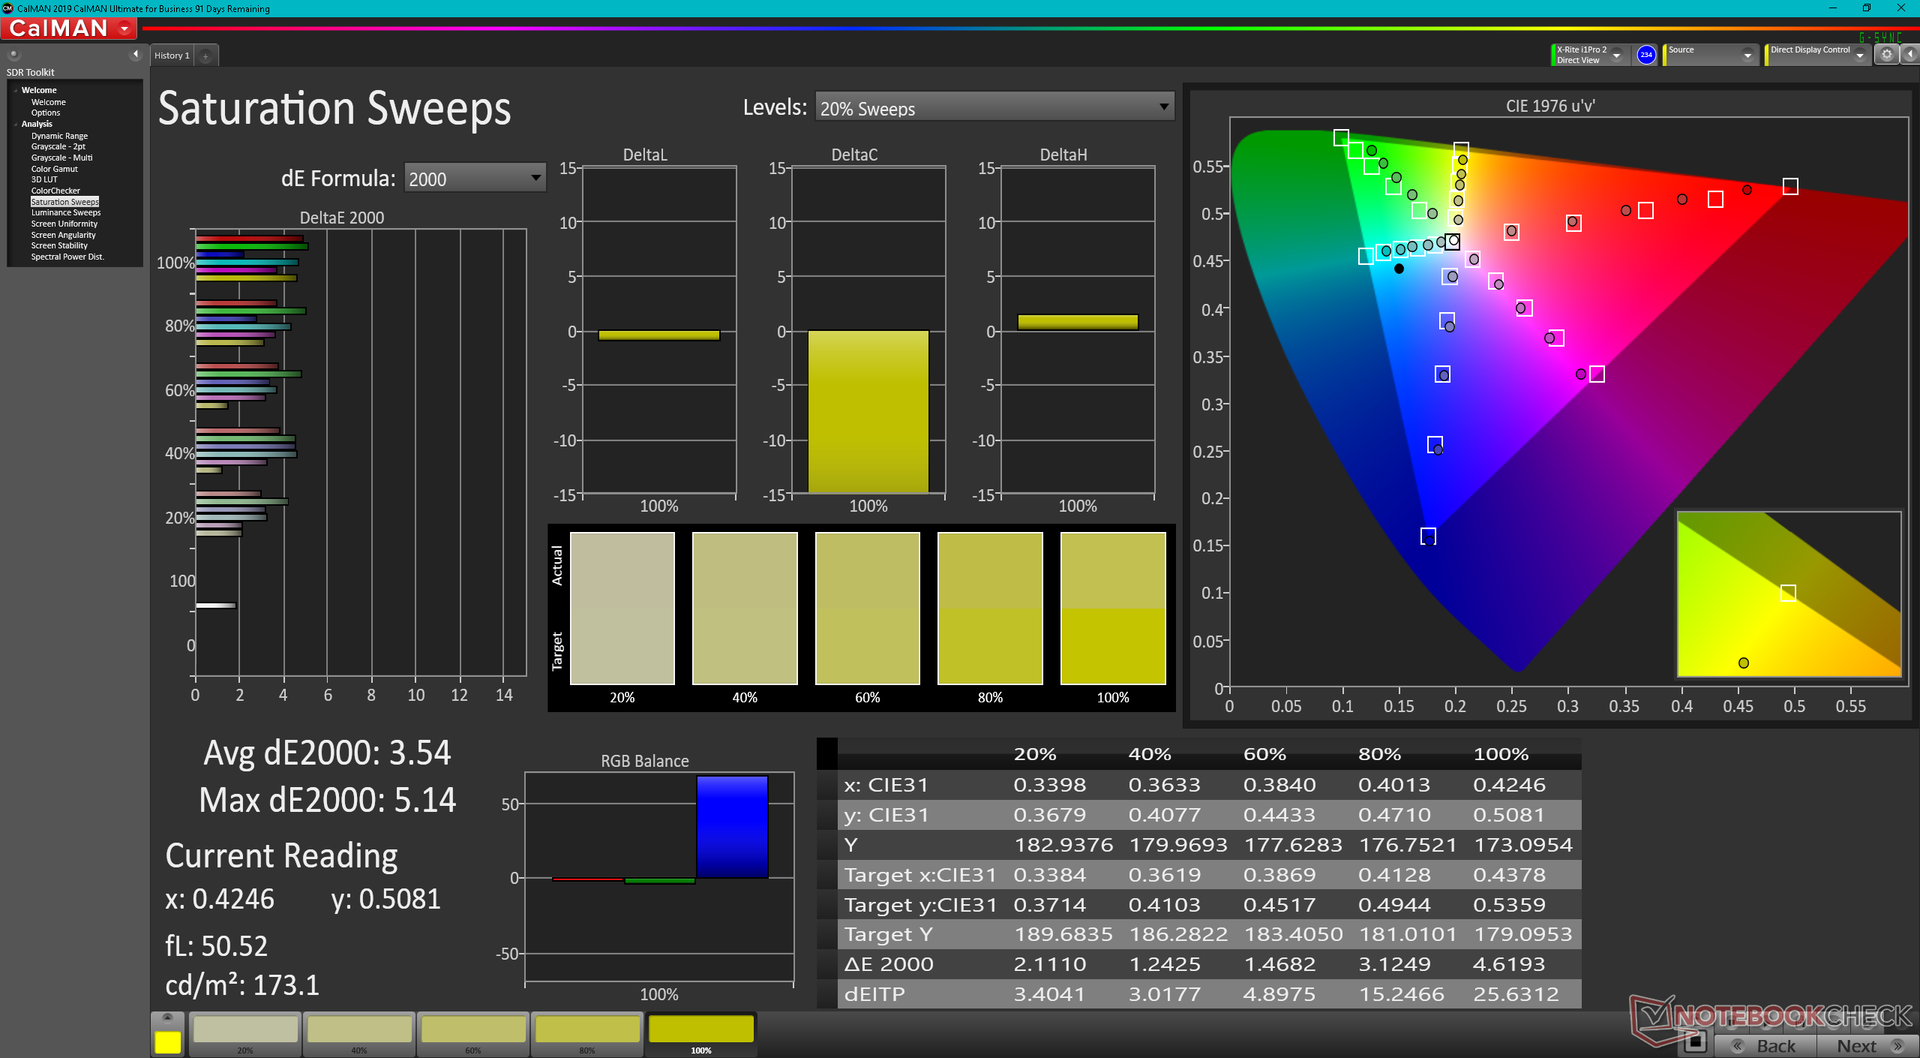
98.4% AdobeRGB 1998 (Argyll 3D)
100% sRGB (Argyll 3D)
99.5% Display P3 (Argyll 3D)
Gamma: 2.29
CCT: 6261 K
| Dell XPS 13 Plus 9320 i7-1280P OLED Samsung 134XK04, OLED, 3456x2160, 13.4" | Dell XPS 13 Plus 9320 i5-1240p Sharp SHP1548 LQ134N1, IPS, 1920x1200, 13.4" | Dell XPS 13 9315, i5-1230U Sharp SHP1548 LQ134N1, IPS, 1920x1200, 13.4" | Dell XPS 13 Plus 9320 4K LQ134R1, IPS, 3840x2400, 13.4" | Dell XPS 13 9310 2-in-1 Sharp LQ134N1, IPS, 1920x1200, 13.4" | Dell XPS 13 9310 OLED Samsung 134XK01, OLED, 3456x2160, 13.4" | |
|---|---|---|---|---|---|---|
| Display | -20% | -20% | -15% | -19% | -0% | |
| Display P3 Coverage (%) | 99.5 | 69 -31% | 69 -31% | 76.5 -23% | 69.7 -30% | 99.7 0% |
| sRGB Coverage (%) | 100 | 99 -1% | 100 0% | 100 0% | 99 -1% | 100 0% |
| AdobeRGB 1998 Coverage (%) | 98.4 | 71 -28% | 71 -28% | 76 -23% | 71.7 -27% | 97.7 -1% |
| Response Times | -1266% | -1193% | -1170% | -1931% | 5% | |
| Response Time Grey 50% / Grey 80% * (ms) | 2.6 ? | 45 ? -1631% | 40 ? -1438% | 38.9 ? -1396% | 55.6 ? -2038% | 2.2 ? 15% |
| Response Time Black / White * (ms) | 2.1 ? | 21 ? -900% | 22 ? -948% | 21.9 ? -943% | 40.4 ? -1824% | 2.2 ? -5% |
| PWM Frequency (Hz) | 59.5 | 2500 ? | 240.4 ? | |||
| Screen | -23% | -10% | -2% | -44% | -14% | |
| Brightness middle (cd/m²) | 371.8 | 498 34% | 466 25% | 494 33% | 555.7 49% | 384 3% |
| Brightness (cd/m²) | 374 | 460 23% | 442 18% | 474 27% | 528 41% | 387 3% |
| Brightness Distribution (%) | 98 | 85 -13% | 89 -9% | 89 -9% | 90 -8% | 97 -1% |
| Black Level * (cd/m²) | 0.53 | 0.4 | 0.28 | 0.35 | ||
| Colorchecker dE 2000 * | 2.37 | 3.65 -54% | 3.03 -28% | 3.1 -31% | 4.83 -104% | 4.56 -92% |
| Colorchecker dE 2000 max. * | 6.1 | 7.11 -17% | 6.68 -10% | 4.2 31% | 8.46 -39% | 7.27 -19% |
| Greyscale dE 2000 * | 2 | 4.25 -113% | 3.12 -56% | 3.2 -60% | 6.1 -205% | 1.5 25% |
| Gamma | 2.29 96% | 2.45 90% | 2.41 91% | 2.41 91% | 1.98 111% | 2.26 97% |
| CCT | 6261 104% | 6690 97% | 6418 101% | 6189 105% | 6686 97% | 6219 105% |
| Contrast (:1) | 940 | 1165 | 1764 | 1588 | ||
| Colorchecker dE 2000 calibrated * | 2.16 | 2.34 | 1.5 | 0.76 | 4.52 | |
| Color Space (Percent of AdobeRGB 1998) (%) | 87.1 | |||||
| Color Space (Percent of sRGB) (%) | 100 | |||||
| Totalt genomsnitt (program/inställningar) | -436% /
-248% | -408% /
-228% | -396% /
-218% | -665% /
-381% | -3% /
-7% |
* ... mindre är bättre
Visa svarstider
| ↔ Svarstid svart till vitt | ||
|---|---|---|
| 2.1 ms ... stiga ↗ och falla ↘ kombinerat | ↗ 0.8 ms stiga | 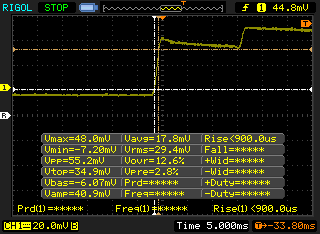 |
| ↘ 1.3 ms hösten | ||
| Skärmen visar väldigt snabba svarsfrekvenser i våra tester och borde vara mycket väl lämpad för fartfyllt spel. I jämförelse sträcker sig alla testade enheter från 0.1 (minst) till 240 (maximalt) ms. » 12 % av alla enheter är bättre. Det betyder att den uppmätta svarstiden är bättre än genomsnittet av alla testade enheter (19.8 ms). | ||
| ↔ Svarstid 50 % grått till 80 % grått | ||
| 2.6 ms ... stiga ↗ och falla ↘ kombinerat | ↗ 1.3 ms stiga | 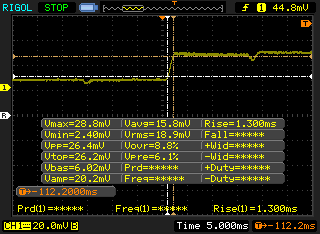 |
| ↘ 1.3 ms hösten | ||
| Skärmen visar väldigt snabba svarsfrekvenser i våra tester och borde vara mycket väl lämpad för fartfyllt spel. I jämförelse sträcker sig alla testade enheter från 0.165 (minst) till 636 (maximalt) ms. » 12 % av alla enheter är bättre. Det betyder att den uppmätta svarstiden är bättre än genomsnittet av alla testade enheter (31 ms). | ||
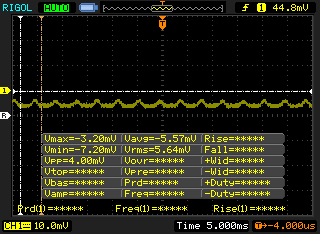
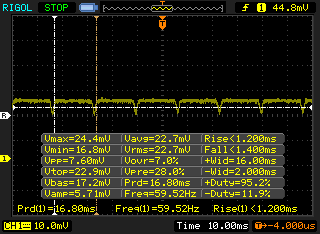
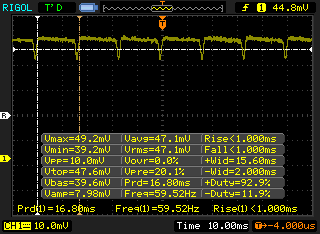
Skärmflimmer / PWM (Puls-Width Modulation)
| Skärmflimmer / PWM upptäckt | 59.5 Hz |  | |
Displayens bakgrundsbelysning flimrar vid 59.5 Hz (i värsta fall, t.ex. med PWM) . Frekvensen för 59.5 Hz är mycket låg, så flimmer kan orsaka ögon- och huvudvärk efter långvarig användning. Som jämförelse: 52 % av alla testade enheter använder inte PWM för att dämpa skärmen. Om PWM upptäcktes mättes ett medelvärde av 7781 (minst: 5 - maximum: 343500) Hz. | |||
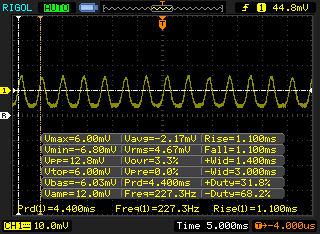
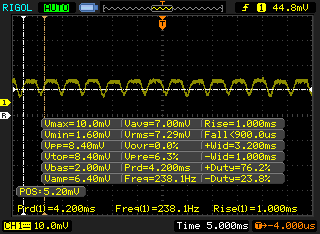
Precis som nästan alla andra bärbara datorer med en OLED-panel uppvisar panelen här flimmer eller pulsbreddsmodulering. Frekvensen är inställd på 227,3 Hz från 0 till 52 procent ljusstyrka innan den ändras till 59,5 Hz från 53 till 100 procent ljusstyrka. Om dina ögon är känsliga för flimmer kan du överväga IPS SKU:erna istället.
Prestanda
Provningsförhållanden
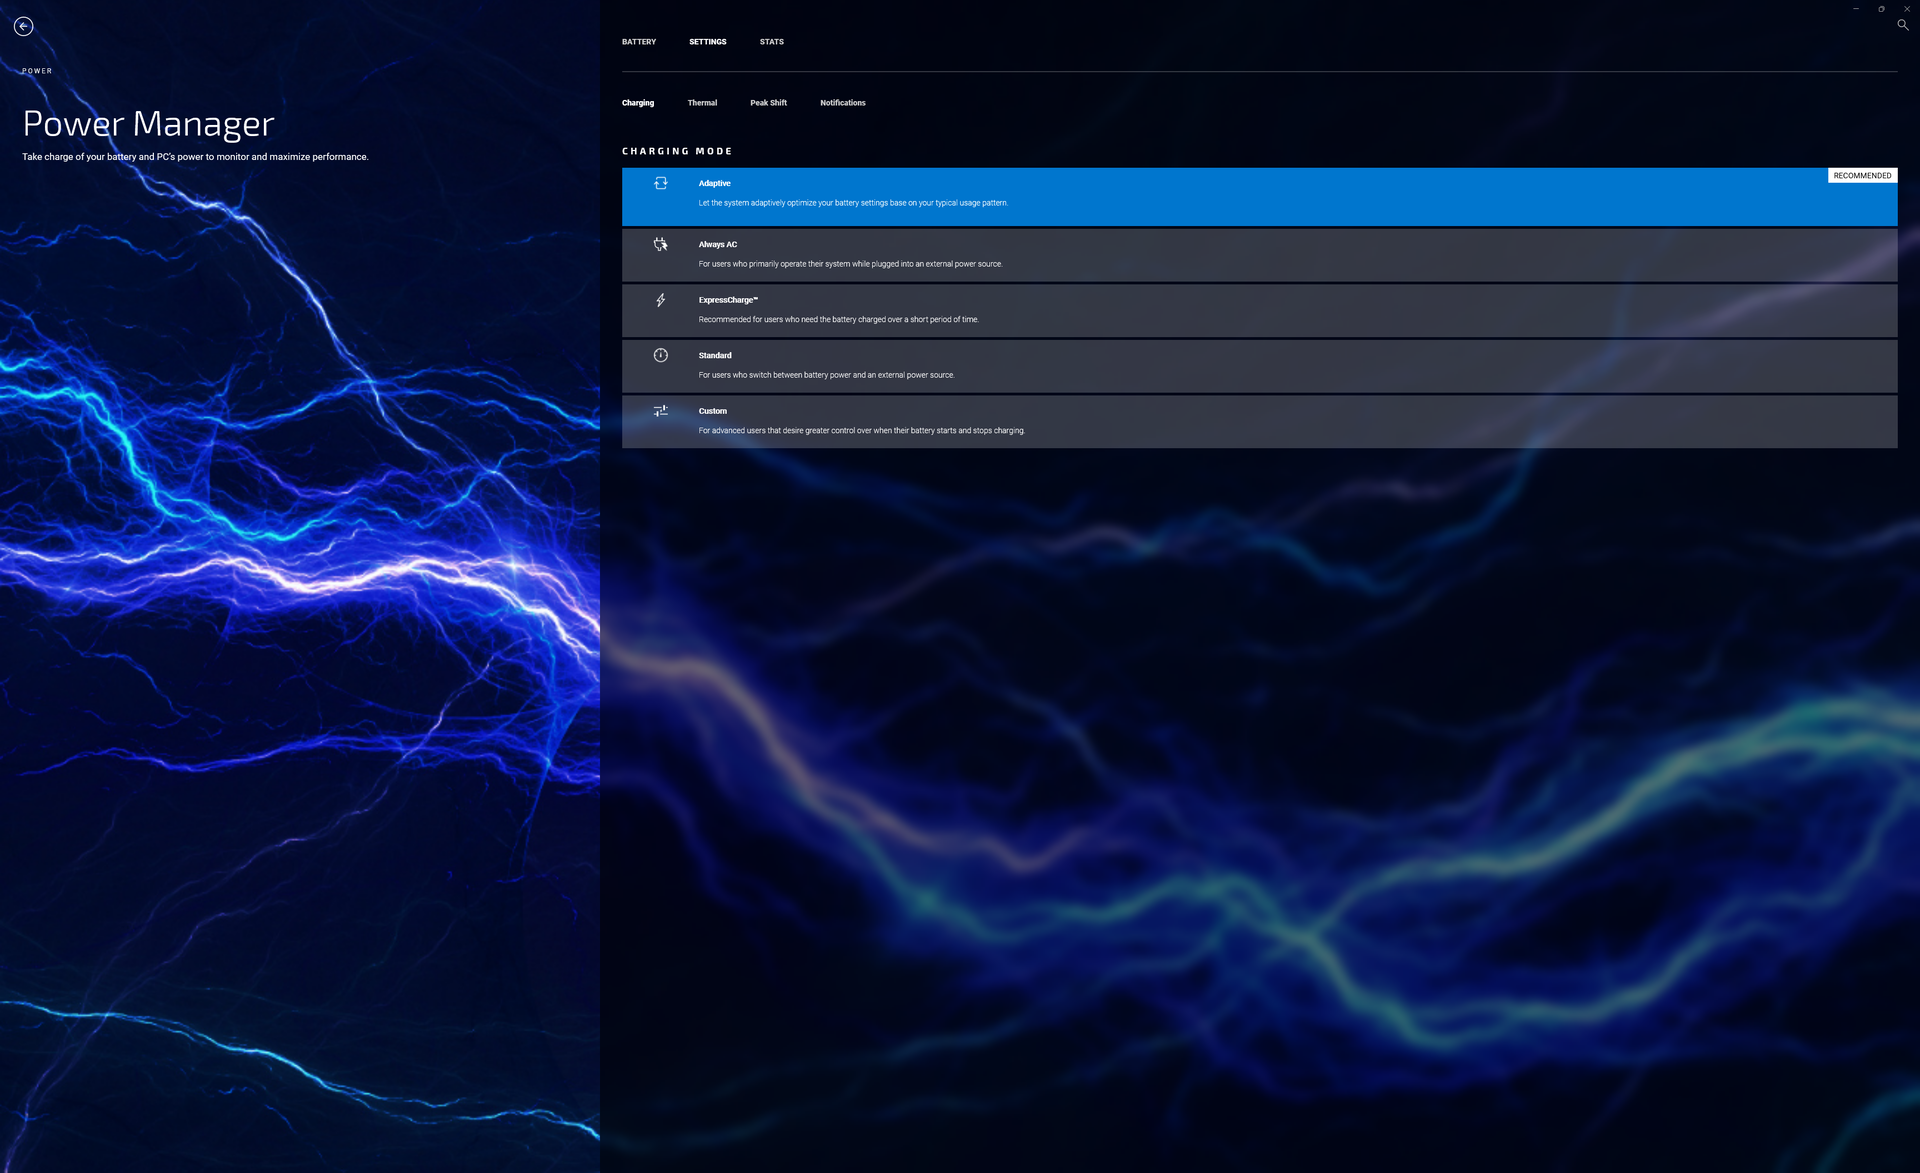
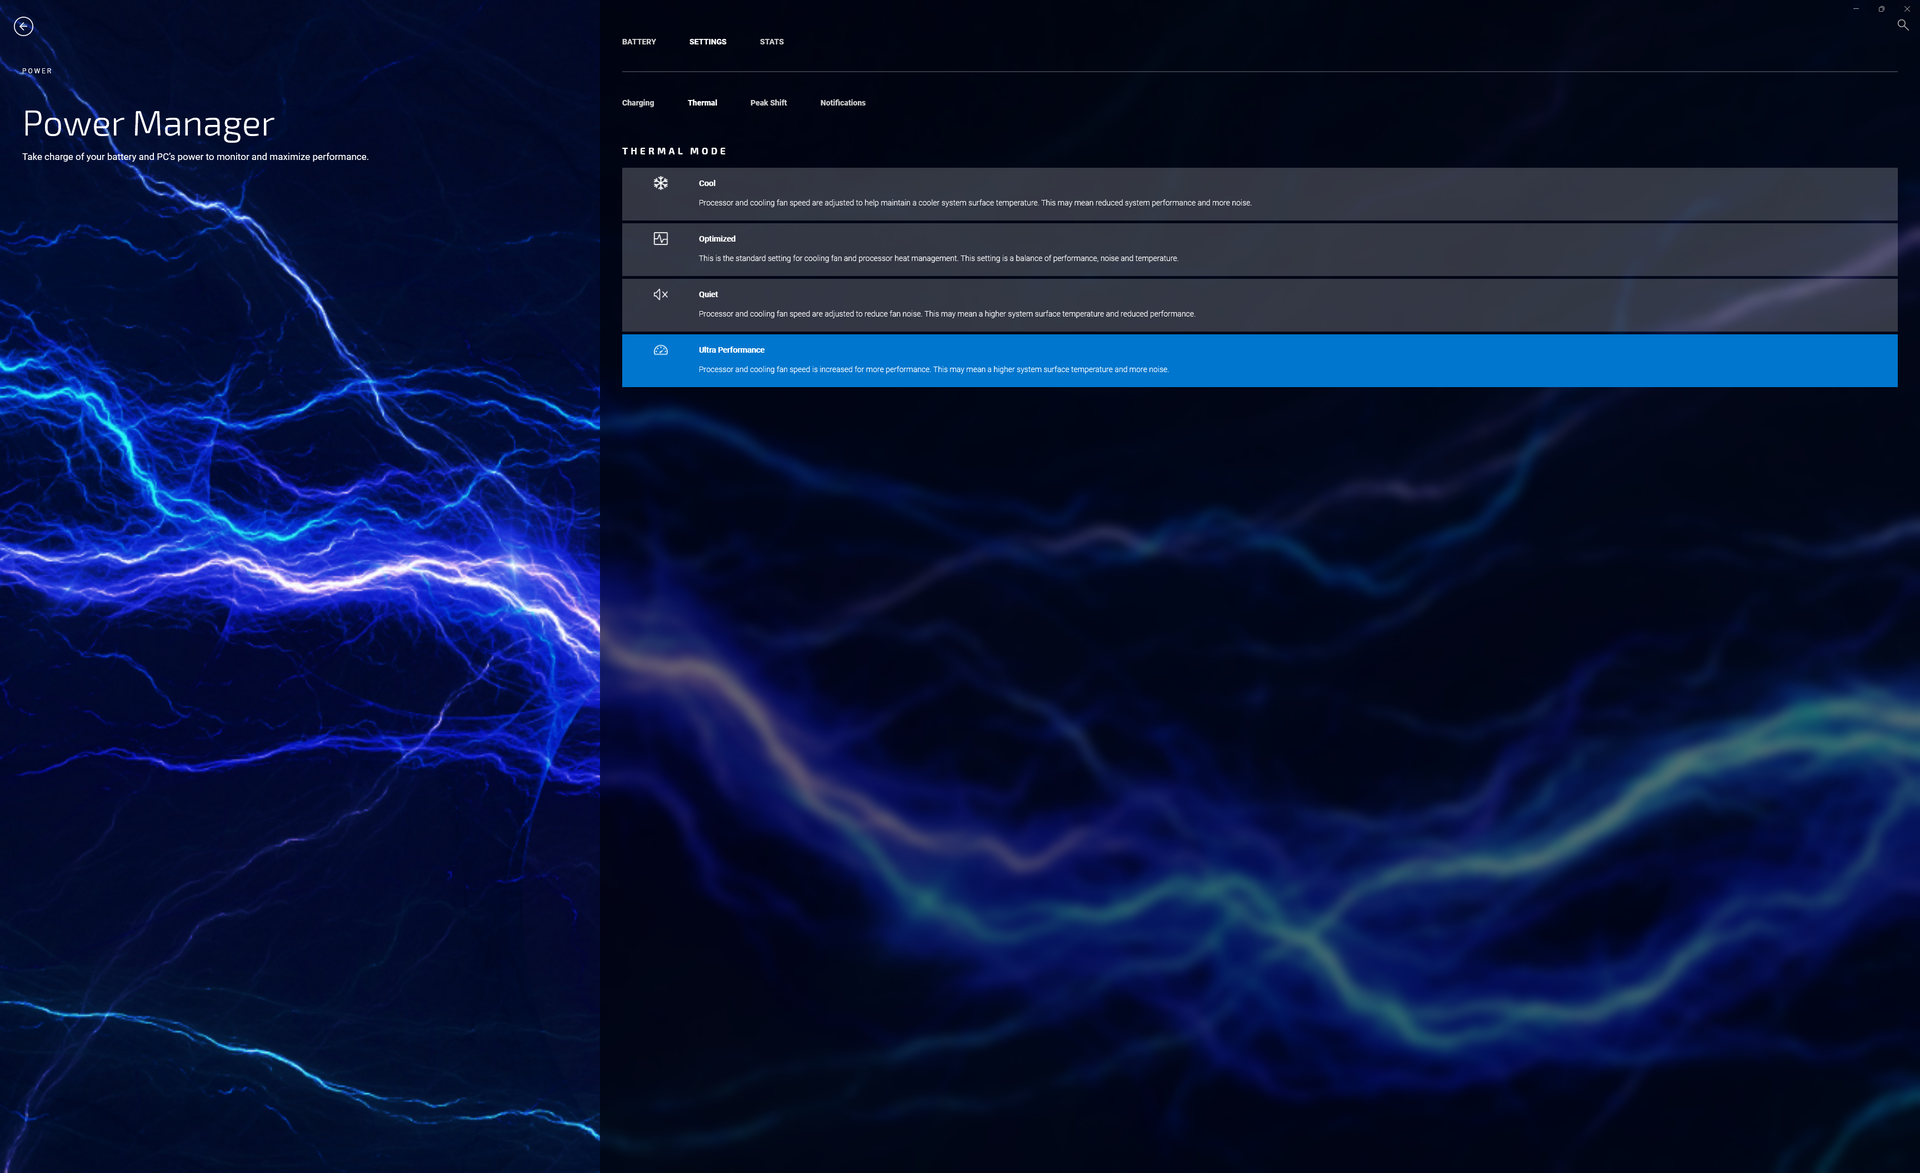
Vi ställde in vår enhet till prestandaläge via Windows och Ultra Performance-läge via My Dell-programvaran innan vi körde alla benchmarks nedan. Det rekommenderas att användarna bekantar sig med My Dell eftersom det är kontrollcentralen för den bärbara datorn.
Processor
Prestandan för flera trådar är cirka 15 procent snabbare än den Core i7-1260P konfiguration eller cirka 25-30 procent snabbare än den Core i5-1240P konfiguration. Det är dock intressant att notera att vår Core i7-1280P kan sjunka under Core i7-1260P när den utsätts för långvariga stresstester. Våra CineBench R15 xT-slingtestresultat nedan visar att i7-1280P presterar bättre än i7-1260P under de första körningarna innan den slutligen blir långsammare med nästan 8 procent.
Cinebench R15 Multi Loop
Cinebench R23: Multi Core | Single Core
Cinebench R15: CPU Multi 64Bit | CPU Single 64Bit
Blender: v2.79 BMW27 CPU
7-Zip 18.03: 7z b 4 | 7z b 4 -mmt1
Geekbench 5.5: Multi-Core | Single-Core
HWBOT x265 Benchmark v2.2: 4k Preset
LibreOffice : 20 Documents To PDF
R Benchmark 2.5: Overall mean
| Cinebench R20 / CPU (Multi Core) | |
| Genomsnitt Intel Core i7-1280P (3283 - 5415, n=8) | |
| Dell XPS 13 Plus 9320 i7-1280P OLED | |
| Dell XPS 13 Plus 9320 4K | |
| Dell XPS 13 Plus 9320 i5-1240p | |
| Dell XPS 13 9310 OLED | |
| Dell XPS 13 9315, i5-1230U | |
| Dell XPS 13 9310 2-in-1 | |
| Cinebench R20 / CPU (Single Core) | |
| Dell XPS 13 Plus 9320 4K | |
| Genomsnitt Intel Core i7-1280P (615 - 701, n=8) | |
| Dell XPS 13 Plus 9320 i7-1280P OLED | |
| Dell XPS 13 Plus 9320 i5-1240p | |
| Dell XPS 13 9310 OLED | |
| Dell XPS 13 9310 2-in-1 | |
| Dell XPS 13 9315, i5-1230U | |
| Cinebench R23 / Multi Core | |
| Dell XPS 13 Plus 9320 i7-1280P OLED | |
| Genomsnitt Intel Core i7-1280P (8632 - 14803, n=8) | |
| Dell XPS 13 Plus 9320 4K | |
| Dell XPS 13 Plus 9320 i5-1240p | |
| Dell XPS 13 9310 OLED | |
| Dell XPS 13 9310 2-in-1 | |
| Dell XPS 13 9315, i5-1230U | |
| Cinebench R23 / Single Core | |
| Dell XPS 13 Plus 9320 4K | |
| Genomsnitt Intel Core i7-1280P (1609 - 1787, n=7) | |
| Dell XPS 13 Plus 9320 i5-1240p | |
| Dell XPS 13 Plus 9320 i7-1280P OLED | |
| Dell XPS 13 9310 OLED | |
| Dell XPS 13 9310 2-in-1 | |
| Dell XPS 13 9315, i5-1230U | |
| Cinebench R15 / CPU Multi 64Bit | |
| Genomsnitt Intel Core i7-1280P (1905 - 2332, n=7) | |
| Dell XPS 13 Plus 9320 i7-1280P OLED | |
| Dell XPS 13 Plus 9320 4K | |
| Dell XPS 13 Plus 9320 4K | |
| Dell XPS 13 Plus 9320 i5-1240p | |
| Dell XPS 13 9310 OLED | |
| Dell XPS 13 9310 2-in-1 | |
| Dell XPS 13 9315, i5-1230U | |
| Cinebench R15 / CPU Single 64Bit | |
| Dell XPS 13 Plus 9320 4K | |
| Genomsnitt Intel Core i7-1280P (203 - 258, n=7) | |
| Dell XPS 13 Plus 9320 i7-1280P OLED | |
| Dell XPS 13 Plus 9320 i5-1240p | |
| Dell XPS 13 9310 OLED | |
| Dell XPS 13 9315, i5-1230U | |
| Dell XPS 13 9310 2-in-1 | |
| Blender / v2.79 BMW27 CPU | |
| Dell XPS 13 9310 2-in-1 | |
| Dell XPS 13 9310 OLED | |
| Dell XPS 13 Plus 9320 i5-1240p | |
| Dell XPS 13 Plus 9320 4K | |
| Genomsnitt Intel Core i7-1280P (259 - 309, n=7) | |
| Dell XPS 13 Plus 9320 i7-1280P OLED | |
| 7-Zip 18.03 / 7z b 4 | |
| Genomsnitt Intel Core i7-1280P (45292 - 53710, n=7) | |
| Dell XPS 13 Plus 9320 i7-1280P OLED | |
| Dell XPS 13 Plus 9320 4K | |
| Dell XPS 13 Plus 9320 i5-1240p | |
| Dell XPS 13 9310 2-in-1 | |
| Dell XPS 13 9315, i5-1230U | |
| Dell XPS 13 9310 OLED | |
| 7-Zip 18.03 / 7z b 4 -mmt1 | |
| Genomsnitt Intel Core i7-1280P (4995 - 5874, n=7) | |
| Dell XPS 13 Plus 9320 4K | |
| Dell XPS 13 9310 2-in-1 | |
| Dell XPS 13 Plus 9320 i7-1280P OLED | |
| Dell XPS 13 Plus 9320 i5-1240p | |
| Dell XPS 13 9315, i5-1230U | |
| Dell XPS 13 9310 OLED | |
| Geekbench 5.5 / Multi-Core | |
| Dell XPS 13 Plus 9320 i7-1280P OLED | |
| Genomsnitt Intel Core i7-1280P (9623 - 11811, n=7) | |
| Dell XPS 13 Plus 9320 4K | |
| Dell XPS 13 9315, i5-1230U | |
| Dell XPS 13 9310 OLED | |
| Dell XPS 13 Plus 9320 i5-1240p | |
| Geekbench 5.5 / Single-Core | |
| Dell XPS 13 Plus 9320 i7-1280P OLED | |
| Dell XPS 13 Plus 9320 4K | |
| Genomsnitt Intel Core i7-1280P (1571 - 1802, n=7) | |
| Dell XPS 13 9315, i5-1230U | |
| Dell XPS 13 Plus 9320 i5-1240p | |
| Dell XPS 13 9310 OLED | |
| HWBOT x265 Benchmark v2.2 / 4k Preset | |
| Dell XPS 13 Plus 9320 i7-1280P OLED | |
| Genomsnitt Intel Core i7-1280P (9.62 - 14.5, n=5) | |
| Dell XPS 13 Plus 9320 4K | |
| Dell XPS 13 Plus 9320 i5-1240p | |
| Dell XPS 13 9310 OLED | |
| Dell XPS 13 9310 2-in-1 | |
| LibreOffice / 20 Documents To PDF | |
| Dell XPS 13 Plus 9320 i5-1240p | |
| Genomsnitt Intel Core i7-1280P (41 - 61.6, n=8) | |
| Dell XPS 13 Plus 9320 i7-1280P OLED | |
| Dell XPS 13 Plus 9320 4K | |
| Dell XPS 13 9310 OLED | |
| R Benchmark 2.5 / Overall mean | |
| Dell XPS 13 9310 2-in-1 | |
| Dell XPS 13 9310 OLED | |
| Dell XPS 13 Plus 9320 i5-1240p | |
| Dell XPS 13 Plus 9320 i7-1280P OLED | |
| Dell XPS 13 Plus 9320 4K | |
| Genomsnitt Intel Core i7-1280P (0.4505 - 0.512, n=7) | |
* ... mindre är bättre
AIDA64: FP32 Ray-Trace | FPU Julia | CPU SHA3 | CPU Queen | FPU SinJulia | FPU Mandel | CPU AES | CPU ZLib | FP64 Ray-Trace | CPU PhotoWorxx
| Performance rating | |
| Dell XPS 13 Plus 9320 i7-1280P OLED | |
| Genomsnitt Intel Core i7-1280P | |
| Dell XPS 13 Plus 9320 4K | |
| Dell XPS 13 Plus 9320 i5-1240p | |
| Dell XPS 13 9310 2-in-1 | |
| Dell XPS 13 9310 OLED | |
| Dell XPS 13 9315, i5-1230U | |
| AIDA64 / FP32 Ray-Trace | |
| Dell XPS 13 Plus 9320 i7-1280P OLED | |
| Genomsnitt Intel Core i7-1280P (7466 - 13068, n=6) | |
| Dell XPS 13 9310 2-in-1 | |
| Dell XPS 13 9310 OLED | |
| Dell XPS 13 Plus 9320 4K | |
| Dell XPS 13 Plus 9320 i5-1240p | |
| Dell XPS 13 9315, i5-1230U | |
| AIDA64 / FPU Julia | |
| Dell XPS 13 Plus 9320 i7-1280P OLED | |
| Genomsnitt Intel Core i7-1280P (38904 - 66081, n=6) | |
| Dell XPS 13 9310 2-in-1 | |
| Dell XPS 13 Plus 9320 4K | |
| Dell XPS 13 Plus 9320 i5-1240p | |
| Dell XPS 13 9310 OLED | |
| Dell XPS 13 9315, i5-1230U | |
| AIDA64 / CPU SHA3 | |
| Dell XPS 13 Plus 9320 i7-1280P OLED | |
| Genomsnitt Intel Core i7-1280P (1826 - 2992, n=6) | |
| Dell XPS 13 9310 2-in-1 | |
| Dell XPS 13 Plus 9320 4K | |
| Dell XPS 13 Plus 9320 i5-1240p | |
| Dell XPS 13 9310 OLED | |
| Dell XPS 13 9315, i5-1230U | |
| AIDA64 / CPU Queen | |
| Genomsnitt Intel Core i7-1280P (80180 - 100358, n=6) | |
| Dell XPS 13 Plus 9320 i7-1280P OLED | |
| Dell XPS 13 Plus 9320 4K | |
| Dell XPS 13 Plus 9320 i5-1240p | |
| Dell XPS 13 9315, i5-1230U | |
| Dell XPS 13 9310 2-in-1 | |
| Dell XPS 13 9310 OLED | |
| AIDA64 / FPU SinJulia | |
| Dell XPS 13 Plus 9320 i7-1280P OLED | |
| Genomsnitt Intel Core i7-1280P (5880 - 8571, n=6) | |
| Dell XPS 13 Plus 9320 4K | |
| Dell XPS 13 Plus 9320 i5-1240p | |
| Dell XPS 13 9310 2-in-1 | |
| Dell XPS 13 9310 OLED | |
| Dell XPS 13 9315, i5-1230U | |
| AIDA64 / FPU Mandel | |
| Dell XPS 13 Plus 9320 i7-1280P OLED | |
| Genomsnitt Intel Core i7-1280P (18907 - 32766, n=6) | |
| Dell XPS 13 9310 2-in-1 | |
| Dell XPS 13 Plus 9320 i5-1240p | |
| Dell XPS 13 Plus 9320 4K | |
| Dell XPS 13 9310 OLED | |
| Dell XPS 13 9315, i5-1230U | |
| AIDA64 / CPU AES | |
| Dell XPS 13 9310 2-in-1 | |
| Genomsnitt Intel Core i7-1280P (40691 - 99367, n=6) | |
| Dell XPS 13 Plus 9320 i7-1280P OLED | |
| Dell XPS 13 9310 OLED | |
| Dell XPS 13 Plus 9320 i5-1240p | |
| Dell XPS 13 Plus 9320 4K | |
| Dell XPS 13 9315, i5-1230U | |
| AIDA64 / CPU ZLib | |
| Genomsnitt Intel Core i7-1280P (540 - 880, n=6) | |
| Dell XPS 13 Plus 9320 i7-1280P OLED | |
| Dell XPS 13 Plus 9320 4K | |
| Dell XPS 13 Plus 9320 i5-1240p | |
| Dell XPS 13 9310 2-in-1 | |
| Dell XPS 13 9315, i5-1230U | |
| Dell XPS 13 9310 OLED | |
| AIDA64 / FP64 Ray-Trace | |
| Dell XPS 13 Plus 9320 i7-1280P OLED | |
| Genomsnitt Intel Core i7-1280P (4006 - 7184, n=6) | |
| Dell XPS 13 9310 2-in-1 | |
| Dell XPS 13 9310 OLED | |
| Dell XPS 13 Plus 9320 4K | |
| Dell XPS 13 Plus 9320 i5-1240p | |
| Dell XPS 13 9315, i5-1230U | |
| AIDA64 / CPU PhotoWorxx | |
| Dell XPS 13 Plus 9320 i7-1280P OLED | |
| Genomsnitt Intel Core i7-1280P (36663 - 48416, n=6) | |
| Dell XPS 13 Plus 9320 4K | |
| Dell XPS 13 9310 2-in-1 | |
| Dell XPS 13 Plus 9320 i5-1240p | |
| Dell XPS 13 9310 OLED | |
| Dell XPS 13 9315, i5-1230U | |
Systemets prestanda
CrossMark: Overall | Productivity | Creativity | Responsiveness
| PCMark 10 / Score | |
| Genomsnitt av klass Subnotebook (4920 - 9939, n=44, senaste 2 åren) | |
| Dell XPS 13 Plus 9320 i7-1280P OLED | |
| Genomsnitt Intel Core i7-1280P, Intel Iris Xe Graphics G7 96EUs (5410 - 5994, n=4) | |
| Dell XPS 13 Plus 9320 4K | |
| Dell XPS 13 9310 OLED | |
| Dell XPS 13 9310 2-in-1 | |
| Dell XPS 13 Plus 9320 i5-1240p | |
| Dell XPS 13 9315, i5-1230U | |
| PCMark 10 / Essentials | |
| Dell XPS 13 9310 OLED | |
| Dell XPS 13 9310 2-in-1 | |
| Dell XPS 13 Plus 9320 i7-1280P OLED | |
| Dell XPS 13 Plus 9320 4K | |
| Genomsnitt av klass Subnotebook (8552 - 11646, n=44, senaste 2 åren) | |
| Genomsnitt Intel Core i7-1280P, Intel Iris Xe Graphics G7 96EUs (9719 - 10920, n=4) | |
| Dell XPS 13 9315, i5-1230U | |
| Dell XPS 13 Plus 9320 i5-1240p | |
| PCMark 10 / Productivity | |
| Genomsnitt av klass Subnotebook (5435 - 16606, n=44, senaste 2 åren) | |
| Dell XPS 13 9310 OLED | |
| Dell XPS 13 Plus 9320 4K | |
| Dell XPS 13 9310 2-in-1 | |
| Genomsnitt Intel Core i7-1280P, Intel Iris Xe Graphics G7 96EUs (6301 - 7453, n=4) | |
| Dell XPS 13 Plus 9320 i7-1280P OLED | |
| Dell XPS 13 Plus 9320 i5-1240p | |
| Dell XPS 13 9315, i5-1230U | |
| PCMark 10 / Digital Content Creation | |
| Genomsnitt av klass Subnotebook (5722 - 13779, n=44, senaste 2 åren) | |
| Dell XPS 13 Plus 9320 i7-1280P OLED | |
| Genomsnitt Intel Core i7-1280P, Intel Iris Xe Graphics G7 96EUs (6450 - 7180, n=4) | |
| Dell XPS 13 Plus 9320 4K | |
| Dell XPS 13 Plus 9320 i5-1240p | |
| Dell XPS 13 9310 OLED | |
| Dell XPS 13 9310 2-in-1 | |
| Dell XPS 13 9315, i5-1230U | |
| CrossMark / Overall | |
| Dell XPS 13 Plus 9320 i7-1280P OLED | |
| Genomsnitt Intel Core i7-1280P, Intel Iris Xe Graphics G7 96EUs (1677 - 1773, n=4) | |
| Dell XPS 13 Plus 9320 4K | |
| Genomsnitt av klass Subnotebook (365 - 2356, n=59, senaste 2 åren) | |
| Dell XPS 13 Plus 9320 i5-1240p | |
| Dell XPS 13 9315, i5-1230U | |
| CrossMark / Productivity | |
| Dell XPS 13 Plus 9320 i7-1280P OLED | |
| Genomsnitt Intel Core i7-1280P, Intel Iris Xe Graphics G7 96EUs (1585 - 1709, n=4) | |
| Dell XPS 13 Plus 9320 4K | |
| Genomsnitt av klass Subnotebook (364 - 2277, n=59, senaste 2 åren) | |
| Dell XPS 13 Plus 9320 i5-1240p | |
| Dell XPS 13 9315, i5-1230U | |
| CrossMark / Creativity | |
| Dell XPS 13 Plus 9320 i7-1280P OLED | |
| Genomsnitt Intel Core i7-1280P, Intel Iris Xe Graphics G7 96EUs (1849 - 1928, n=4) | |
| Dell XPS 13 Plus 9320 4K | |
| Genomsnitt av klass Subnotebook (372 - 2743, n=59, senaste 2 åren) | |
| Dell XPS 13 Plus 9320 i5-1240p | |
| Dell XPS 13 9315, i5-1230U | |
| CrossMark / Responsiveness | |
| Genomsnitt Intel Core i7-1280P, Intel Iris Xe Graphics G7 96EUs (1394 - 1746, n=4) | |
| Dell XPS 13 Plus 9320 i7-1280P OLED | |
| Dell XPS 13 Plus 9320 4K | |
| Genomsnitt av klass Subnotebook (312 - 1854, n=59, senaste 2 åren) | |
| Dell XPS 13 Plus 9320 i5-1240p | |
| Dell XPS 13 9315, i5-1230U | |
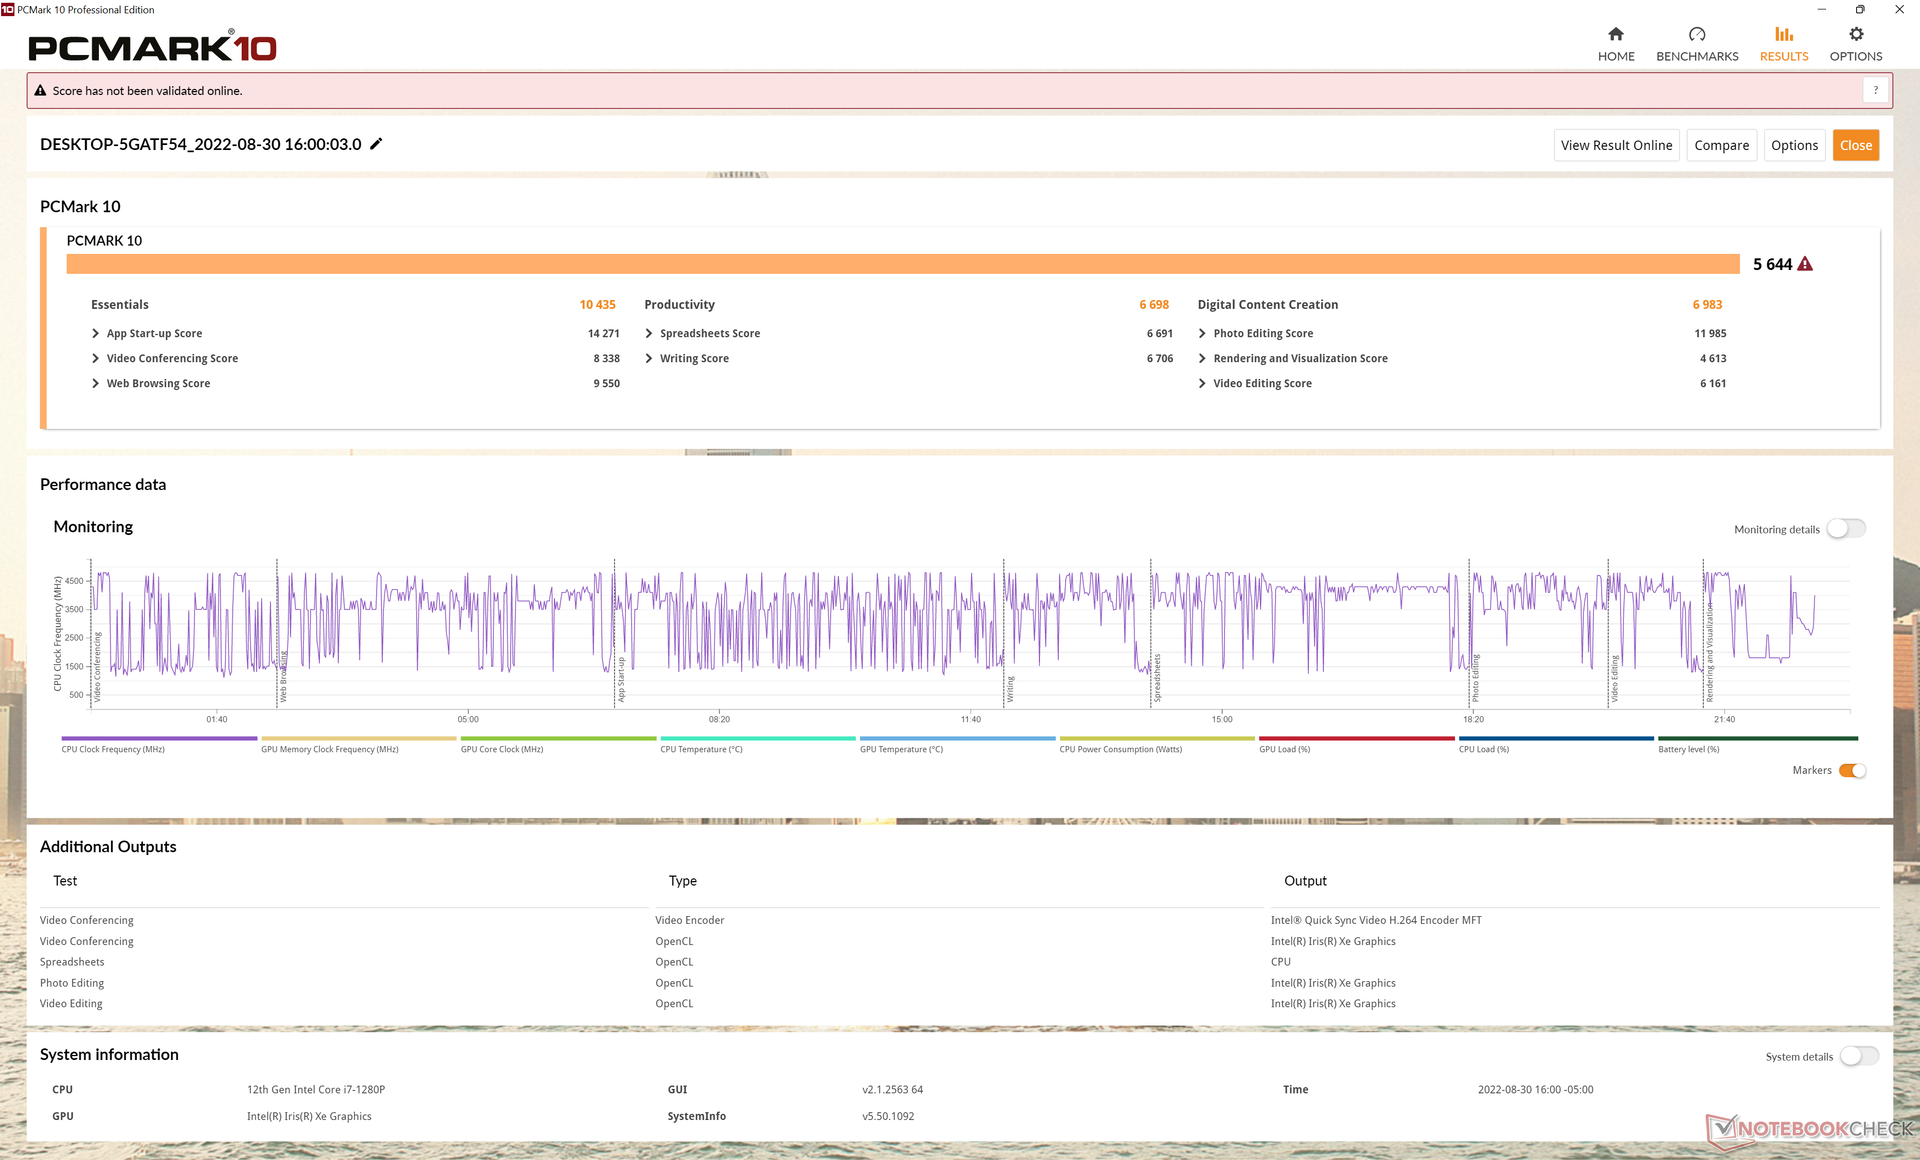
| PCMark 10 Score | 5644 poäng | |
Hjälp | ||
| AIDA64 / Memory Copy | |
| Dell XPS 13 Plus 9320 i7-1280P OLED | |
| Dell XPS 13 Plus 9320 4K | |
| Genomsnitt Intel Core i7-1280P (56337 - 73486, n=6) | |
| Dell XPS 13 Plus 9320 i5-1240p | |
| Dell XPS 13 9310 2-in-1 | |
| Dell XPS 13 9310 OLED | |
| Dell XPS 13 9315, i5-1230U | |
| AIDA64 / Memory Read | |
| Dell XPS 13 Plus 9320 i7-1280P OLED | |
| Dell XPS 13 Plus 9320 i5-1240p | |
| Genomsnitt Intel Core i7-1280P (63221 - 73719, n=6) | |
| Dell XPS 13 Plus 9320 4K | |
| Dell XPS 13 9315, i5-1230U | |
| Dell XPS 13 9310 2-in-1 | |
| Dell XPS 13 9310 OLED | |
| AIDA64 / Memory Write | |
| Dell XPS 13 9310 OLED | |
| Dell XPS 13 9310 2-in-1 | |
| Dell XPS 13 Plus 9320 i7-1280P OLED | |
| Genomsnitt Intel Core i7-1280P (58729 - 68247, n=6) | |
| Dell XPS 13 Plus 9320 4K | |
| Dell XPS 13 9315, i5-1230U | |
| Dell XPS 13 Plus 9320 i5-1240p | |
| AIDA64 / Memory Latency | |
| Dell XPS 13 9310 OLED | |
| Genomsnitt Intel Core i7-1280P (93.1 - 153.3, n=6) | |
| Dell XPS 13 Plus 9320 i7-1280P OLED | |
| Dell XPS 13 9310 2-in-1 | |
| Dell XPS 13 9315, i5-1230U | |
* ... mindre är bättre
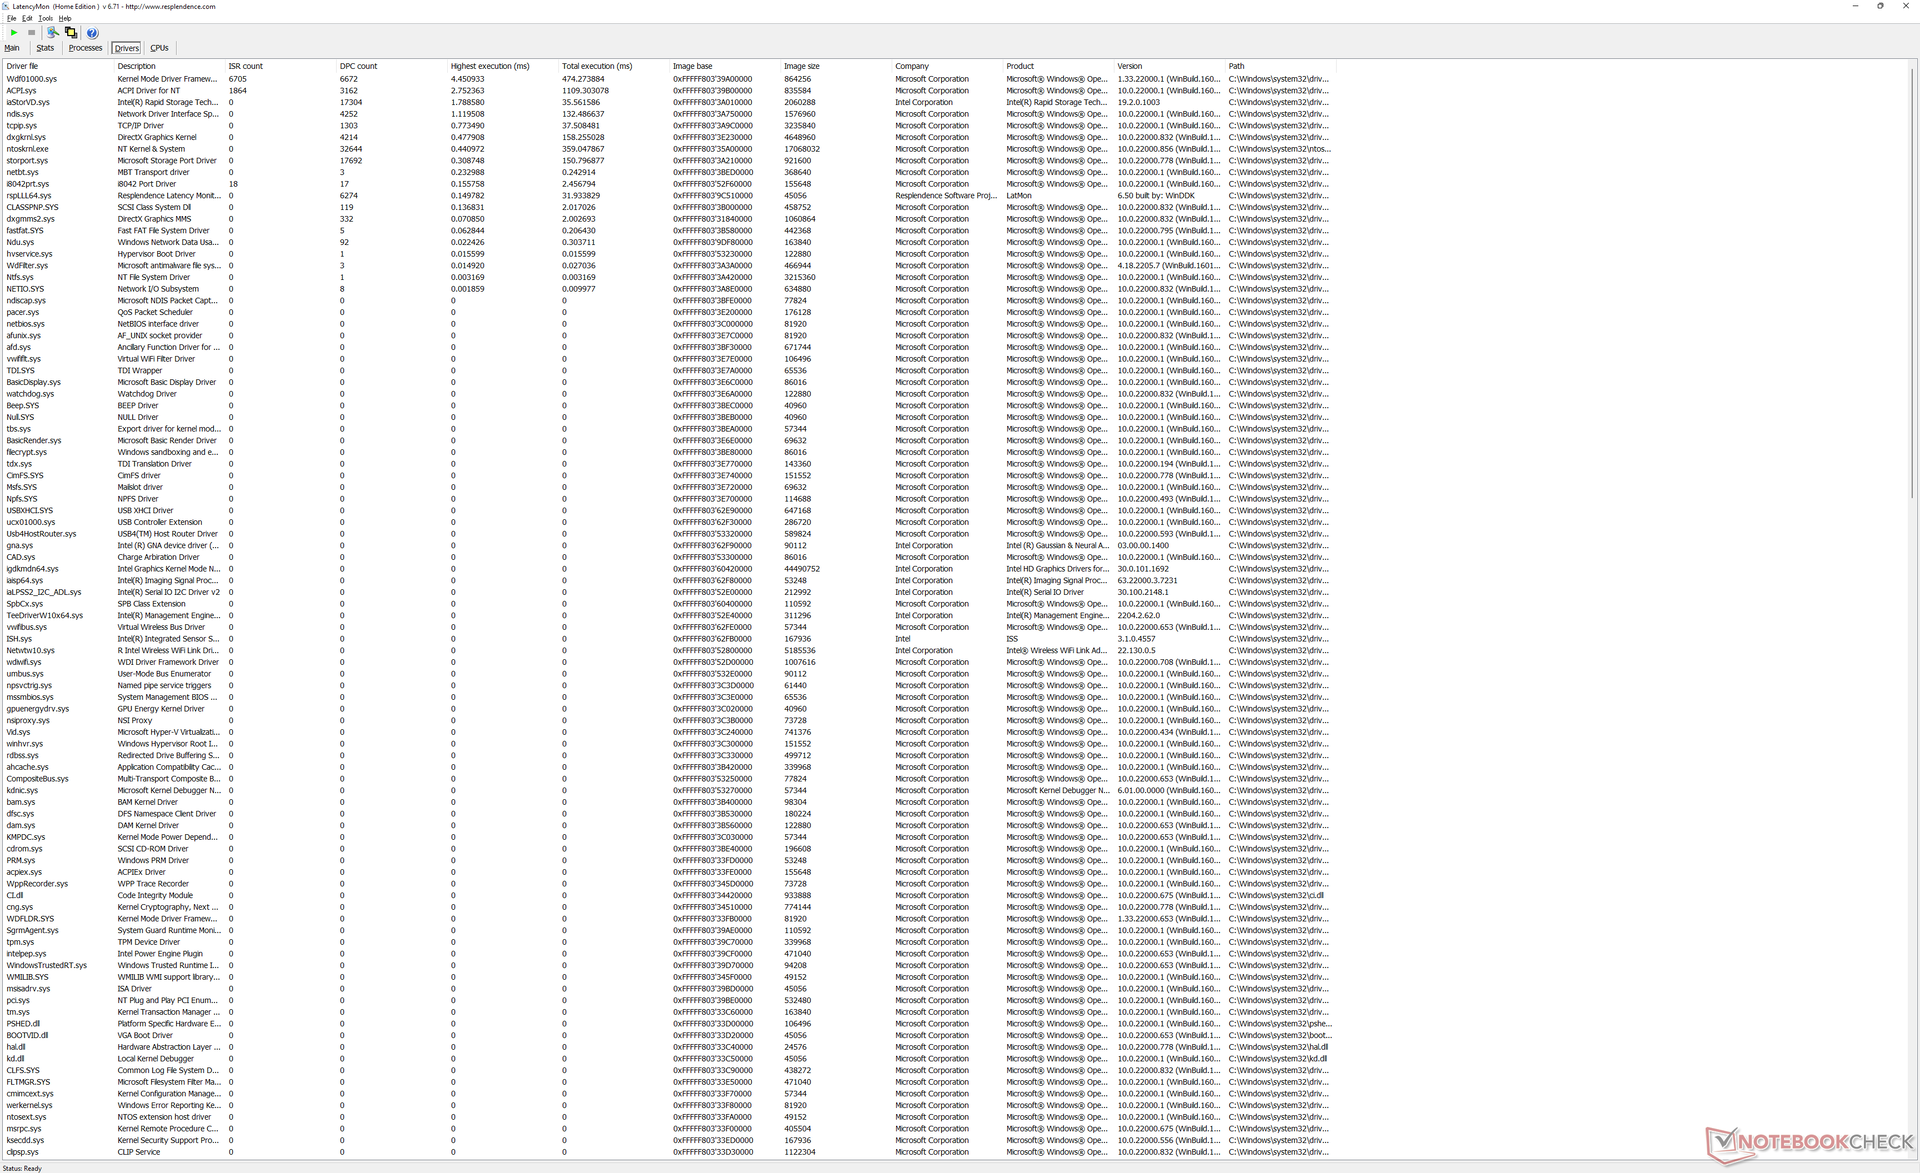
DPC-latenstid

| DPC Latencies / LatencyMon - interrupt to process latency (max), Web, Youtube, Prime95 | |
| Dell XPS 13 9315, i5-1230U | |
| Dell XPS 13 Plus 9320 i5-1240p | |
| Dell XPS 13 9310 OLED | |
| Dell XPS 13 Plus 9320 4K | |
| Dell XPS 13 9310 2-in-1 | |
| Dell XPS 13 Plus 9320 i7-1280P OLED | |
* ... mindre är bättre
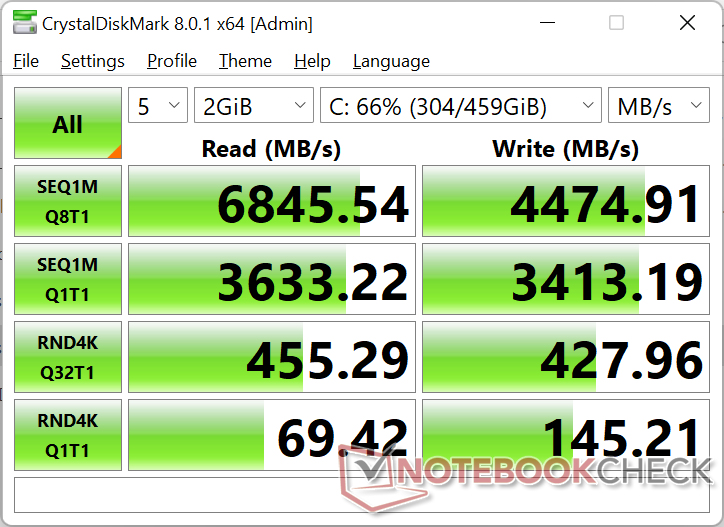
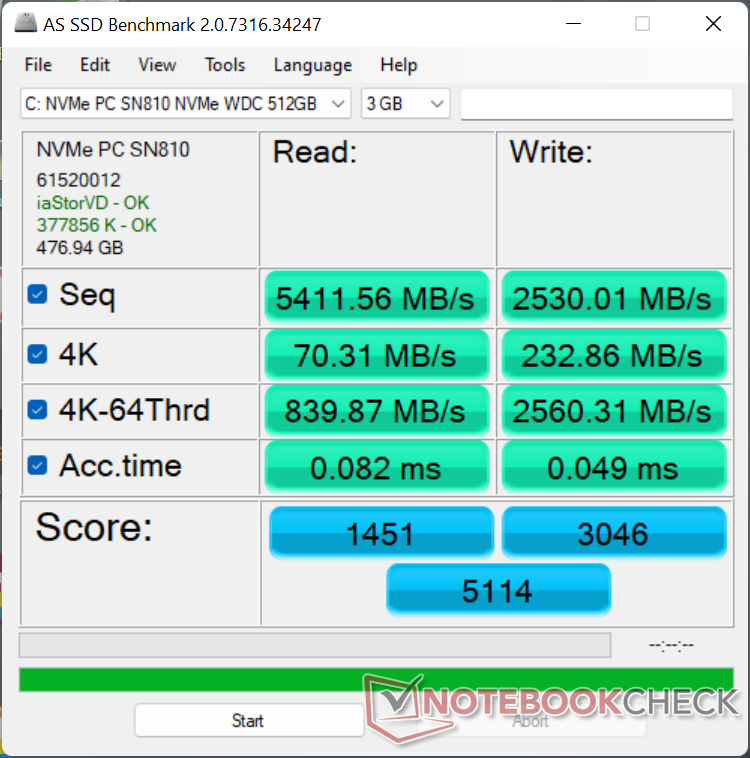
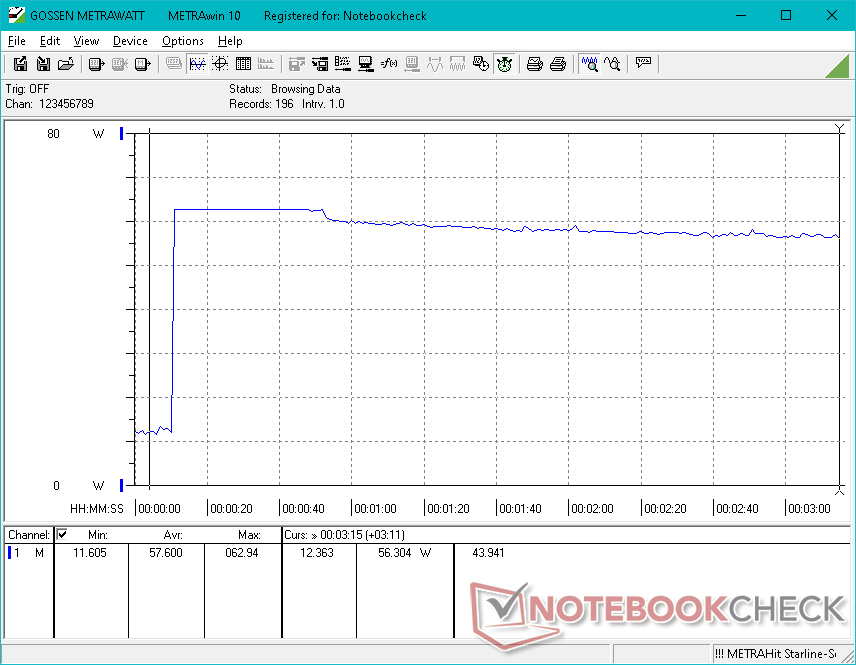
Lagringsenheter
Dell verkar köpa SSD-diskar från flera tillverkare för sin XPS 13 Plus-serie. Medan våra två tidigare testenheter skulle levereras med Micron 3400 eller Samsung PM9A1 PCIe4 x4 NVMe SSD-diskar, skulle vår i7-1280P-testenhet levereras med en Western Digital SN810 i stället. Tyvärr verkar den här WD-enheten vara sämre än Samsung eller Micron eftersom prestandan skulle minska till endast 3000 MB/s när DiskSpd körs i en loop, vilket visas i vår graf nedan. Som jämförelse kan nämnas att Samsung- eller Micron-enheterna uppvisar stabila överföringshastigheter när de utsätts för samma stresstest.

| Drive Performance rating - Percent | |
| Dell XPS 13 Plus 9320 i7-1280P OLED | |
| Dell XPS 13 Plus 9320 4K | |
| Dell XPS 13 9310 OLED | |
| Dell XPS 13 Plus 9320 i5-1240p | |
| Dell XPS 13 9315, i5-1230U | |
| Dell XPS 13 9310 2-in-1 | |
* ... mindre är bättre
Disk Throttling: DiskSpd Read Loop, Queue Depth 8
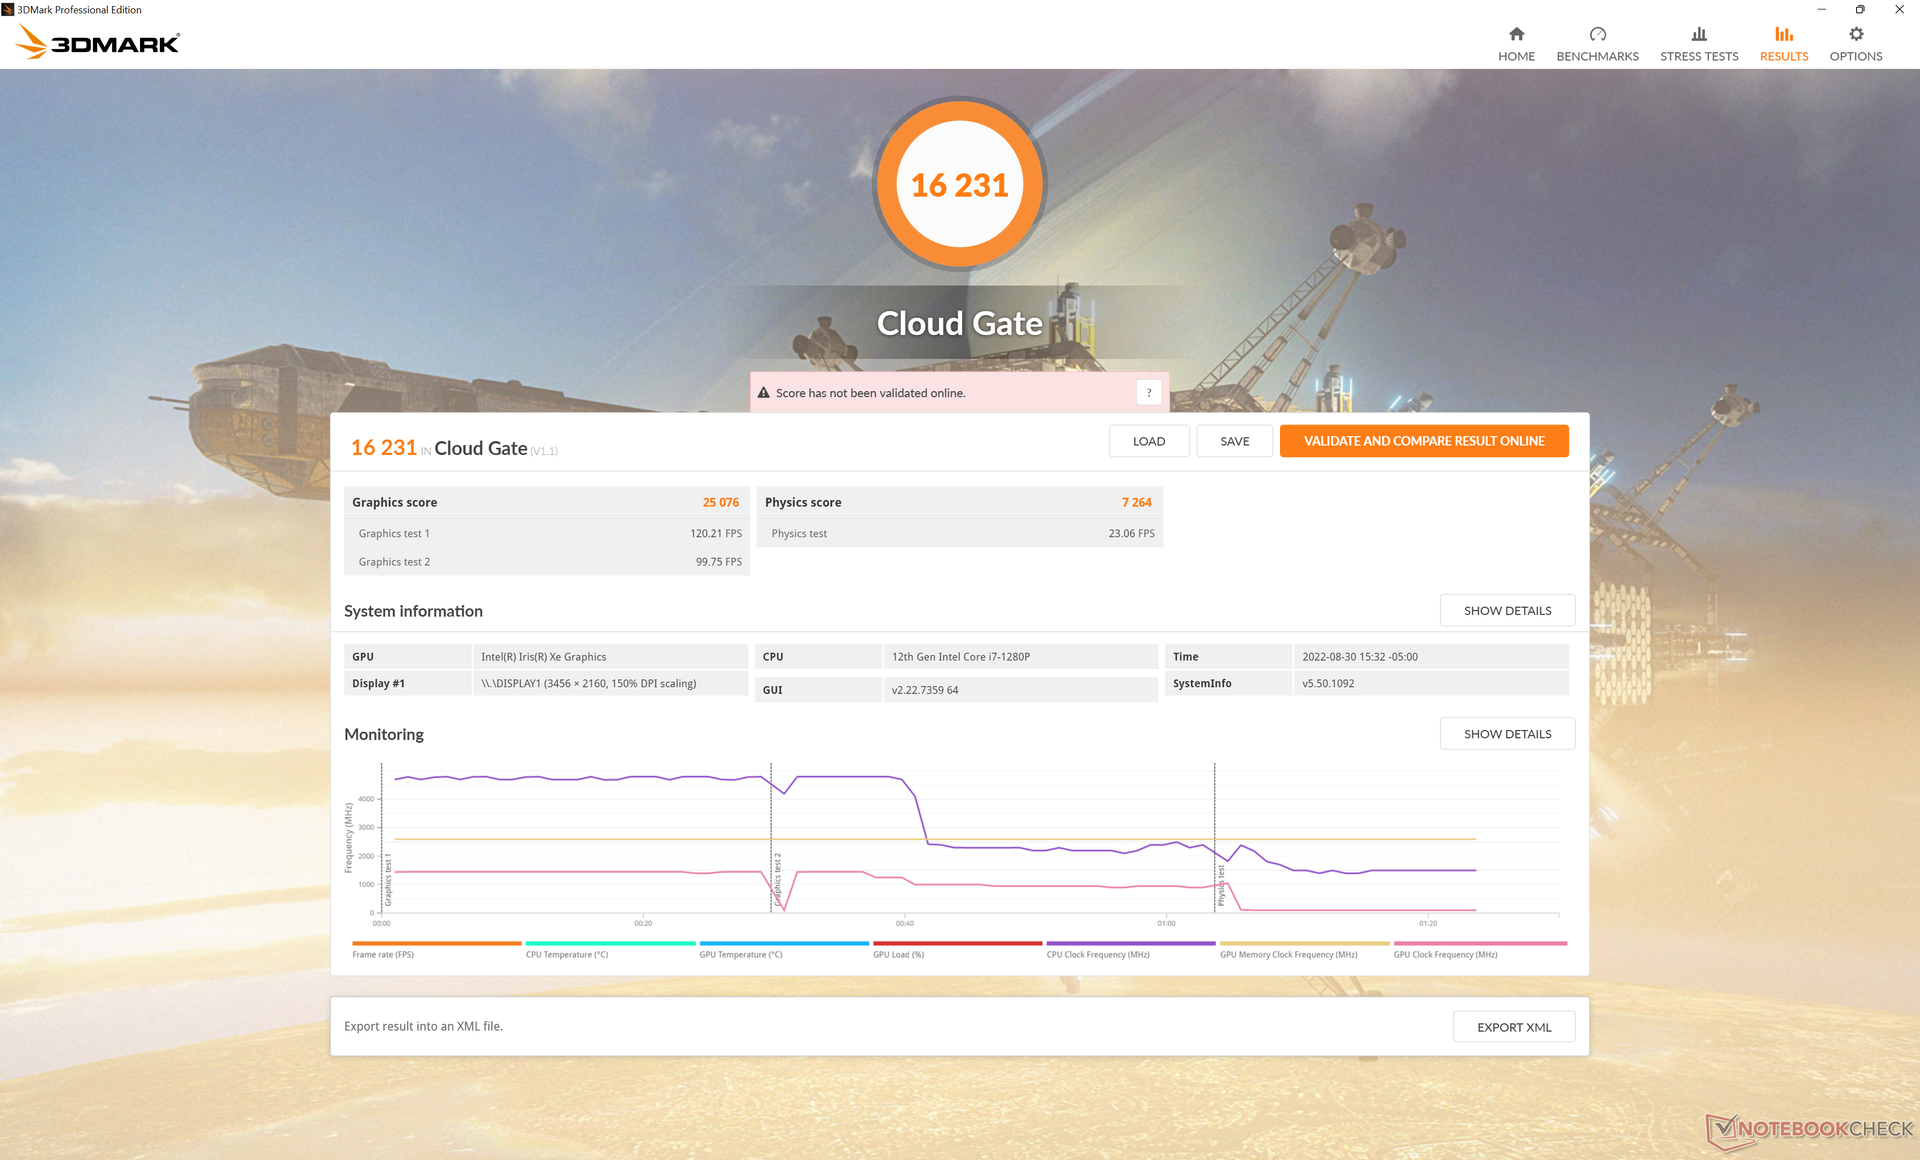
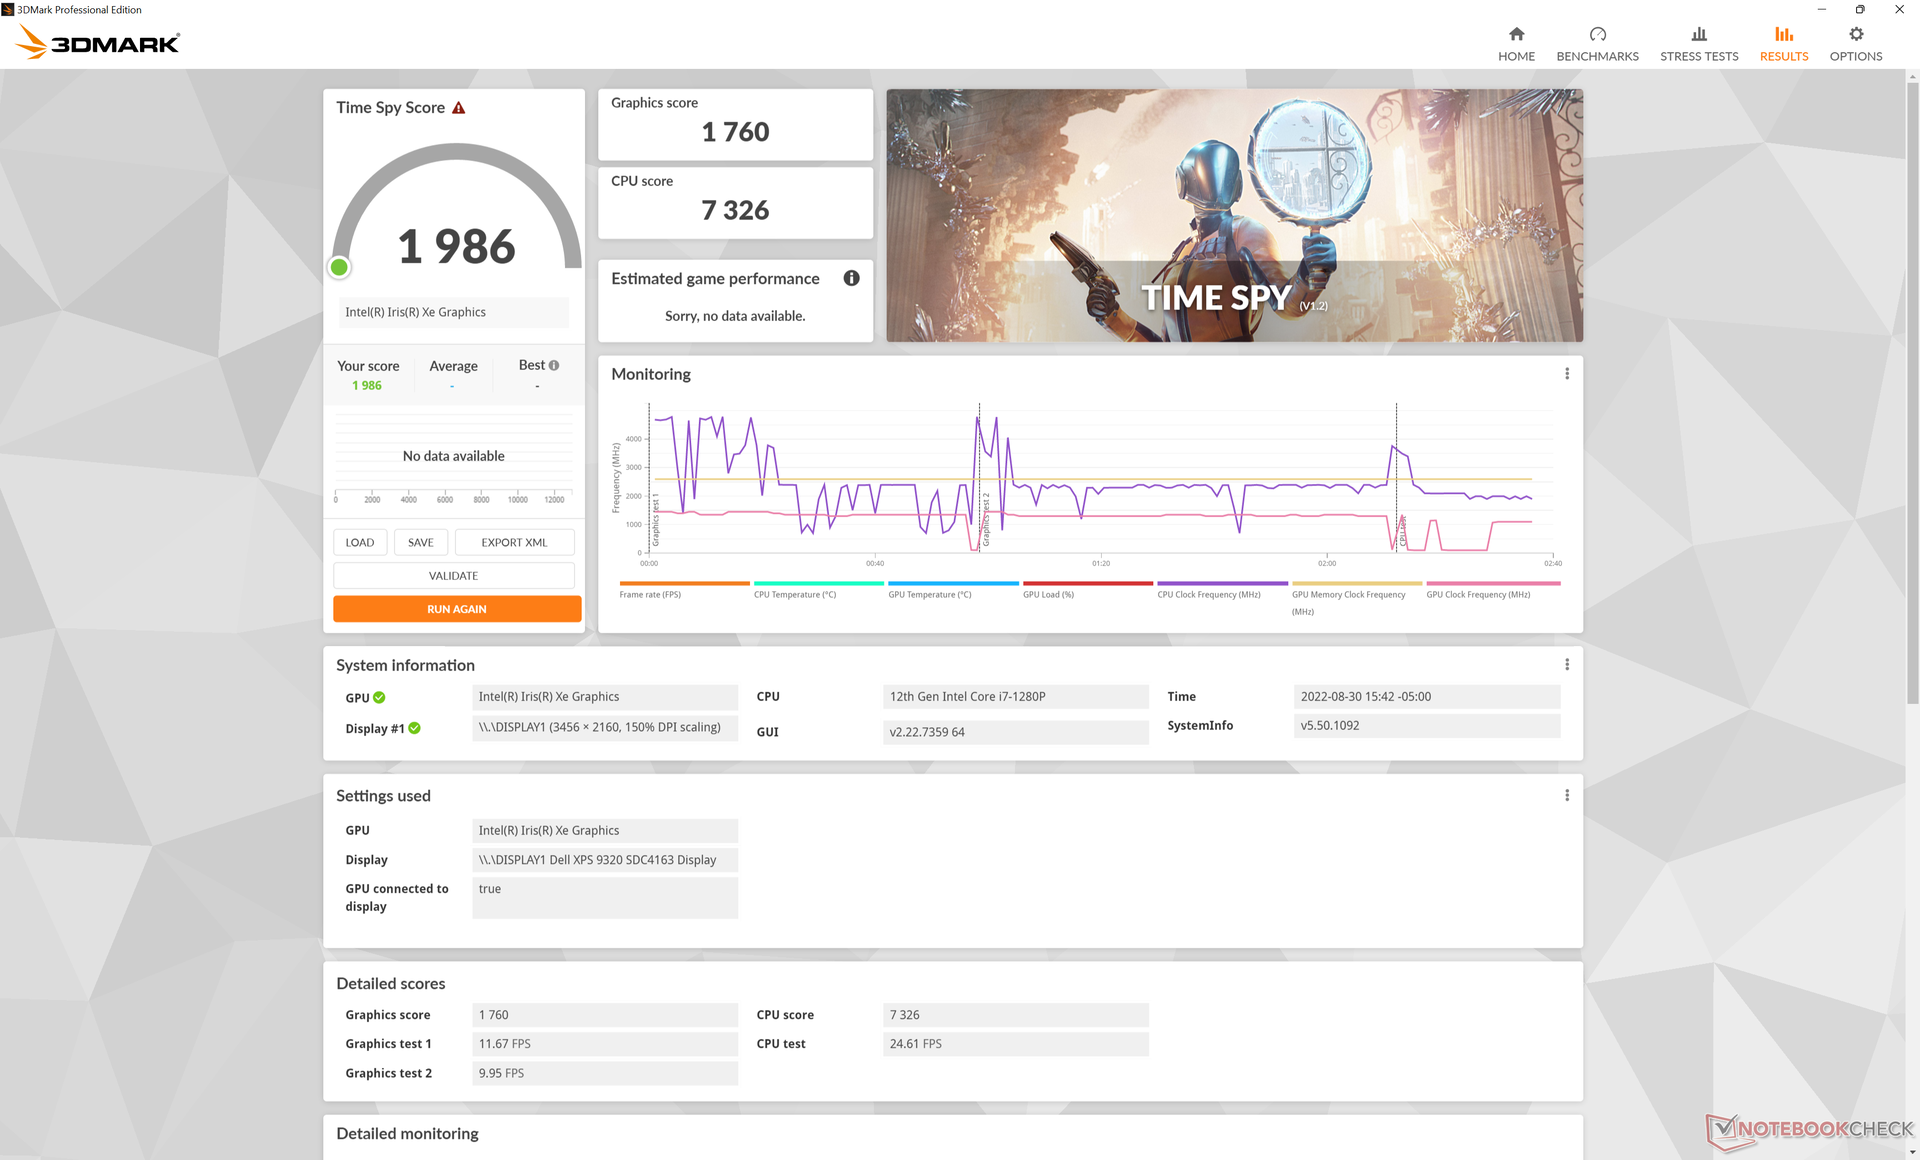
GPU-prestanda
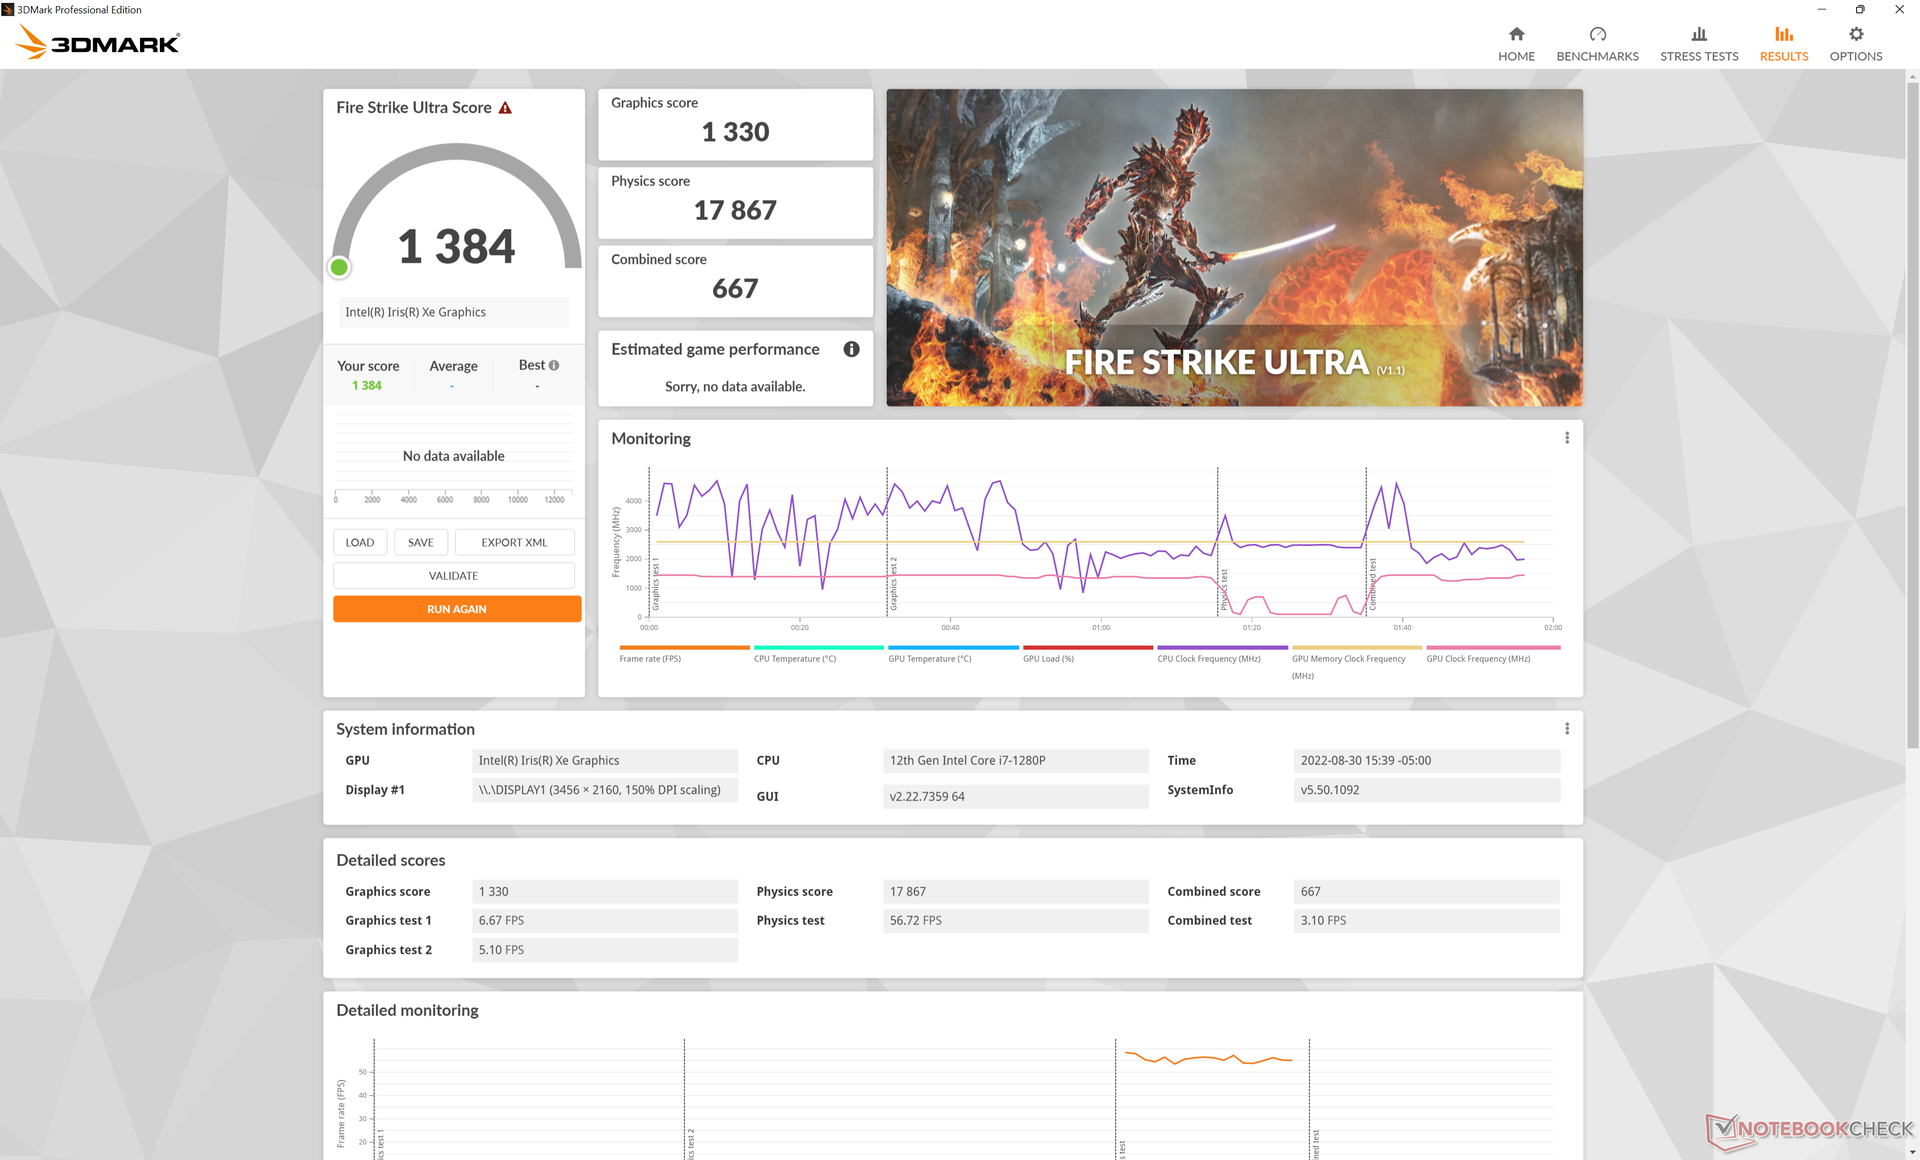
Grafikprestandan är i stort sett identisk med Core i7-1260P-konfigurationen. Jämfört med Core i5-1240P-alternativet med 8 GB RAM och Iris Xe 80 EUdock, vår Iris Xe 96 EUs cirka 30 till 65 procent snabbare. Du bör konfigurera med minst 16 GB RAM och en Core i7 CPU om du vill maximera GPU-prestandan.
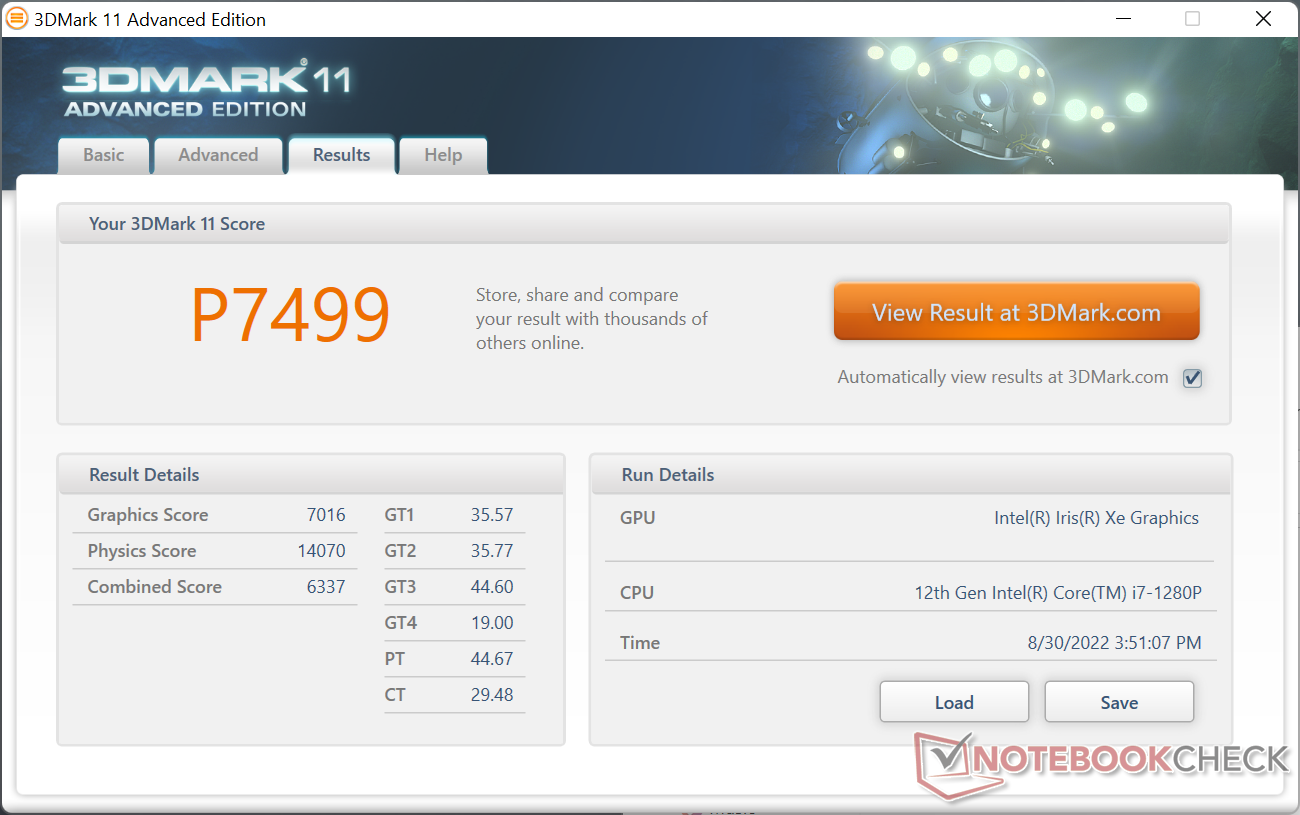
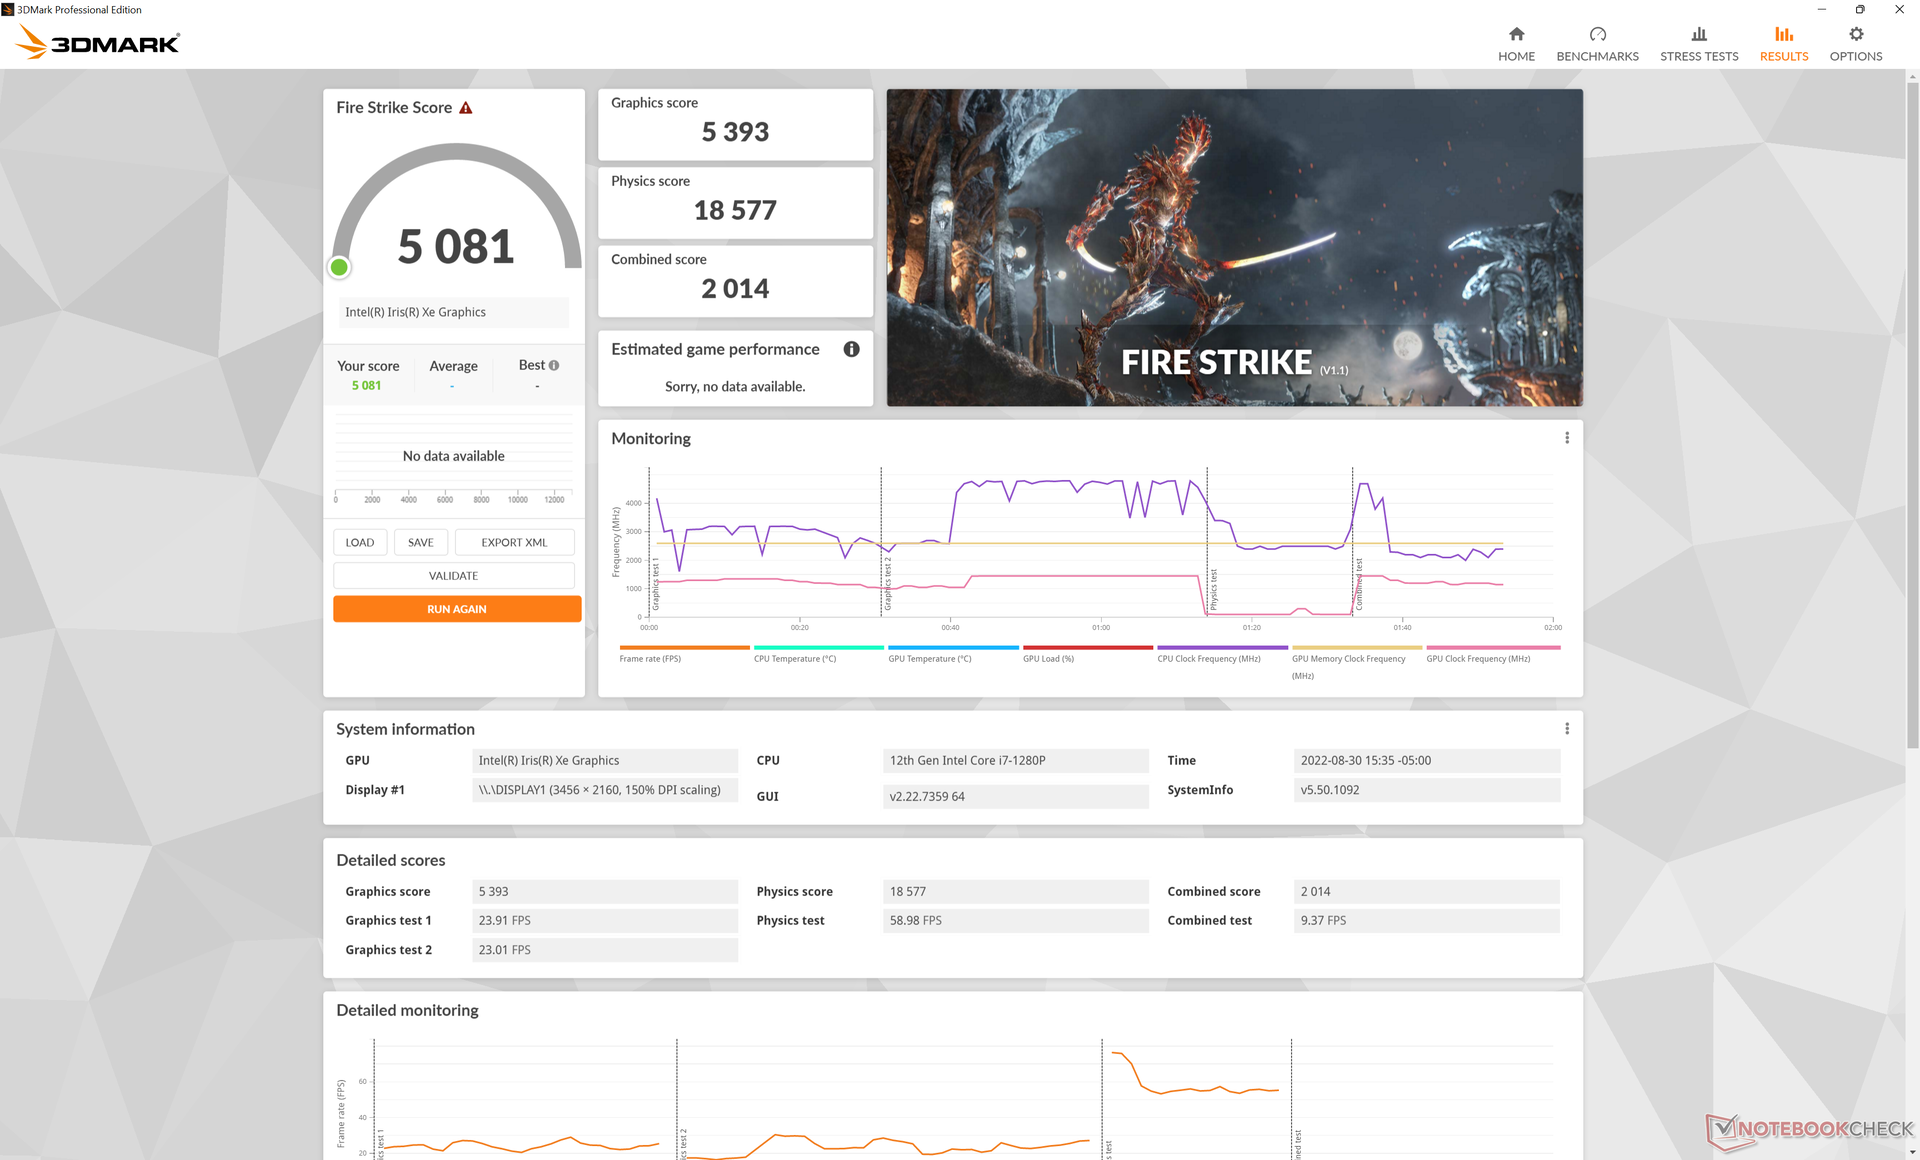
| 3DMark 11 Performance | 7499 poäng | |
| 3DMark Cloud Gate Standard Score | 16231 poäng | |
| 3DMark Fire Strike Score | 5081 poäng | |
| 3DMark Time Spy Score | 1986 poäng | |
Hjälp | ||
| Cyberpunk 2077 1.6 | |
| 1920x1080 Low Preset | |
| Dell XPS 13 Plus 9320 i7-1280P OLED | |
| Genomsnitt Intel Iris Xe Graphics G7 96EUs (13 - 25.9, n=42) | |
| 1920x1080 Medium Preset | |
| Dell XPS 13 Plus 9320 i7-1280P OLED | |
| Genomsnitt Intel Iris Xe Graphics G7 96EUs (10.8 - 21.7, n=37) | |
| 1920x1080 High Preset | |
| Dell XPS 13 Plus 9320 i7-1280P OLED | |
| Genomsnitt Intel Iris Xe Graphics G7 96EUs (9.8 - 16.9, n=34) | |
| 1920x1080 Ultra Preset | |
| Dell XPS 13 Plus 9320 i7-1280P OLED | |
| Genomsnitt Intel Iris Xe Graphics G7 96EUs (7.4 - 16.8, n=32) | |
Witcher 3 FPS Chart
| låg | med. | hög | ultra | |
|---|---|---|---|---|
| GTA V (2015) | 123.7 | 108.7 | 27.6 | 11.5 |
| The Witcher 3 (2015) | 104.8 | 65.7 | 36.9 | 16.4 |
| Dota 2 Reborn (2015) | 110.3 | 86.8 | 68.1 | 58.7 |
| Final Fantasy XV Benchmark (2018) | 46.1 | 25.3 | 17.6 | |
| X-Plane 11.11 (2018) | 55.2 | 40.7 | 37.6 | |
| Strange Brigade (2018) | 100.2 | 45.4 | 36.5 | 29.6 |
| Cyberpunk 2077 1.6 (2022) | 20.9 | 17.9 | 13.9 | 11.2 |
Utsläpp
Systembrus
De dubbla interna fläktarna är utmärkta på att vara tysta vid låg till medelhög belastning, eftersom vi bara kunde mäta ett ljud på 25,4 dB(A) vid surfning eller videostreaming mot en tyst bakgrund på 23,4 dB(A). Högre belastningar som spel kommer att framkalla ett fläktljud mellan 35 och 42 dB(A). Märkligt nog kan vi inte nå upp till det tak på 45,5 dB(A) som vi registrerade på konfigurationen i7-1260P även när vi ställde in läget Ultra Performance. De övergripande resultaten ligger istället närmare vad vi registrerade på den äldre XPS 13 9310 2-in-1.
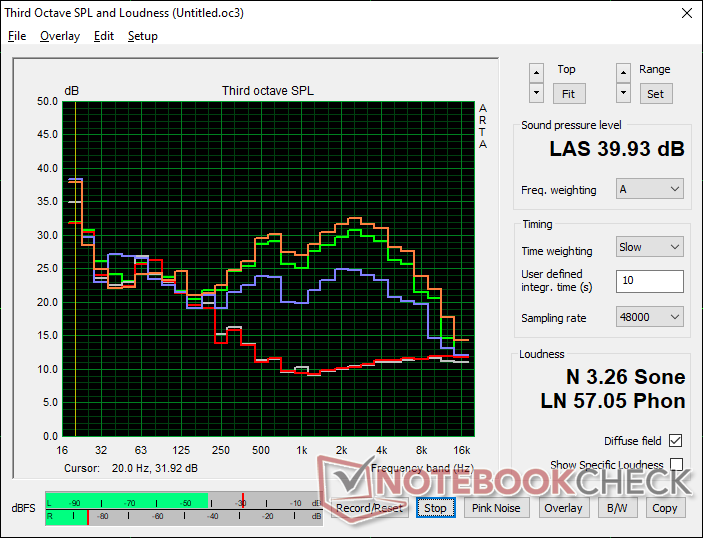
Ljudnivå
| Låg belastning |
| 23.4 / 23.4 / 23.4 dB(A) |
| Hög belastning |
| 35 / 39.9 dB(A) |
 | ||
30 dB tyst 40 dB(A) hörbar 50 dB(A) högt ljud |
||
min: | ||
| Dell XPS 13 Plus 9320 i7-1280P OLED Iris Xe G7 96EUs, i7-1280P, WDC PC SN810 512GB | Dell XPS 13 Plus 9320 i5-1240p Iris Xe G7 80EUs, i5-1240P, Micron 3400 MTFDKBA512TFH 512GB | Dell XPS 13 9315, i5-1230U Iris Xe G7 80EUs, i5-1230U, Micron 3460 256 GB Soldered | Dell XPS 13 Plus 9320 4K Iris Xe G7 96EUs, i7-1260P, Samsung PM9A1 MZVL21T0HCLR | Dell XPS 13 9310 2-in-1 Iris Xe G7 96EUs, i7-1165G7, Toshiba BG4 KBG40ZPZ512G | Dell XPS 13 9310 OLED Iris Xe G7 96EUs, i7-1185G7, Toshiba XG6 KXG60ZNV512G | |
|---|---|---|---|---|---|---|
| Noise | -13% | -8% | -8% | -4% | 4% | |
| av / miljö * (dB) | 23.4 | 26 -11% | 26 -11% | 24.4 -4% | 24.3 -4% | 24.8 -6% |
| Idle Minimum * (dB) | 23.4 | 26.2 -12% | 26 -11% | 24.4 -4% | 24.8 -6% | 25 -7% |
| Idle Average * (dB) | 23.4 | 26.2 -12% | 26 -11% | 24.4 -4% | 24.8 -6% | 25 -7% |
| Idle Maximum * (dB) | 23.4 | 26.2 -12% | 27.5 -18% | 25.5 -9% | 24.8 -6% | 25 -7% |
| Load Average * (dB) | 35 | 38.4 -10% | 39.5 -13% | 40.4 -15% | 38 -9% | 25.3 28% |
| Witcher 3 ultra * (dB) | 41.6 | 39.6 5% | 45.5 -9% | 38 9% | 35.8 14% | |
| Load Maximum * (dB) | 39.9 | 47.1 -18% | 39.6 1% | 45.5 -14% | 41.5 -4% | 35.8 10% |
* ... mindre är bättre
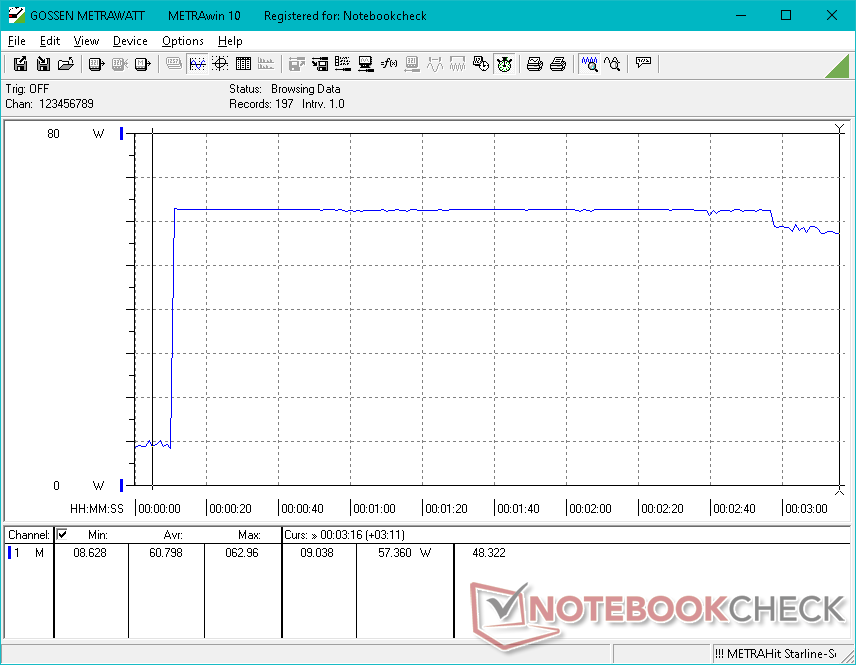
Stresstest
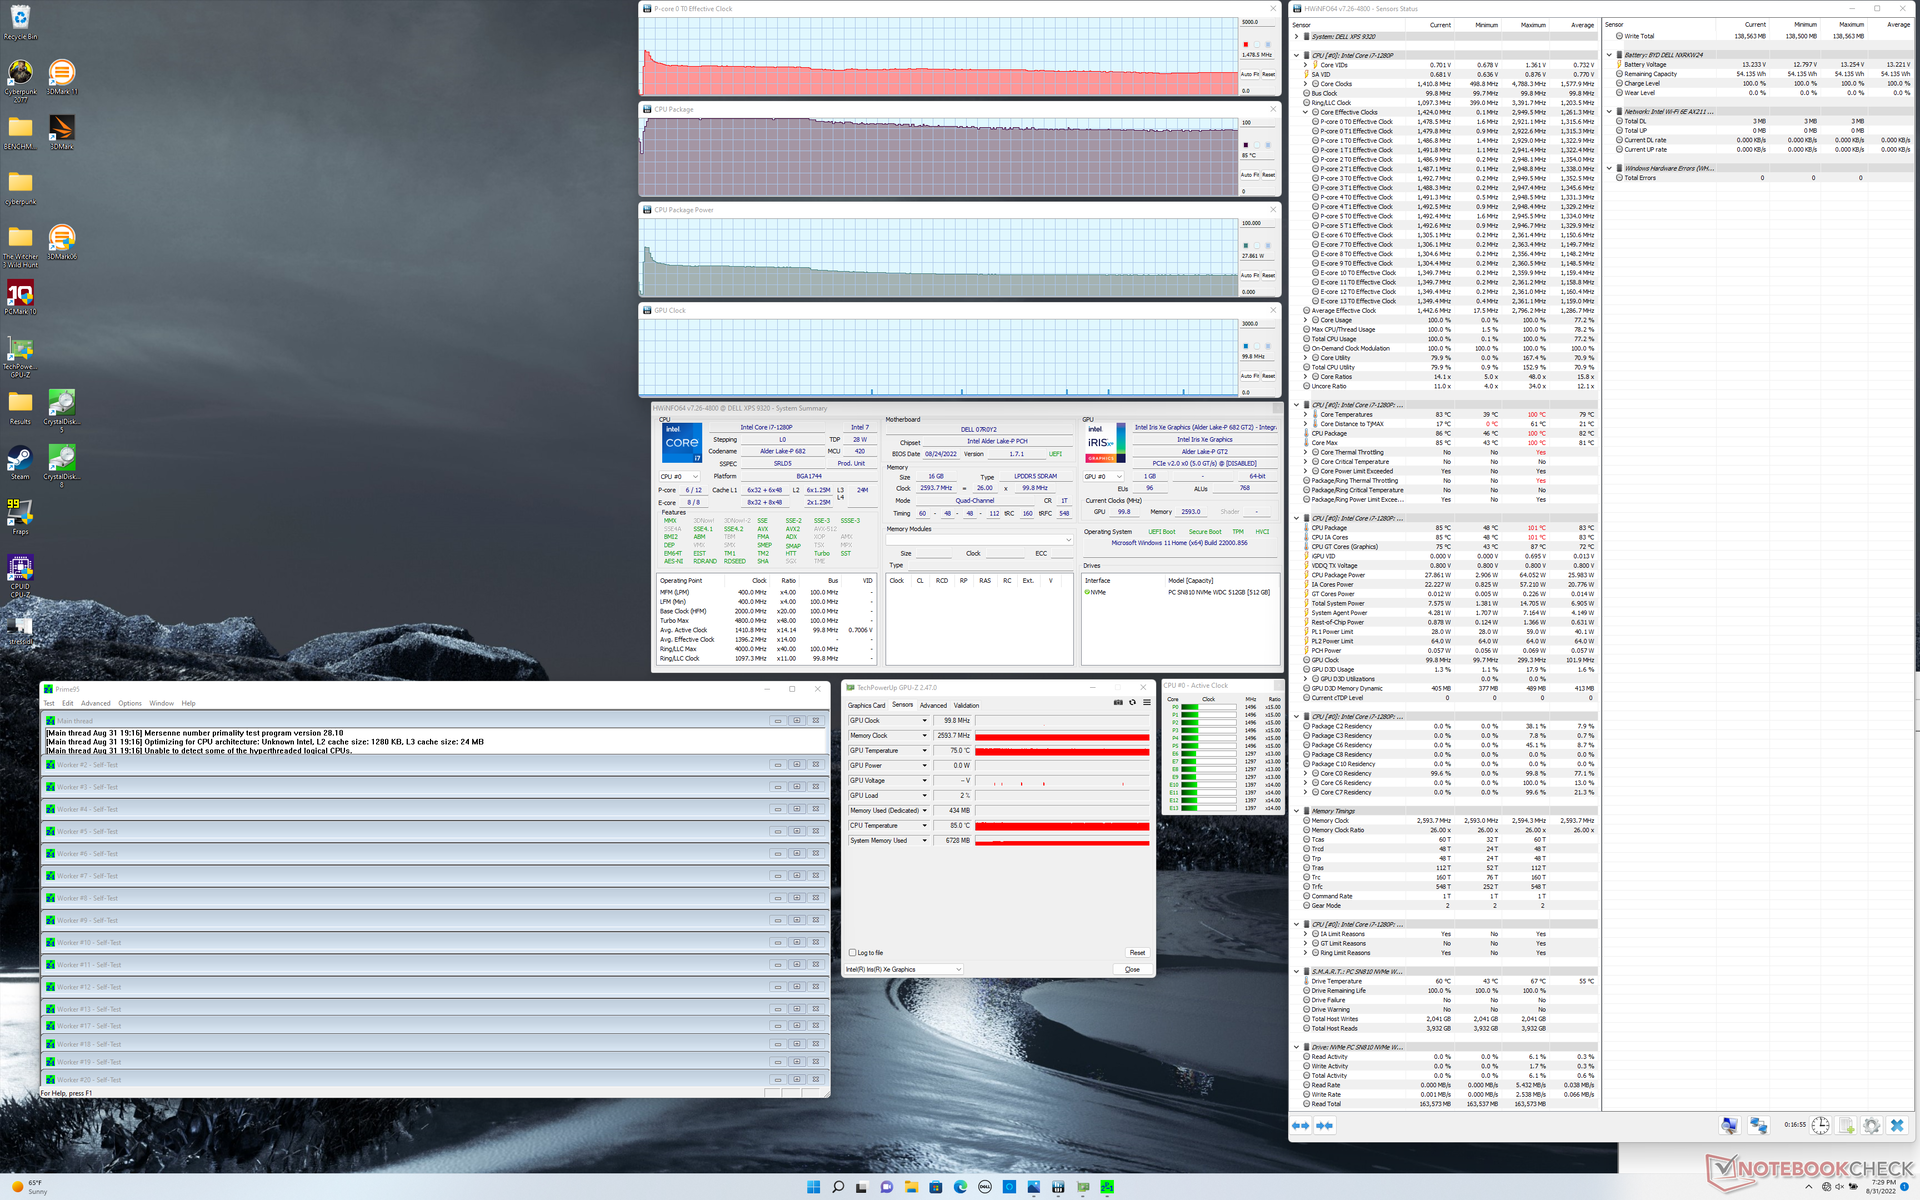
När Prime95-stressen startas får CPU-klockfrekvens, temperatur och strömförbrukning på kortet att stiga till 2,9 GHz, 100 C respektive 64 W, vilket varar i nästan 3 minuter. Därefter sjunker klockfrekvensen, temperaturen och strömförbrukningen på kortet och stabiliseras till 1,5 GHz, 85 C respektive 28 W, vilket framgår av skärmdumpen nedan. Dessa resultat stämmer överens med vårt CineBench R15 xT-stresttest ovan, där den initiala höga poängen inte var hållbara under långa perioder på grund av den bärbara datorns begränsade Turbo Boost. Intressant nog är det stabila 28 W-målet faktiskt lägre än det stabila 34 W-målet för i7-1260P-konfigurationen, vilket kan förklara de något bättre CineBench R15 xT-resultaten från vår i7-1260P-testenhet.
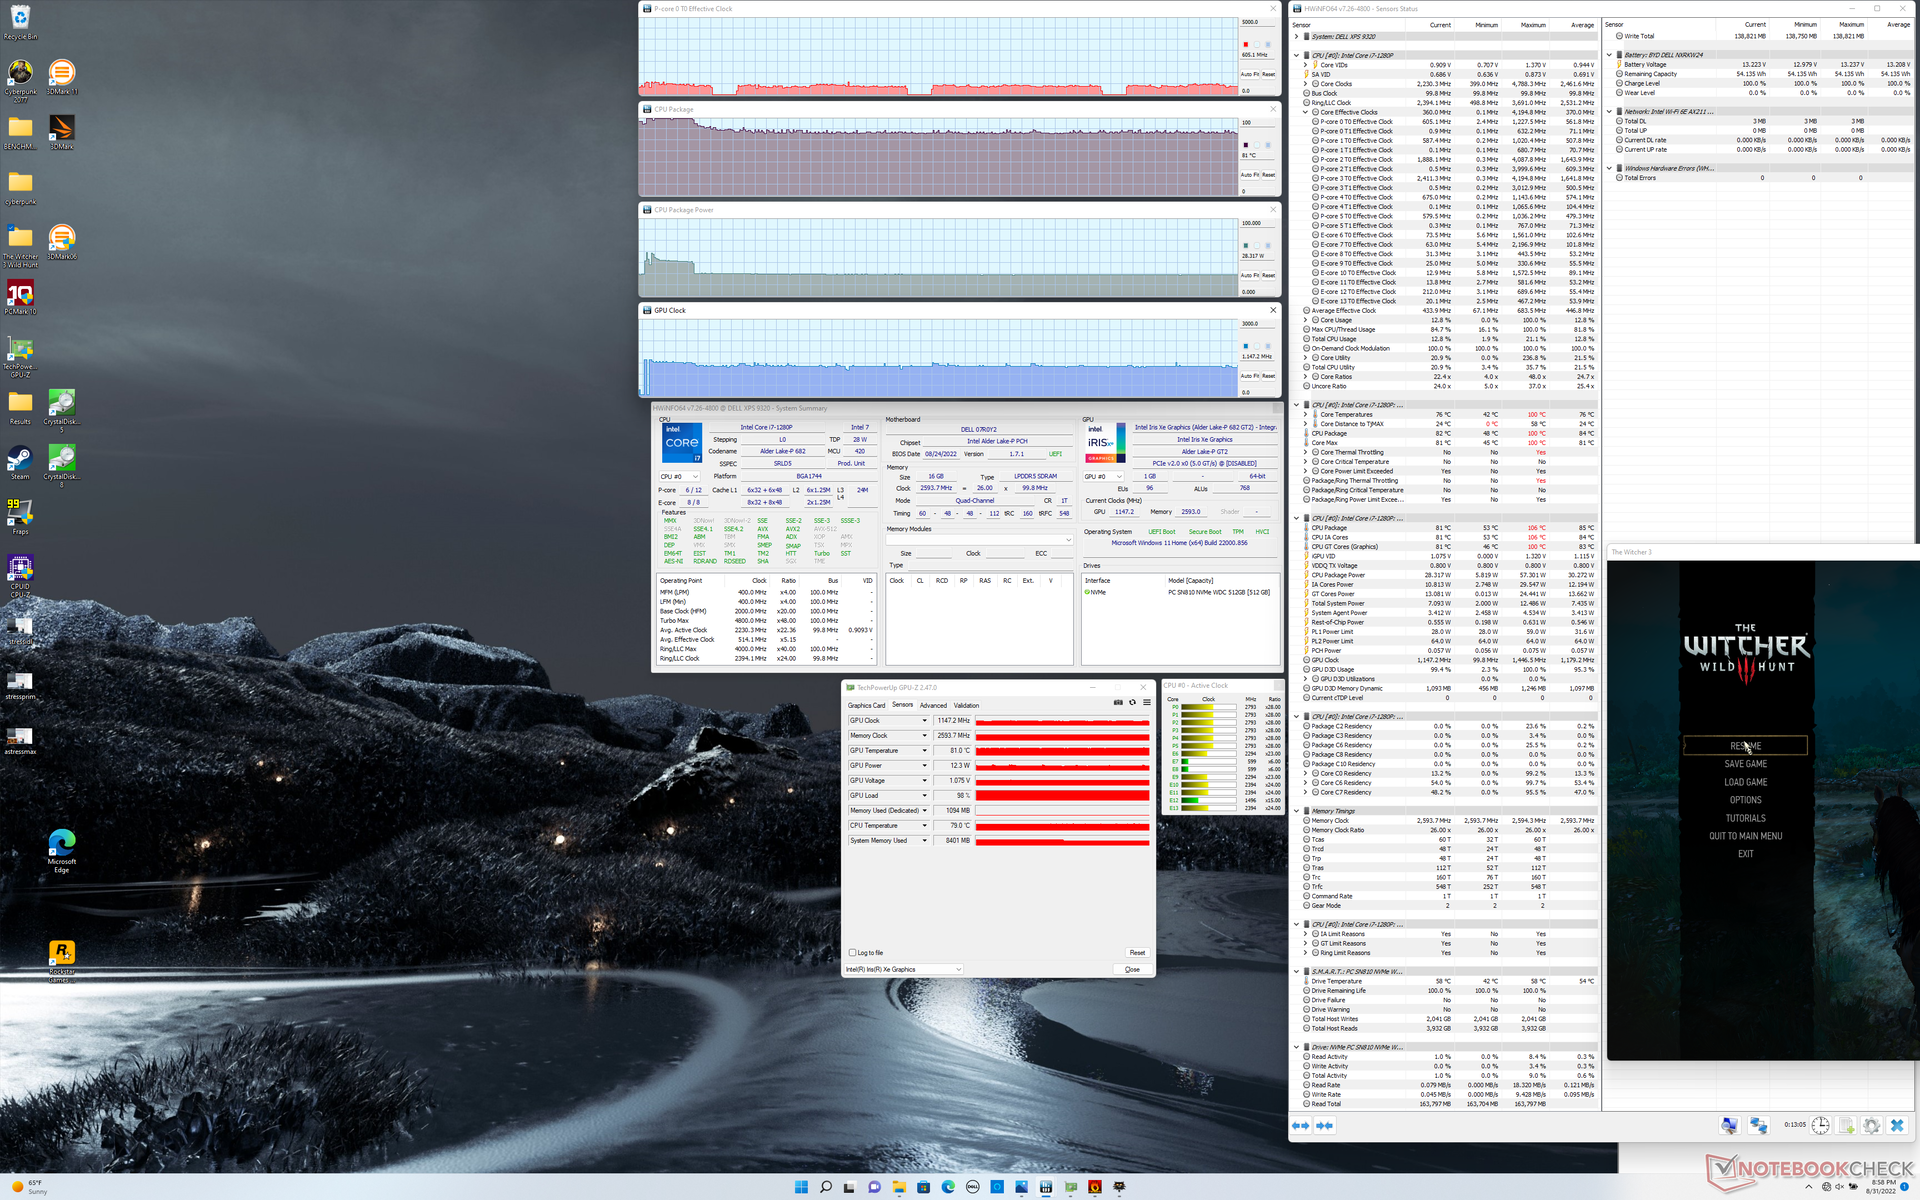
GPU-klockfrekvensen och temperaturen skulle stabiliseras vid 1147 MHz respektive 81 C när man körde Witcher 3 för att representera krävande grafikbelastningar.
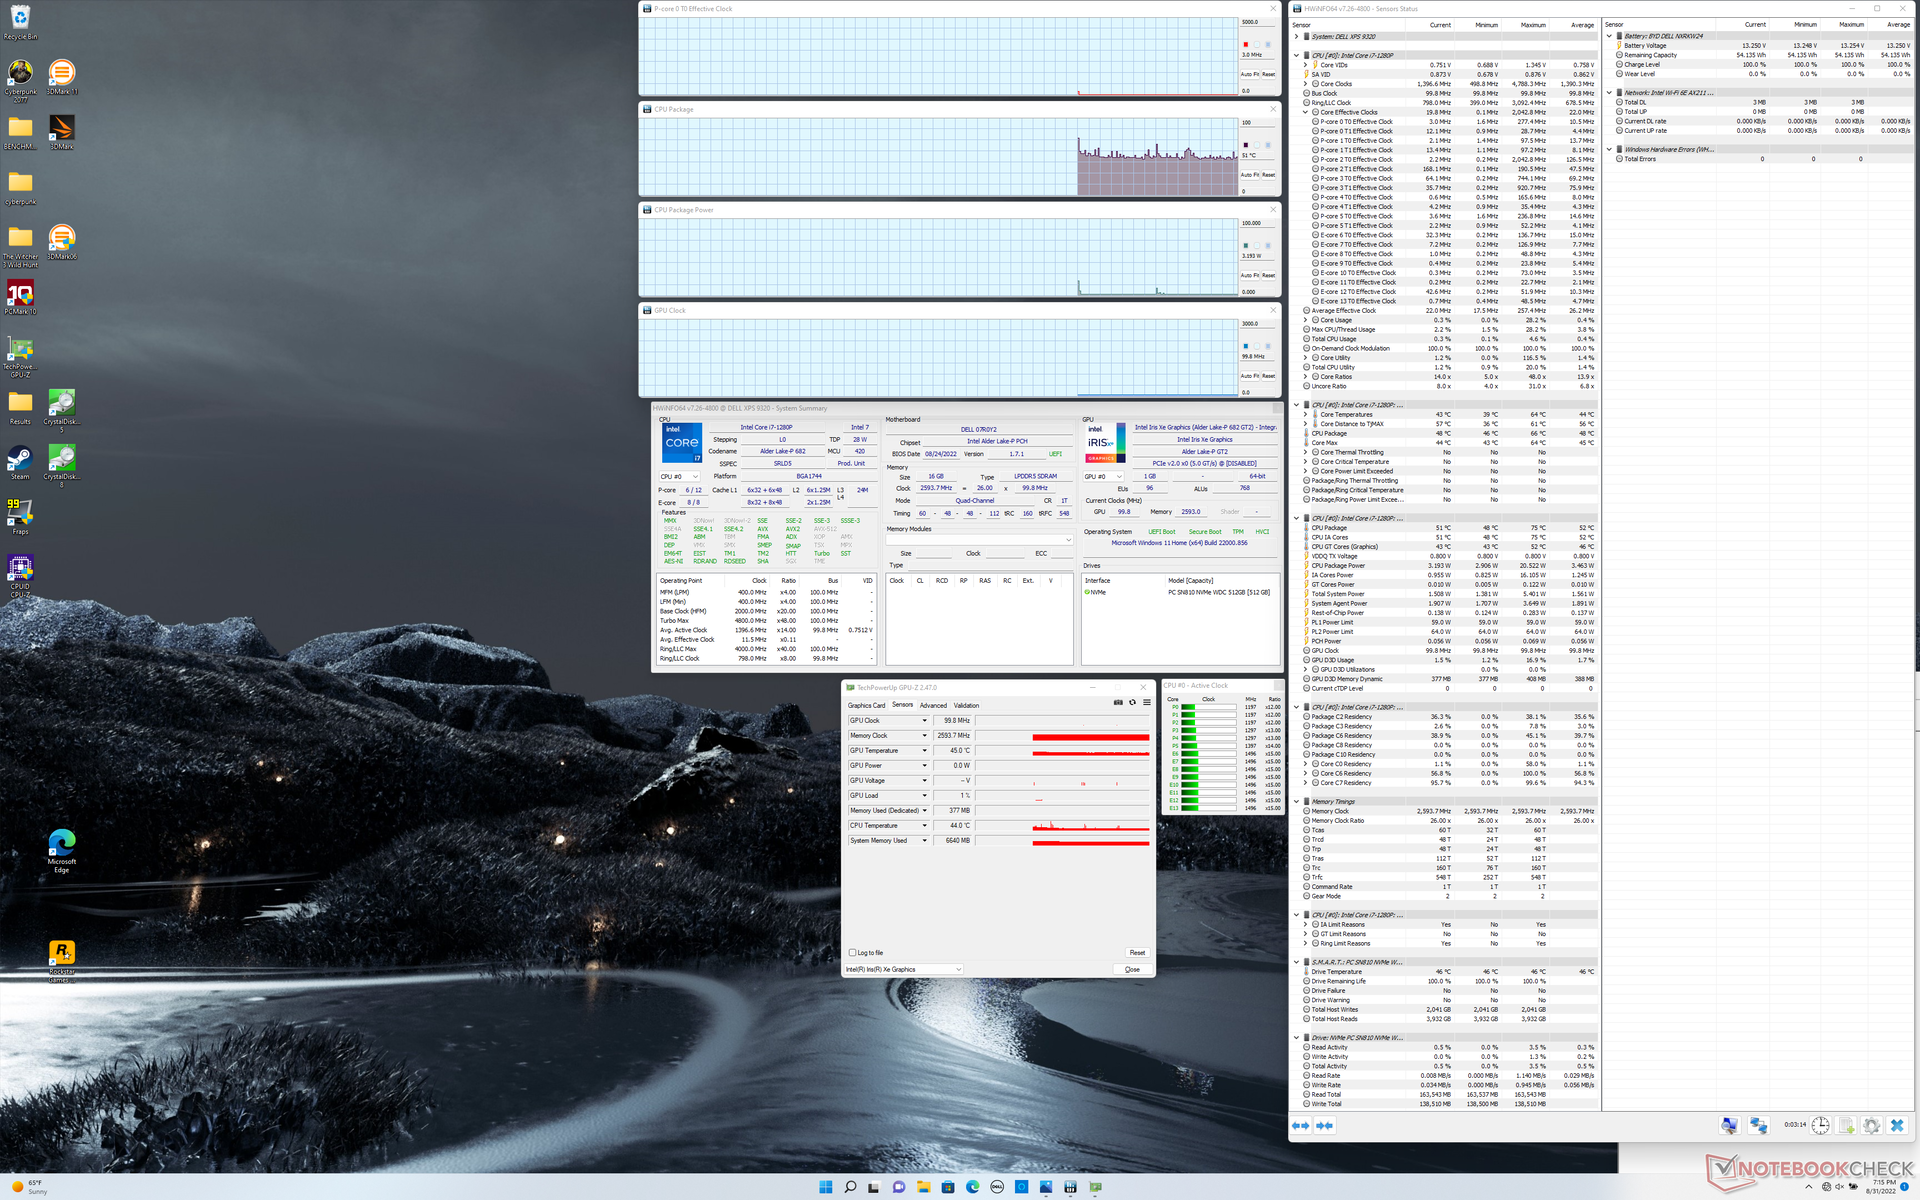
| CPU-klocka (GHz) | GPU-klocka (MHz) | Genomsnittlig CPU-temperatur (°C) | |
| Systemets tomgång | -- | -- | 51 |
| Prime95 Stress | 1.5 | -- | 85 |
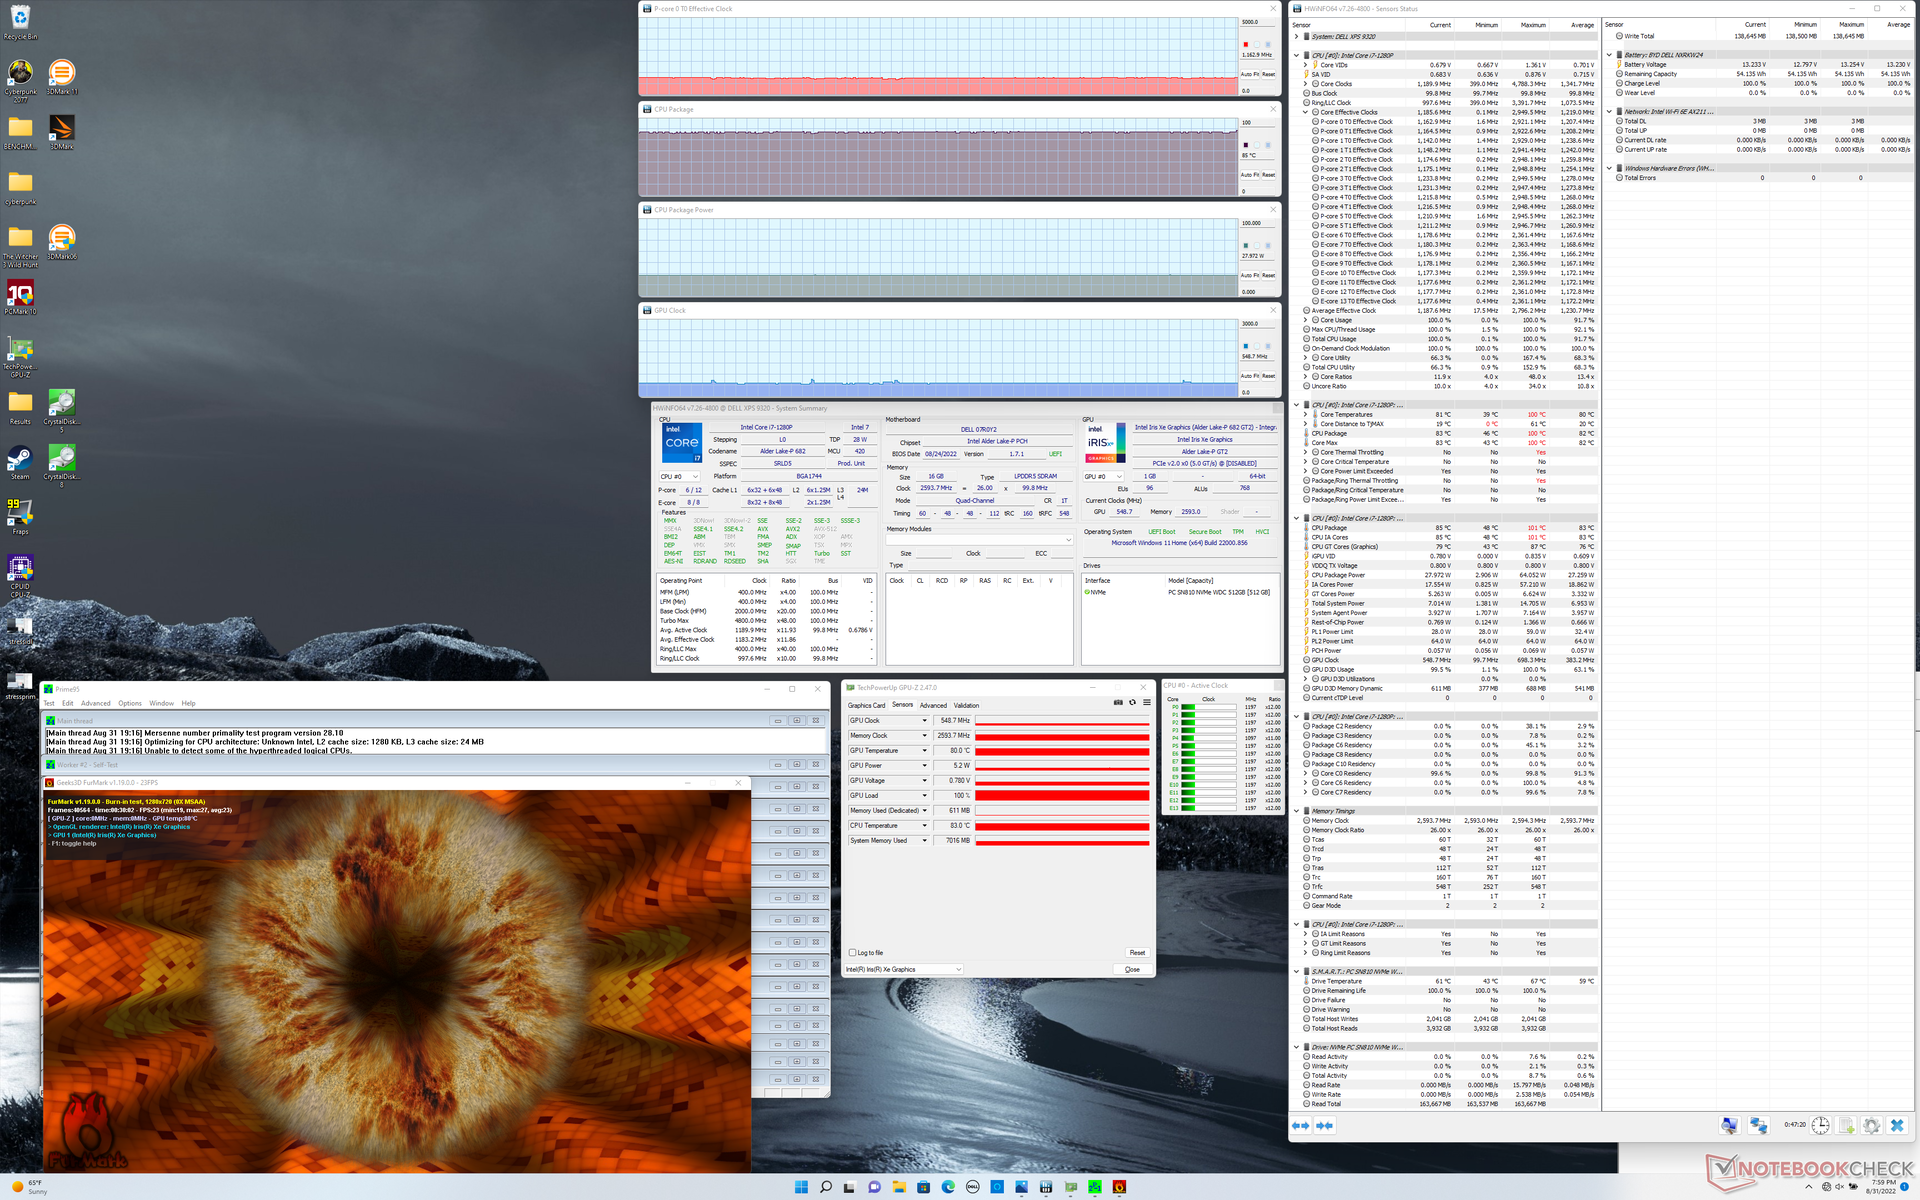
| Prime95 + FurMark Stress | 1.2 | 549 | 85 |
| Witcher 3 Stress | ~0,6 | 1147 | 81 |
Energiförvaltning
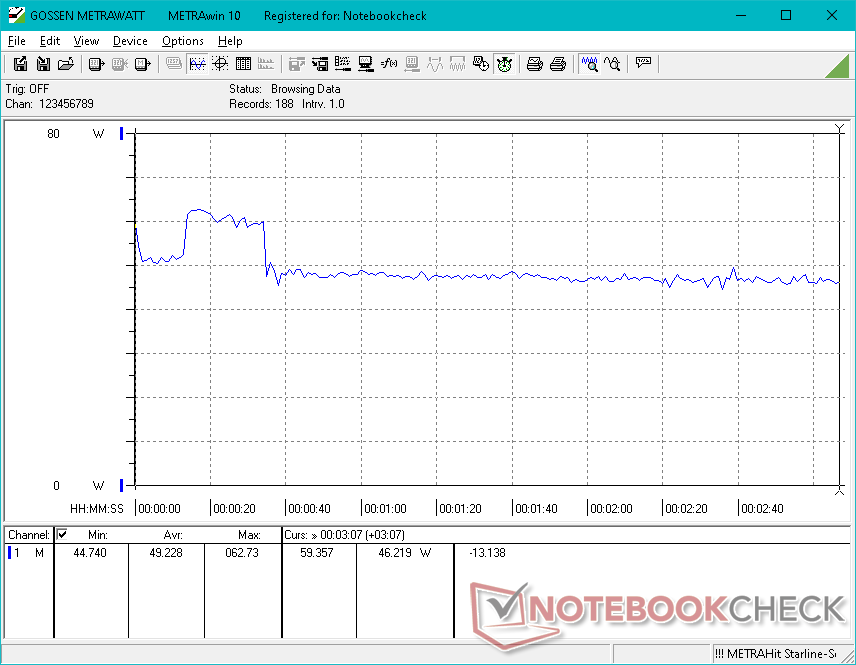
Effektförbrukning
Strömförbrukningen kan vara så låg som 6 W vid visning av en becksvart bild eller upp till 13 W vid visning av en helt vit bild vid maximal ljusstyrka. I jämförelse skulle IPS-panelerna på de andra XPS 13 Plus SKU:erna bara öka med 2 till 4 W mellan deras lägsta och högsta ljusstyrka. Vi har undersökt hur strömförbrukningen förhåller sig till OLED-paneler tidigare och trenden fortsätter på dessa XPS 13 Plus-konfigurationer. Kort sagt kommer IPS-alternativen att vara mer energieffektiva i de flesta scenarier, särskilt eftersom webbplatser, kalkylblad och ordbehandlingsprogram tenderar att vara övervägande vita i färgen.
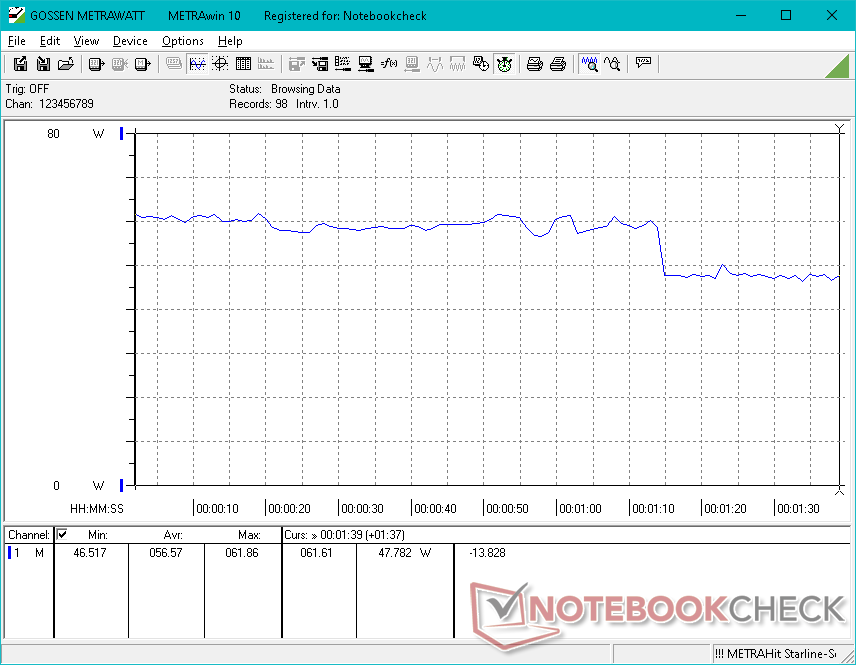
Högre belastningar som spel visar högre strömförbrukning än 8 GB Core i5-1240P-konfigurationen med cirka 15-55 procent, vilket ungefär motsvarar den högre grafikprestandan i vår 16 GB i7-1280P-konfiguration. Resultaten är annars mycket nära Core i7-1260P-konfigurationen utom när man kör CPU-intensiva belastningar som Prime95 under de första minuterna, vilket framgår av vår graf nedan.
| Av/Standby | |
| Låg belastning | |
| Hög belastning |
|
Förklaring:
min: | |
| Dell XPS 13 Plus 9320 i7-1280P OLED i7-1280P, Iris Xe G7 96EUs, WDC PC SN810 512GB, OLED, 3456x2160, 13.4" | Dell XPS 13 Plus 9320 i5-1240p i5-1240P, Iris Xe G7 80EUs, Micron 3400 MTFDKBA512TFH 512GB, IPS, 1920x1200, 13.4" | Dell XPS 13 9315, i5-1230U i5-1230U, Iris Xe G7 80EUs, Micron 3460 256 GB Soldered, IPS, 1920x1200, 13.4" | Dell XPS 13 Plus 9320 4K i7-1260P, Iris Xe G7 96EUs, Samsung PM9A1 MZVL21T0HCLR, IPS, 3840x2400, 13.4" | Dell XPS 13 9310 2-in-1 i7-1165G7, Iris Xe G7 96EUs, Toshiba BG4 KBG40ZPZ512G, IPS, 1920x1200, 13.4" | Dell XPS 13 9310 OLED i7-1185G7, Iris Xe G7 96EUs, Toshiba XG6 KXG60ZNV512G, OLED, 3456x2160, 13.4" | |
|---|---|---|---|---|---|---|
| Power Consumption | -16% | 40% | -7% | 38% | 19% | |
| Idle Minimum * (Watt) | 6.5 | 10 -54% | 3.6 45% | 7 -8% | 2.6 60% | 5.7 12% |
| Idle Average * (Watt) | 7.8 | 12.3 -58% | 6.8 13% | 11 -41% | 6.4 18% | 6 23% |
| Idle Maximum * (Watt) | 13 | 15.5 -19% | 6.8 48% | 11.4 12% | 7.7 41% | 12.3 5% |
| Load Average * (Watt) | 56.6 | 43 24% | 24 58% | 59.7 -5% | 29.9 47% | 44.4 22% |
| Witcher 3 ultra * (Watt) | 49.2 | 43.1 12% | 23.6 52% | 49.4 -0% | 32.2 35% | 36.5 26% |
| Load Maximum * (Watt) | 63 | 62.8 -0% | 47 25% | 63 -0% | 47.5 25% | 47.8 24% |
* ... mindre är bättre
Power Consumption Witcher 3 / Stresstest
Power Consumption external Monitor
Batteritid
Med bara 5,5 timmars verklig WLAN-användning på den balanserade strömprofilen är körtiderna kortare än någon annan XPS 13 Plus-konfiguration, vilket till stor del beror på OLED-panelen. De andra IPS SKU:erna håller ungefär 1-2 timmar längre.
| Dell XPS 13 Plus 9320 i7-1280P OLED i7-1280P, Iris Xe G7 96EUs, 55 Wh | Dell XPS 13 Plus 9320 i5-1240p i5-1240P, Iris Xe G7 80EUs, 55 Wh | Dell XPS 13 9315, i5-1230U i5-1230U, Iris Xe G7 80EUs, 51 Wh | Dell XPS 13 Plus 9320 4K i7-1260P, Iris Xe G7 96EUs, 55 Wh | Dell XPS 13 9310 2-in-1 i7-1165G7, Iris Xe G7 96EUs, 51 Wh | Dell XPS 13 9310 OLED i7-1185G7, Iris Xe G7 96EUs, 52 Wh | |
|---|---|---|---|---|---|---|
| Batteridrifttid | 38% | 155% | 19% | 84% | 12% | |
| WiFi v1.3 (h) | 5.8 | 8 38% | 14.8 155% | 6.9 19% | 10.7 84% | 6.5 12% |
| Load (h) | 1.6 | 2.6 | 1.3 | 3.4 | ||
| H.264 (h) | 11 | |||||
| Reader / Idle (h) | 25.4 |
För
Emot
Omdöme - Snabbare, men inte riktigt bättre
Den mest avancerade konfigurationen med Core i7-1280P CPU och OLED-skärm är utformad för en mycket specifik undergrupp av användare. Om din arbetsbelastning kräver P3-färger och tung multitasking mellan olika program kan den snabbare inledande Turbo Boost för CPU:n och OLED-skärmen vara värt investeringen jämfört med den billigare Core i7-1260P och IPS alternativ. Annars uppväger de nackdelar de medför inte nödvändigtvis deras fördelar. OLED introducerar flimmer som annars inte finns på IPS-panelerna förutom både en lägre maximal ljusstyrka och en kortare batteritid. Processorn i7-1280P är inte heller garanterat snabbare än i7-1260P när den initiala toppen i Turbo Boost-prestanda oundvikligen avtar.
Ett annat oväntat resultat gäller prestandan hos WD SN810 SSD:n som skulle throttla på vår testenhet när den utsattes för stress. Om du kan hitta SKU:er med Micron 3400 eller Samsung PM9A1 i stället kan dessa enheter erbjuda stabilare prestanda.
För de flesta användare är Core i7-1260P och IPS-konfigurationen en bättre balans mellan prestanda och pris än i7-1280P och OLED-konfigurationen. Den erbjuder till och med både längre batteritid och en ljusare skärm trots den lägre prisnivån.
Skillnaderna mellan i7-1260P och i7-1280P SKU:erna är mindre än skillnaderna mellan i7-1260P och i7-1280P SKU:erna i5-1240P och i7-1260P SKU:er när det gäller integrerad grafikprestanda. Vi rekommenderar att man konfigurerar med minst 16 GB RAM oavsett CPU-alternativ, annars sjunker grafikprestandan.
Pris och tillgänglighet
Konfigurationer med Core i7-1280P är ännu inte allmänt tillgängliga hos återförsäljare som Newegg, Amazon eller Best Buy eftersom SKU:er med i7-1260P är betydligt vanligare. OLED-alternativ är dock allmänt tillgängliga om än med i7-1260P istället. Användare kan köpa direkt från Dell för vår exakta i7-1280P OLED-konfiguration för 1750 USD.
Dell XPS 13 Plus 9320 i7-1280P OLED
- 09/02/2022 v7 (old)
Allen Ngo
Price comparison

