Recension av HP EliteBook 840 G9 - Ett alternativ till Lenovo ThinkPad X1 Carbon
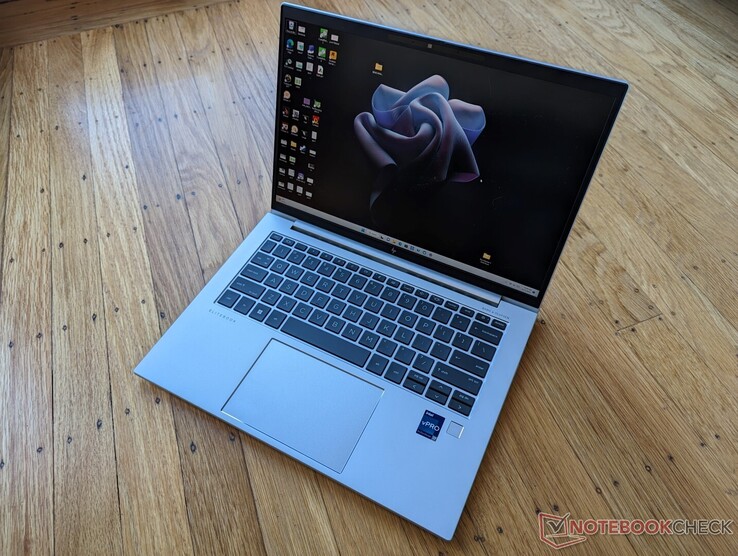
EliteBook 840 G9 är Intel-versionen av EliteBook 845 G9 som vi nyligen recenserade i två olika konfigurationer. På den här recensionssidan kommer vi att fokusera på prestandan hos konfigurationen EliteBook 840 G9 Core i7-1280P, eftersom detaljer om chassi, tangentbord, serviceförmåga och andra fysiska attribut finns på våra befintliga AMD granskningssidor
Urvalet av SKU:er är mycket större än på de flesta bärbara datorer för konsumenter eftersom EliteBook integrerar många fler valfria funktioner. Processorer från Core i5-1250P till Core i7-1280P, skärmar med 250-nit till 1000-nit och 8 till 64 GB RAM-minne bland andra extra alternativ som visas här. Vår särskilda granskningsenhet kommer med den högsta nivån Core i7-1280P-processor men med en i övrigt mellanklassig 400-nit-panel och 16 GB RAM för strax under 3 000 USD
Alternativ till EliteBook 840 G9 inkluderar andra 14-tums flaggskeppsboksmodeller för affärsbruk, som t.ex Lenovo ThinkPad X1 Carbon Gen 10 eller Dell Latitude 9430 eller Latitude 7420
Fler HP-recensioner:
Potentiella konkurrenter i jämförelse
Gradering | Datum | Modell | Vikt | Höjd | Storlek | Upplösning | Pris |
|---|---|---|---|---|---|---|---|
| 88.7 % v7 (old) | 12/2022 | HP EliteBook 840 G9 i7-1280P, Iris Xe G7 96EUs | 1.5 kg | 19 mm | 14.00" | 1920x1200 | |
| 88.6 % v7 (old) | 07/2022 | HP EliteBook 845 G9 6F6H6EA R9 PRO 6950HS, Radeon 680M | 1.5 kg | 19.3 mm | 14.00" | 1920x1200 | |
| 89.8 % v7 (old) | 08/2021 | HP EliteBook 840 Aero G8 3E4Q6AA i7-1185G7, Iris Xe G7 96EUs | 1.2 kg | 17.9 mm | 14.00" | 1920x1080 | |
| 90.2 % v7 (old) | 12/2022 | Lenovo ThinkPad X1 Carbon G10 Core i7-1265U i7-1265U, Iris Xe G7 96EUs | 1.2 kg | 15.36 mm | 14.00" | 1920x1200 | |
| 86.6 % v7 (old) | 10/2022 | LG Gram 14Z90Q i5-1240P, Iris Xe G7 80EUs | 980 g | 16.8 mm | 14.00" | 1920x1200 | |
| 90.1 % v7 (old) | 04/2022 | Dell Latitude 7420 JW6MH i5-1145G7, Iris Xe G7 80EUs | 1.3 kg | 17.3 mm | 14.00" | 1920x1080 |
Hölje - Samma som EliteBook 845 G9
Även om chassit är visuellt identiskt med EliteBook 845 G9, kan du enkelt skilja de två modellerna åt genom att titta på USB-C-portarna längs vänsterkanten. 840 G9 kommer att ha en Thunderbolt-etikett bredvid portarna medan den AMD-drivna 845 G9 utelämnar etiketten helt och hållet på grund av att den saknar stöd.
För service har HP en hel videoguide från början till slut om hur man tar bort och byter ut varje viktig komponent i modellen. Detta är en praxis som vi hoppas att andra stora tillverkare kan efterlikna i framtiden för att ta bort alla gissningar från slutanvändarna.
Kommunikation
En Intel AX211 är standard på de flesta 840 G9-konfigurationer eftersom det trots allt är en Intel-driven serie. Den AMD-drivna 845 G9 använder däremot Qualcomm Fast Connect 6900 för att ge samma Wi-Fi 6E-funktionalitet. Den övergripande prestandan är jämförbar mellan de två baserat på våra tester med en Asus AXE11000-router.
WAN är valfritt med valet av antingen en Intel XMM 7560 R+ LTE eller 5000 5G.
| Networking | |
| iperf3 transmit AX12 | |
| Dell Latitude 7420 JW6MH | |
| HP EliteBook 840 Aero G8 3E4Q6AA | |
| iperf3 receive AX12 | |
| Dell Latitude 7420 JW6MH | |
| HP EliteBook 840 Aero G8 3E4Q6AA | |
| iperf3 receive AXE11000 6GHz | |
| LG Gram 14Z90Q | |
| HP EliteBook 845 G9 6F6H6EA | |
| HP EliteBook 840 G9 | |
| Lenovo ThinkPad X1 Carbon G10 Core i7-1265U | |
| iperf3 receive AXE11000 | |
| HP EliteBook 840 G9 | |
| Lenovo ThinkPad X1 Carbon G10 Core i7-1265U | |
| iperf3 transmit AXE11000 | |
| Lenovo ThinkPad X1 Carbon G10 Core i7-1265U | |
| HP EliteBook 840 G9 | |
| iperf3 transmit AXE11000 6GHz | |
| HP EliteBook 845 G9 6F6H6EA | |
| Lenovo ThinkPad X1 Carbon G10 Core i7-1265U | |
| HP EliteBook 840 G9 | |
Webbkamera
Webbkameran med 5 MP är kanske inte lika skarp som webbkameran med 8 MP på de senaste Dragonfly Folio G3men den är ändå betydligt bättre än webbkamerorna med 1 MP eller 2 MP på de flesta andra bärbara datorer. HP ligger långt framme i detta avseende
En slider shutter för webbkameran är standard för ökad integritet medan IR-sensorn för stöd för Hello är valfri.


Tillbehör och garanti
Det finns inga extra tillbehör i förpackningen förutom nätadaptern och pappersarbete. Standardgarantin är tyvärr bara ett år jämfört med tre år för de flesta konkurrerande Dell-modeller på Latitude.
Skärm - Bra färger, långsamma svarstider
HP erbjuder sju olika panelalternativ:
- 250 nits, inget WWAN
- 250 nits, WWAN
- 400 nits, lågt blått ljus, inget WWAN
- 400 nits, lågt blått ljus, WWAN
- 250 nits, pekskärm, inget WWAN
- 1000 nits, lågt blått ljus, Sure View, WWAN
- 250 nits, pekskärm, WWAN
- 1000 nits, lågt blått ljus, Sure View, inget WWAN
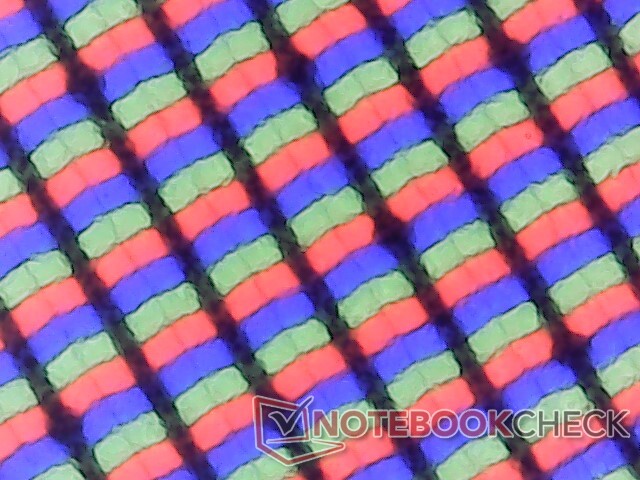
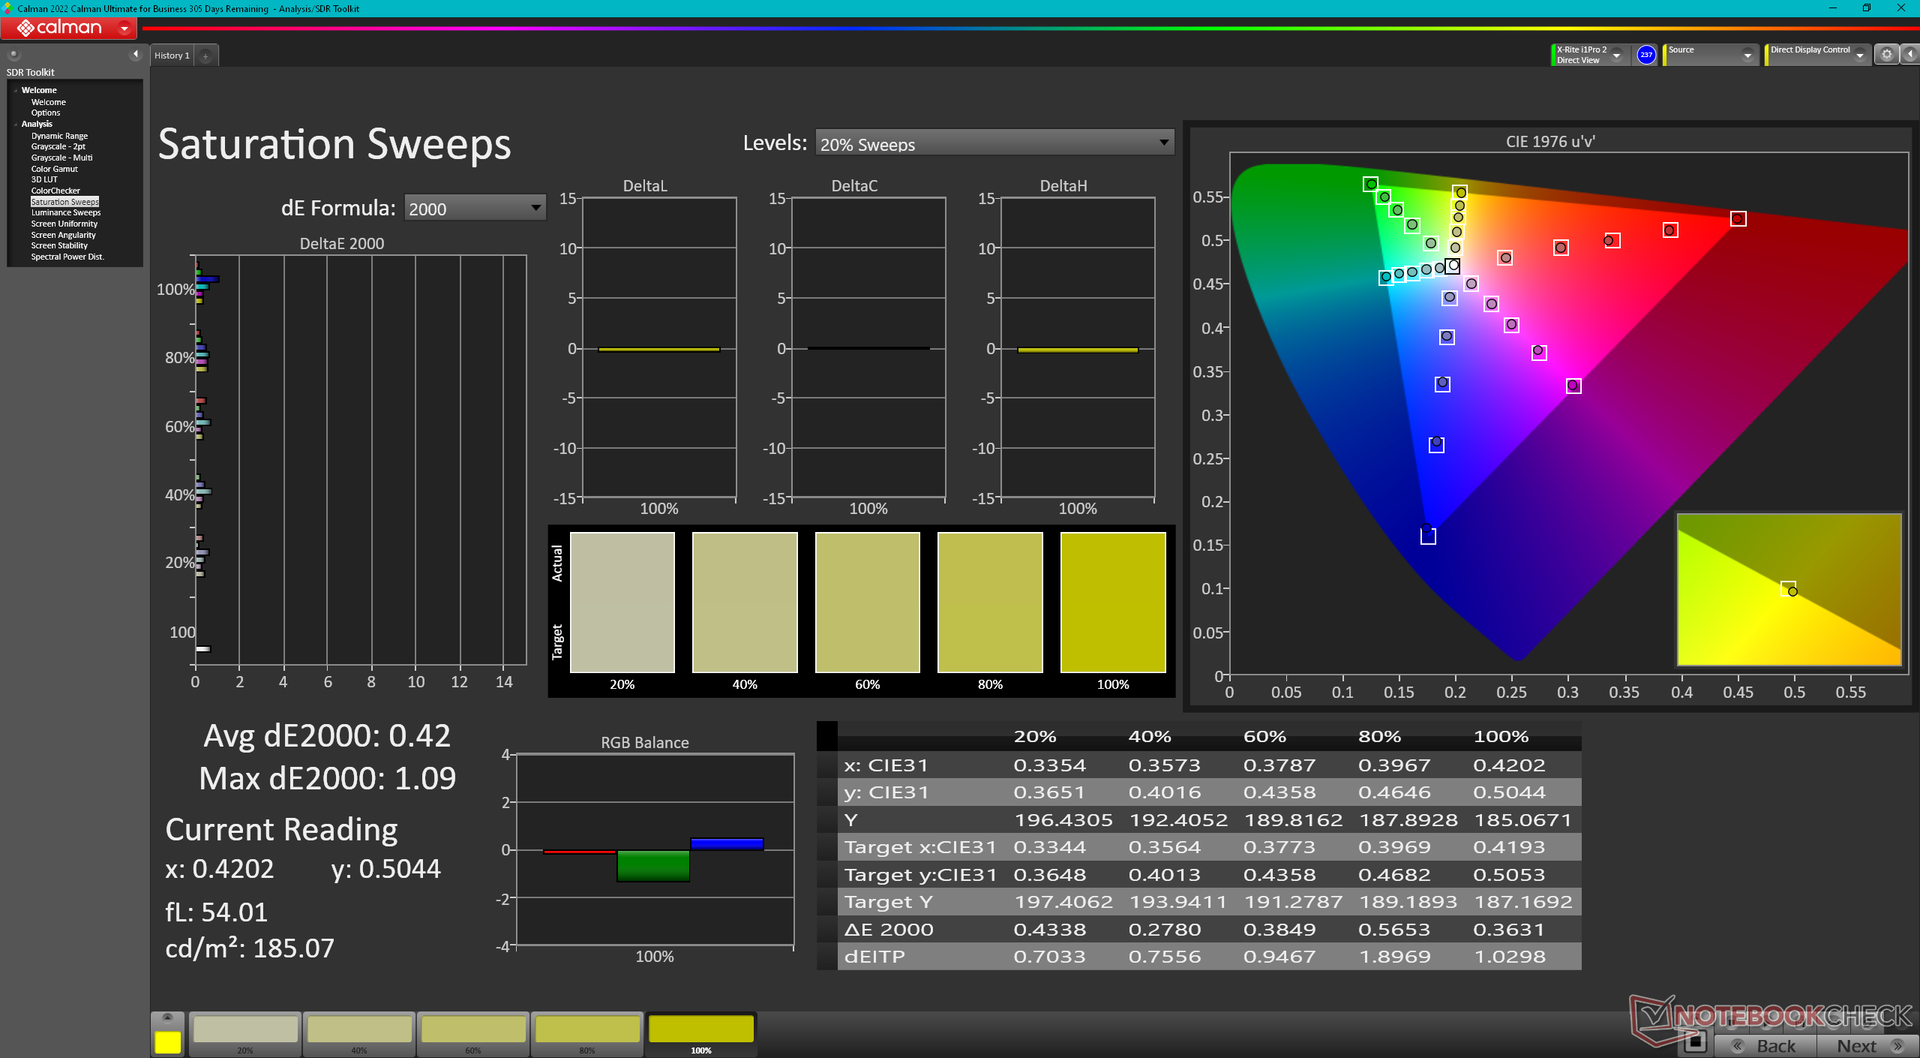
Våra mätningar nedan återspeglar endast det fetstilade alternativet ovan. Det är intressant att notera att alla är 1920 x 1200 matta IPS 60 Hz utan OLED-alternativ. Tyvärr är Sure View knutet till panelalternativet med 1000 nit, vare sig användarna gillar det eller inte
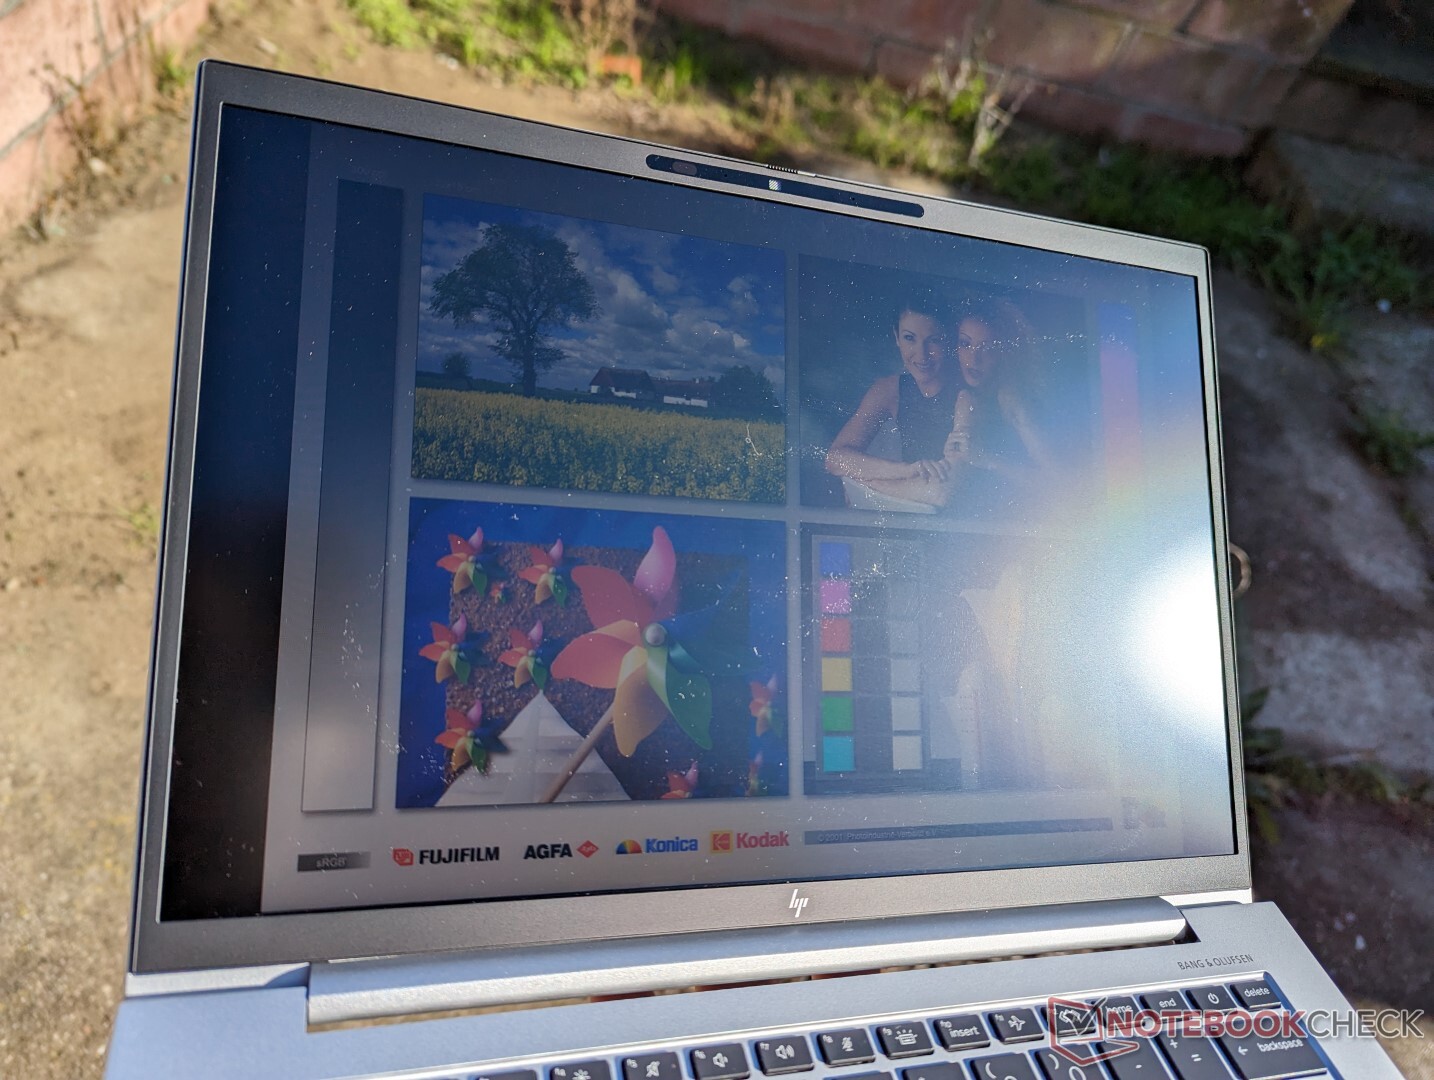
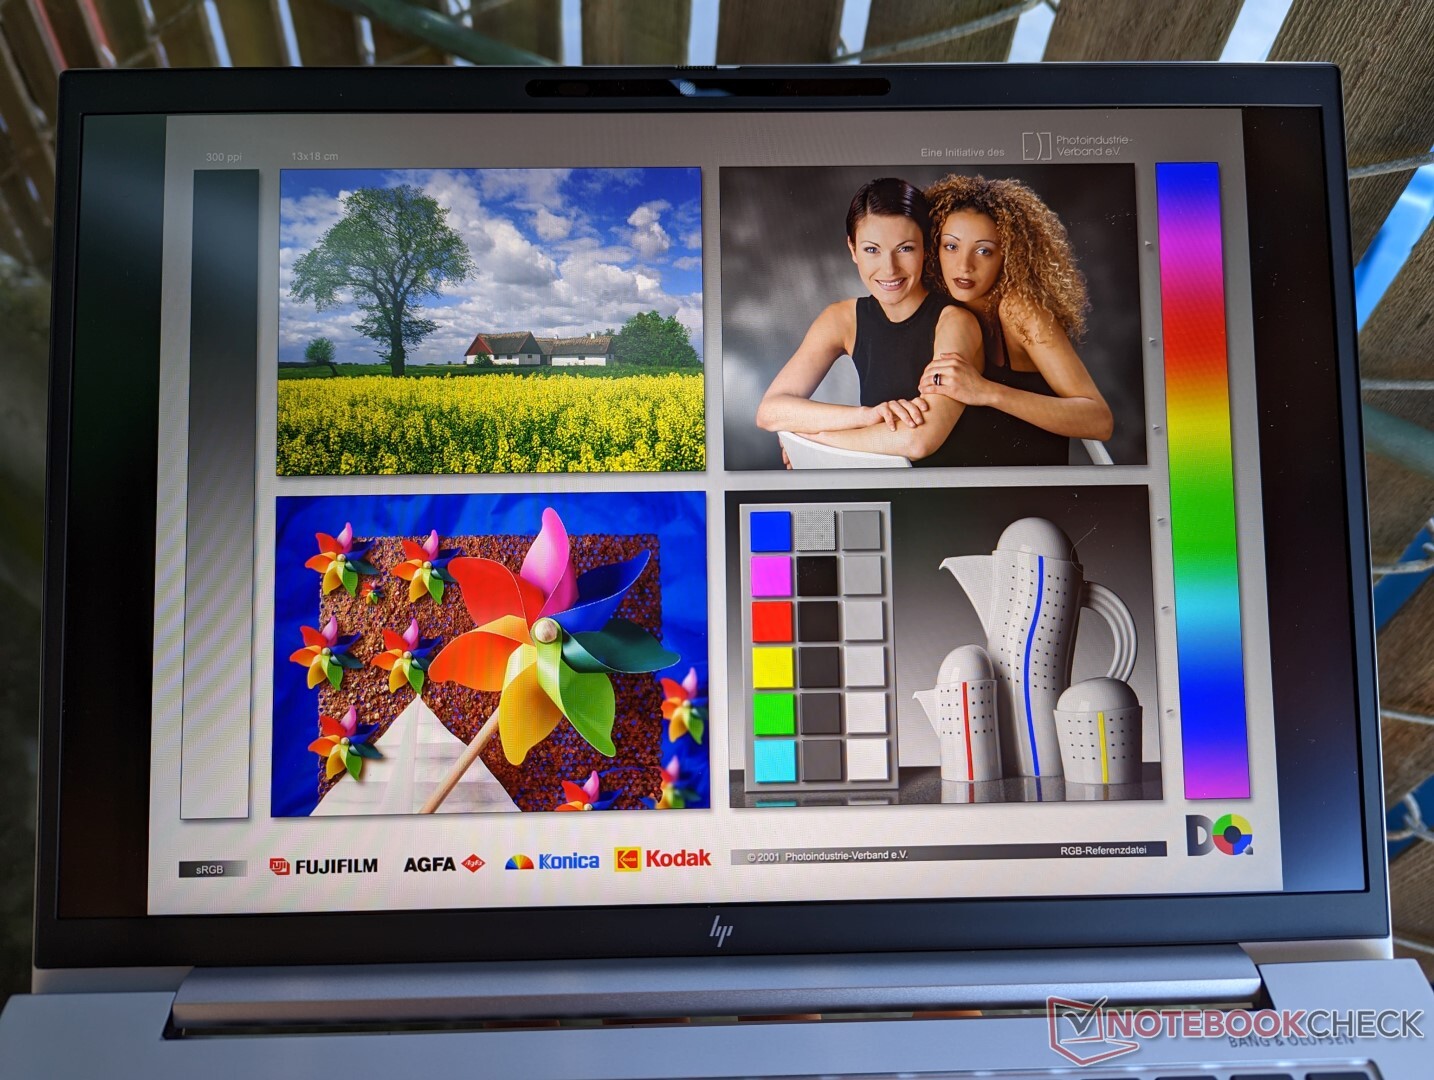
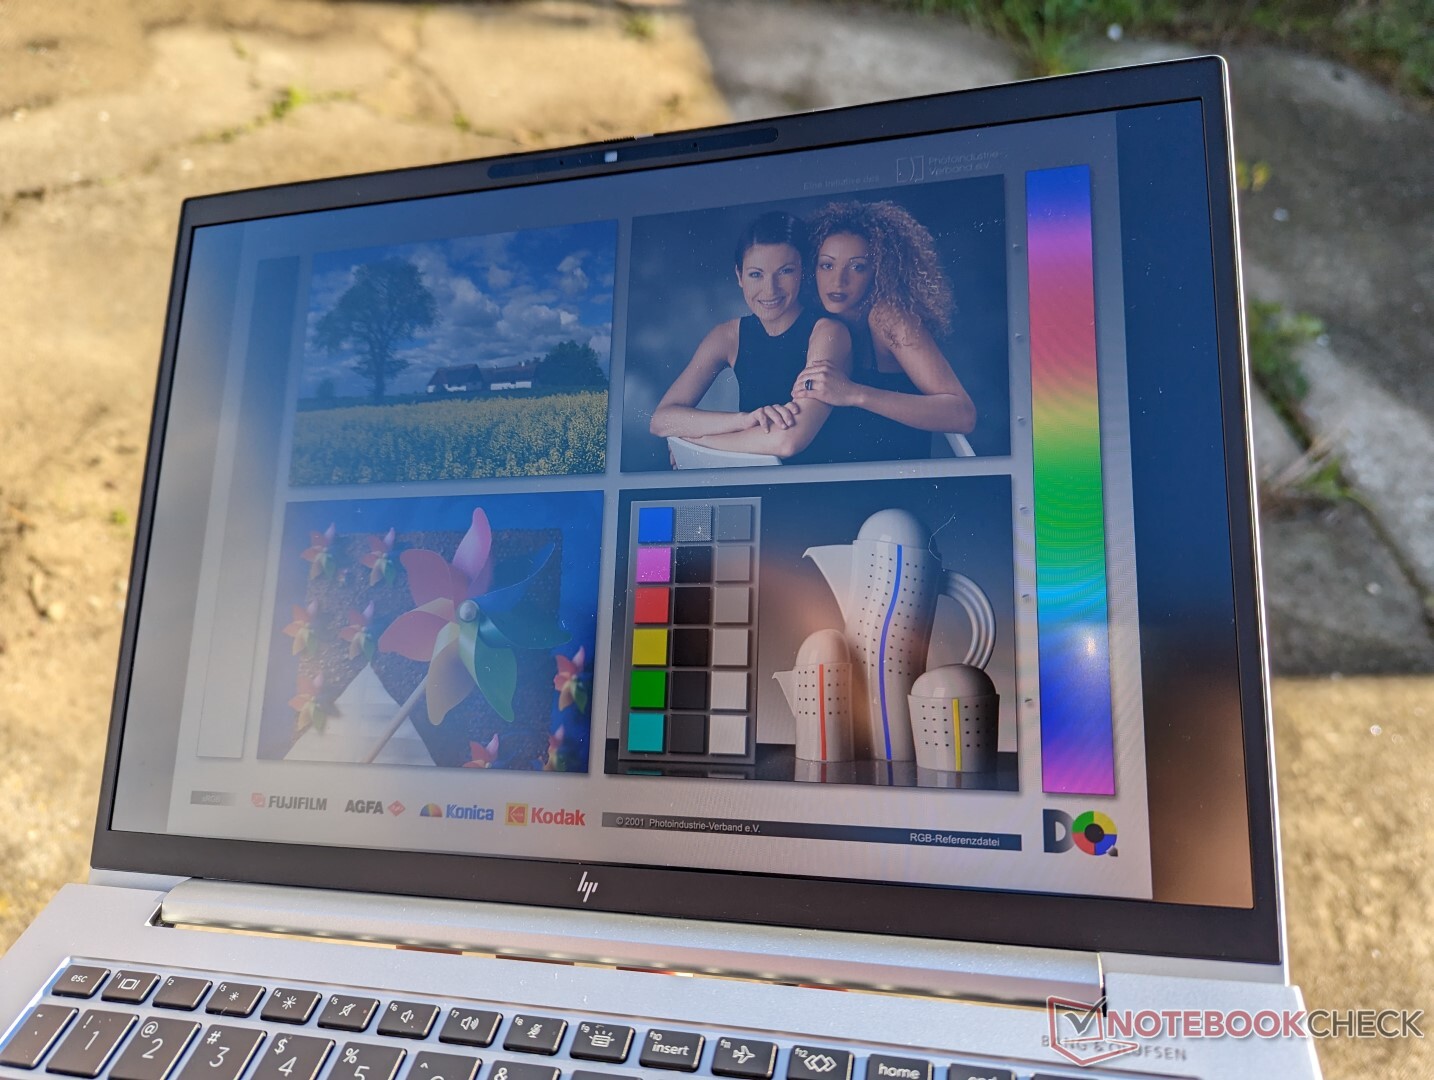
Bortsett från begränsningarna ovan är Chi Mei-panelen på vår enhet en högkvalitativ panel när det gäller färgtäckning och kontrast. Dess största nackdel är de mycket långsamma svarstiderna i svartvitt och grått för märkbar ghosting. Även om de inte är ovanliga på bärbara datorer för kontor eller företag är de här oerhört långsamma till den grad att de distraherar när man surfar på webben eller streamar video.
| |||||||||||||||||||||||||
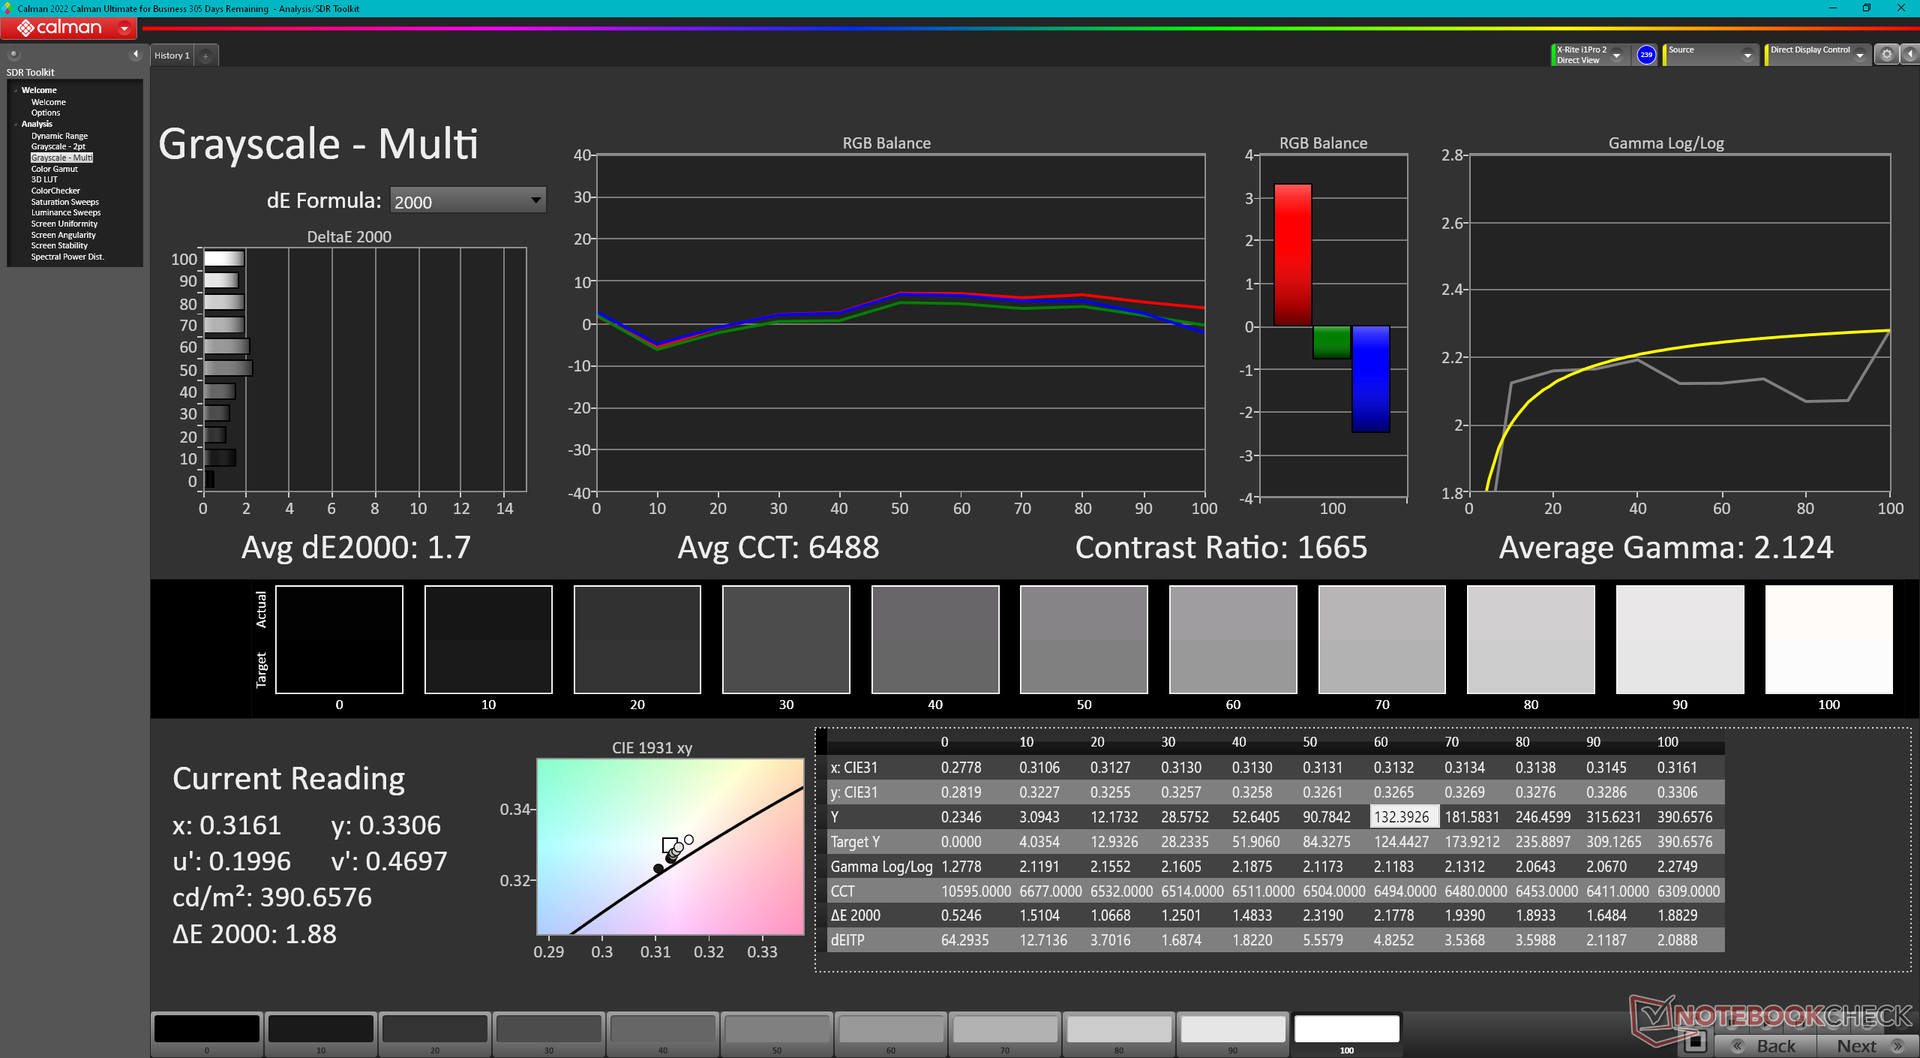
Distribution av ljusstyrkan: 86 %
Mitt på batteriet: 391.3 cd/m²
Kontrast: 1223:1 (Svärta: 0.32 cd/m²)
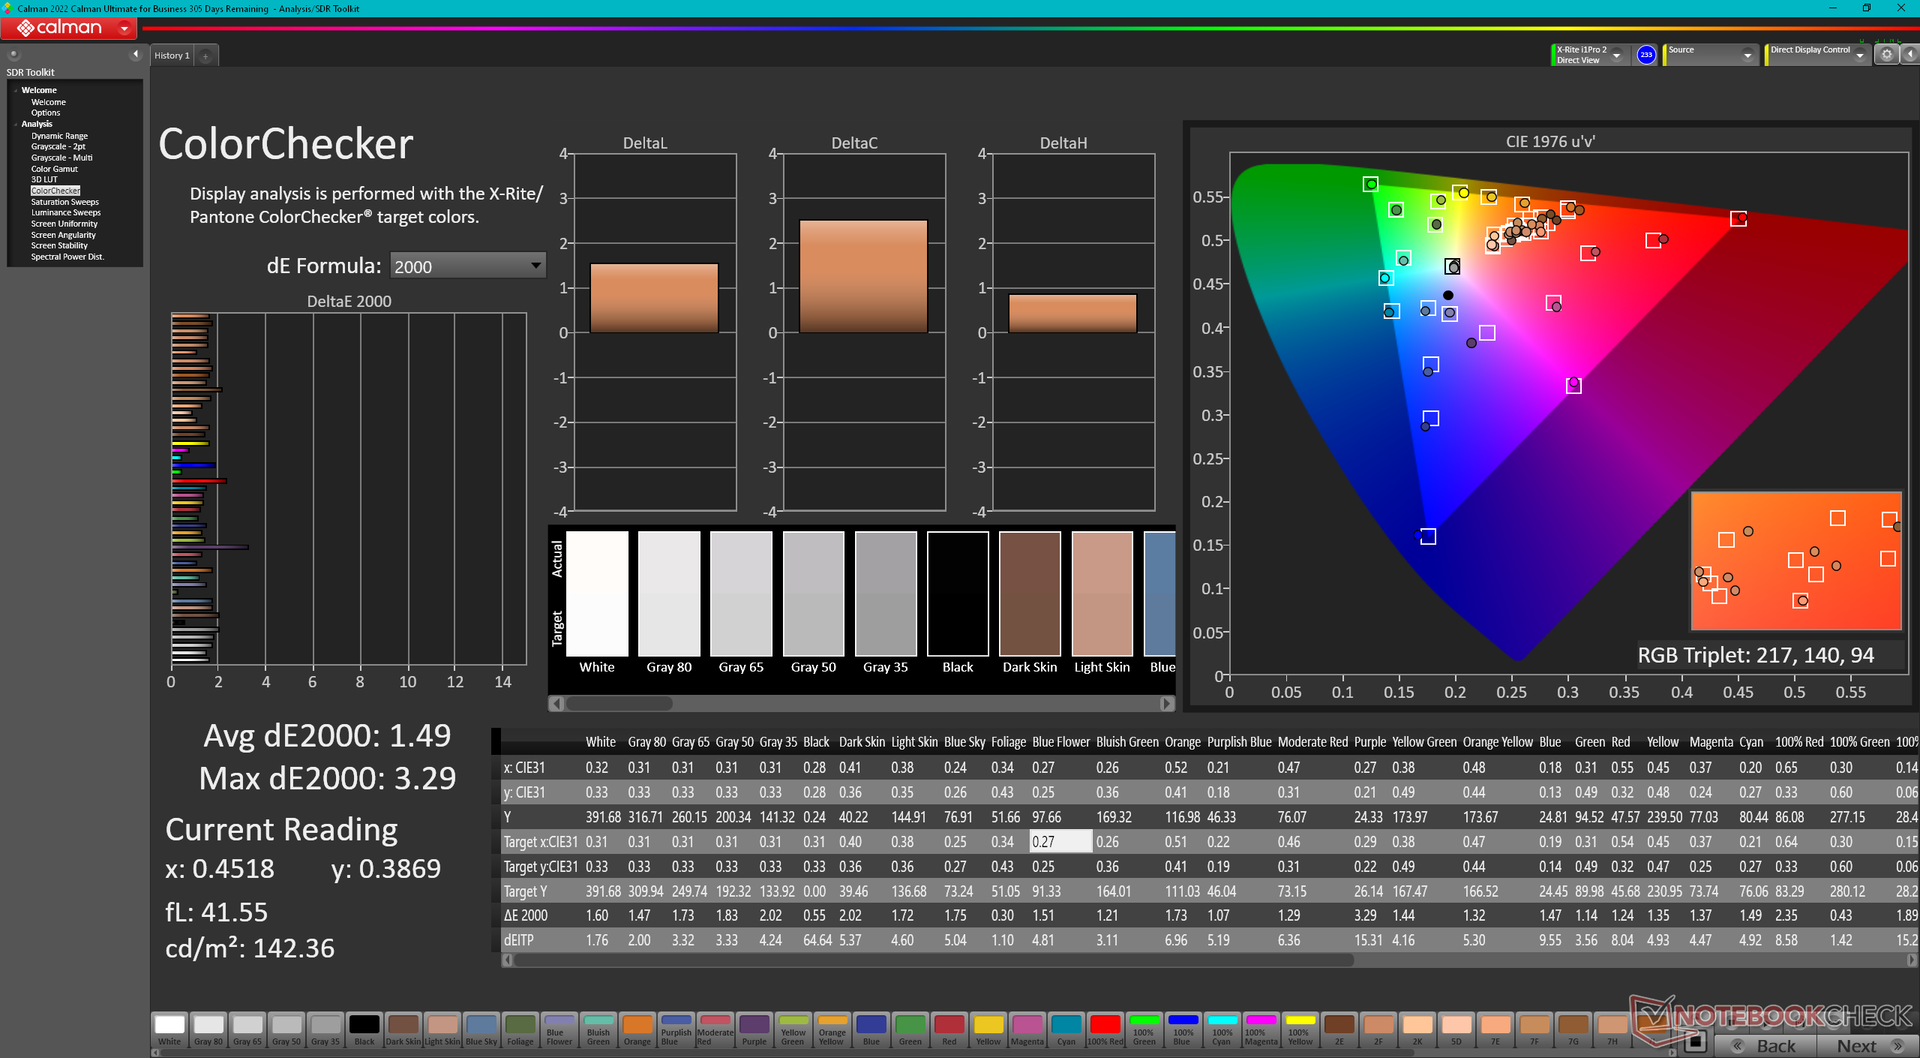
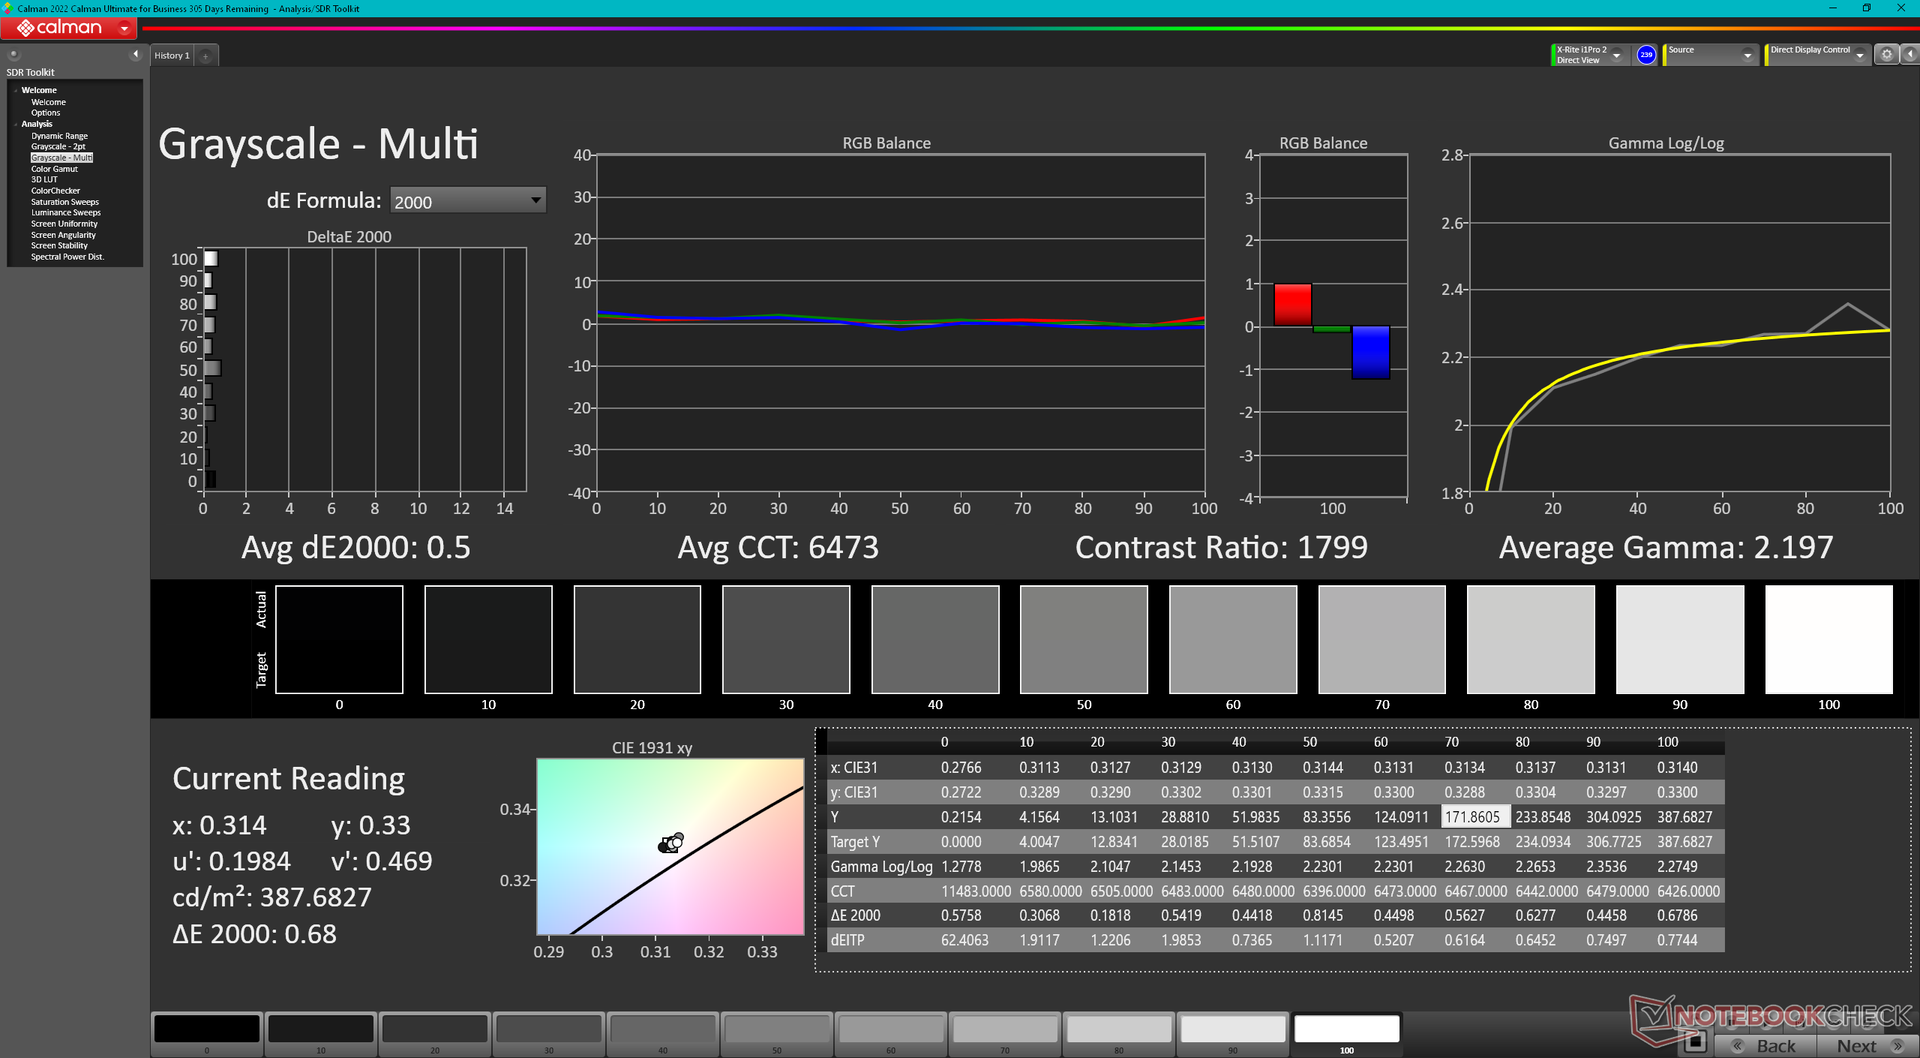
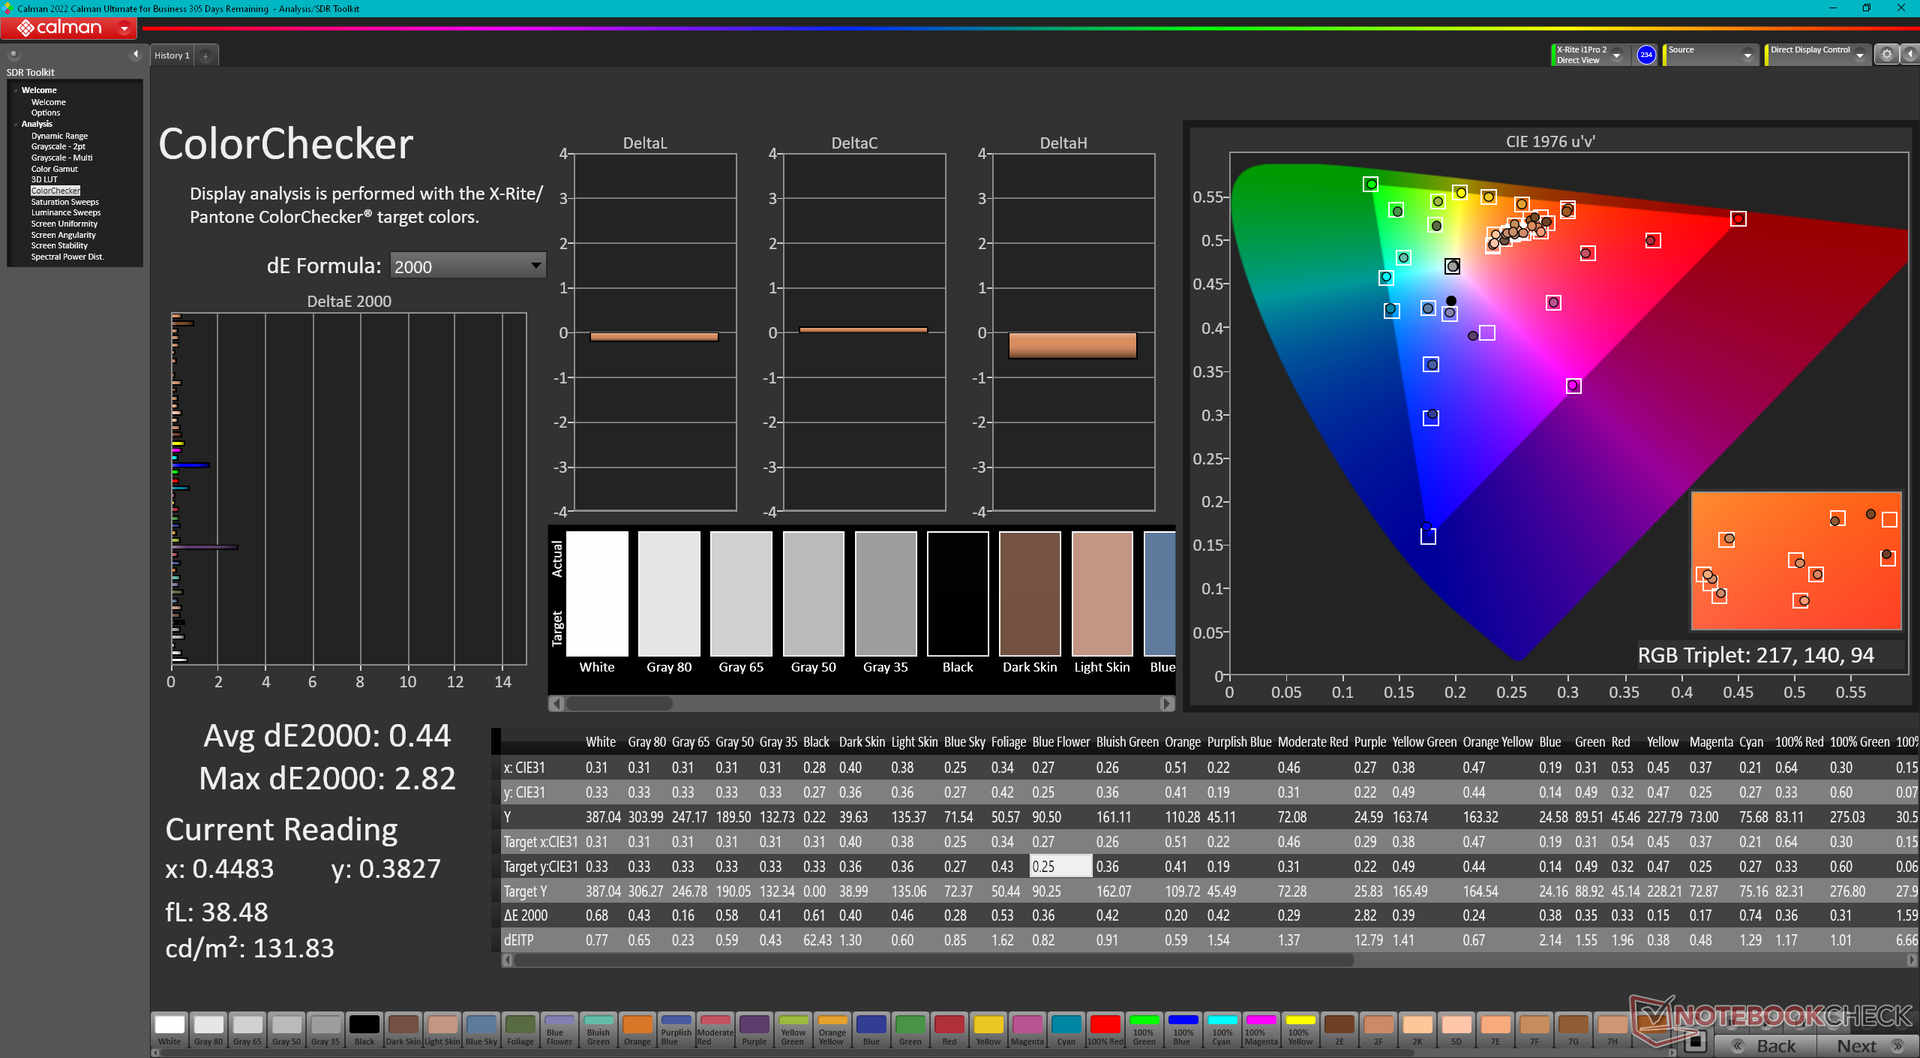
ΔE ColorChecker Calman: 1.49 | ∀{0.5-29.43 Ø4.71}
calibrated: 0.44
ΔE Greyscale Calman: 1.7 | ∀{0.09-98 Ø4.96}
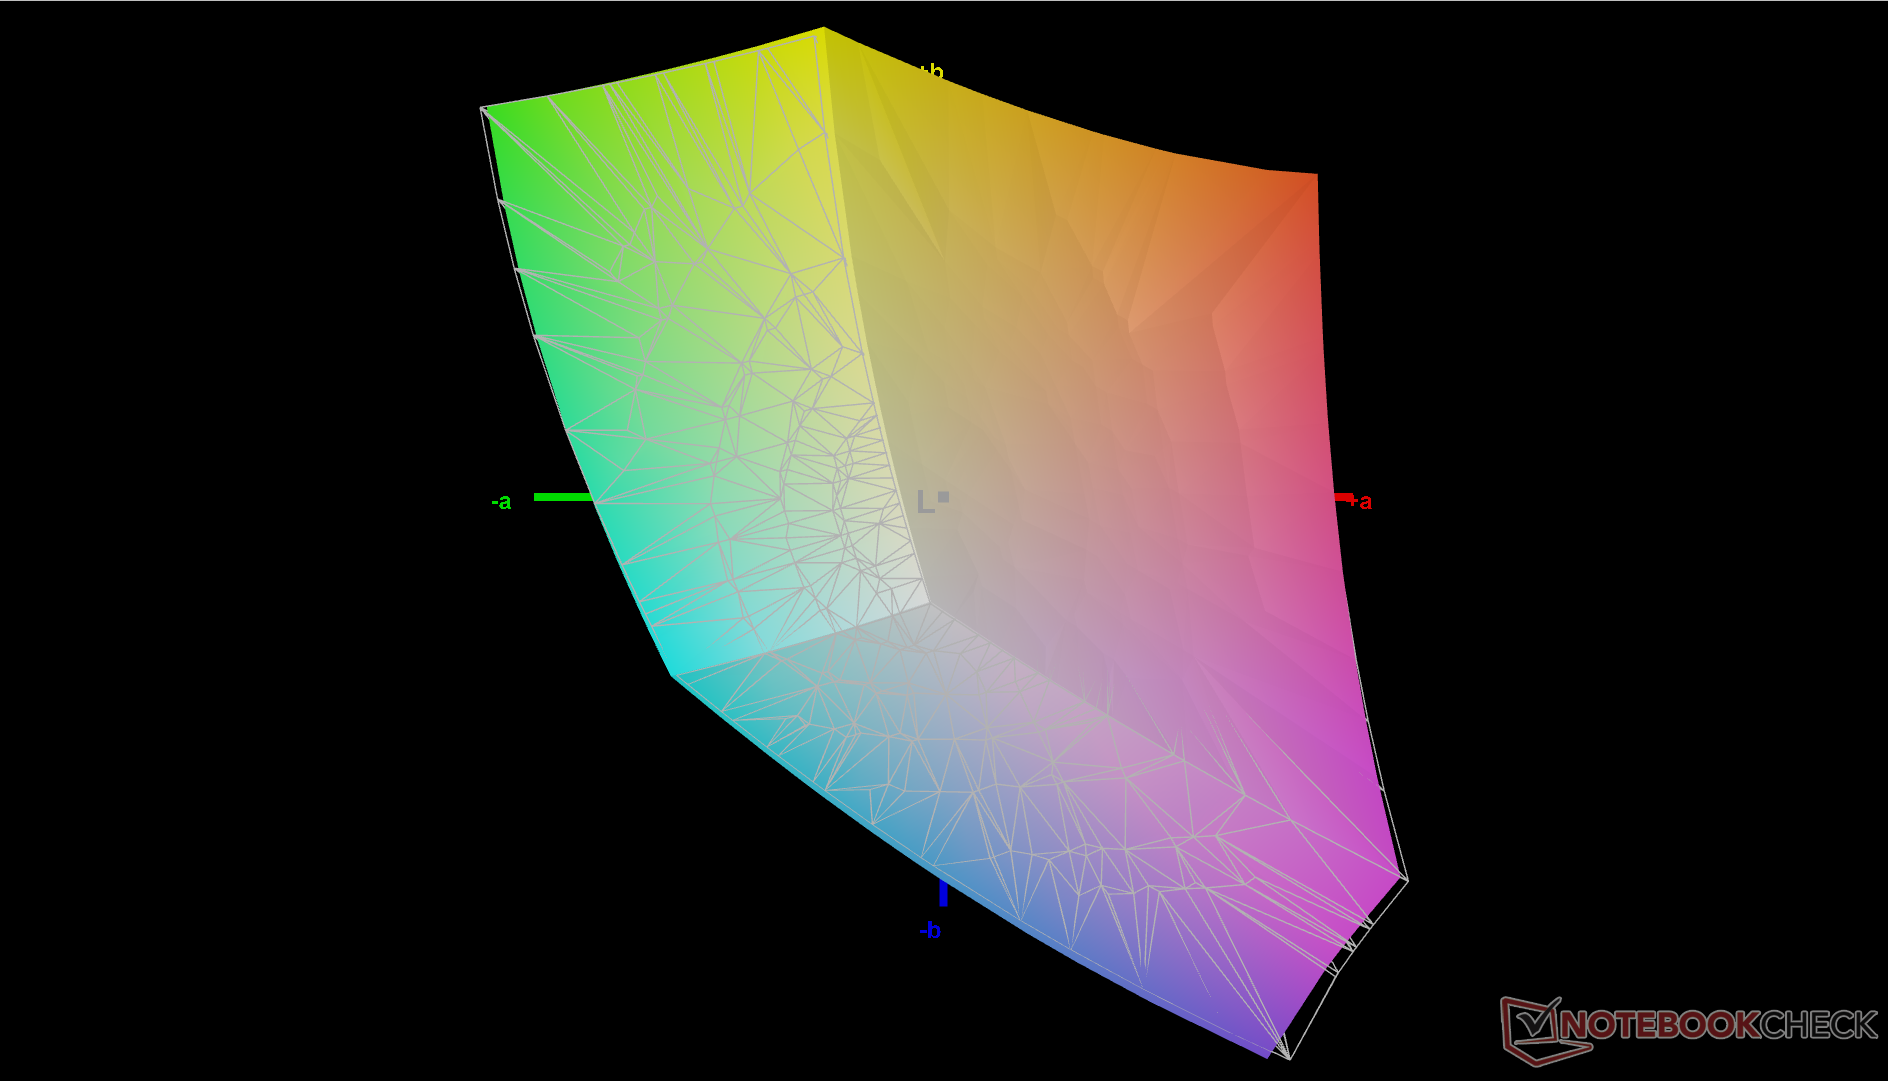
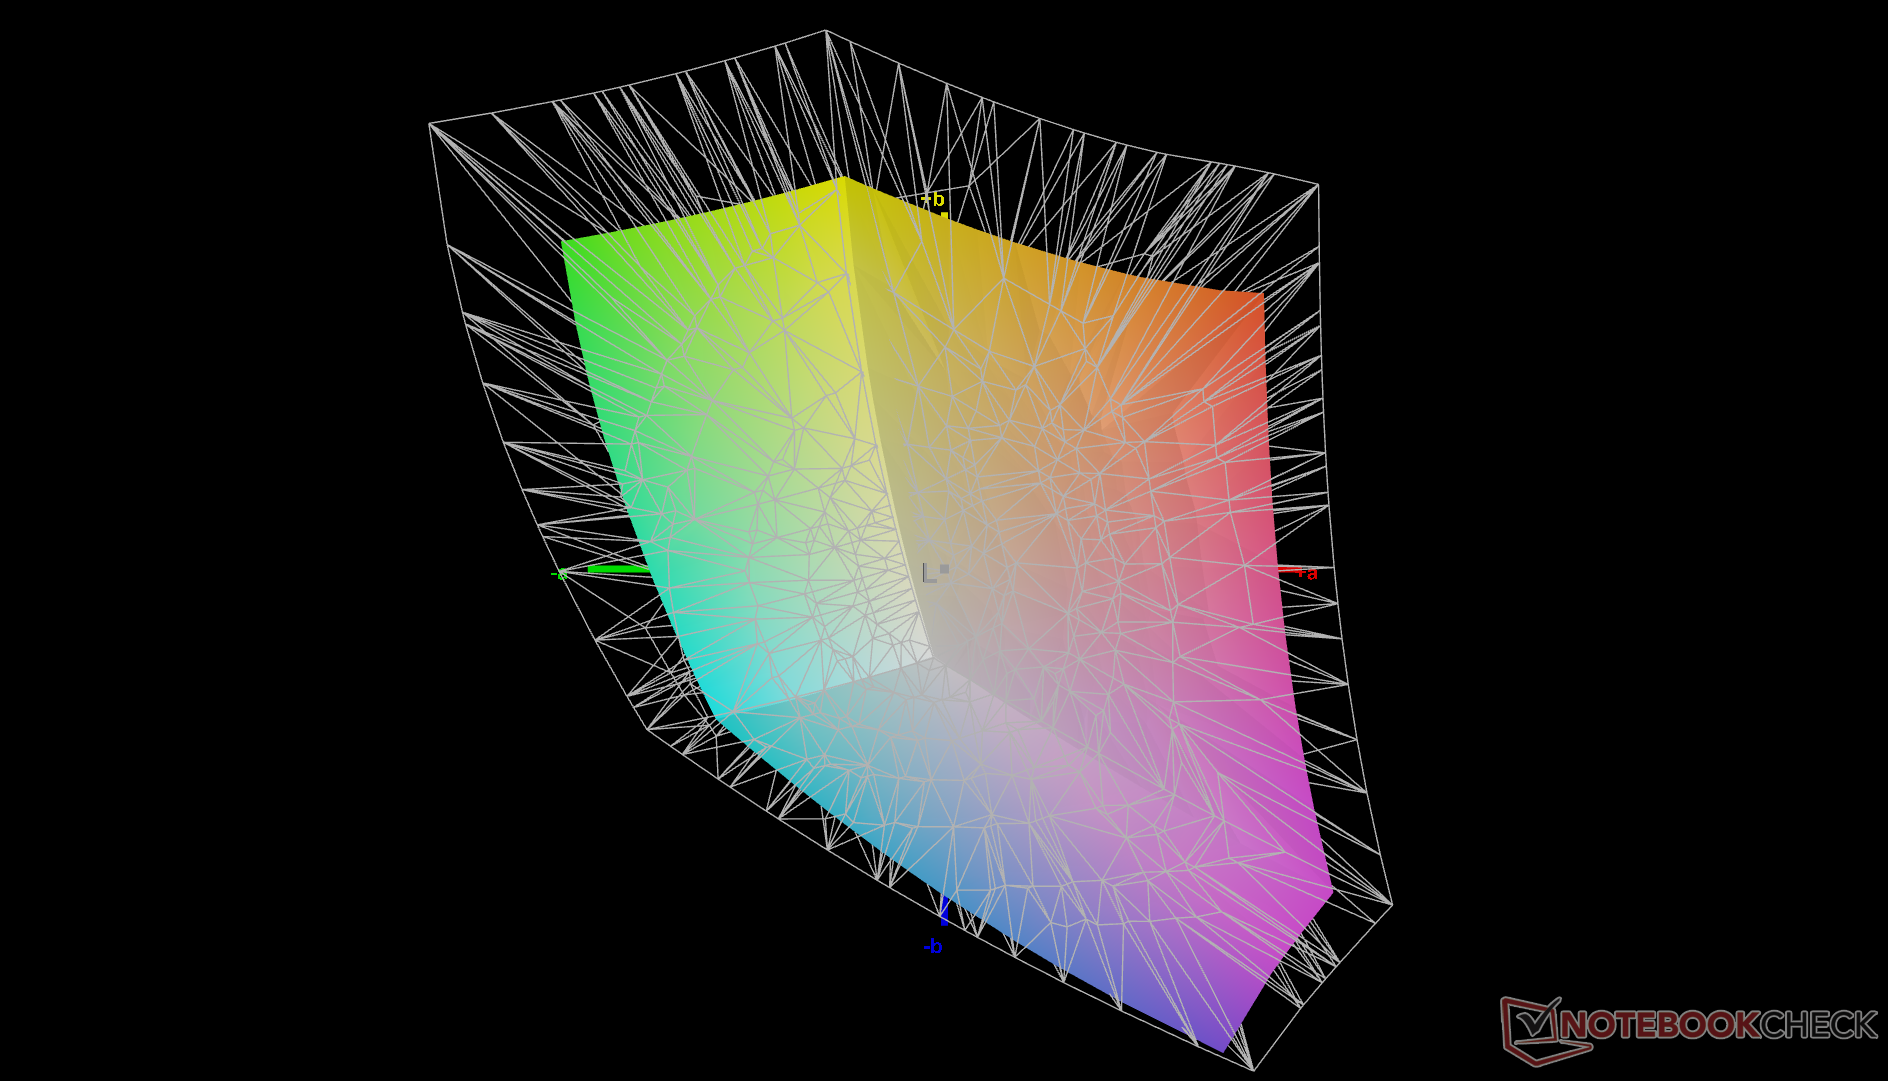
69.7% AdobeRGB 1998 (Argyll 3D)
98.7% sRGB (Argyll 3D)
67.6% Display P3 (Argyll 3D)
Gamma: 2.12
CCT: 6488 K
| HP EliteBook 840 G9 Chi Mei CMN1435, IPS, 1920x1200, 14" | HP EliteBook 845 G9 6F6H6EA InfoVision X140NV4J, IPS, 1920x1200, 14" | HP EliteBook 840 Aero G8 3E4Q6AA AU Optronics AUO068B, IPS, 1920x1080, 14" | Lenovo ThinkPad X1 Carbon G10 Core i7-1265U R140NW4D R0, IPS, 1920x1200, 14" | LG Gram 14Z90Q LG LP140WU1-SPF1, IPS, 1920x1200, 14" | Dell Latitude 7420 JW6MH Chi Mei CMN1416 CHF07 140HCG, IPS, 1920x1080, 14" | |
|---|---|---|---|---|---|---|
| Display | 1% | -0% | 1% | 23% | 0% | |
| Display P3 Coverage (%) | 67.6 | 69 2% | 68 1% | 68.7 2% | 98.4 46% | 68 1% |
| sRGB Coverage (%) | 98.7 | 99 0% | 97.6 -1% | 99.5 1% | 99.9 1% | 99 0% |
| AdobeRGB 1998 Coverage (%) | 69.7 | 70 0% | 69.3 -1% | 70.2 1% | 85.9 23% | 70 0% |
| Response Times | 54% | 33% | 12% | 38% | 31% | |
| Response Time Grey 50% / Grey 80% * (ms) | 66 ? | 31 ? 53% | 48 ? 27% | 55.2 ? 16% | 47.5 ? 28% | 55 ? 17% |
| Response Time Black / White * (ms) | 46.4 ? | 21 ? 55% | 28.8 ? 38% | 43.2 ? 7% | 24.5 ? 47% | 26 ? 44% |
| PWM Frequency (Hz) | ||||||
| Screen | -41% | -69% | -5% | -63% | -6% | |
| Brightness middle (cd/m²) | 391.3 | 678 73% | 466.4 19% | 421.9 8% | 341 -13% | 408 4% |
| Brightness (cd/m²) | 368 | 745 102% | 426 16% | 420 14% | 305 -17% | 378 3% |
| Brightness Distribution (%) | 86 | 69 -20% | 84 -2% | 87 1% | 87 1% | 86 0% |
| Black Level * (cd/m²) | 0.32 | 0.33 -3% | 0.32 -0% | 0.29 9% | 0.26 19% | 0.22 31% |
| Contrast (:1) | 1223 | 2055 68% | 1458 19% | 1455 19% | 1312 7% | 1855 52% |
| Colorchecker dE 2000 * | 1.49 | 3.56 -139% | 2.84 -91% | 1.69 -13% | 3.11 -109% | 1.54 -3% |
| Colorchecker dE 2000 max. * | 3.29 | 7.23 -120% | 4.73 -44% | 3.55 -8% | 8.29 -152% | 2.72 17% |
| Colorchecker dE 2000 calibrated * | 0.44 | 1.05 -139% | 2.27 -416% | 0.5 -14% | 0.83 -89% | 1.08 -145% |
| Greyscale dE 2000 * | 1.7 | 4.93 -190% | 3.7 -118% | 2.8 -65% | 5.3 -212% | 1.95 -15% |
| Gamma | 2.12 104% | 2.63 84% | 2.13 103% | 2.13 103% | 2.037 108% | 2.33 94% |
| CCT | 6488 100% | 7114 91% | 6886 94% | 6442 101% | 7571 86% | 6806 96% |
| Totalt genomsnitt (program/inställningar) | 5% /
-18% | -12% /
-40% | 3% /
-2% | -1% /
-30% | 8% /
0% |
* ... mindre är bättre
Skärmen är redan välkalibrerad från början med genomsnittliga deltaE-värden för gråskala och färg på bara 1,7 respektive 1,49. Att kalibrera panelen själv med en X-Rite-kolorimeter skulle faktiskt förbättra dessa värden ytterligare, vilket visas i skärmdumparna nedan, men detta kommer inte att vara nödvändigt för de flesta användare. Vår kalibrerade ICM-profil finns tillgänglig ovan om ägare vill prova att tillämpa den.

Visa svarstider
| ↔ Svarstid svart till vitt | ||
|---|---|---|
| 46.4 ms ... stiga ↗ och falla ↘ kombinerat | ↗ 24.4 ms stiga | 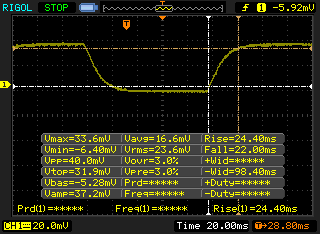 |
| ↘ 22 ms hösten | ||
| Skärmen visar långsamma svarsfrekvenser i våra tester och kommer att vara otillfredsställande för spelare. I jämförelse sträcker sig alla testade enheter från 0.1 (minst) till 240 (maximalt) ms. » 99 % av alla enheter är bättre. Detta innebär att den uppmätta svarstiden är sämre än genomsnittet av alla testade enheter (19.8 ms). | ||
| ↔ Svarstid 50 % grått till 80 % grått | ||
| 66 ms ... stiga ↗ och falla ↘ kombinerat | ↗ 35.2 ms stiga | 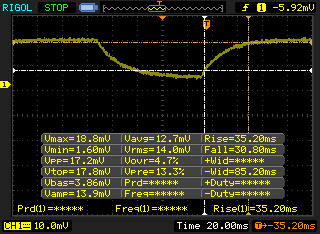 |
| ↘ 30.8 ms hösten | ||
| Skärmen visar långsamma svarsfrekvenser i våra tester och kommer att vara otillfredsställande för spelare. I jämförelse sträcker sig alla testade enheter från 0.165 (minst) till 636 (maximalt) ms. » 98 % av alla enheter är bättre. Detta innebär att den uppmätta svarstiden är sämre än genomsnittet av alla testade enheter (31 ms). | ||
Skärmflimmer / PWM (Puls-Width Modulation)
| Skärmflimmer / PWM upptäcktes inte | 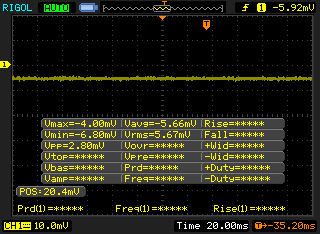 | ||
Som jämförelse: 52 % av alla testade enheter använder inte PWM för att dämpa skärmen. Om PWM upptäcktes mättes ett medelvärde av 7754 (minst: 5 - maximum: 343500) Hz. | |||
Prestanda - Det snabbaste Core i7-alternativet i P-serien
Provningsförhållanden
Vi ställde in vår enhet i läget "Bästa prestanda" via Windows innan vi körde alla benchmarks nedan. Märkligt nog innehåller den förinstallerade appen Power Manager inga ytterligare inställningar för strömförsörjning, till skillnad från vad vi observerade på den senaste Dragonfly Folio G3.
Processor
CPU-prestanda är en blandad kompott på grund av systemets begränsade Turbo Boost-potential. När du kör CineBench R15 xT i en slinga, till exempel, skulle den ursprungliga poängen på 1992 poäng sjunka märkbart till 1458 poäng efter bara en körning, vilket motsvarar en prestandadämpning på 27 procent. Denna nedgång är brantare än på de flesta andra bärbara datorer, inklusive även många modeller i Core U-serien. Som jämförelse kan nämnas attRyzen 9 PRO 6950HS i EliteBook 845 G9 ger stabila resultat under hela stresstestet.
Många andra bärbara datorer med samma Core i7-1280P CPU kan erbjuda snabbare prestanda än vår HP på grund av deras starkare kylningslösningar. Den större MSI Summit E16 Flipkan till exempel erbjuda 25 till 50 procent snabbare prestanda för flera trådar än vår EliteBook 840 G9.
Cinebench R15 Multi Loop
Cinebench R23: Multi Core | Single Core
Cinebench R15: CPU Multi 64Bit | CPU Single 64Bit
Blender: v2.79 BMW27 CPU
7-Zip 18.03: 7z b 4 | 7z b 4 -mmt1
Geekbench 5.5: Multi-Core | Single-Core
HWBOT x265 Benchmark v2.2: 4k Preset
LibreOffice : 20 Documents To PDF
R Benchmark 2.5: Overall mean
* ... mindre är bättre
| Blender - v3.3 Classroom CPU | |
| LG Gram 14Z90Q | |
| Lenovo ThinkPad X1 Carbon G10 Core i7-1265U | |
| Genomsnitt Intel Iris Xe Graphics G7 96EUs (336 - 1259, n=109) | |
| HP EliteBook 840 G9 | |
* ... mindre är bättre
AIDA64: FP32 Ray-Trace | FPU Julia | CPU SHA3 | CPU Queen | FPU SinJulia | FPU Mandel | CPU AES | CPU ZLib | FP64 Ray-Trace | CPU PhotoWorxx
| Performance rating | |
| HP EliteBook 845 G9 6F6H6EA | |
| Genomsnitt Intel Core i7-1280P | |
| HP EliteBook 840 G9 | |
| Lenovo ThinkPad X1 Carbon G10 Core i7-1265U | |
| Dell Latitude 7420 JW6MH | |
| HP EliteBook 840 Aero G8 3E4Q6AA | |
| LG Gram 14Z90Q | |
| AIDA64 / FP32 Ray-Trace | |
| HP EliteBook 845 G9 6F6H6EA | |
| Genomsnitt Intel Core i7-1280P (7466 - 13068, n=6) | |
| HP EliteBook 840 G9 | |
| Lenovo ThinkPad X1 Carbon G10 Core i7-1265U | |
| Dell Latitude 7420 JW6MH | |
| HP EliteBook 840 Aero G8 3E4Q6AA | |
| LG Gram 14Z90Q | |
| AIDA64 / FPU Julia | |
| HP EliteBook 845 G9 6F6H6EA | |
| Genomsnitt Intel Core i7-1280P (38904 - 66081, n=6) | |
| HP EliteBook 840 G9 | |
| Lenovo ThinkPad X1 Carbon G10 Core i7-1265U | |
| Dell Latitude 7420 JW6MH | |
| HP EliteBook 840 Aero G8 3E4Q6AA | |
| LG Gram 14Z90Q | |
| AIDA64 / CPU SHA3 | |
| HP EliteBook 845 G9 6F6H6EA | |
| Genomsnitt Intel Core i7-1280P (1826 - 2992, n=6) | |
| HP EliteBook 840 G9 | |
| Dell Latitude 7420 JW6MH | |
| Lenovo ThinkPad X1 Carbon G10 Core i7-1265U | |
| HP EliteBook 840 Aero G8 3E4Q6AA | |
| LG Gram 14Z90Q | |
| AIDA64 / CPU Queen | |
| HP EliteBook 845 G9 6F6H6EA | |
| HP EliteBook 840 G9 | |
| Genomsnitt Intel Core i7-1280P (80180 - 100358, n=6) | |
| LG Gram 14Z90Q | |
| Lenovo ThinkPad X1 Carbon G10 Core i7-1265U | |
| HP EliteBook 840 Aero G8 3E4Q6AA | |
| Dell Latitude 7420 JW6MH | |
| AIDA64 / FPU SinJulia | |
| HP EliteBook 845 G9 6F6H6EA | |
| Genomsnitt Intel Core i7-1280P (5880 - 8571, n=6) | |
| HP EliteBook 840 G9 | |
| Dell Latitude 7420 JW6MH | |
| Lenovo ThinkPad X1 Carbon G10 Core i7-1265U | |
| HP EliteBook 840 Aero G8 3E4Q6AA | |
| LG Gram 14Z90Q | |
| AIDA64 / FPU Mandel | |
| HP EliteBook 845 G9 6F6H6EA | |
| Genomsnitt Intel Core i7-1280P (18907 - 32766, n=6) | |
| HP EliteBook 840 G9 | |
| Dell Latitude 7420 JW6MH | |
| Lenovo ThinkPad X1 Carbon G10 Core i7-1265U | |
| HP EliteBook 840 Aero G8 3E4Q6AA | |
| LG Gram 14Z90Q | |
| AIDA64 / CPU AES | |
| Dell Latitude 7420 JW6MH | |
| HP EliteBook 840 Aero G8 3E4Q6AA | |
| Genomsnitt Intel Core i7-1280P (40691 - 99367, n=6) | |
| HP EliteBook 845 G9 6F6H6EA | |
| HP EliteBook 840 G9 | |
| Lenovo ThinkPad X1 Carbon G10 Core i7-1265U | |
| LG Gram 14Z90Q | |
| AIDA64 / CPU ZLib | |
| HP EliteBook 845 G9 6F6H6EA | |
| Genomsnitt Intel Core i7-1280P (540 - 880, n=6) | |
| HP EliteBook 840 G9 | |
| Lenovo ThinkPad X1 Carbon G10 Core i7-1265U | |
| Dell Latitude 7420 JW6MH | |
| HP EliteBook 840 Aero G8 3E4Q6AA | |
| LG Gram 14Z90Q | |
| AIDA64 / FP64 Ray-Trace | |
| HP EliteBook 845 G9 6F6H6EA | |
| Genomsnitt Intel Core i7-1280P (4006 - 7184, n=6) | |
| HP EliteBook 840 G9 | |
| Lenovo ThinkPad X1 Carbon G10 Core i7-1265U | |
| Dell Latitude 7420 JW6MH | |
| HP EliteBook 840 Aero G8 3E4Q6AA | |
| LG Gram 14Z90Q | |
| AIDA64 / CPU PhotoWorxx | |
| Genomsnitt Intel Core i7-1280P (36663 - 48416, n=6) | |
| Lenovo ThinkPad X1 Carbon G10 Core i7-1265U | |
| HP EliteBook 840 G9 | |
| Dell Latitude 7420 JW6MH | |
| HP EliteBook 840 Aero G8 3E4Q6AA | |
| LG Gram 14Z90Q | |
| HP EliteBook 845 G9 6F6H6EA | |
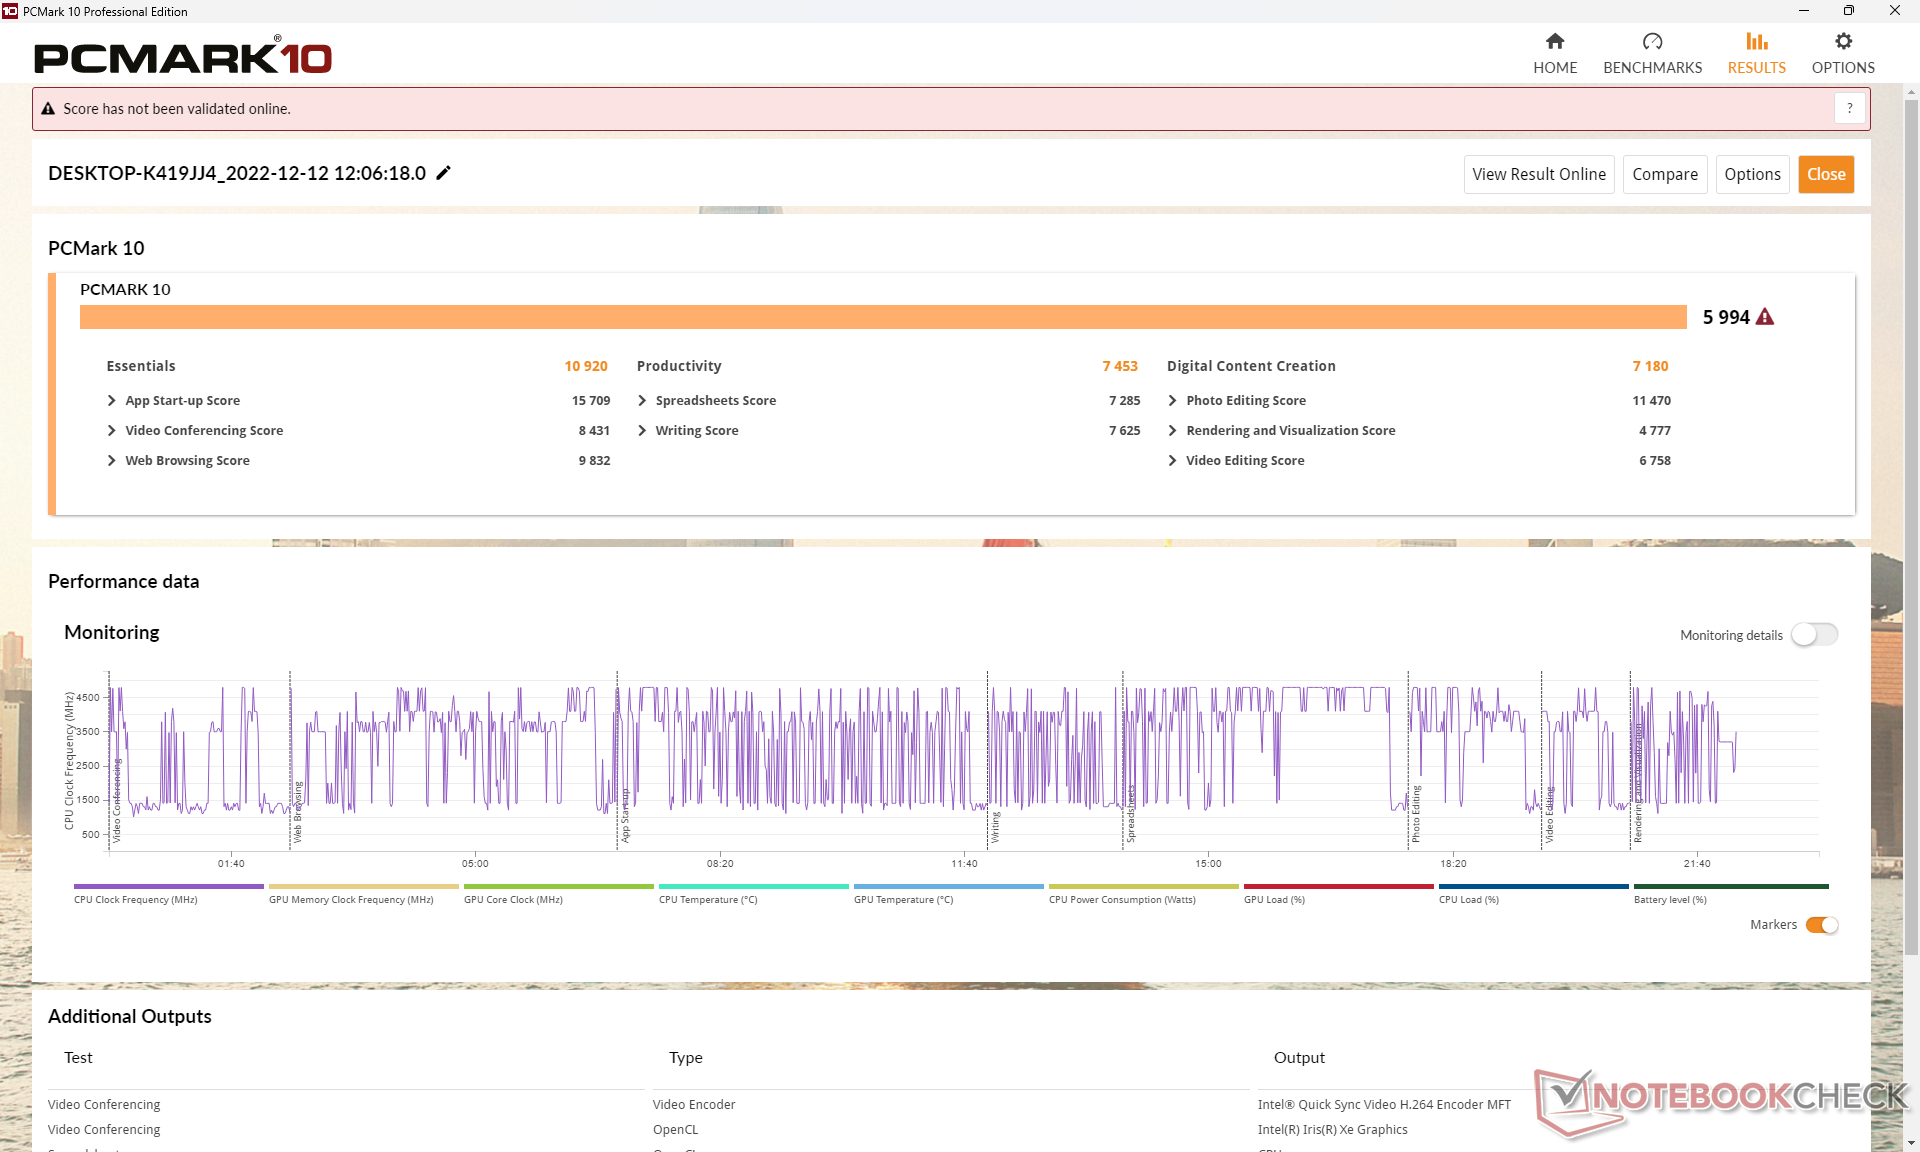
Systemets prestanda
PCMark-resultaten är jämförbara med AMD-versionen utom i undertestet Produktivitet, vilket sannolikt beror på att Ryzen 9 PRO 6950HS har snabbare rå prestanda för flera trådar, vilket framgår av benchmarks ovan.
CrossMark: Overall | Productivity | Creativity | Responsiveness
| PCMark 10 / Score | |
| HP EliteBook 840 G9 | |
| HP EliteBook 845 G9 6F6H6EA | |
| Genomsnitt Intel Core i7-1280P, Intel Iris Xe Graphics G7 96EUs (5410 - 5994, n=4) | |
| Lenovo ThinkPad X1 Carbon G10 Core i7-1265U | |
| LG Gram 14Z90Q | |
| Dell Latitude 7420 JW6MH | |
| HP EliteBook 840 Aero G8 3E4Q6AA | |
| PCMark 10 / Essentials | |
| HP EliteBook 840 G9 | |
| Lenovo ThinkPad X1 Carbon G10 Core i7-1265U | |
| Genomsnitt Intel Core i7-1280P, Intel Iris Xe Graphics G7 96EUs (9719 - 10920, n=4) | |
| Dell Latitude 7420 JW6MH | |
| LG Gram 14Z90Q | |
| HP EliteBook 840 Aero G8 3E4Q6AA | |
| HP EliteBook 845 G9 6F6H6EA | |
| PCMark 10 / Productivity | |
| HP EliteBook 845 G9 6F6H6EA | |
| HP EliteBook 840 G9 | |
| Lenovo ThinkPad X1 Carbon G10 Core i7-1265U | |
| Genomsnitt Intel Core i7-1280P, Intel Iris Xe Graphics G7 96EUs (6301 - 7453, n=4) | |
| HP EliteBook 840 Aero G8 3E4Q6AA | |
| Dell Latitude 7420 JW6MH | |
| LG Gram 14Z90Q | |
| PCMark 10 / Digital Content Creation | |
| HP EliteBook 845 G9 6F6H6EA | |
| HP EliteBook 840 G9 | |
| Genomsnitt Intel Core i7-1280P, Intel Iris Xe Graphics G7 96EUs (6450 - 7180, n=4) | |
| Lenovo ThinkPad X1 Carbon G10 Core i7-1265U | |
| LG Gram 14Z90Q | |
| Dell Latitude 7420 JW6MH | |
| HP EliteBook 840 Aero G8 3E4Q6AA | |
| CrossMark / Overall | |
| HP EliteBook 840 G9 | |
| Genomsnitt Intel Core i7-1280P, Intel Iris Xe Graphics G7 96EUs (1677 - 1773, n=4) | |
| Lenovo ThinkPad X1 Carbon G10 Core i7-1265U | |
| HP EliteBook 845 G9 6F6H6EA | |
| Dell Latitude 7420 JW6MH | |
| CrossMark / Productivity | |
| HP EliteBook 840 G9 | |
| Genomsnitt Intel Core i7-1280P, Intel Iris Xe Graphics G7 96EUs (1585 - 1709, n=4) | |
| Lenovo ThinkPad X1 Carbon G10 Core i7-1265U | |
| HP EliteBook 845 G9 6F6H6EA | |
| Dell Latitude 7420 JW6MH | |
| CrossMark / Creativity | |
| Genomsnitt Intel Core i7-1280P, Intel Iris Xe Graphics G7 96EUs (1849 - 1928, n=4) | |
| HP EliteBook 840 G9 | |
| Lenovo ThinkPad X1 Carbon G10 Core i7-1265U | |
| HP EliteBook 845 G9 6F6H6EA | |
| Dell Latitude 7420 JW6MH | |
| CrossMark / Responsiveness | |
| HP EliteBook 840 G9 | |
| Genomsnitt Intel Core i7-1280P, Intel Iris Xe Graphics G7 96EUs (1394 - 1746, n=4) | |
| Lenovo ThinkPad X1 Carbon G10 Core i7-1265U | |
| Dell Latitude 7420 JW6MH | |
| HP EliteBook 845 G9 6F6H6EA | |
| PCMark 10 Score | 5994 poäng | |
Hjälp | ||
| AIDA64 / Memory Copy | |
| Genomsnitt Intel Core i7-1280P (56337 - 73486, n=6) | |
| Lenovo ThinkPad X1 Carbon G10 Core i7-1265U | |
| Dell Latitude 7420 JW6MH | |
| HP EliteBook 840 G9 | |
| LG Gram 14Z90Q | |
| HP EliteBook 840 Aero G8 3E4Q6AA | |
| HP EliteBook 845 G9 6F6H6EA | |
| AIDA64 / Memory Read | |
| LG Gram 14Z90Q | |
| Lenovo ThinkPad X1 Carbon G10 Core i7-1265U | |
| Genomsnitt Intel Core i7-1280P (63221 - 73719, n=6) | |
| HP EliteBook 840 G9 | |
| Dell Latitude 7420 JW6MH | |
| HP EliteBook 840 Aero G8 3E4Q6AA | |
| HP EliteBook 845 G9 6F6H6EA | |
| AIDA64 / Memory Write | |
| Genomsnitt Intel Core i7-1280P (58729 - 68247, n=6) | |
| Lenovo ThinkPad X1 Carbon G10 Core i7-1265U | |
| LG Gram 14Z90Q | |
| HP EliteBook 840 G9 | |
| Dell Latitude 7420 JW6MH | |
| HP EliteBook 840 Aero G8 3E4Q6AA | |
| HP EliteBook 845 G9 6F6H6EA | |
| AIDA64 / Memory Latency | |
| LG Gram 14Z90Q | |
| Genomsnitt Intel Core i7-1280P (93.1 - 153.3, n=6) | |
| HP EliteBook 845 G9 6F6H6EA | |
| Dell Latitude 7420 JW6MH | |
| HP EliteBook 840 G9 | |
| Lenovo ThinkPad X1 Carbon G10 Core i7-1265U | |
| HP EliteBook 840 Aero G8 3E4Q6AA | |
* ... mindre är bättre
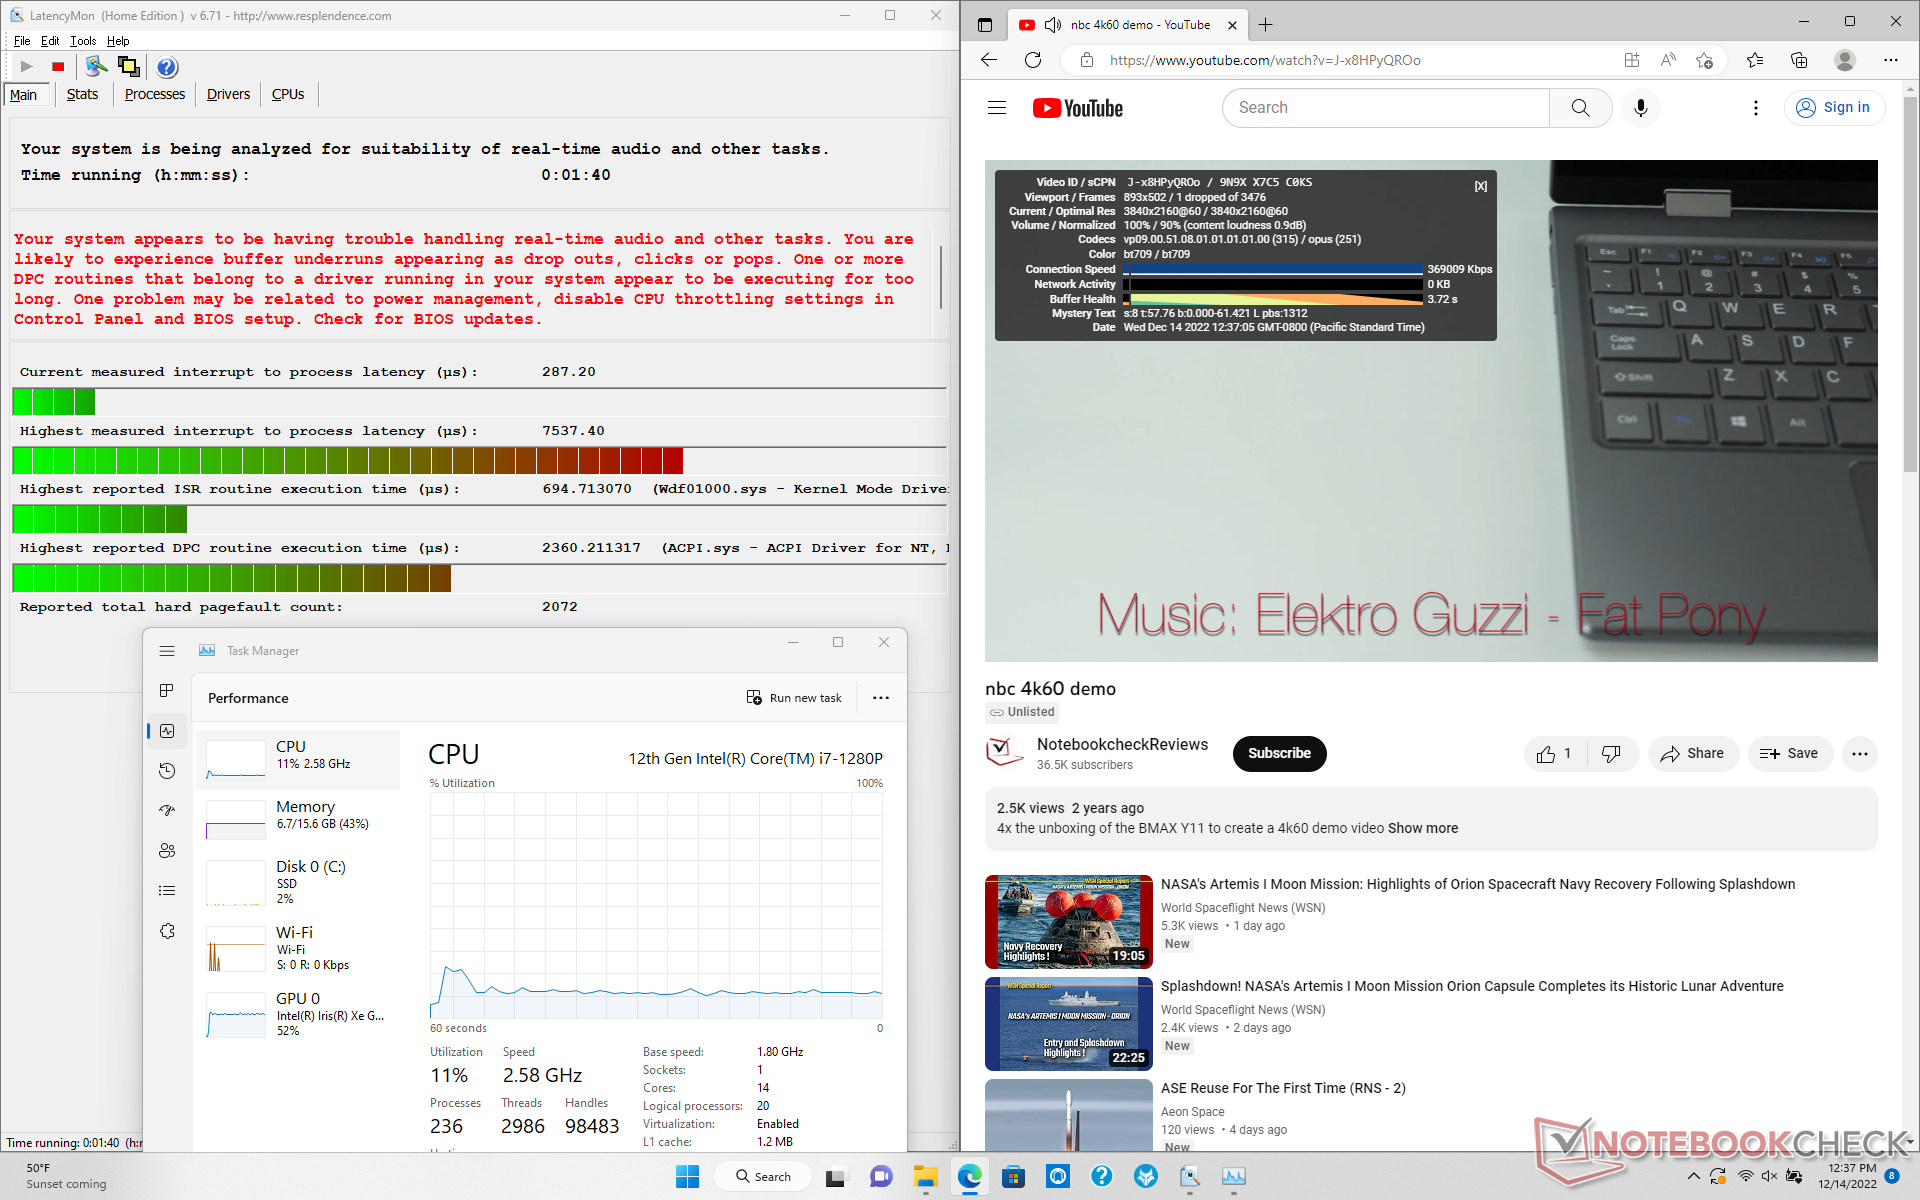
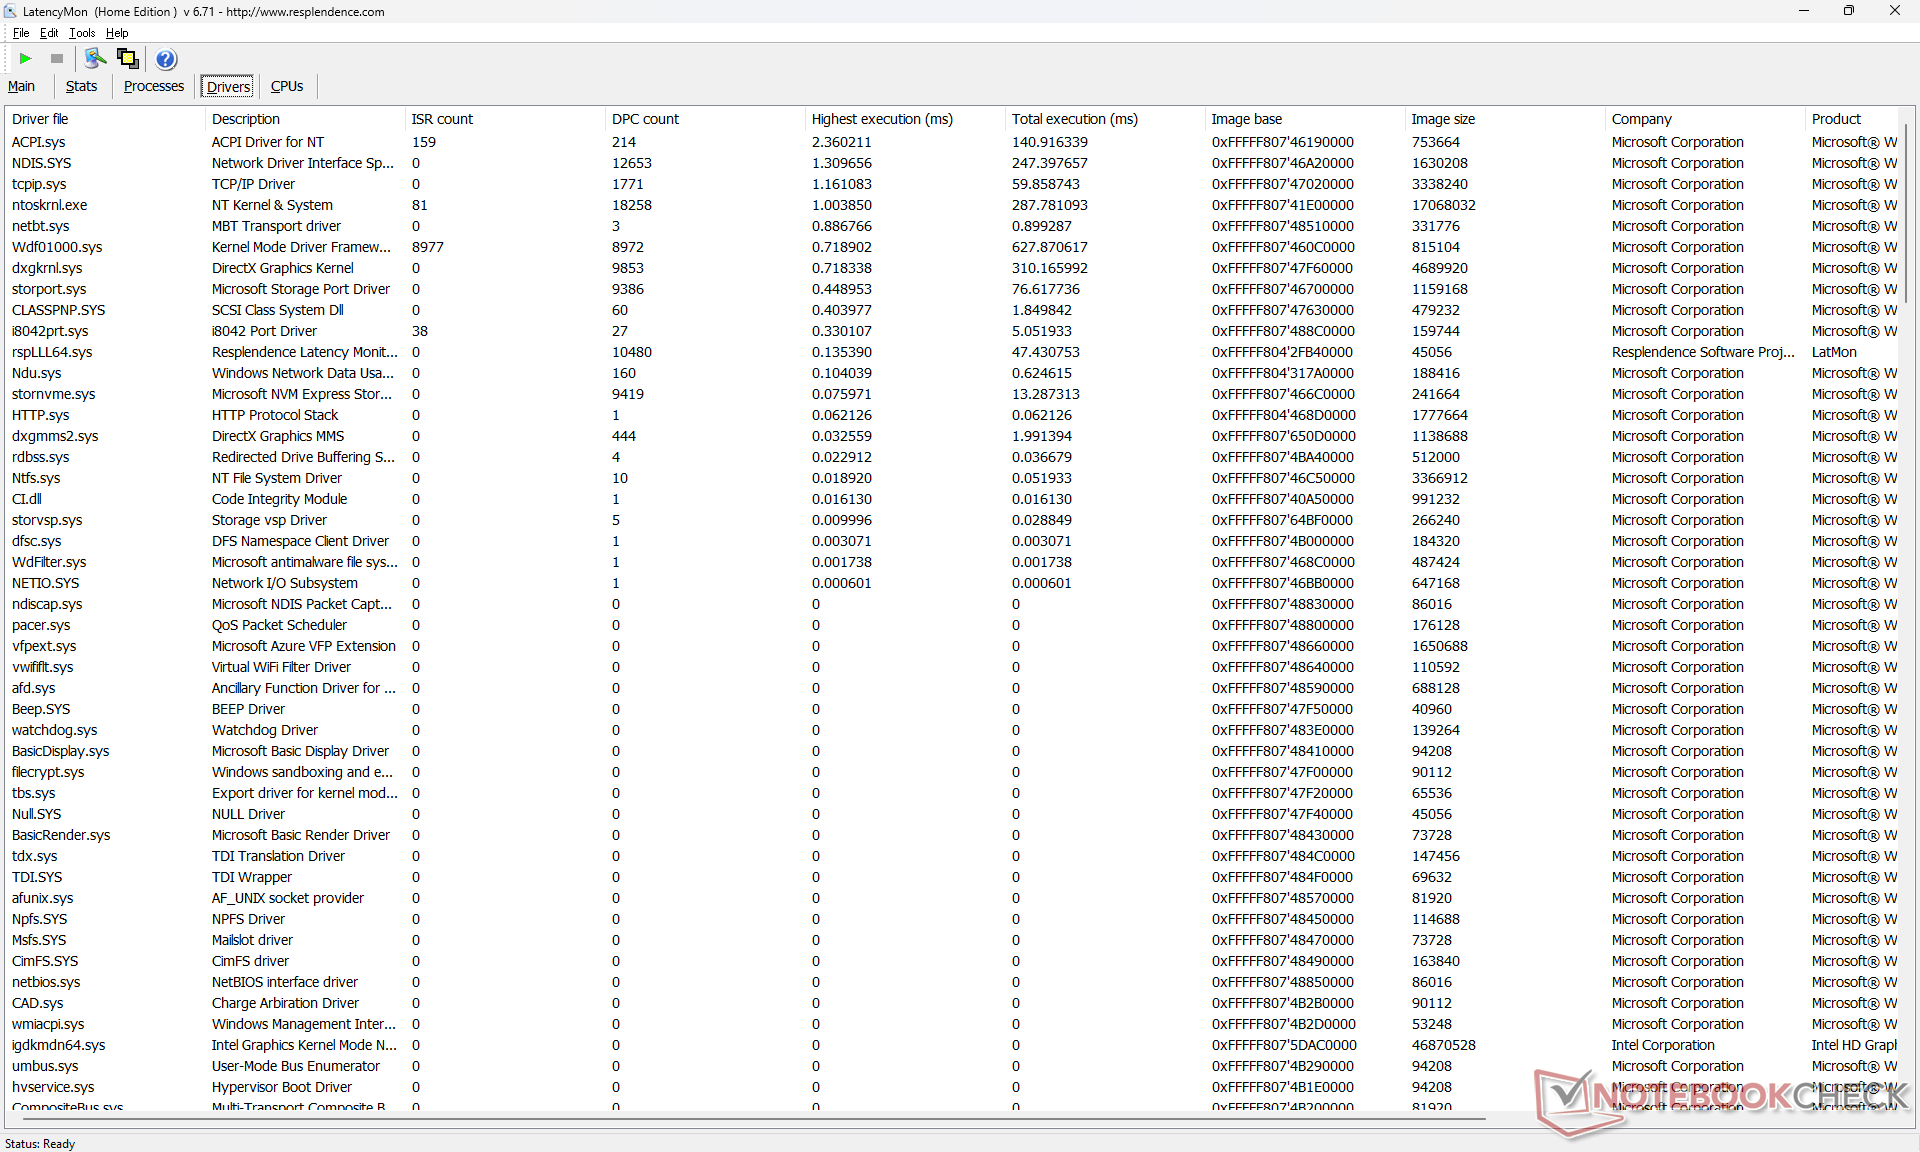
DPC-latenstid
LatencyMon avslöjar DPC-problem när man öppnar flera webbläsarflikar på vår hemsida. uppspelning av 4K-video vid 60 FPS är annars nästan perfekt med bara en enda tappad bild i början av vår testvideo.
| DPC Latencies / LatencyMon - interrupt to process latency (max), Web, Youtube, Prime95 | |
| HP EliteBook 840 G9 | |
| HP EliteBook 840 Aero G8 3E4Q6AA | |
| Lenovo ThinkPad X1 Carbon G10 Core i7-1265U | |
| HP EliteBook 845 G9 6F6H6EA | |
| LG Gram 14Z90Q | |
| Dell Latitude 7420 JW6MH | |
* ... mindre är bättre
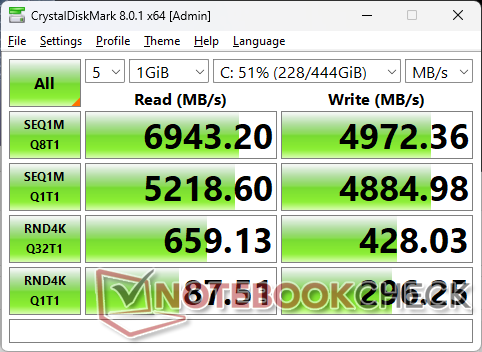
Lagringsenheter
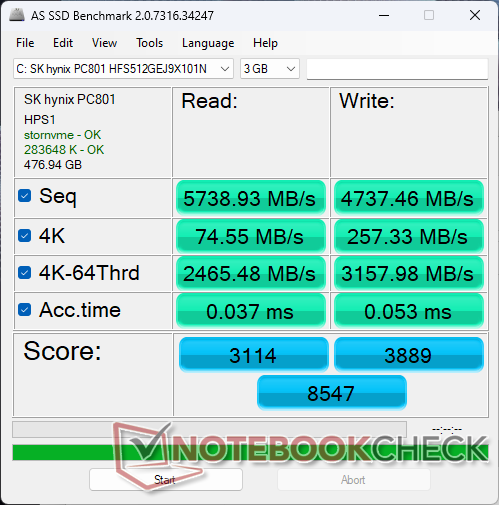
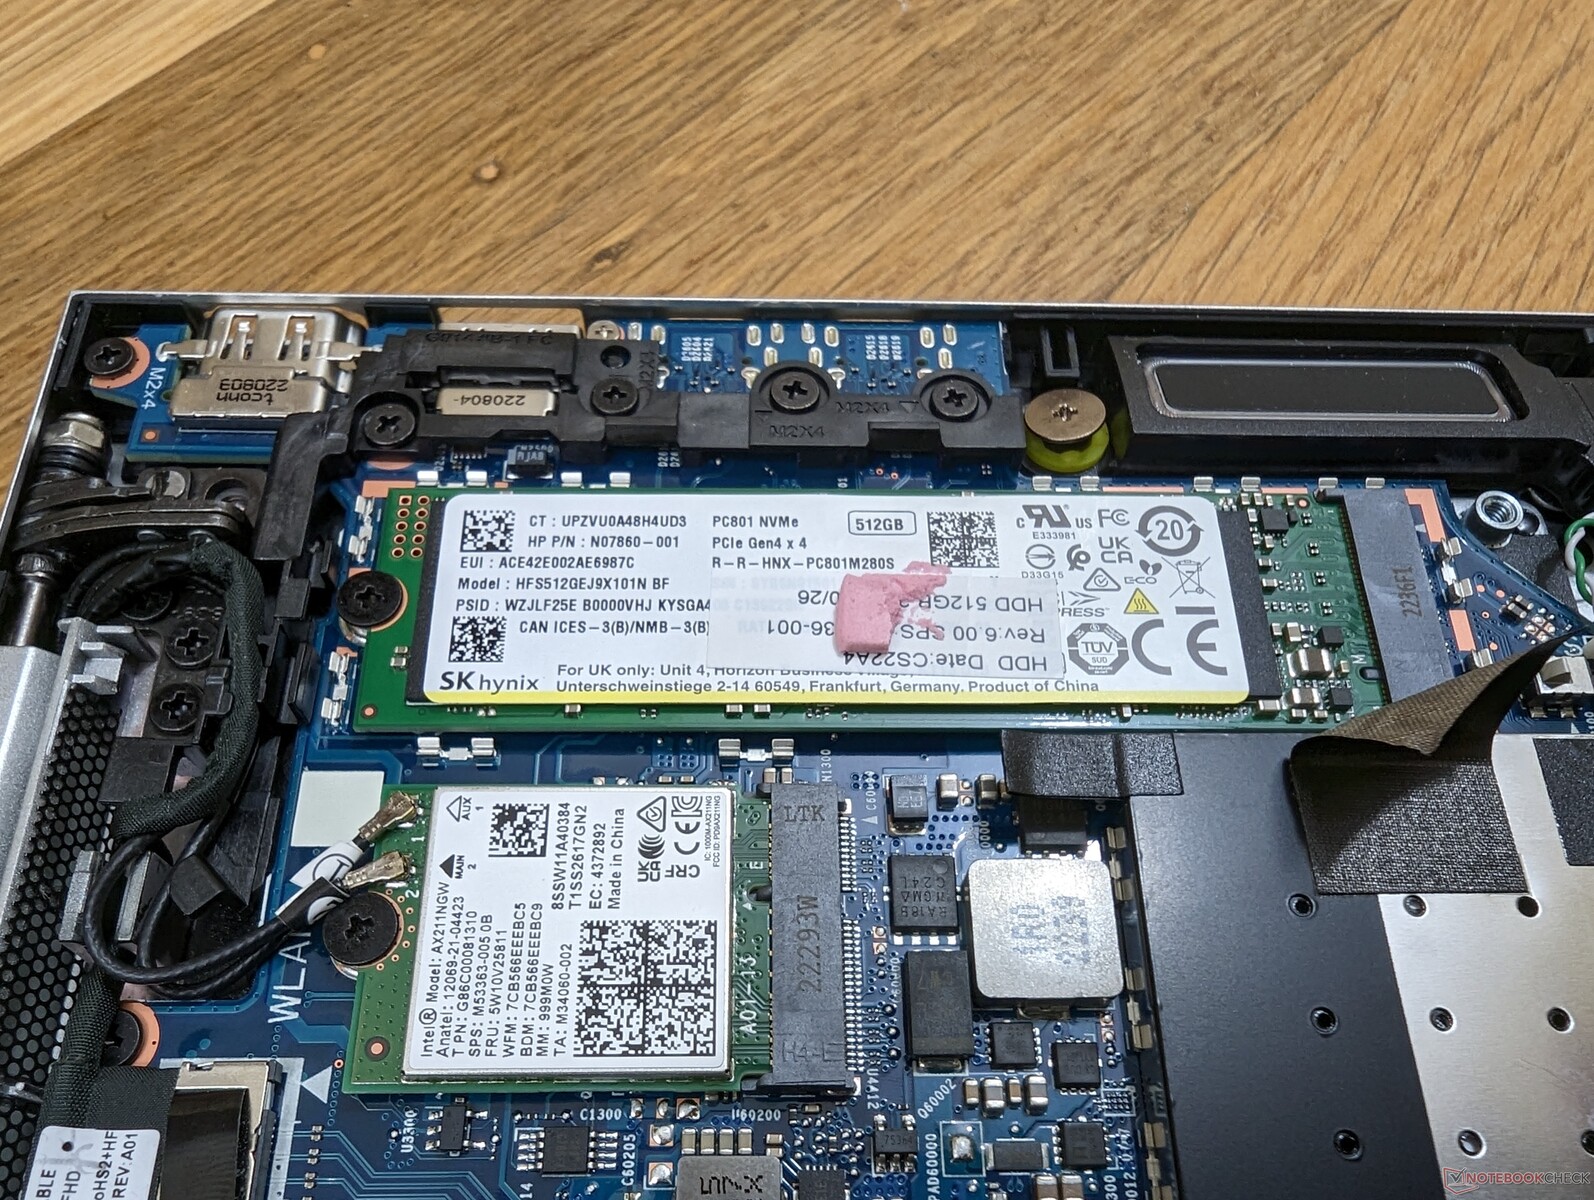
Vår enhet levereras med en 512 GB SK hynix PC801 PCIe4 x4 NVMe SSD som klarar sekventiell läs- och skrivhastighet på upp till 7000 MB/s respektive 5000 MB/s. Den kontinuerliga läshastigheten är dock lite långsammare, 5800 MB/s, sannolikt på grund av temperaturbegränsningar.

| Drive Performance rating - Percent | |
| HP EliteBook 840 G9 | |
| LG Gram 14Z90Q | |
| HP EliteBook 845 G9 6F6H6EA | |
| Lenovo ThinkPad X1 Carbon G10 Core i7-1265U | |
| HP EliteBook 840 Aero G8 3E4Q6AA | |
| Dell Latitude 7420 JW6MH | |
* ... mindre är bättre
Disk Throttling: DiskSpd Read Loop, Queue Depth 8
GPU-prestanda - Över genomsnitt Iris Xe 96 EUs
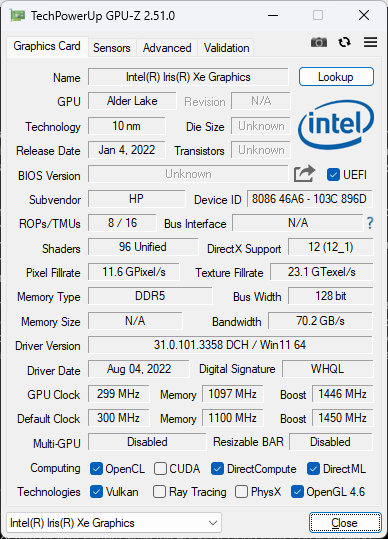
Även om Core i7-1280P använder samma integrerade Iris Xe 96 EUs GPU som i Core i7-1165G7 eller Core i7-1265U, är grafikprestandan något snabbare på HP eftersom Core-P CPU:n har ett högre värmehölje. Användare kan förvänta sig 15 till 25 procent snabbare bildfrekvenser än den genomsnittliga Iris Xe 96 EU-drivna bärbara datorn som ett resultat av detta. Nedgradering till en Core i5-konfiguration med Iris Xe 80 EU kommer att resultera i en 20-30 procent lägre grafikprestanda.
Intressant nog presterar vår Intel GPU bättre än den konkurrerande Radeon 680M i EliteBook 845 G9, trots att Radeon 680M kan köras snabbare på andra bärbara datorer, t.ex.Lenovo Yoga 7 14. Det är tydligt att den integrerade Radeon GPU:n i EliteBook är underpresterande.
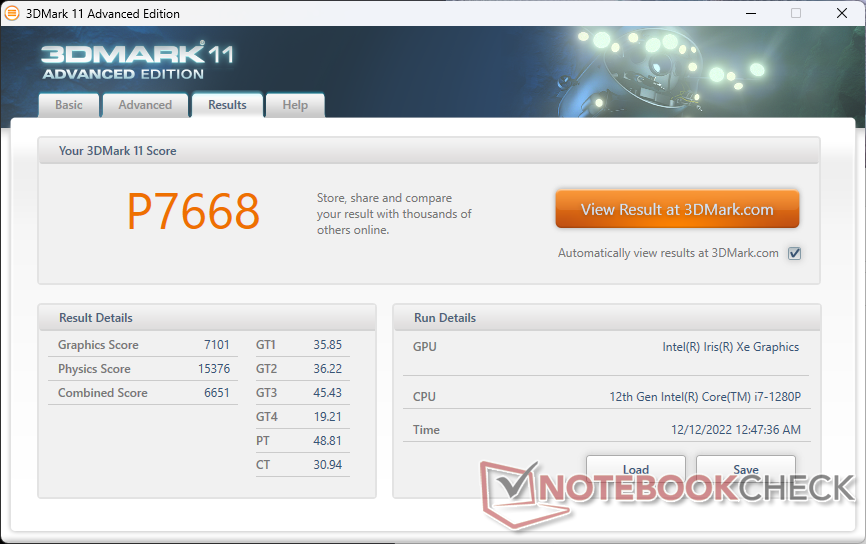
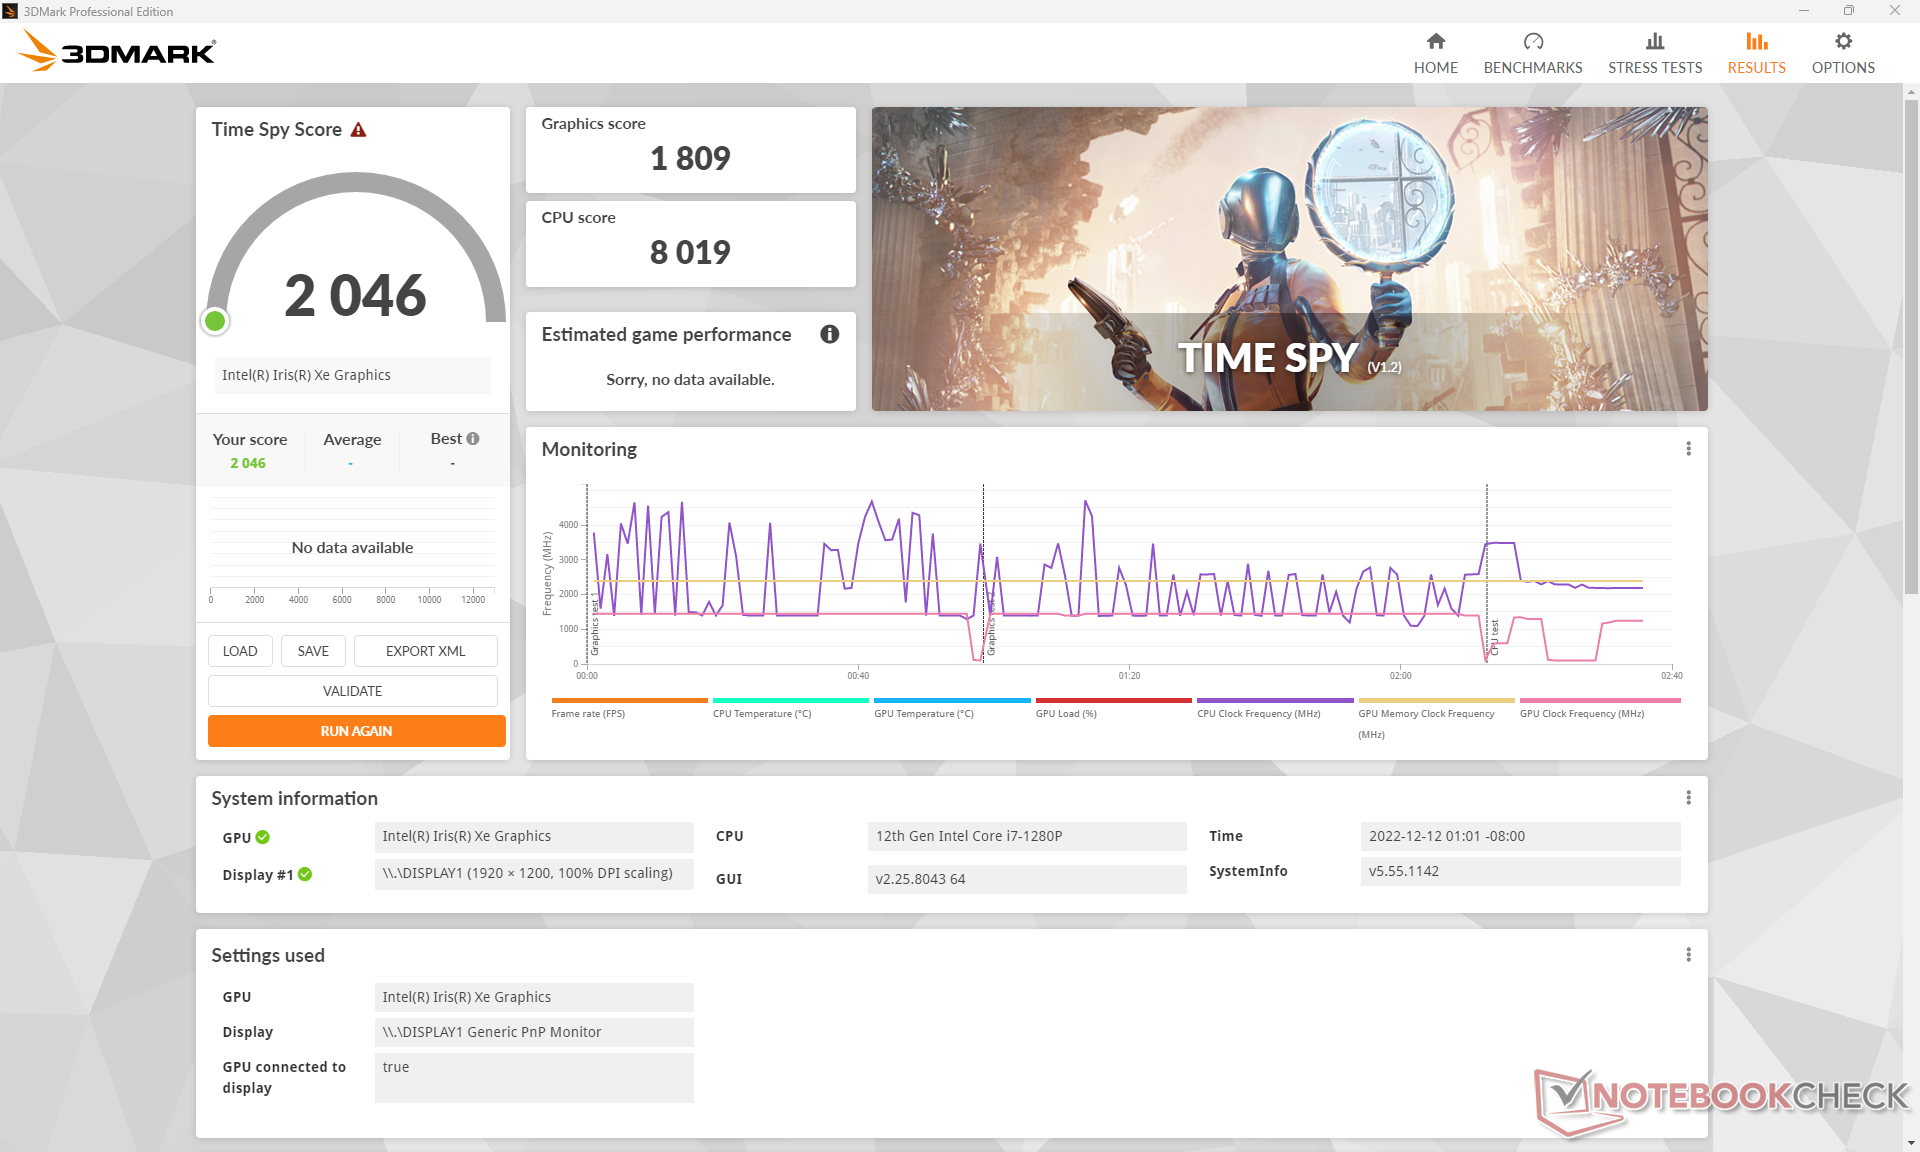
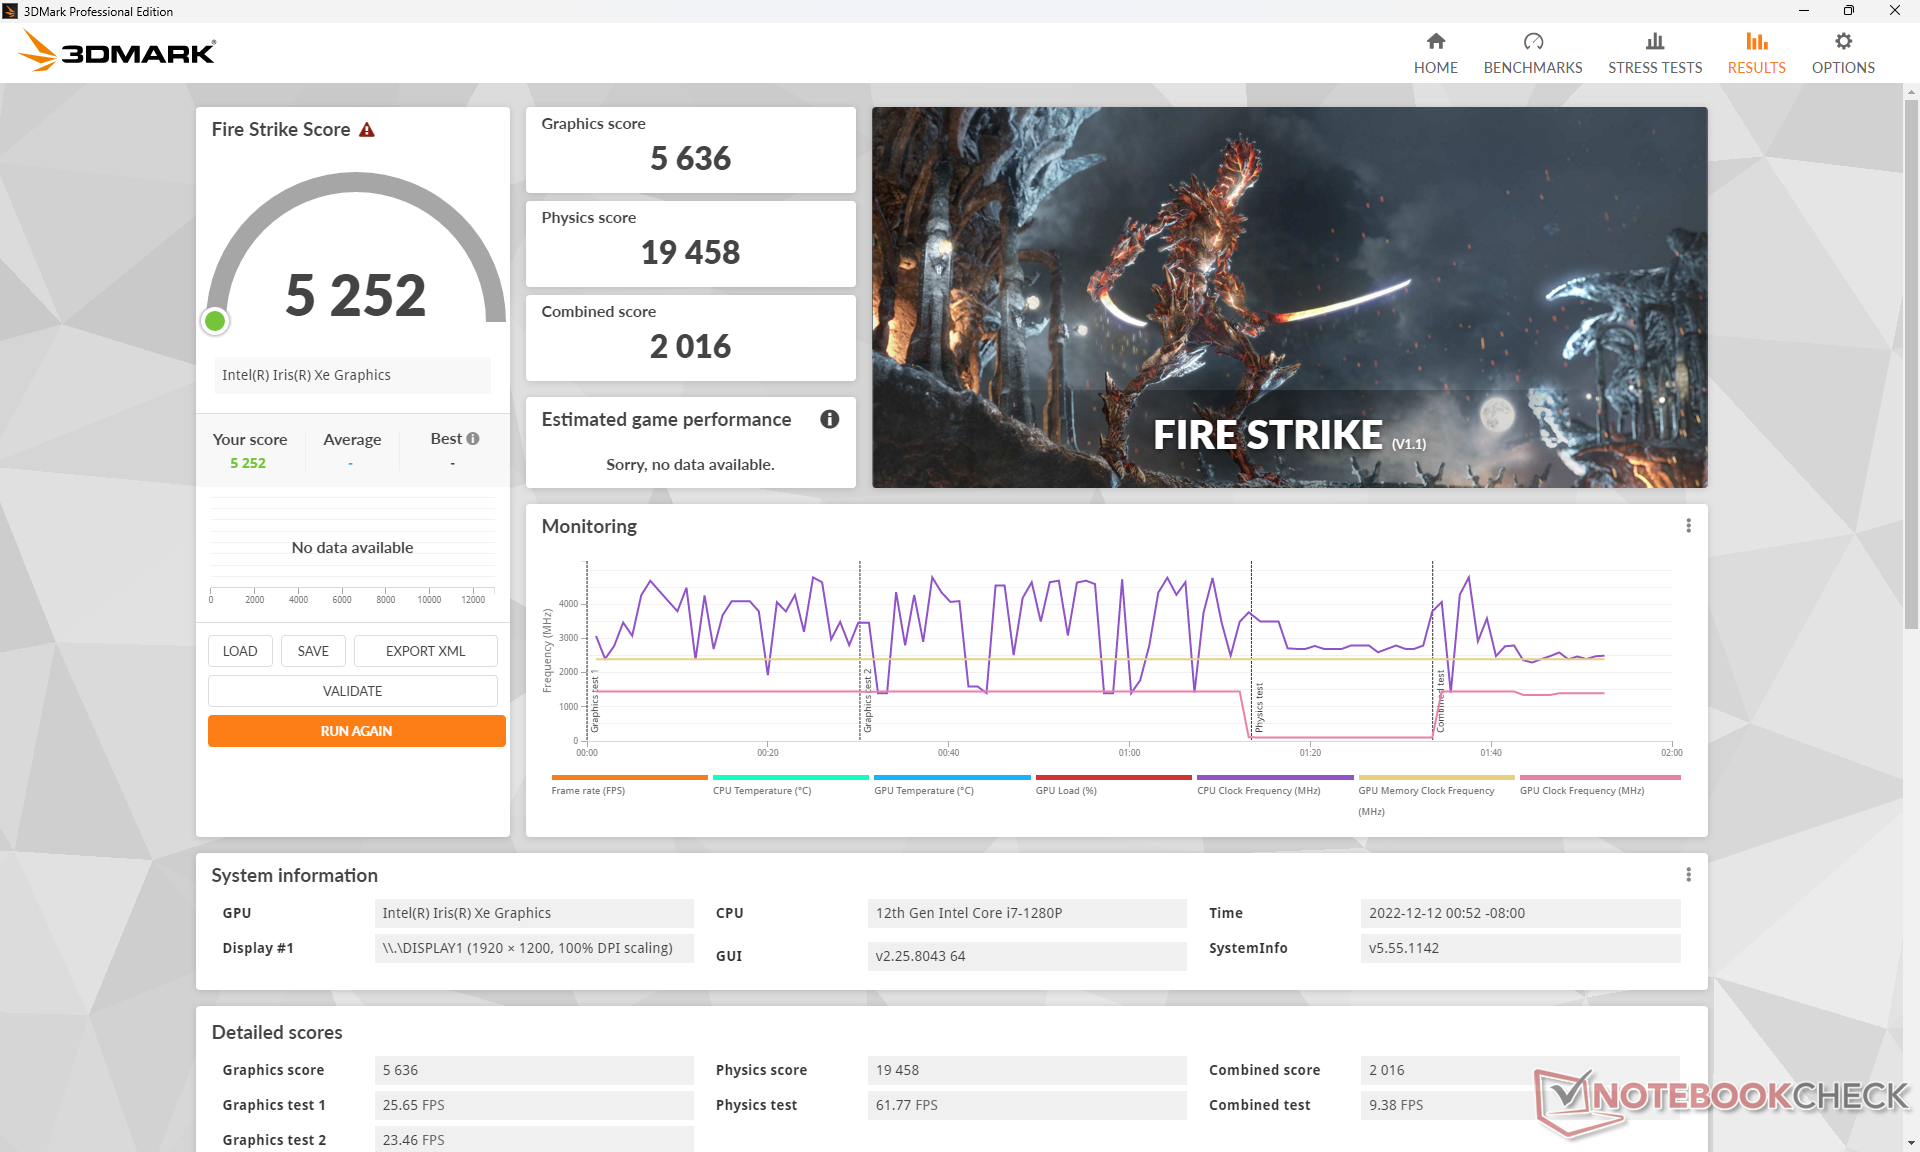
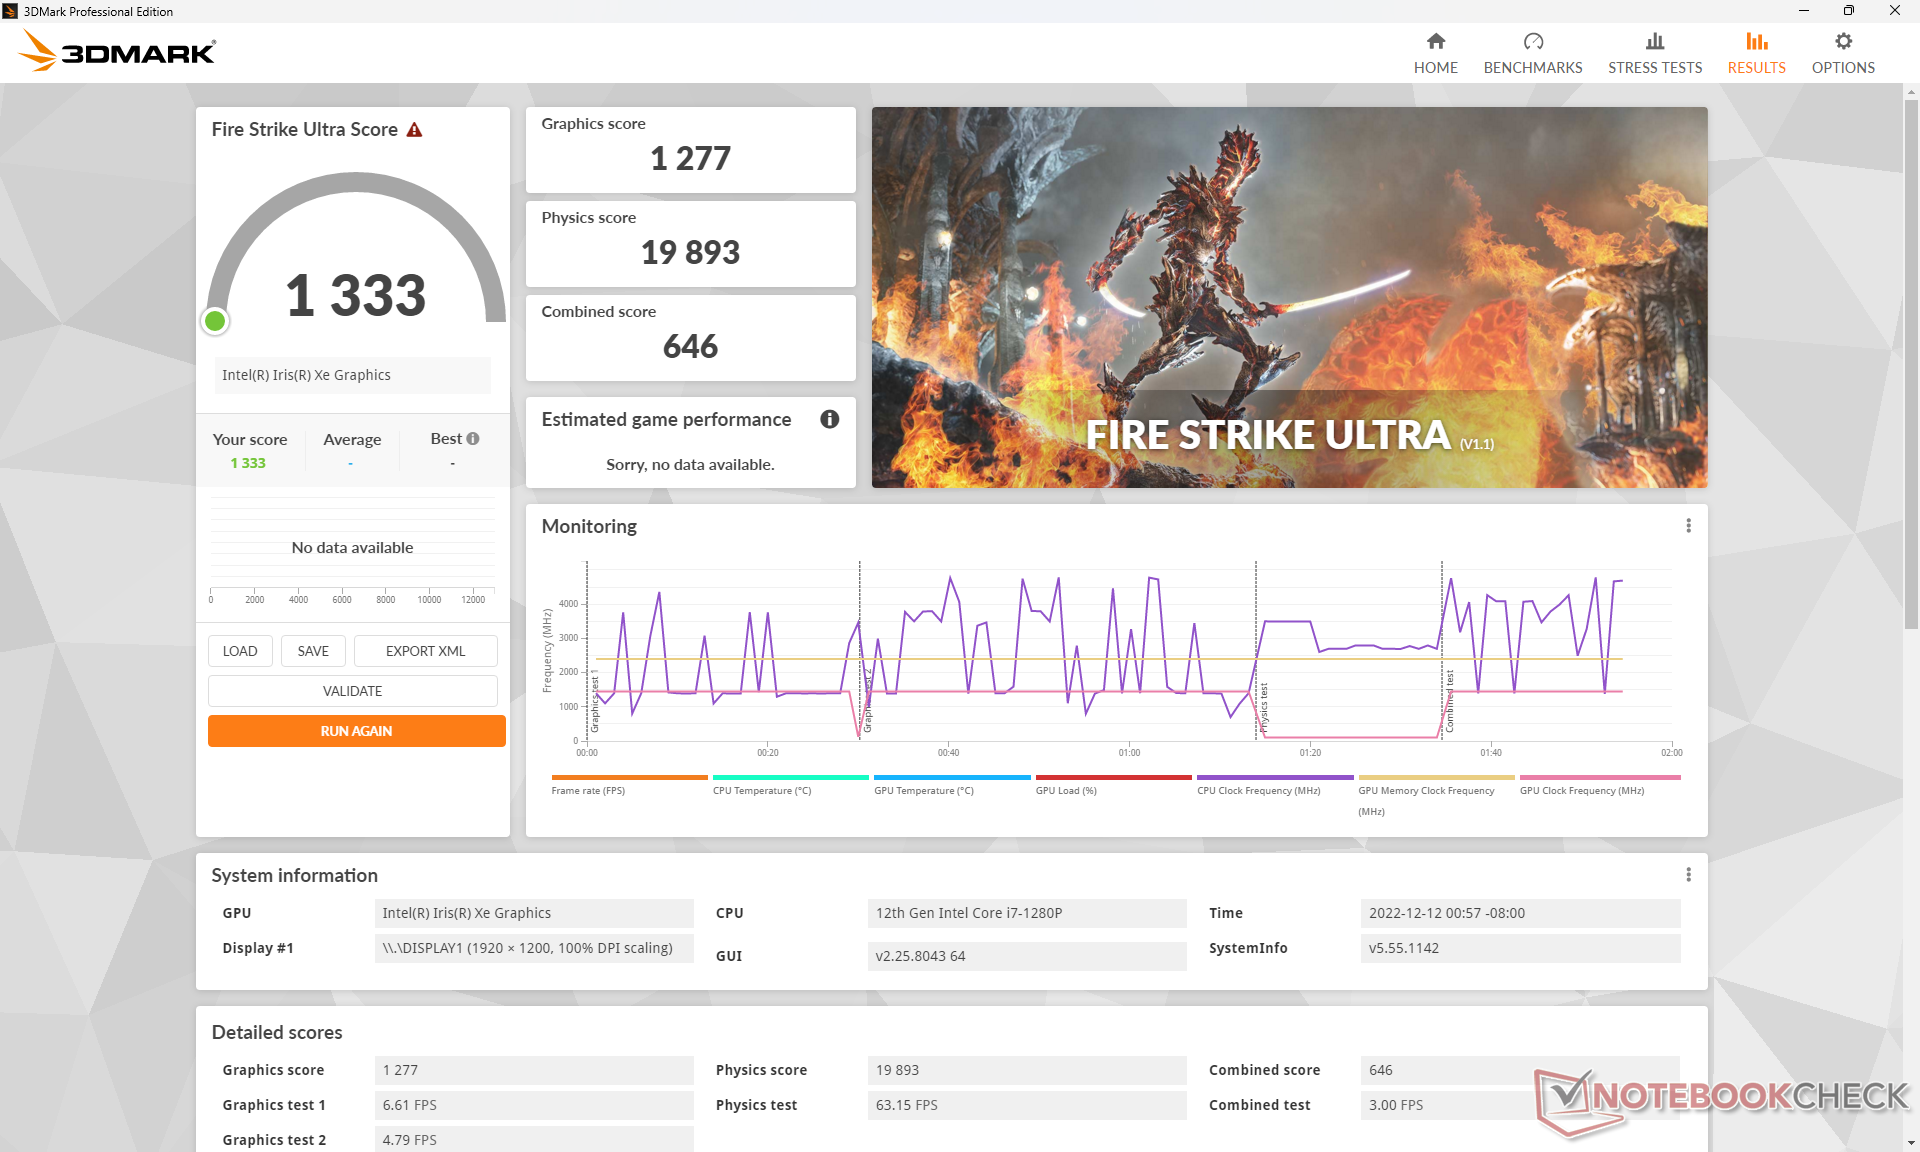
| 3DMark 11 Performance | 7668 poäng | |
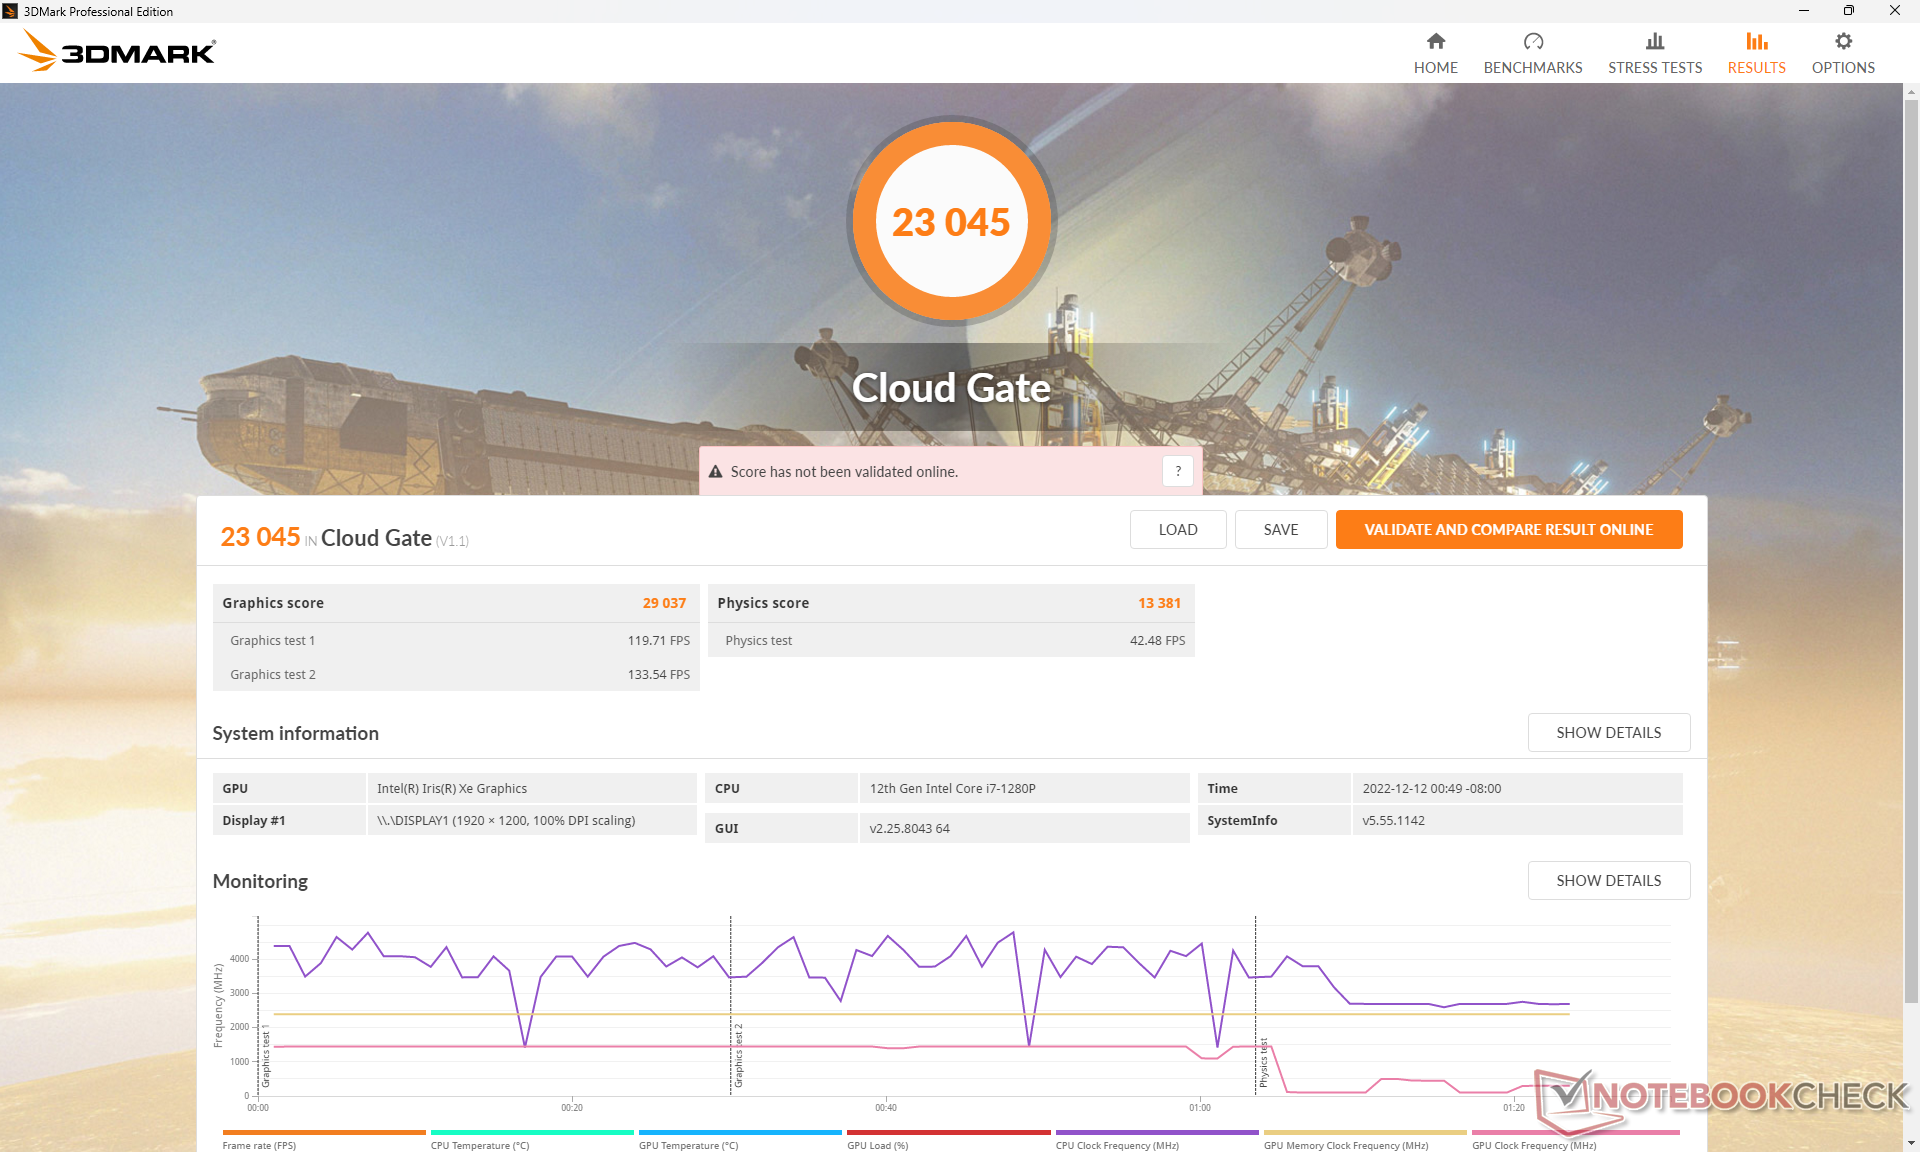
| 3DMark Cloud Gate Standard Score | 23045 poäng | |
| 3DMark Fire Strike Score | 5252 poäng | |
| 3DMark Time Spy Score | 2046 poäng | |
Hjälp | ||
Witcher 3 FPS Chart
| låg | med. | hög | ultra | |
|---|---|---|---|---|
| GTA V (2015) | 108.6 | 97.3 | 23.4 | 10.2 |
| The Witcher 3 (2015) | 100.1 | 59.3 | 35 | 16.4 |
| Dota 2 Reborn (2015) | 108.3 | 84.9 | 68.8 | 61.8 |
| Final Fantasy XV Benchmark (2018) | 46.9 | 26.1 | 18.4 | |
| X-Plane 11.11 (2018) | 46.1 | 34.5 | 33.7 | |
| Strange Brigade (2018) | 95.1 | 43.4 | 35.9 | 27.4 |
| Cyberpunk 2077 1.6 (2022) | 19.6 | 16.8 | 13 | 10.8 |
Utsläpp - sval och tyst
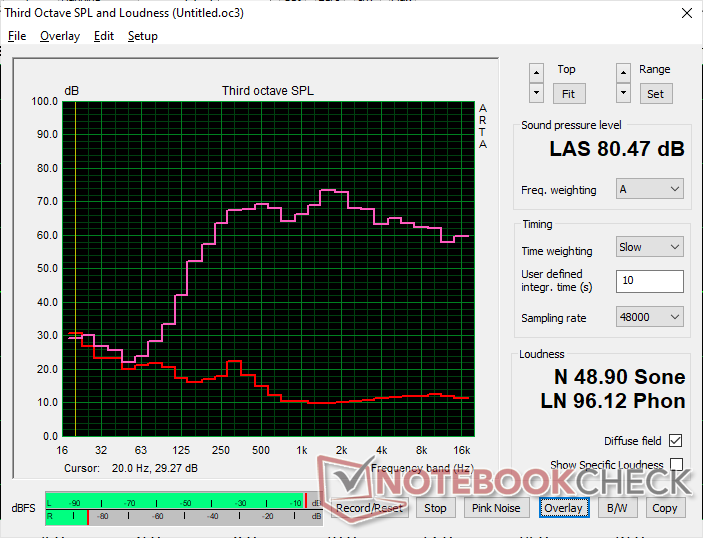
Systembrus
Fläktljudet och fläktbeteendet liknar det vi registrerade på AMD-versionen av modellen. Den interna fläkten gör ett utmärkt jobb med att förbli inaktiv så länge som möjligt när man kör tyngre belastningar. Att köra den första benchmark-scenen i 3DMark 06 en gång skulle till exempel resultera i ett fläktljud på bara 32 dB(A) mot en tyst bakgrund på 24 dB(A). Fläkten skulle så småningom stabilisera sig på cirka 39 dB(A) efter upprepade körningar med endast tillfälliga pulser på upp till 45 dB(A). Det totala fläktljudet är högre än vad vi registrerade på förra årets EliteBook 840 Aero G8 som använder en långsammare 11:e generationens Core U-series CPU.
Ljudnivå
| Låg belastning |
| 24.5 / 24.5 / 26 dB(A) |
| Hög belastning |
| 32.3 / 44.7 dB(A) |
 | ||
30 dB tyst 40 dB(A) hörbar 50 dB(A) högt ljud |
||
min: | ||
| HP EliteBook 840 G9 Iris Xe G7 96EUs, i7-1280P, SK hynix PC801 HFS512GEJ9X101N BF | HP EliteBook 845 G9 6F6H6EA Radeon 680M, R9 PRO 6950HS, WDC PC SN810 1TB | HP EliteBook 840 Aero G8 3E4Q6AA Iris Xe G7 96EUs, i7-1185G7, SK Hynix PC711 512GB HFS512GDE9X073N | Lenovo ThinkPad X1 Carbon G10 Core i7-1265U Iris Xe G7 96EUs, i7-1265U, Kioxia BG5 KBG5AZNV1T02 | LG Gram 14Z90Q Iris Xe G7 80EUs, i5-1240P, Samsung PM9A1 MZVL2512HCJQ | Dell Latitude 7420 JW6MH Iris Xe G7 80EUs, i5-1145G7, SK Hynix BC711 HFM512GD3HX015N | |
|---|---|---|---|---|---|---|
| Noise | -5% | 13% | 3% | -1% | -8% | |
| av / miljö * (dB) | 24.3 | 25.5 -5% | 24.1 1% | 23.2 5% | 25 -3% | 25.3 -4% |
| Idle Minimum * (dB) | 24.5 | 25.5 -4% | 24.2 1% | 23.2 5% | 26 -6% | 25.3 -3% |
| Idle Average * (dB) | 24.5 | 25.5 -4% | 24.2 1% | 23.2 5% | 27 -10% | 25.3 -3% |
| Idle Maximum * (dB) | 26 | 25.5 2% | 24.2 7% | 23.2 11% | 28 -8% | 25.3 3% |
| Load Average * (dB) | 32.3 | 38.1 -18% | 26.9 17% | 38.6 -20% | 35 -8% | 44.9 -39% |
| Witcher 3 ultra * (dB) | 39 | 27.9 28% | 38.5 1% | 36 8% | ||
| Load Maximum * (dB) | 44.7 | 44 2% | 29.9 33% | 38.3 14% | 36 19% | 44.9 -0% |
* ... mindre är bättre
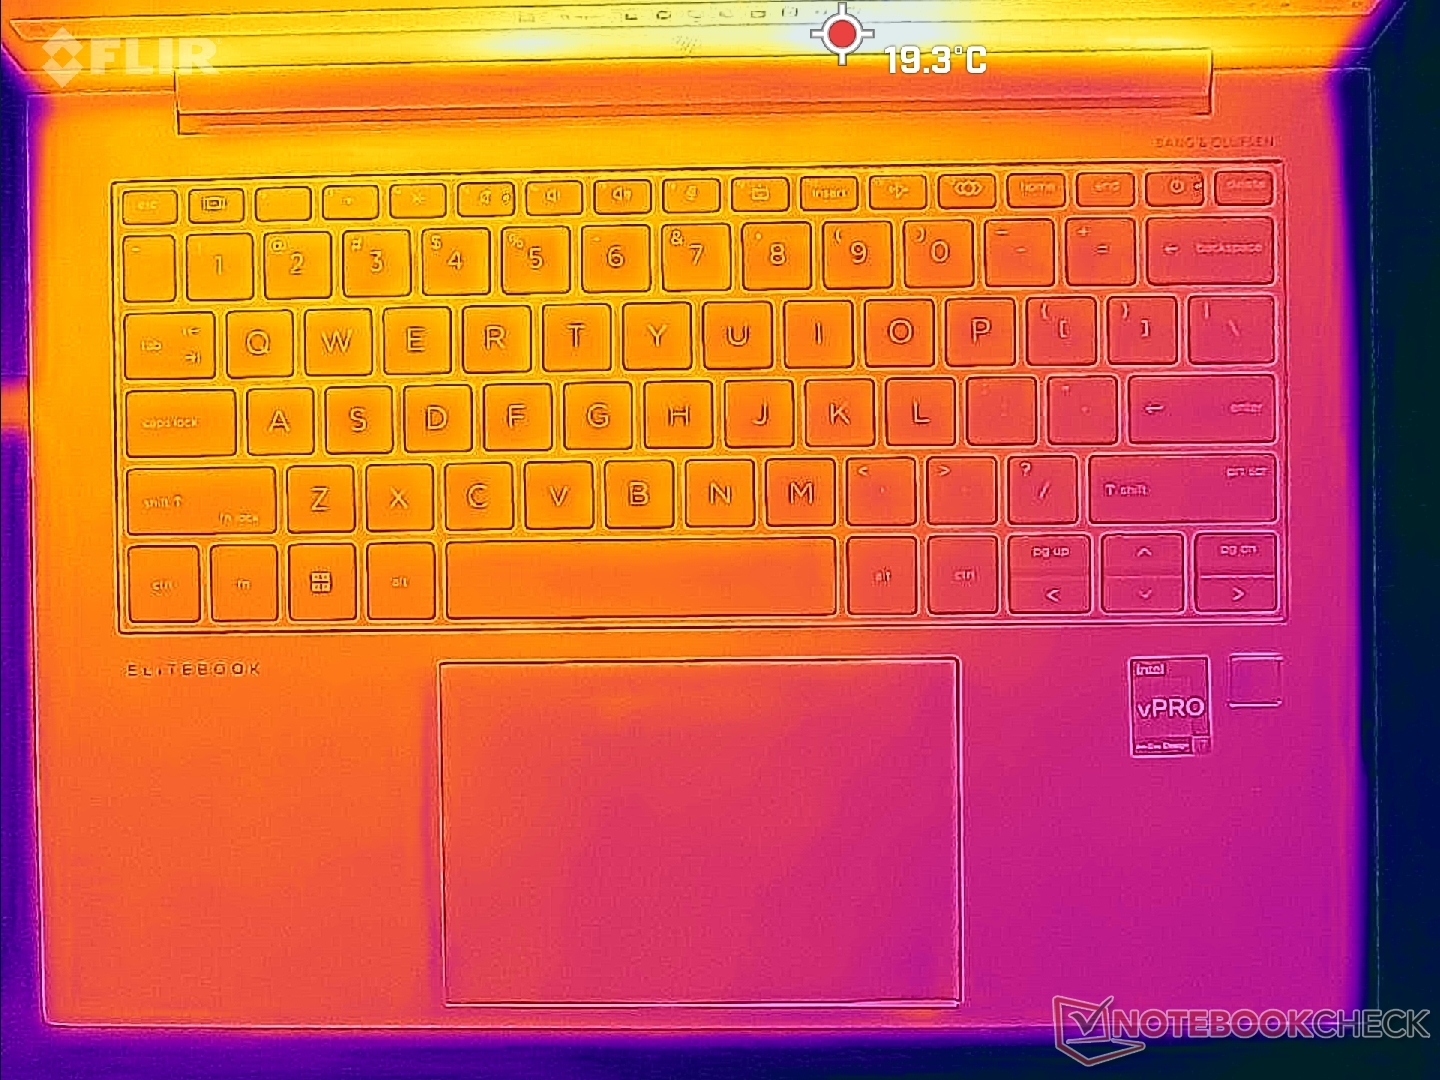
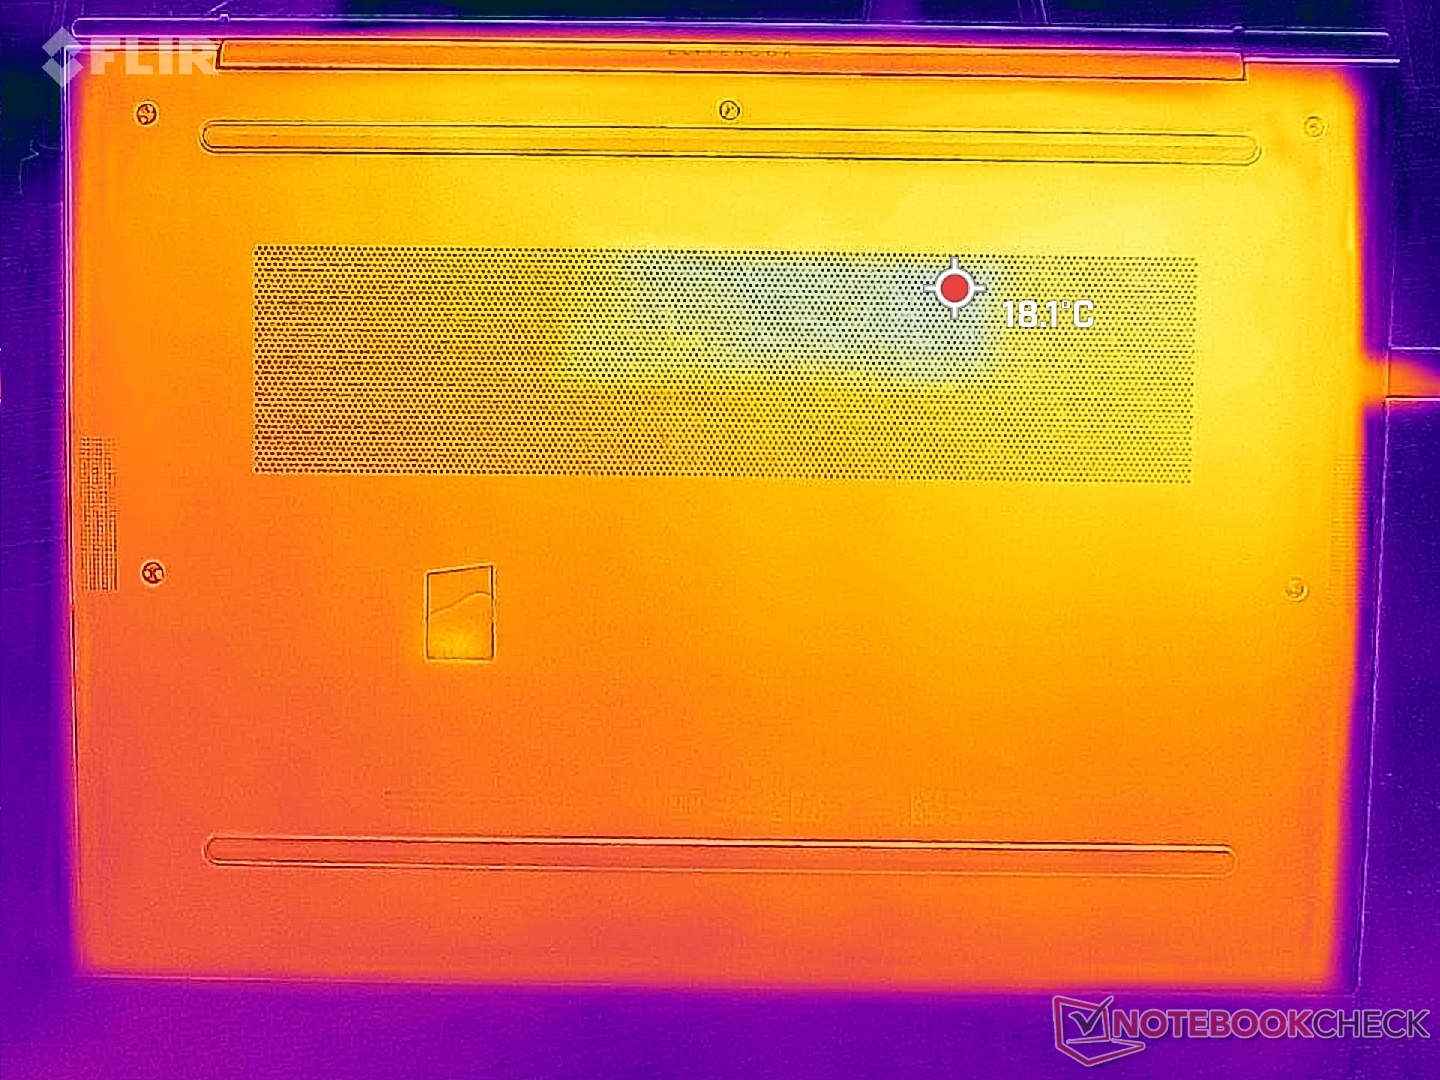
Temperatur
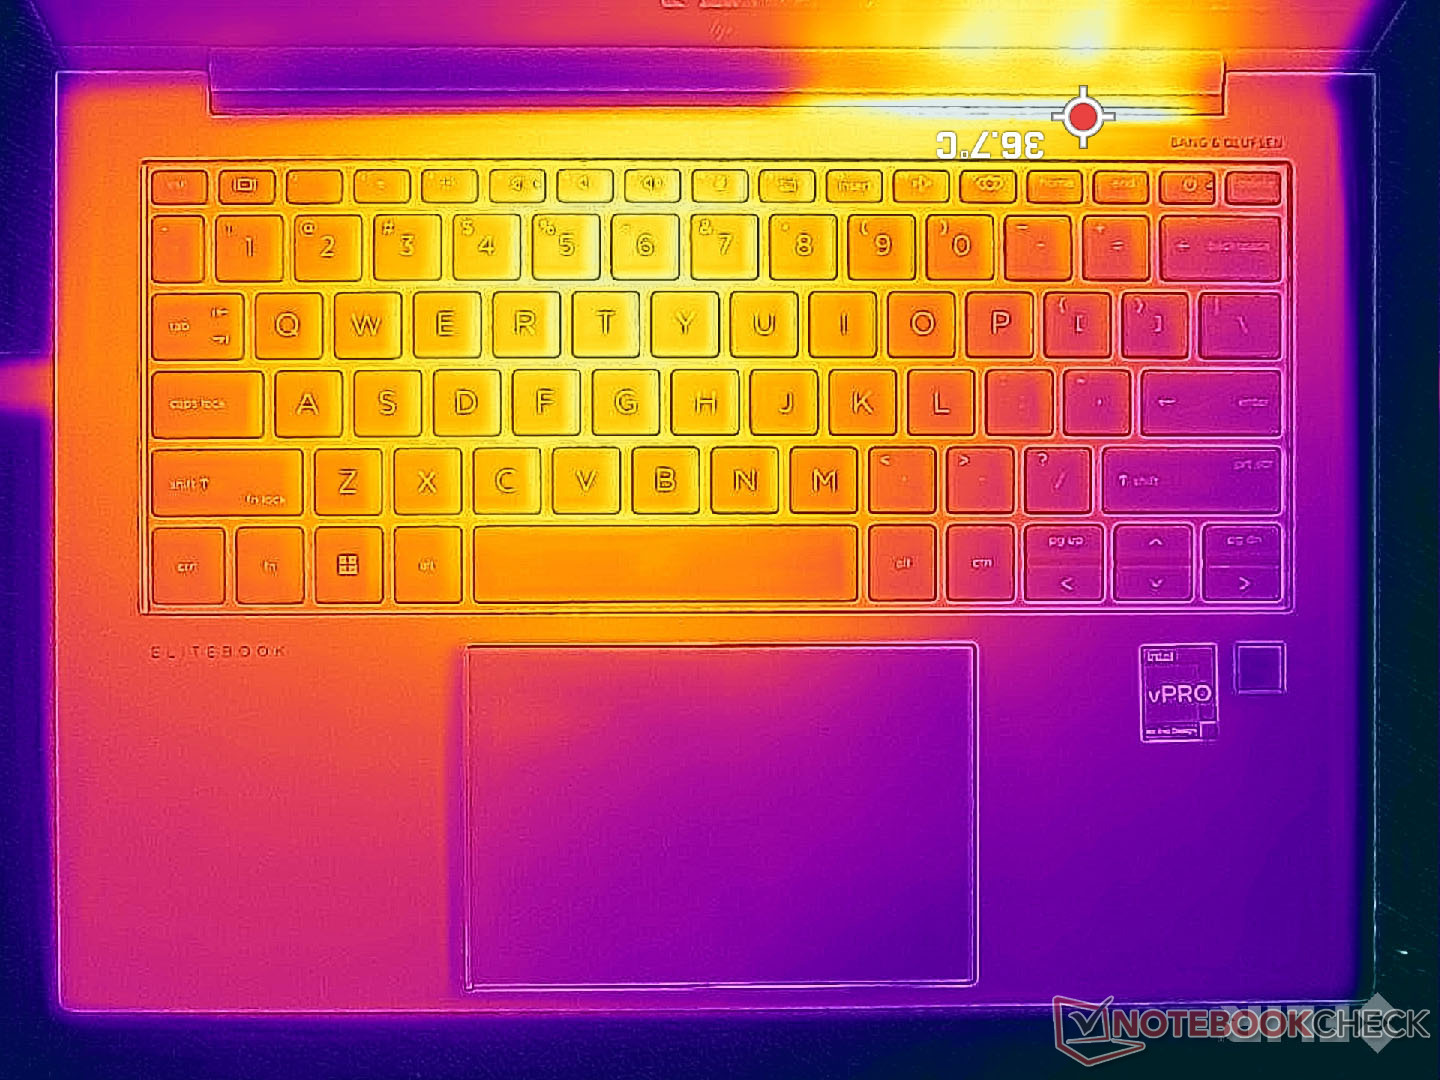
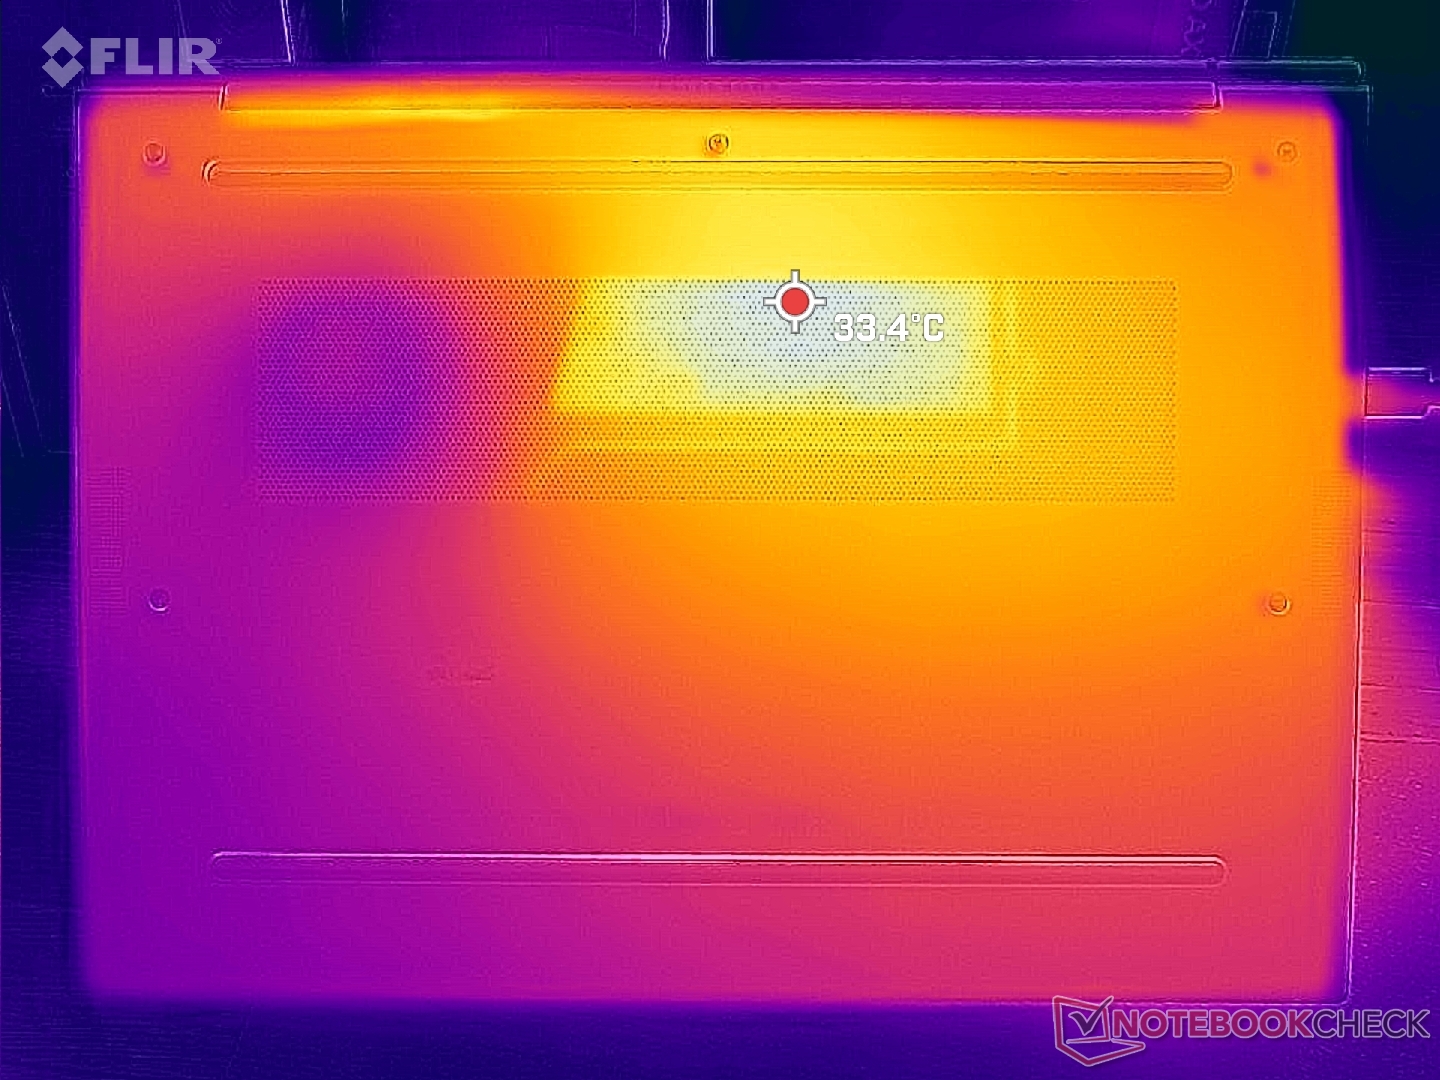
Yttemperaturerna är varmast mot mitten där värmepunkterna på tangentbordet och botten kan uppgå till cirka 33 C respektive 36 C, jämfört med drygt 40 C på ThinkPad X1 Carbon Gen 10. Systemet blir aldrig obehagligt varmt på huden.
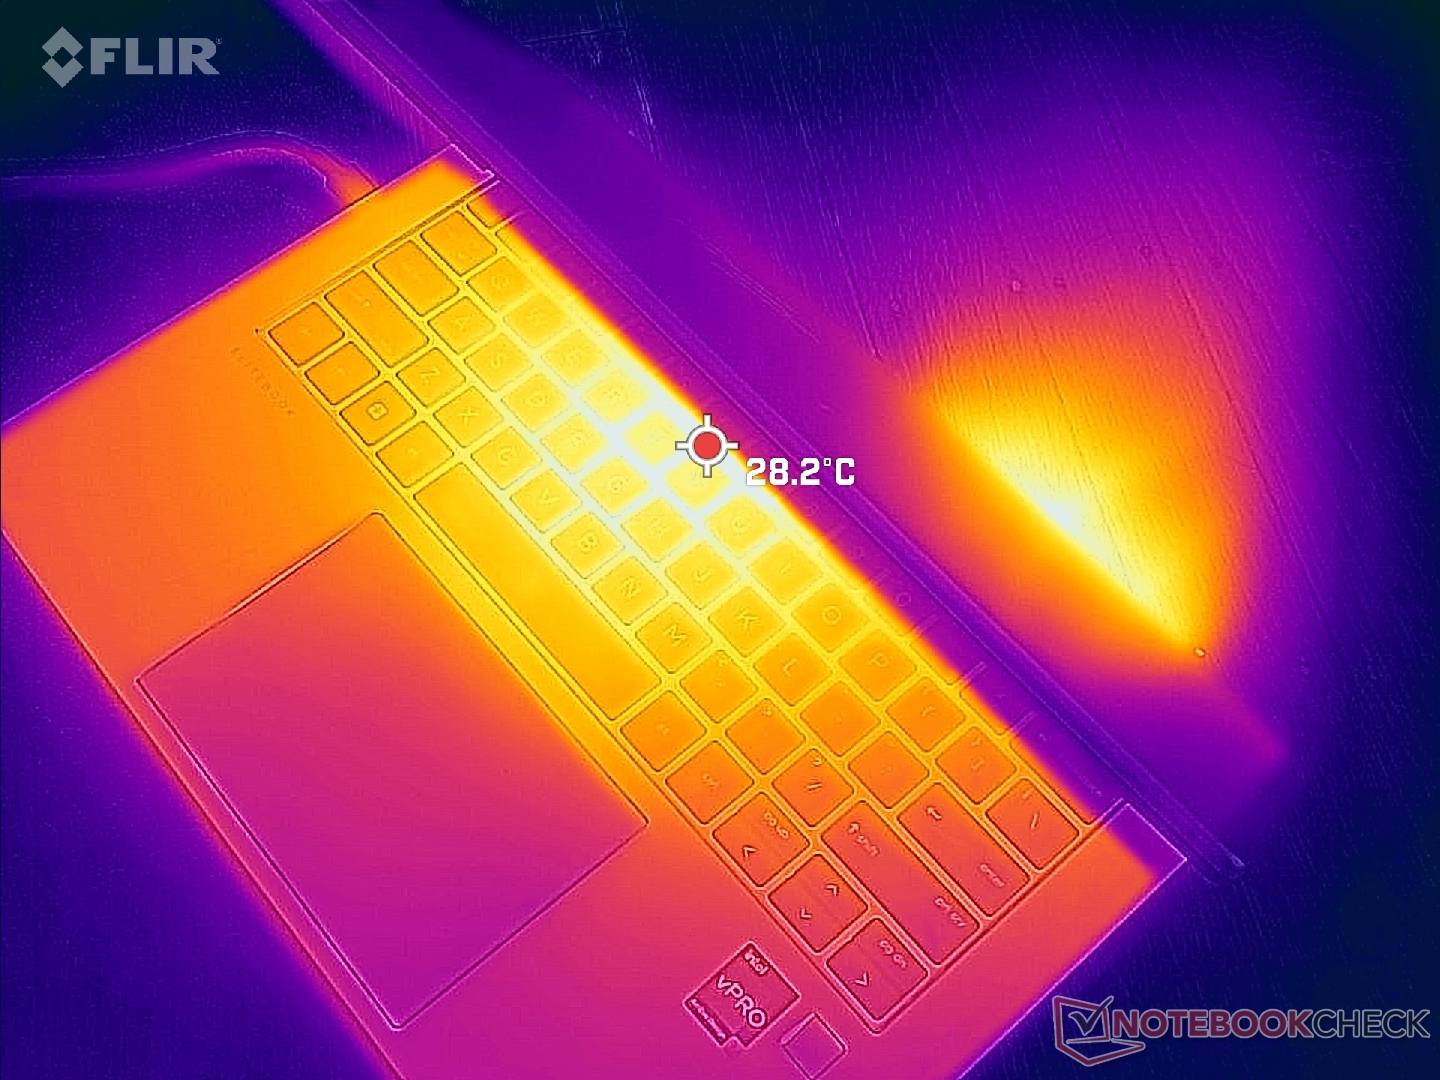
(+) Den maximala temperaturen på ovansidan är 32.8 °C / 91 F, jämfört med genomsnittet av 34.3 °C / 94 F , allt från 21.2 till 62.5 °C för klassen Office.
(+) Botten värms upp till maximalt 36.6 °C / 98 F, jämfört med genomsnittet av 36.8 °C / 98 F
(+) Vid tomgångsbruk är medeltemperaturen för ovansidan 20.7 °C / 69 F, jämfört med enhetsgenomsnittet på 29.5 °C / ### class_avg_f### F.
(+) Handledsstöden och pekplattan är kallare än hudtemperaturen med maximalt 23.2 °C / 73.8 F och är därför svala att ta på.
(+) Medeltemperaturen för handledsstödsområdet på liknande enheter var 27.5 °C / 81.5 F (+4.3 °C / 7.7 F).
| HP EliteBook 840 G9 Intel Core i7-1280P, Intel Iris Xe Graphics G7 96EUs | HP EliteBook 845 G9 6F6H6EA AMD Ryzen 9 PRO 6950HS, AMD Radeon 680M | HP EliteBook 840 Aero G8 3E4Q6AA Intel Core i7-1185G7, Intel Iris Xe Graphics G7 96EUs | Lenovo ThinkPad X1 Carbon G10 Core i7-1265U Intel Core i7-1265U, Intel Iris Xe Graphics G7 96EUs | LG Gram 14Z90Q Intel Core i5-1240P, Intel Iris Xe Graphics G7 80EUs | Dell Latitude 7420 JW6MH Intel Core i5-1145G7, Intel Iris Xe Graphics G7 80EUs | |
|---|---|---|---|---|---|---|
| Heat | -42% | -42% | -13% | -26% | -18% | |
| Maximum Upper Side * (°C) | 32.8 | 49.4 -51% | 39.2 -20% | 41.2 -26% | 43 -31% | 37.1 -13% |
| Maximum Bottom * (°C) | 36.6 | 48 -31% | 51.2 -40% | 41 -12% | 45 -23% | 38.7 -6% |
| Idle Upper Side * (°C) | 21.6 | 30.8 -43% | 33 -53% | 23.2 -7% | 27 -25% | 27.3 -26% |
| Idle Bottom * (°C) | 22.2 | 31.4 -41% | 34 -53% | 23.4 -5% | 28 -26% | 28.1 -27% |
* ... mindre är bättre
Stresstest
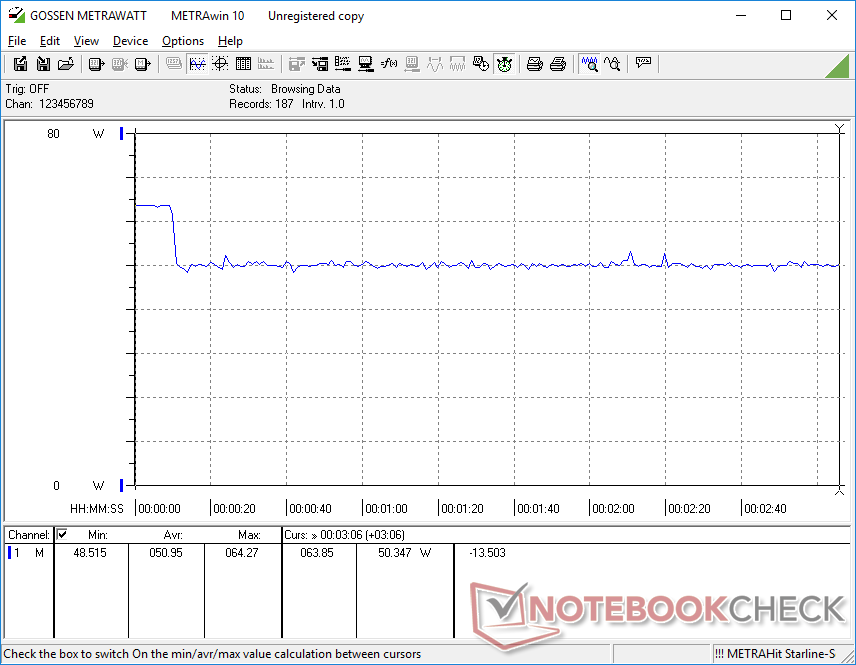
När Prime95 körs ökar processorn till 3 GHz och 60 W i cirka 20 sekunder eller tills kärntemperaturen når 86 C. Därefter sjunker den till bara 1,6 GHz och 30 W för att behålla en svalare kärntemperatur på 65 C. Det är synd att det inte finns något alternativ för att höja temperaturtaket för högre klockfrekvenser, eftersom processorn här underpresterar jämfört med de flesta andra bärbara datorer med samma Core i7-1280P-processor.
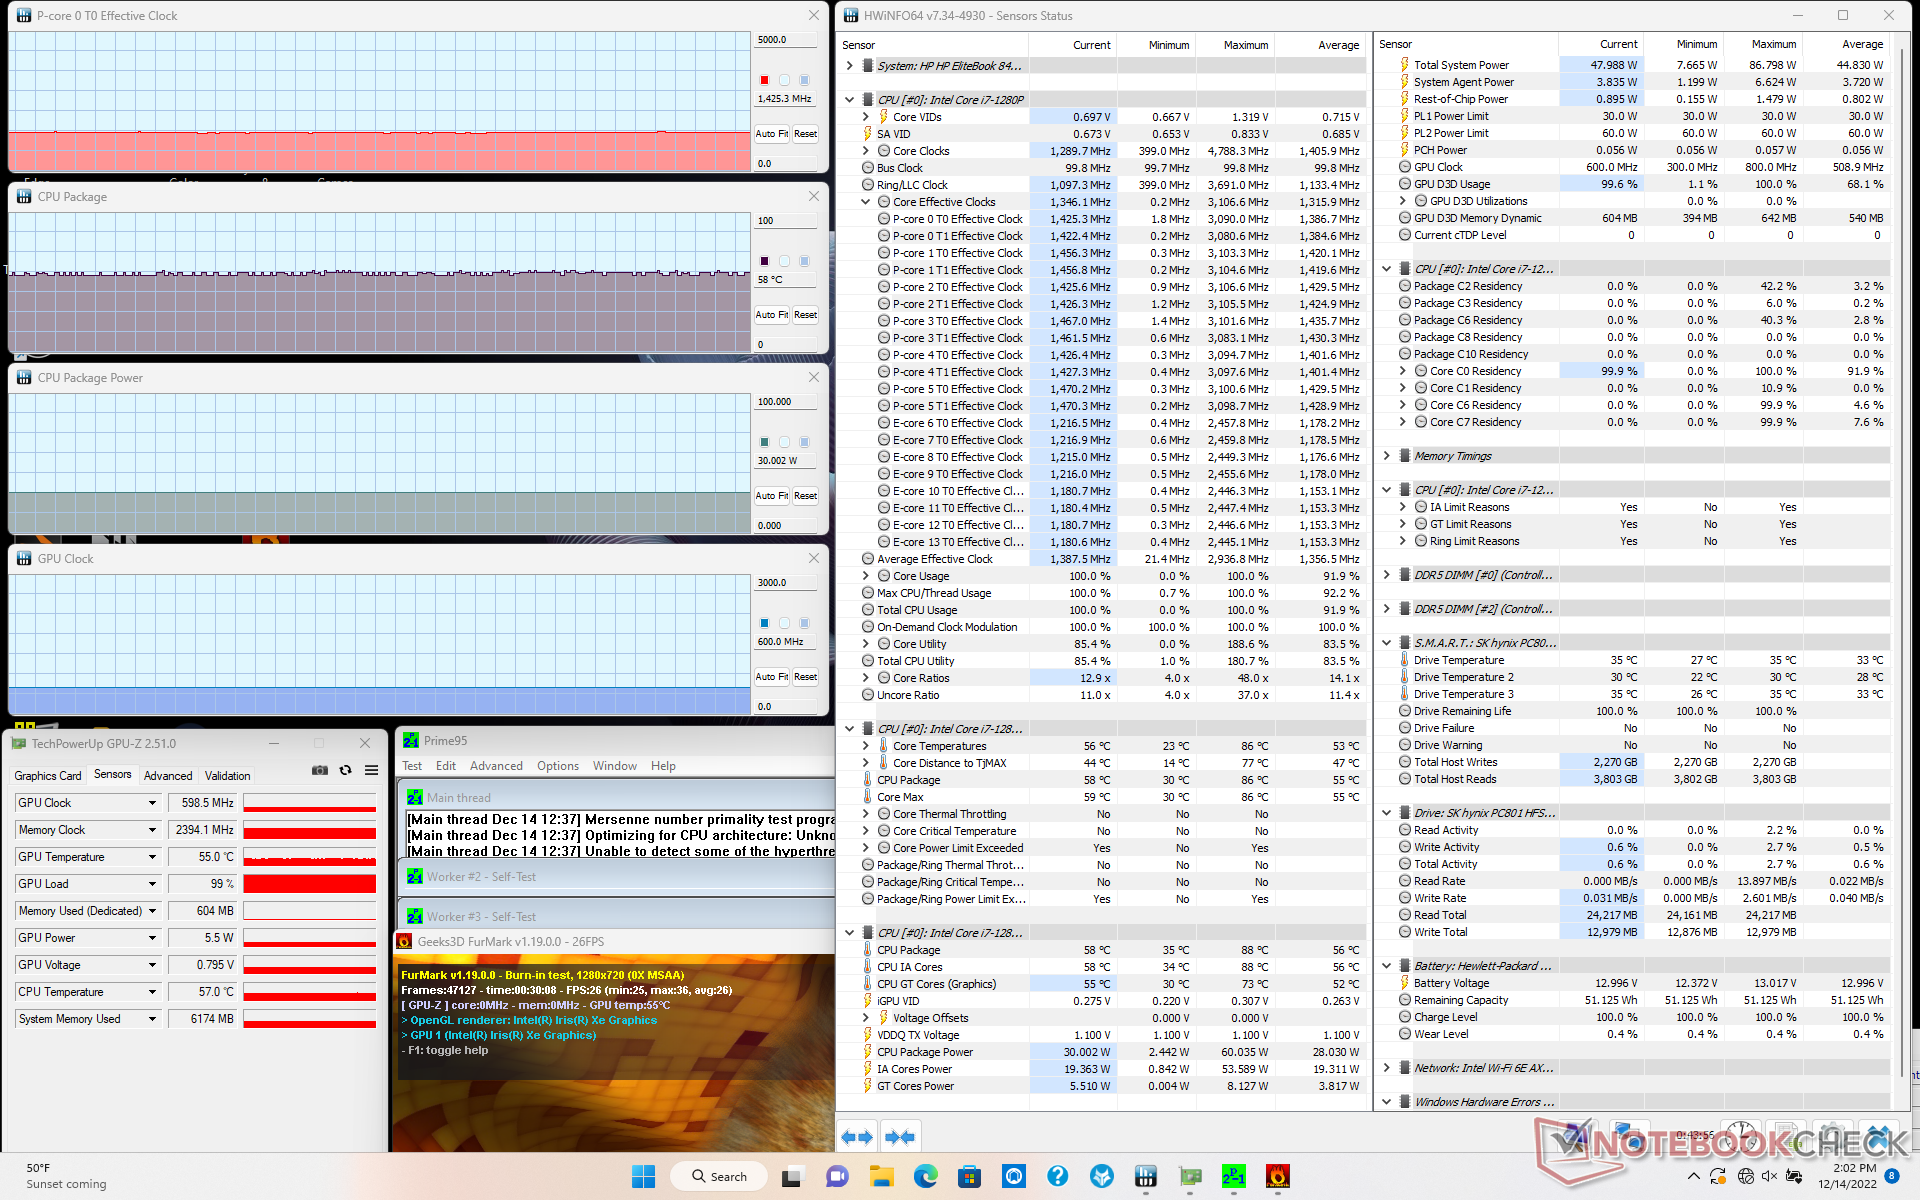
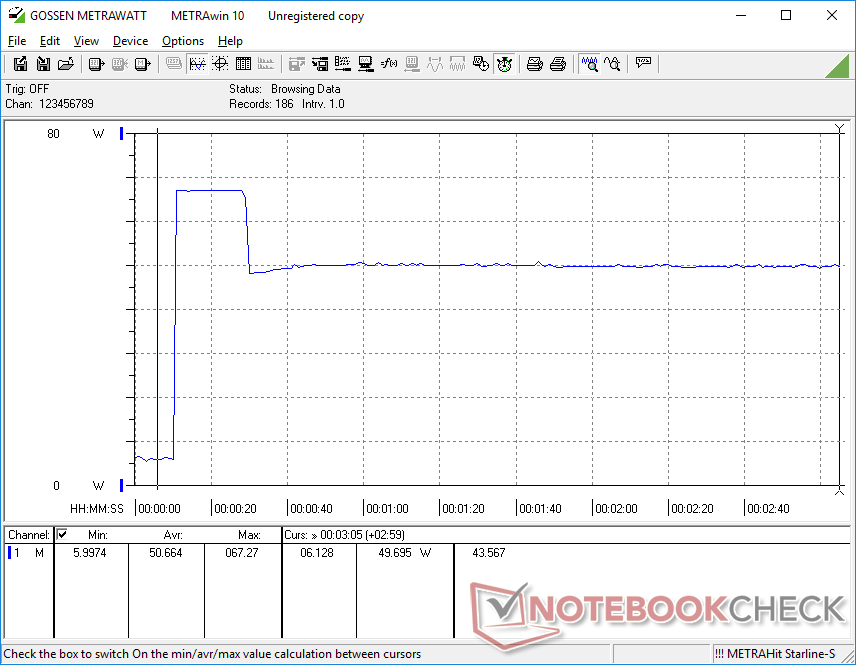
GPU-klockfrekvens och temperatur vid körning Witcher 3 skulle stabiliseras på 1397 MHz respektive 66 C, jämfört med 1097 MHz och 65 C på Dragonfly Folio G3 som är utrustad med samma integrerade GPU. De högre klockfrekvenserna bidrar till att EliteBook ligger över de flesta bärbara datorer med Core U-drift när det gäller grafikprestanda.
Att köra på batteri minskar prestandan något. Ett 3DMark 11-test på batterier skulle ge fysik- och grafikpoäng på 13157 respektive 6717 poäng, jämfört med 15376 respektive 7101 poäng när det är på strömförsörjning.
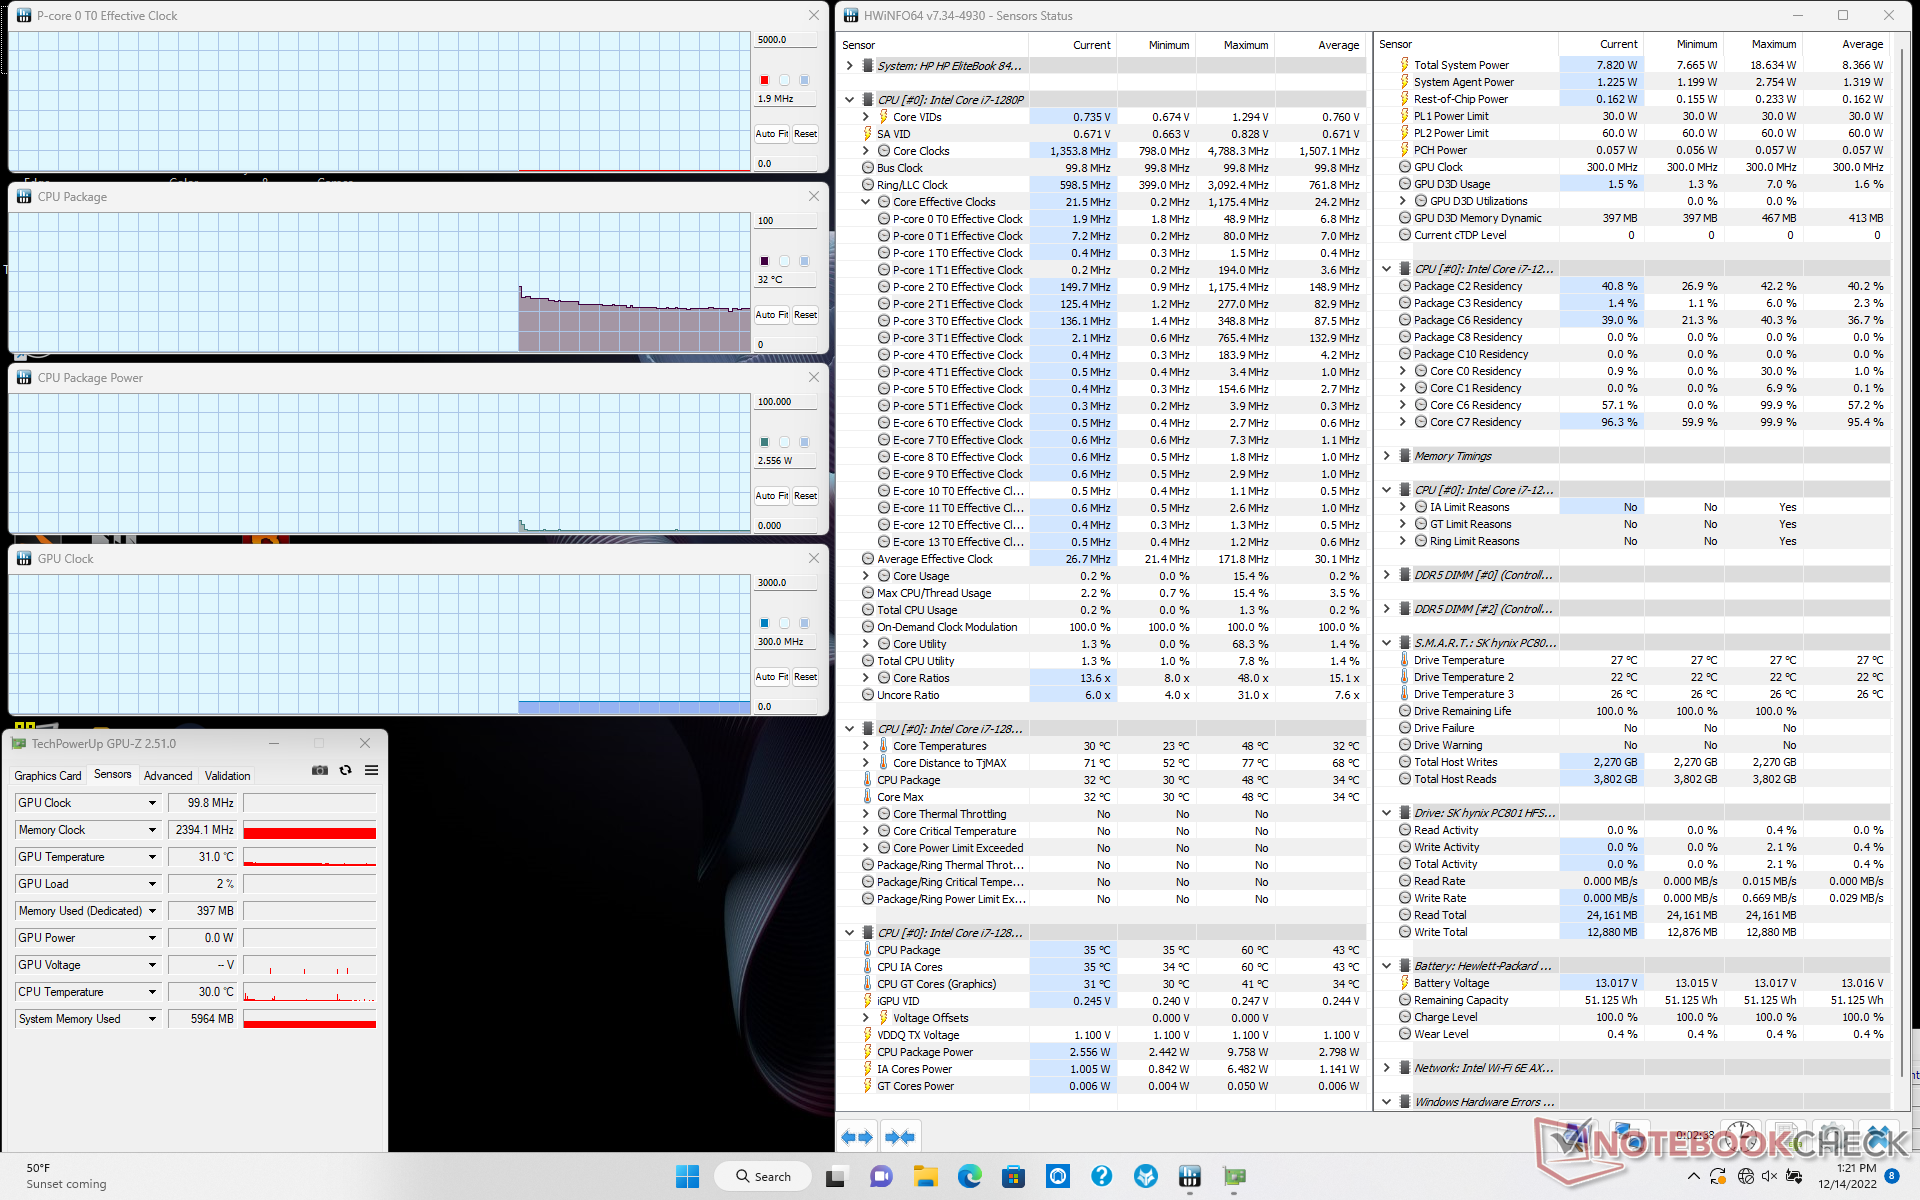
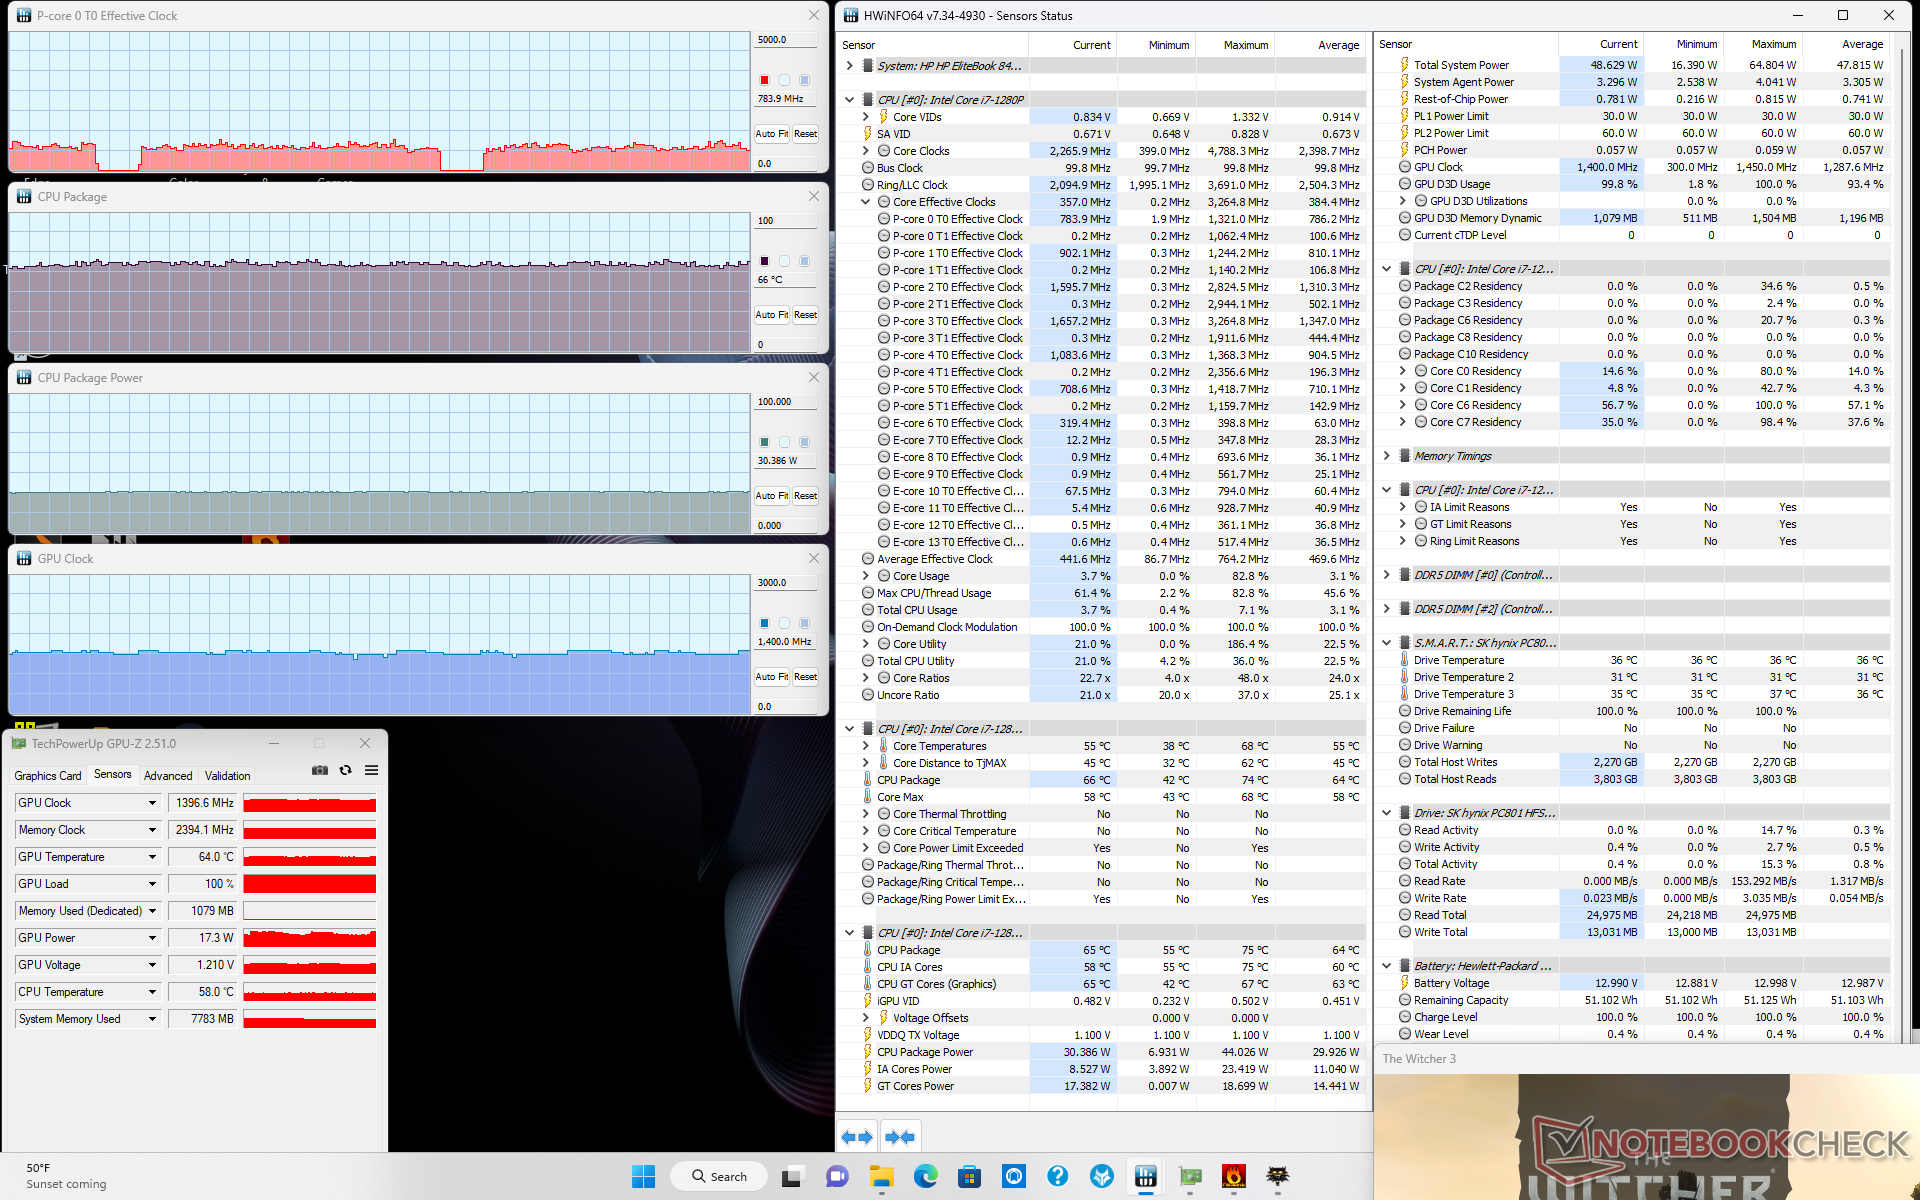
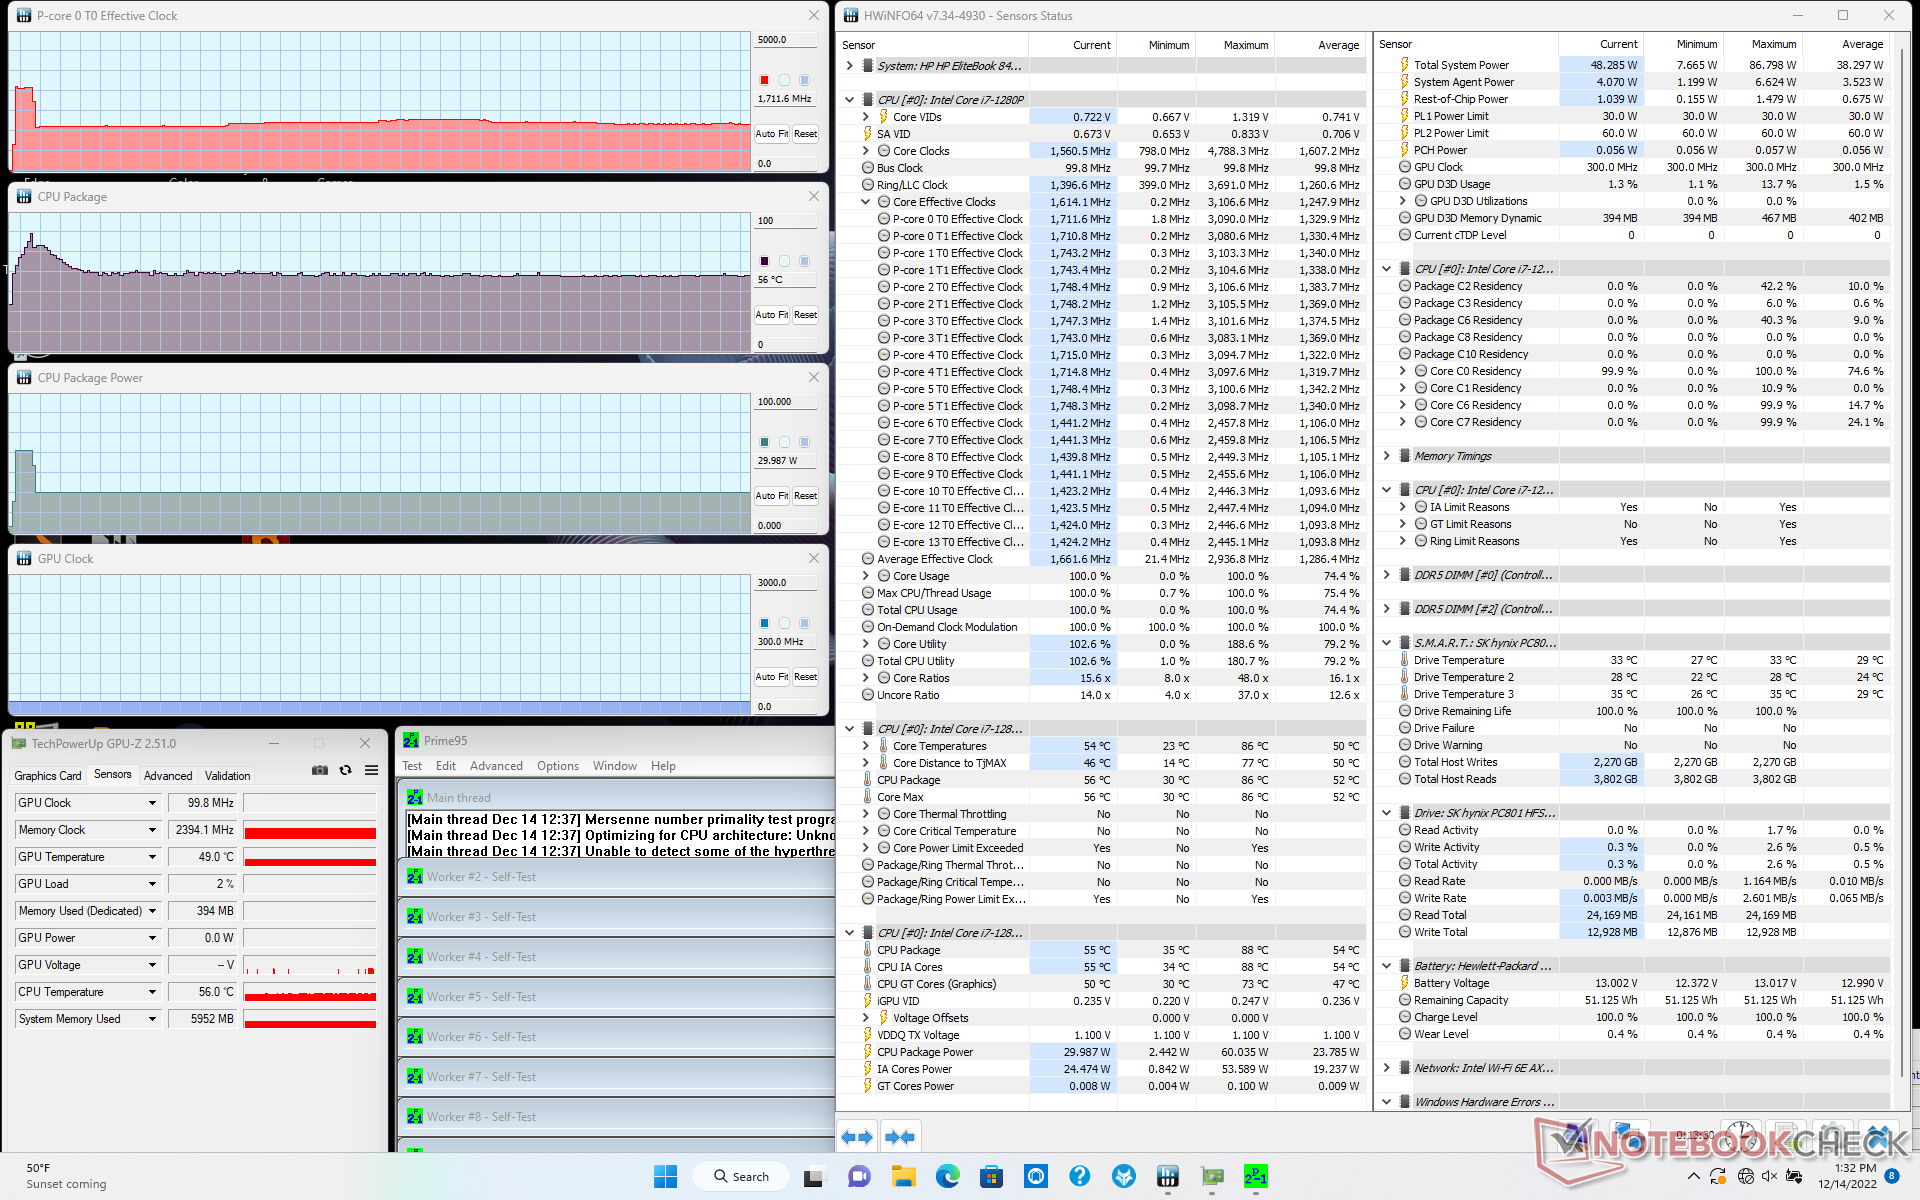
| CPU-klocka (GHz) | GPU-klocka (MHz) | Genomsnittlig CPU-temperatur (°C) | |
| Systemets tomgång | -- | -- | 32 |
| Prime95 Stress | 1.7 | -- | 56 |
| Prime95 + FurMark Stress | 1.4 | 599 | 58 |
| Witcher 3 Stress | ~0,8 | 1397 | 66 |
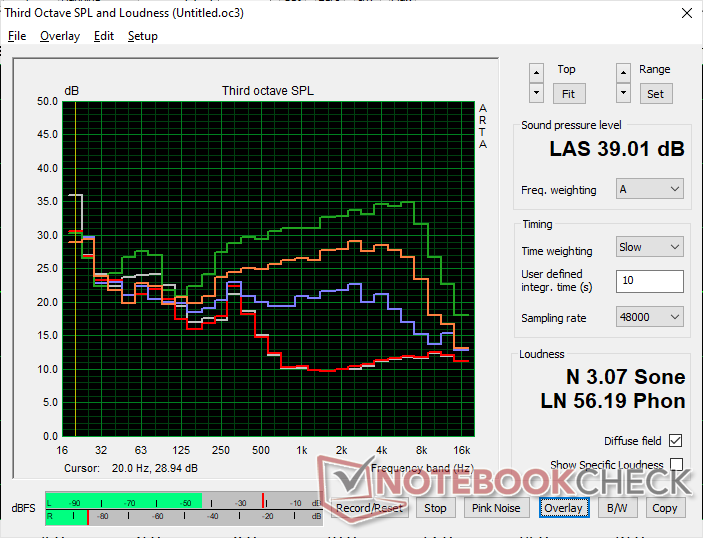
Högtalare
HP EliteBook 840 G9 ljudanalys
(±) | högtalarljudstyrkan är genomsnittlig men bra (80.5 dB)
Bas 100 - 315 Hz
(±) | reducerad bas - i genomsnitt 12.6% lägre än medianen
(±) | linjäriteten för basen är genomsnittlig (12.4% delta till föregående frekvens)
Mellan 400 - 2000 Hz
(+) | balanserad mellan - endast 4.6% från medianen
(+) | mids är linjära (3.9% delta till föregående frekvens)
Högsta 2 - 16 kHz
(+) | balanserade toppar - endast 2% från medianen
(+) | toppar är linjära (3.9% delta till föregående frekvens)
Totalt 100 - 16 000 Hz
(+) | det totala ljudet är linjärt (12.9% skillnad mot median)
Jämfört med samma klass
» 6% av alla testade enheter i den här klassen var bättre, 2% liknande, 91% sämre
» Den bästa hade ett delta på 7%, genomsnittet var 21%, sämst var 53%
Jämfört med alla testade enheter
» 12% av alla testade enheter var bättre, 3% liknande, 85% sämre
» Den bästa hade ett delta på 4%, genomsnittet var 23%, sämst var 134%
Apple MacBook Pro 16 2021 M1 Pro ljudanalys
(+) | högtalare kan spela relativt högt (84.7 dB)
Bas 100 - 315 Hz
(+) | bra bas - bara 3.8% från medianen
(+) | basen är linjär (5.2% delta till föregående frekvens)
Mellan 400 - 2000 Hz
(+) | balanserad mellan - endast 1.3% från medianen
(+) | mids är linjära (2.1% delta till föregående frekvens)
Högsta 2 - 16 kHz
(+) | balanserade toppar - endast 1.9% från medianen
(+) | toppar är linjära (2.7% delta till föregående frekvens)
Totalt 100 - 16 000 Hz
(+) | det totala ljudet är linjärt (4.6% skillnad mot median)
Jämfört med samma klass
» 0% av alla testade enheter i den här klassen var bättre, 0% liknande, 100% sämre
» Den bästa hade ett delta på 5%, genomsnittet var 17%, sämst var 45%
Jämfört med alla testade enheter
» 0% av alla testade enheter var bättre, 0% liknande, 100% sämre
» Den bästa hade ett delta på 4%, genomsnittet var 23%, sämst var 134%
Energiförvaltning
Effektförbrukning
Vår jämförelsetabell nedan visar att AMD-versionen är mer krävande än vår Intel-enhet. Skillnaden beror dock till stor del på att vår AMD-version har en 1000-nit-panel, medan vår Intel-version har en mindre krävande 400-nit-panel. Om man kör på skrivbordet med maximal ljusstyrka skulle det förbruka cirka 9 W och 18 W för Intel- och AMD-enheterna. När man tar hänsyn till detta blir de totala skillnaderna i strömförbrukning mellan de två modellerna mindre, trots alla deras prestandaskillnader.
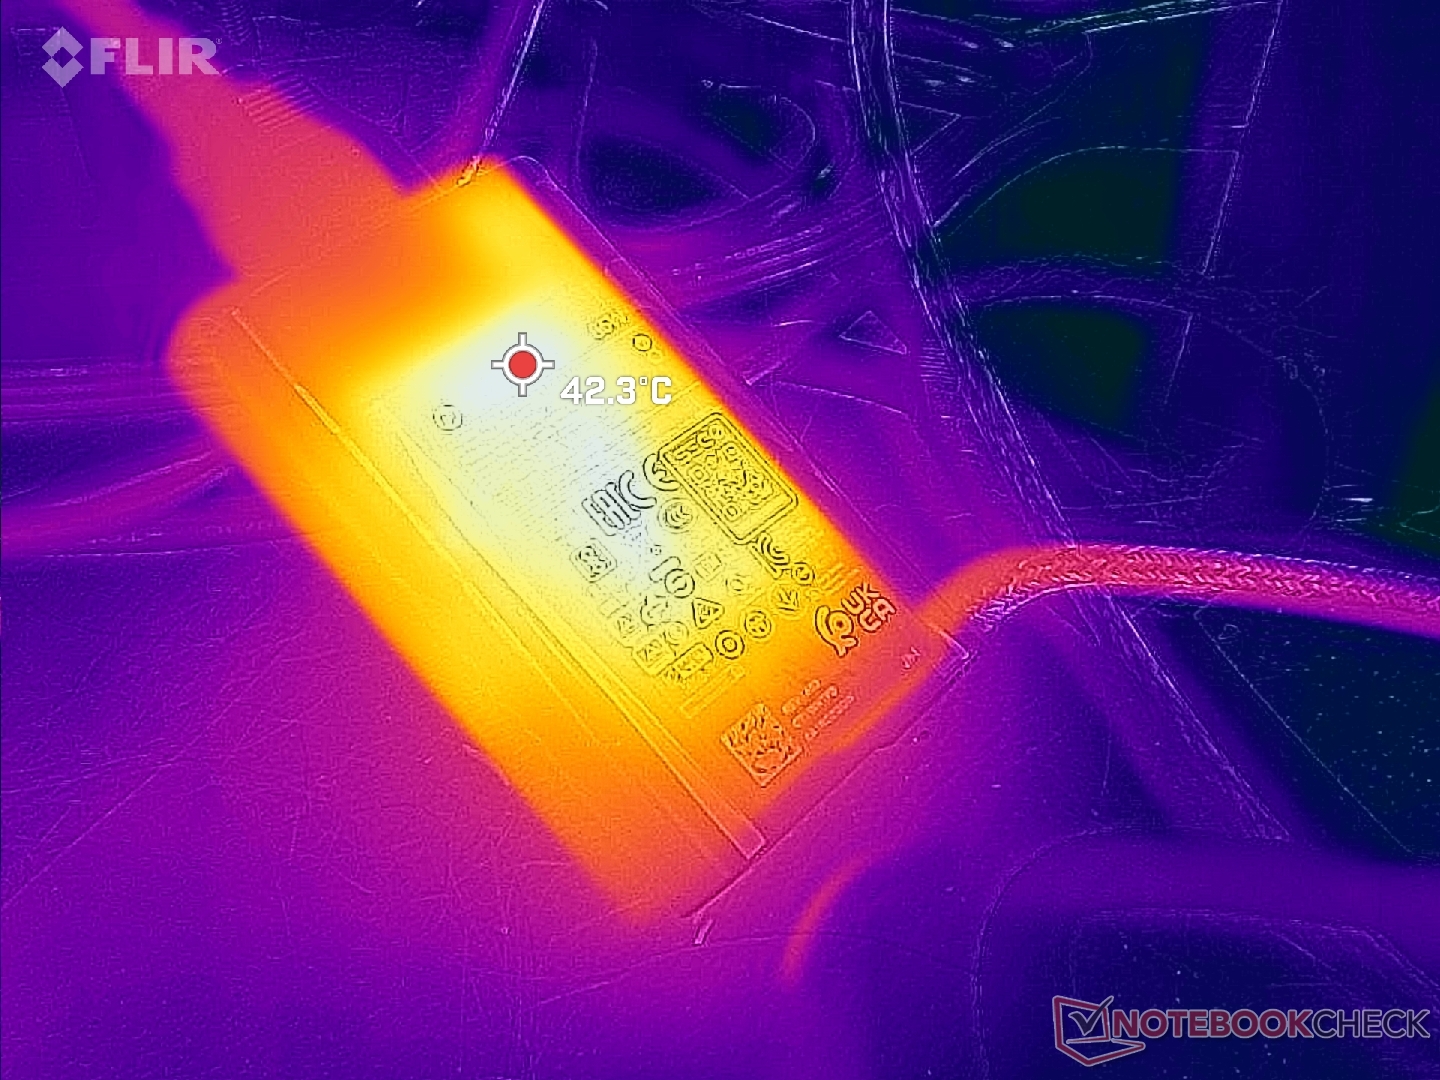
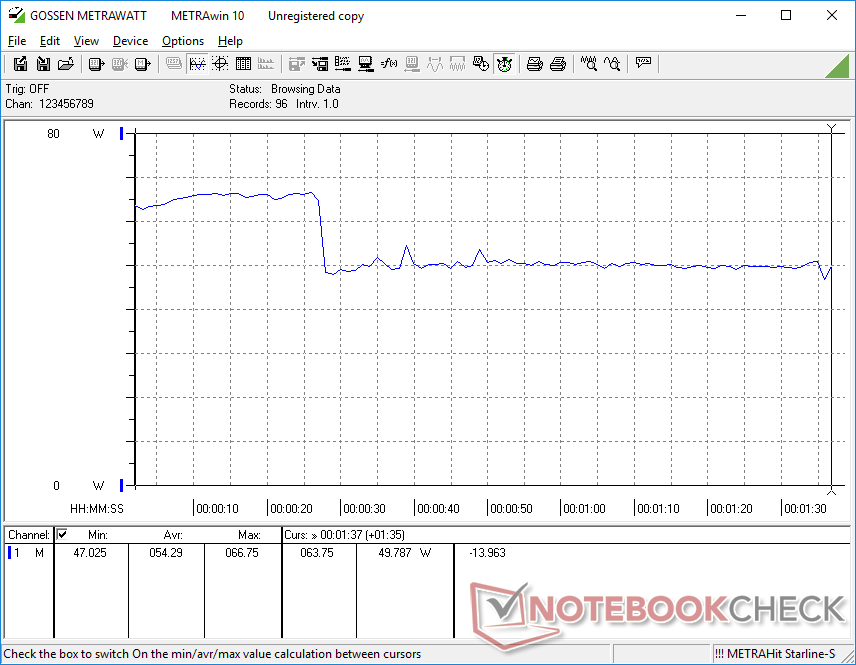
Vi kan registrera ett maximalt uttag på 68 W från den lilla (~8,8 x 5,3 x 2,1 cm) 65 W AC-adaptern när vi kör Prime95 stress. Denna hastighet är endast tillfällig som framgår av graferna nedan på grund av termiska begränsningar.
| Av/Standby | |
| Låg belastning | |
| Hög belastning |
|
Förklaring:
min: | |
| HP EliteBook 840 G9 i7-1280P, Iris Xe G7 96EUs, SK hynix PC801 HFS512GEJ9X101N BF, IPS, 1920x1200, 14" | HP EliteBook 845 G9 6F6H6EA R9 PRO 6950HS, Radeon 680M, WDC PC SN810 1TB, IPS, 1920x1200, 14" | HP EliteBook 840 Aero G8 3E4Q6AA i7-1185G7, Iris Xe G7 96EUs, SK Hynix PC711 512GB HFS512GDE9X073N, IPS, 1920x1080, 14" | Lenovo ThinkPad X1 Carbon G10 Core i7-1265U i7-1265U, Iris Xe G7 96EUs, Kioxia BG5 KBG5AZNV1T02, IPS, 1920x1200, 14" | LG Gram 14Z90Q i5-1240P, Iris Xe G7 80EUs, Samsung PM9A1 MZVL2512HCJQ, IPS, 1920x1200, 14" | Dell Latitude 7420 JW6MH i5-1145G7, Iris Xe G7 80EUs, SK Hynix BC711 HFM512GD3HX015N, IPS, 1920x1080, 14" | |
|---|---|---|---|---|---|---|
| Power Consumption | -80% | 5% | -8% | -5% | 8% | |
| Idle Minimum * (Watt) | 2.2 | 6.4 -191% | 3.2 -45% | 2.8 -27% | 3 -36% | 2.7 -23% |
| Idle Average * (Watt) | 5.3 | 12.4 -134% | 5.4 -2% | 6 -13% | 6 -13% | 6 -13% |
| Idle Maximum * (Watt) | 8.5 | 18 -112% | 6.9 19% | 10.9 -28% | 12 -41% | 7.6 11% |
| Load Average * (Watt) | 54.3 | 63 -16% | 38.9 28% | 51.8 5% | 40 26% | 37 32% |
| Witcher 3 ultra * (Watt) | 51 | 63.6 -25% | 37 27% | 51.6 -1% | 36.5 28% | 33.2 35% |
| Load Maximum * (Watt) | 67.3 | 68 -1% | 66.5 1% | 55.6 17% | 63 6% | 65 3% |
* ... mindre är bättre
Power Consumption Witcher 3 / Stresstest
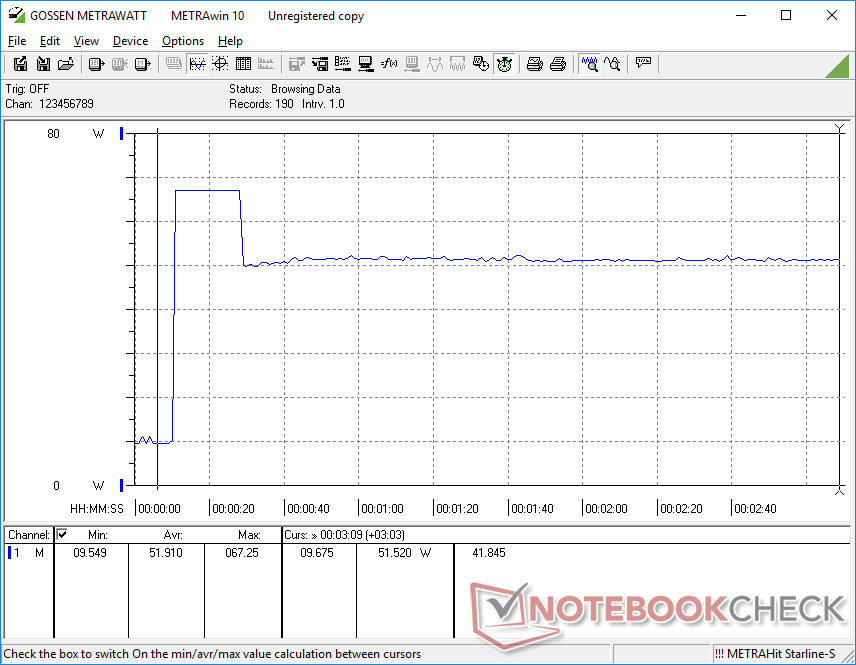
Power Consumption external Monitor
Batteritid - Lite kortare än AMD
WLAN-drifttiden är nästan två timmar kortare än vad vi registrerade på den AMD-drivna EliteBook 845 G9 när båda är inställda på 150 nit ljusstyrka och balanserad strömprofil. Trots detta bör 7,5 timmars kontinuerlig surfning vara tillfredsställande för de flesta användare.
Laddningen från tom till full kapacitet går snabbt på cirka 90 minuter. USB-C-laddare från tredje part stöds tekniskt sett, men många av dem fungerar inte garanterat om deras utgångsnivåer inte matchar den medföljande HP-laddaren (20 V/3,25 A).
| HP EliteBook 840 G9 i7-1280P, Iris Xe G7 96EUs, 51 Wh | HP EliteBook 845 G9 6F6H6EA R9 PRO 6950HS, Radeon 680M, 51 Wh | HP EliteBook 840 Aero G8 3E4Q6AA i7-1185G7, Iris Xe G7 96EUs, 53 Wh | Lenovo ThinkPad X1 Carbon G10 Core i7-1265U i7-1265U, Iris Xe G7 96EUs, 57 Wh | LG Gram 14Z90Q i5-1240P, Iris Xe G7 80EUs, 72 Wh | Dell Latitude 7420 JW6MH i5-1145G7, Iris Xe G7 80EUs, 63 Wh | |
|---|---|---|---|---|---|---|
| Batteridrifttid | 22% | 50% | -13% | 57% | 86% | |
| WiFi v1.3 (h) | 7.6 | 9.3 22% | 11.4 50% | 6.6 -13% | 11.9 57% | 14.1 86% |
| Load (h) | 1.3 | 2.5 | 2.8 | 2.6 | ||
| Reader / Idle (h) | 24.8 | 28.9 | 23.5 |
För
Emot
Omdöme - Fördelar och nackdelar
Kan Core i7-1280P EliteBook 840 G9 hålla stånd mot Ryzen 9 Pro 6950HS? EliteBook 845 G9? När det gäller rå CPU-potential är AMD-modellen det bästa alternativet eftersom prestandan inte stryps lika mycket som på Intel-modellen. När det gäller grafikprestanda verkar dock Radeon 680M i AMD-modellen underprestera till den grad att den hamnar bakom Iris Xe 96 EUs. Det bättre alternativet beror alltså på hur CPU- eller GPU-intensiva dina specifika arbetsbelastningar kan vara.
Förutom skillnaderna i processorerna är batteritiden längre på AMD-modellen medan Intel-modellen har Thunderbolt-stöd. Det är olyckligt att Sure View är tvingat på alla 1000-nit-panelalternativ eftersom vissa användare kanske inte vill ha sekretessfunktionen alls på grund av dess inverkan på bildkvaliteten även när den är avstängd. För framtida modeller skulle vi gärna se paneler med snabbare svarstider för att minska ghosting och kanske ett högre kärntemperaturtak för att pressa ut mer Turbo Boost-prestanda ur Intel-processorn.
Pris och tillgänglighet
HP levererar nu eliteBook 840 G9 från 2 200 USD för baskonfigurationen eller runt 3 000 USD för vår specifika testkonfiguration. Priserna på kan dock börja mycket lägre för förkonfigurerade SKU:er utan alla anpassningar som användaren kan välja.
HP EliteBook 840 G9
- 12/17/2022 v7 (old)
Allen Ngo
Price comparison

