NVIDIA GeForce RTX 2080 Super Max-Q
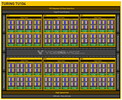
NVIDIA GeForce RTX 2080 Super med en Max-Q design är en energibesparande variant av mobila GeForce RTX 2080 Super som har reducerad klockfrekvens, prestanda och förstås energiförbrukning. Den är tänkt för tunna spellaptops och är baserad på samma TU104-chip med 3072 shaders, 8 GB GDDR6-minne och en 256-bit minnesbuss.
För tillfället ser det ut att finnas tre varianter med ett TGP-värde på 80, 85 och 90 Watt. Klockfrekvensen varierar mellan 745 - 975 MHz för basklockfrekvensen och 1080 - 1230 för boost.
I och med den här uppfräschningen har Nvidia också arbetat om Max-Q tekniken till att bli mer effektiv. Lågvolts-GDDR6 (lägre klockfrekvens men mer utrymme för GPU:n) och förbättrad reguleringseffektivitet borde förbättra prestandan per Watt. Två nya funktioner finns också som tillval för tillverkaren. Max-Q Dynamic Boost kan skicka energi från CPU:n till GPU:n beroende på varje individuell frame för att öka den totala prestandan. Vidare går det att implementera Advanced Optimus med dynamiskt skärmbyte (i hårdvaran) för att slå på Optimus, G-Sync och hög bilduppdatering (upp till 4K 120 Hz).
NVIDIA tillverkar TU103-chippet i en 12 nm FinFET-process och inkluderar funktioner som Deep Learning Super Sampling (DLSS) och Real-Time Ray Tracing (RTRT), vilket tillsammans borde ge mer realistiska ljuseffekter än äldre grafikchip baserade på Nvidias Pascal-arkitektur (om spelet har stöd för det). RTX 2080 Super Max-Q är också redo för DisplayPort 1.4 och har stöd för HDMI 2.0b, HDR, Simultaneous Multi-Projection (SMP) och H.265-video kodning/avkodning (PlayReady 3.0).
På grund av lägre klockfrekvenser är Max-Q varianten tydligt långsammare än mobila RTX 2080 Super. I våra prestandatester av de första enheterna var prestandan väldigt lik det äldre RTX 2080 Max-Q och bara i nivå med icke-Max-Q versionen av RTX 2070. Således är prestandan perfekt för att spela i 1440p med maximala detaljer i krävande spel som Red Dead Redemption 2, Control eller Borderlands 3. Mindre krävande spel som F1 2019 går att spela i 4K med maximala inställningar. Detaljerade prestandatester för spel finns i slutet av den här sidan.
Kortets energiförbrukning ligger mellan 80 - 90 Watt TGP, vilket är betydligt lägre än RTX 2080 Super Mobile (150 - 200 Watt).
GeForce RTX 2000 Serie NVIDIA Titan RTX 4608 @ 1.35 - 1.77 GHz 384 Bit @ 14000 MHz GeForce RTX 2080 Ti (Desktop) 4352 @ 1.35 - 1.55 GHz 352 Bit @ 14000 MHz GeForce RTX 2080 Super (Desktop) 3072 @ 1.65 - 1.82 GHz 256 Bit @ 15500 MHz GeForce RTX 2080 (Desktop) 2944 @ 1.52 - 1.71 GHz 256 Bit @ 14000 MHz GeForce RTX 2080 Super Mobile 3072 @ 1.37 - 1.56 GHz 256 Bit @ 14000 MHz GeForce RTX 2080 Mobile 2944 @ 1.38 - 1.59 GHz 256 Bit @ 14000 MHz GeForce RTX 2070 Super (Desktop) 2560 @ 1.61 - 1.77 GHz 256 Bit @ 14000 MHz GeForce RTX 2070 (Desktop) 2304 @ 1.41 - 1.62 GHz 256 Bit @ 14000 MHz GeForce RTX 2070 Super Mobile 2560 @ 1.14 - 1.38 GHz 256 Bit @ 14002 MHz GeForce RTX 2080 Super Max-Q 3072 @ 0.98 - 1.23 GHz 256 Bit @ 11000 MHz GeForce RTX 2080 Max-Q 2944 @ 0.74 - 1.1 GHz 256 Bit @ 12000 MHz GeForce RTX 2060 Super (Desktop) 2176 @ 1.47 - 1.65 GHz 256 Bit @ 14000 MHz GeForce RTX 2070 Mobile 2304 @ 1.22 - 1.44 GHz 256 Bit @ 14000 MHz GeForce RTX 2060 (Desktop) 1920 @ 1.32 - 1.62 GHz 192 Bit @ 14000 MHz GeForce RTX 2070 Super Max-Q 2560 @ 0.93 - 1.16 GHz 256 Bit @ 11000 MHz GeForce RTX 2070 Max-Q 2304 @ 0.89 - 1.19 GHz 256 Bit @ 12000 MHz GeForce RTX 2060 Mobile 1920 @ 0.96 - 1.2 GHz 192 Bit @ 14000 MHz GeForce RTX 2060 Max-Q 1920 @ 0.98 - 1.19 GHz 192 Bit @ 11000 MHz GeForce RTX 2050 Mobile 2048 @ 1.48 GHz 64 Bit @ 14000 MHz
Kodnamn N18E-G3 Arkitektur Turing Pipelines 3072 - unified Kärnhastighet 975 - 1230 (Boost) MHz Minneshastighet 11000 MHz Minnesbuss 256 Bit Minnestyp GDDR6 Max. minne 8 GB Delat minne nej API DirectX 12_1, OpenGL 4.6 Strömförbrukning 90 Watt Antal transistorer 13.6 Billion Teknologi 12 nm Funktioner NVLink, DLSS, Raytraycing, VR Ready, G-SYNC, Vulkan, Multi Monitor, 650 Watt system power recommended Laptopstorlek stor Lanseringsdatum 02.04.2020
Prestandatester 3DMark - 3DMark Time Spy Score
min: 7475 avg: 8204 median: 8075 (41%) max: 9051 Points
GPU TDP ? TDP 91 W 95% 100%
Intel UHD Graphics 605 -98%
...
NVIDIA GeForce RTX 2070 Max-Q -18%
NVIDIA Quadro RTX 5000 Max-Q -11%
NVIDIA Quadro RTX 4000 (Laptop) -10%
NVIDIA GeForce RTX 2070 Mobile -8%
NVIDIA GeForce RTX 2070 Super Max-Q -7%
NVIDIA GeForce RTX 2080 Max-Q -7%
NVIDIA GeForce RTX 2080 Super Max-Q
NVIDIA GeForce RTX 2070 Super Mobile 1%
NVIDIA GeForce GTX 1070 SLI (Laptop) 8%
NVIDIA Quadro RTX 5000 (Laptop) 10%
NVIDIA GeForce RTX 2080 Mobile 17%
NVIDIA GeForce GTX 1080 SLI (Laptop) 22%
...
NVIDIA Quadro RTX 6000 (Laptop) 35%
3DMark - 3DMark Time Spy Graphics
min: 7372 avg: 8210 median: 8331 (38%) max: 8979 Points
GPU TDP ? TDP 91 W 96% 100%
Intel UHD Graphics 605 -99%
...
NVIDIA GeForce GTX 1080 Mobile -16%
NVIDIA Quadro RTX 4000 (Laptop) -11%
NVIDIA Quadro RTX 5000 Max-Q -9%
NVIDIA GeForce RTX 2070 Super Max-Q -9%
NVIDIA GeForce RTX 2070 Mobile -7%
NVIDIA GeForce RTX 2080 Max-Q -4%
NVIDIA GeForce RTX 2080 Super Max-Q
NVIDIA GeForce RTX 2070 Super Mobile 0%
NVIDIA Quadro RTX 5000 (Laptop) 14%
NVIDIA GeForce RTX 2080 Mobile 22%
NVIDIA GeForce RTX 2080 Super Mobile 25%
...
NVIDIA GeForce GTX 1080 SLI (Laptop) 54%
3DMark - 3DMark Ice Storm Unlimited Graphics
min: 443119 avg: 465029 median: 468363 (62%) max: 483604 Points
...
NVIDIA GeForce GTX 1650 Ti Max-Q -9%
NVIDIA Quadro RTX 5000 Max-Q -8%
NVIDIA GeForce GTX 1080 SLI (Laptop) -5%
NVIDIA GeForce RTX 2070 Mobile -4%
NVIDIA Quadro RTX 4000 (Laptop) -4%
NVIDIA GeForce RTX 2070 Super Max-Q -1%
NVIDIA GeForce RTX 2080 Mobile 0%
NVIDIA GeForce RTX 2080 Super Max-Q
NVIDIA GeForce RTX 2070 Super Mobile 1%
NVIDIA Quadro RTX 5000 (Laptop) 8%
3DMark - 3DMark Cloud Gate Score
min: 32880 avg: 42751 median: 44534 (54%) max: 53680 Points
Intel Graphics Media Accelerator (GMA) 4500MHD -100%
...
NVIDIA Quadro RTX 3000 (Laptop) -17%
NVIDIA GeForce RTX 2070 Max-Q -15%
NVIDIA GeForce RTX 2070 Mobile -10%
NVIDIA GeForce GTX 1080 SLI (Laptop) -10%
NVIDIA Quadro RTX 4000 (Laptop) -9%
NVIDIA Quadro RTX 5000 (Laptop) -8%
NVIDIA GeForce RTX 2080 Super Max-Q
NVIDIA Quadro P5200 2%
NVIDIA GeForce RTX 2070 Super Mobile 5%
NVIDIA GeForce RTX 2070 Super Max-Q 7%
NVIDIA GeForce RTX 2080 Mobile 8%
...
3DMark - 3DMark Cloud Gate Graphics
min: 101976 avg: 126108 median: 127741 (52%) max: 140750 Points
Intel Graphics Media Accelerator (GMA) 4500MHD -100%
...
NVIDIA GeForce RTX 2070 Mobile -7%
NVIDIA Quadro RTX 4000 (Laptop) -6%
NVIDIA GeForce RTX 2070 Super Mobile -3%
NVIDIA GeForce GTX 1080 Mobile -1%
NVIDIA GeForce RTX 2080 Super Max-Q
NVIDIA GeForce RTX 2080 Mobile 8%
NVIDIA GeForce RTX 2080 Super Mobile 11%
NVIDIA GeForce GTX 1070 SLI (Laptop) 22%
NVIDIA GeForce GTX 1080 SLI (Laptop) 37%
...
3DMark - 3DMark Fire Strike Standard Score
min: 17053 avg: 18565 median: 18578.5 (45%) max: 20173 Points
GPU TDP ? TDP 91 W 96% 100%
...
NVIDIA Quadro RTX 5000 Max-Q -10%
NVIDIA Quadro RTX 4000 (Laptop) -9%
NVIDIA GeForce GTX 1080 Mobile -8%
NVIDIA GeForce RTX 2070 Mobile -5%
NVIDIA GeForce RTX 2080 Max-Q -4%
NVIDIA GeForce RTX 2070 Super Max-Q -3%
NVIDIA GeForce RTX 2080 Super Max-Q
NVIDIA GeForce RTX 2070 Super Mobile 0%
NVIDIA Quadro RTX 5000 (Laptop) 2%
NVIDIA GeForce RTX 2080 Mobile 12%
NVIDIA GeForce GTX 1070 SLI (Laptop) 12%
NVIDIA GeForce RTX 2080 Super Mobile 16%
...
3DMark - 3DMark Fire Strike Standard Graphics
min: 19655 avg: 21743 median: 21902.5 (36%) max: 23649 Points
GPU TDP ? TDP 91 W 96% 100%
...
NVIDIA Quadro RTX 4000 (Laptop) -13%
NVIDIA Quadro RTX 5000 Max-Q -9%
NVIDIA GeForce RTX 2070 Mobile -7%
NVIDIA GeForce RTX 2070 Super Max-Q -7%
NVIDIA GeForce RTX 2080 Max-Q -5%
NVIDIA GeForce GTX 1080 Mobile -2%
NVIDIA GeForce RTX 2080 Super Max-Q
NVIDIA GeForce RTX 2070 Super Mobile 0%
NVIDIA Quadro RTX 5000 (Laptop) 6%
NVIDIA GeForce RTX 2080 Super Mobile 15%
NVIDIA GeForce RTX 2080 Mobile 16%
...
NVIDIA GeForce GTX 1080 SLI (Laptop) 84%
3DMark 11 - 3DM11 Performance Score
min: 20888 avg: 23821 median: 24119 (49%) max: 26066 Points
GPU TDP ? TDP 91 W 90% 100%
...
NVIDIA Quadro RTX 4000 (Laptop) -9%
NVIDIA Quadro P5200 -9%
NVIDIA Quadro RTX 5000 (Laptop) -8%
NVIDIA GeForce RTX 2070 Super Max-Q -3%
NVIDIA GeForce RTX 2070 Super Mobile 0%
NVIDIA GeForce RTX 2080 Super Max-Q
NVIDIA GeForce GTX 1070 SLI (Laptop) 0%
NVIDIA GeForce GTX 1080 SLI (Laptop) 7%
NVIDIA GeForce RTX 2080 Mobile 9%
NVIDIA GeForce RTX 2080 Super Mobile 21%
...
3DMark 11 - 3DM11 Performance GPU
min: 26292 avg: 29663 median: 29636.5 (42%) max: 32995 Points
GPU TDP ? TDP 91 W 95% 100%
...
NVIDIA GeForce RTX 2070 Mobile -13%
NVIDIA Quadro RTX 5000 (Laptop) -13%
NVIDIA Quadro RTX 5000 Max-Q -10%
NVIDIA GeForce RTX 2070 Super Max-Q -9%
NVIDIA GeForce RTX 2080 Max-Q -6%
NVIDIA GeForce GTX 1080 Mobile -5%
NVIDIA GeForce RTX 2070 Super Mobile -1%
NVIDIA GeForce RTX 2080 Super Max-Q
NVIDIA GeForce RTX 2080 Super Mobile 19%
NVIDIA GeForce RTX 2080 Mobile 19%
...
3DMark Vantage 3DM Vant. Perf. total + 3DMark Vantage - 3DM Vant. Perf. total
60306 Points (17%)
...
NVIDIA GeForce RTX 2080 Max-Q -14%
NVIDIA Quadro RTX 5000 Max-Q -12%
NVIDIA GeForce GTX 1080 SLI (Laptop) -9%
NVIDIA Quadro RTX 4000 (Laptop) -7%
NVIDIA GeForce GTX 1070 SLI (Laptop) -6%
NVIDIA GeForce RTX 2080 Super Max-Q
NVIDIA GeForce RTX 2070 Mobile 6%
NVIDIA GeForce RTX 2070 Super Max-Q 8%
NVIDIA Quadro P5200 9%
NVIDIA GeForce RTX 2080 Mobile 14%
NVIDIA GeForce RTX 2080 Super Mobile 16%
NVIDIA GeForce RTX 2070 Super Mobile 17%
...
3DM Vant. Perf. GPU no PhysX + 3DMark Vantage - 3DM Vant. Perf. GPU no PhysX
69467 Points (53%)
...
NVIDIA Quadro RTX 4000 (Laptop) -10%
NVIDIA Quadro RTX 5000 Max-Q -10%
NVIDIA GeForce GTX 1080 Mobile -9%
NVIDIA GeForce RTX 2070 Mobile -2%
NVIDIA Quadro P5200 -1%
NVIDIA GeForce RTX 2070 Super Max-Q 0%
NVIDIA GeForce RTX 2080 Super Max-Q
NVIDIA GeForce GTX 1080 SLI (Laptop) 7%
NVIDIA GeForce RTX 2080 Mobile 8%
NVIDIA GeForce RTX 2070 Super Mobile 9%
NVIDIA GeForce RTX 2080 Super Mobile 11%
NVIDIA GeForce GTX 1070 SLI (Laptop) 12%
...
3DMark 06 3DMark 06 - Standard 1280x1024 +
38265 Points (58%)
Intel Graphics Media Accelerator (GMA) 500 -100%
...
AMD Radeon RX 5300M -6%
NVIDIA GeForce RTX 2070 Max-Q -5%
NVIDIA Quadro T2000 Max-Q -5%
NVIDIA Quadro RTX 3000 (Laptop) -3%
NVIDIA GeForce RTX 2080 Max-Q -2%
NVIDIA GeForce RTX 2080 Super Max-Q
NVIDIA Quadro RTX 5000 Max-Q 6%
NVIDIA GeForce RTX 2080 Mobile 9%
NVIDIA GeForce RTX 2080 Super Mobile 9%
NVIDIA GeForce RTX 2070 Mobile 10%
NVIDIA GeForce RTX 2070 Super Mobile 12%
...
SPECviewperf 13 specvp13 sw-04 + SPECviewperf 13 - specvp13 sw-04
min: 88.7 avg: 88.8 median: 88.8 (41%) max: 88.9 fps
Intel Iris Plus Graphics G7 (Ice Lake 64 EU) -92%
...
AMD Radeon Pro Vega 20 -14%
AMD Radeon Pro Vega 16 -12%
NVIDIA Quadro P1000 -9%
NVIDIA T500 Laptop GPU -9%
NVIDIA GeForce RTX 2070 Mobile -9%
NVIDIA Quadro P620 -8%
NVIDIA GeForce RTX 2070 Super Max-Q -3%
NVIDIA GeForce RTX 2080 Super Mobile -1%
NVIDIA GeForce RTX 2080 Super Max-Q
NVIDIA GeForce RTX 2080 Max-Q 1%
NVIDIA GeForce RTX 2070 Super Mobile 3%
NVIDIA GeForce RTX 2080 Mobile 6%
NVIDIA Quadro P2000 8%
NVIDIA Quadro T1000 (Laptop) 12%
NVIDIA Quadro T2000 Max-Q 13%
...
NVIDIA Quadro RTX 6000 (Laptop) 144%
specvp13 snx-03 + SPECviewperf 13 - specvp13 snx-03
min: 20.88 avg: 21.1 median: 21.1 (3%) max: 21.33 fps
Intel Iris Xe MAX Graphics -92%
...
NVIDIA GeForce RTX 2070 Mobile -26%
AMD Radeon RX Vega 10 -22%
NVIDIA GeForce RTX 2070 Super Max-Q -6%
NVIDIA GeForce RTX 2070 Super Mobile -5%
NVIDIA GeForce RTX 2080 Max-Q -4%
NVIDIA GeForce RTX 2080 Super Max-Q
NVIDIA GeForce RTX 2080 Mobile 1%
AMD Radeon Pro Vega 16 60%
AMD Radeon Pro Vega 20 69%
NVIDIA Quadro P520 127%
AMD Radeon Pro WX 3200 174%
AMD Radeon RX Vega 7 203%
...
NVIDIA Quadro P5200 1755%
specvp13 showcase-02 + SPECviewperf 13 - specvp13 showcase-02
96.2 fps (31%)
...
NVIDIA Quadro P5200 -22%
NVIDIA Quadro RTX 3000 (Laptop) -18%
NVIDIA GeForce RTX 2070 Max-Q -5%
NVIDIA Quadro RTX 4000 Max-Q -3%
NVIDIA Quadro RTX 5000 Max-Q -1%
NVIDIA GeForce RTX 2080 Max-Q -1%
NVIDIA GeForce RTX 2070 Super Max-Q -1%
NVIDIA GeForce RTX 2080 Super Max-Q
NVIDIA Quadro RTX 4000 (Laptop) 1%
NVIDIA GeForce RTX 2070 Mobile 6%
NVIDIA Quadro RTX 5000 (Laptop) 9%
NVIDIA GeForce RTX 2080 Super Mobile 15%
NVIDIA GeForce RTX 2070 Super Mobile 17%
NVIDIA GeForce RTX 2080 Mobile 24%
...
specvp13 medical-02 + SPECviewperf 13 - specvp13 medical-02
min: 53.1 avg: 55.5 median: 55.5 (30%) max: 57.9 fps
...
NVIDIA Quadro T1000 (Laptop) -25%
NVIDIA GeForce RTX 2070 Max-Q -21%
NVIDIA Quadro T2000 Max-Q -19%
NVIDIA GeForce RTX 2070 Super Max-Q -9%
NVIDIA GeForce RTX 2070 Mobile -6%
NVIDIA GeForce RTX 2080 Super Max-Q
NVIDIA GeForce RTX 2080 Max-Q 1%
NVIDIA GeForce RTX 2070 Super Mobile 1%
NVIDIA Quadro RTX 3000 (Laptop) 8%
NVIDIA GeForce RTX 2080 Super Mobile 9%
NVIDIA Quadro P5200 11%
NVIDIA GeForce RTX 2080 Mobile 14%
...
specvp13 maya-05 + SPECviewperf 13 - specvp13 maya-05
min: 210.2 avg: 212.8 median: 212.8 (38%) max: 215.4 fps
Intel Iris Plus Graphics G7 (Ice Lake 64 EU) -91%
...
NVIDIA Quadro RTX 3000 (Laptop) -14%
NVIDIA Quadro RTX 4000 Max-Q -13%
NVIDIA GeForce RTX 2080 Super Mobile -5%
NVIDIA Quadro RTX 5000 Max-Q -3%
NVIDIA GeForce RTX 2070 Super Max-Q -1%
NVIDIA GeForce RTX 2080 Super Max-Q
NVIDIA GeForce RTX 2070 Super Mobile 6%
NVIDIA Quadro RTX 5000 (Laptop) 10%
NVIDIA Quadro RTX 4000 (Laptop) 16%
NVIDIA GeForce RTX 2070 Mobile 19%
NVIDIA Quadro P5200 19%
NVIDIA GeForce RTX 2080 Max-Q 20%
...
NVIDIA GeForce RTX 2080 Mobile 42%
specvp13 energy-02 + SPECviewperf 13 - specvp13 energy-02
min: 17.49 avg: 17.7 median: 17.7 (13%) max: 17.92 fps
...
NVIDIA Quadro T1000 (Laptop) -15%
NVIDIA Quadro T2000 Max-Q -14%
NVIDIA GeForce RTX 2080 Max-Q -10%
NVIDIA Quadro P5200 -3%
NVIDIA GeForce RTX 2070 Max-Q -3%
NVIDIA GeForce RTX 2080 Super Max-Q
NVIDIA GeForce RTX 2070 Super Max-Q 6%
NVIDIA GeForce RTX 2070 Mobile 14%
NVIDIA GeForce RTX 2070 Super Mobile 22%
NVIDIA GeForce RTX 2080 Mobile 25%
NVIDIA GeForce RTX 2080 Super Mobile 26%
...
specvp13 creo-02 + SPECviewperf 13 - specvp13 creo-02
min: 170 avg: 173.6 median: 173.6 (45%) max: 177.2 fps
Intel Iris Plus Graphics G7 (Ice Lake 64 EU) -99%
...
NVIDIA GeForce RTX 2070 Max-Q -22%
NVIDIA Quadro P3200 -10%
NVIDIA GeForce RTX 2070 Super Max-Q -4%
NVIDIA Quadro RTX 3000 Max-Q -4%
NVIDIA GeForce RTX 2070 Mobile -1%
NVIDIA GeForce RTX 2080 Super Mobile 0%
NVIDIA GeForce RTX 2080 Super Max-Q
NVIDIA GeForce RTX 2080 Max-Q 2%
NVIDIA GeForce RTX 2070 Super Mobile 2%
NVIDIA Quadro RTX 3000 (Laptop) 5%
NVIDIA Quadro RTX 4000 Max-Q 7%
...
NVIDIA Quadro P5200 41%
specvp13 catia-05 + SPECviewperf 13 - specvp13 catia-05
min: 132.3 avg: 136.4 median: 136.4 (29%) max: 140.4 fps
...
AMD Radeon Pro Vega 16 -23%
NVIDIA GeForce RTX 2070 Mobile -20%
AMD Radeon Pro Vega 20 -18%
NVIDIA GeForce RTX 2070 Super Max-Q -7%
NVIDIA GeForce RTX 2080 Max-Q -6%
NVIDIA Quadro T1000 (Laptop) -5%
NVIDIA GeForce RTX 2080 Super Max-Q
NVIDIA GeForce RTX 2070 Super Mobile 1%
NVIDIA Quadro T2000 Max-Q 2%
NVIDIA GeForce RTX 2080 Super Mobile 6%
NVIDIA GeForce RTX 2080 Mobile 9%
NVIDIA Quadro T2000 (Laptop) 20%
...
NVIDIA Quadro P5200 118%
specvp13 3dsmax-06 + SPECviewperf 13 - specvp13 3dsmax-06
min: 175.5 avg: 176.1 median: 176.1 (36%) max: 176.6 fps
...
NVIDIA GeForce RTX 2070 Max-Q -18%
NVIDIA Quadro P5200 -15%
NVIDIA Quadro RTX 4000 Max-Q -14%
NVIDIA Quadro RTX 3000 (Laptop) -11%
NVIDIA GeForce RTX 2070 Mobile -2%
NVIDIA Quadro RTX 5000 Max-Q -1%
NVIDIA GeForce RTX 2080 Super Max-Q
NVIDIA GeForce RTX 2070 Super Max-Q 0%
NVIDIA GeForce RTX 2080 Max-Q 0%
NVIDIA Quadro RTX 4000 (Laptop) 1%
NVIDIA GeForce RTX 2080 Super Mobile 5%
NVIDIA Quadro RTX 5000 (Laptop) 6%
NVIDIA GeForce RTX 2070 Super Mobile 7%
...
Cinebench R10 Cinebench R10 Shading (32bit) + Cinebench R10 - Cinebench R10 Shading (32bit)
13620 poäng (10%)
Intel Graphics Media Accelerator (GMA) 500 -100%
...
NVIDIA Quadro P4000 Max-Q -8%
AMD Radeon Pro 455 -6%
AMD Radeon 660M -5%
AMD Radeon RX Vega M GH -4%
NVIDIA Quadro P600 -3%
AMD Radeon Pro 460 0%
NVIDIA GeForce RTX 2080 Super Max-Q
AMD Radeon 680M 12%
...
Cinebench R11.5 Cinebench R11.5 OpenGL 64 Bit + Cinebench R11.5 - Cinebench R11.5 OpenGL 64 Bit
82.1 fps (30%)
Intel Graphics Media Accelerator (GMA) 4500MHD -99%
...
AMD Radeon Pro WX 3100 -7%
NVIDIA GeForce RTX 2080 Max-Q -6%
NVIDIA GeForce GTX 1080 Mobile -3%
NVIDIA GeForce GTX 1070 SLI (Laptop) -2%
NVIDIA GeForce RTX 2080 Super Max-Q
NVIDIA GeForce RTX 2070 Mobile 0%
NVIDIA Quadro K3100M 1%
NVIDIA GeForce GTX 1080 SLI (Laptop) 2%
...
Cinebench R15 Cinebench R15 OpenGL 64 Bit + Cinebench R15 - Cinebench R15 OpenGL 64 Bit
min: 114 avg: 140.1 median: 142 (38%) max: 152.1 fps
GPU TDP ? TDP 91 W 100% 98%
Intel Graphics Media Accelerator (GMA) 4500MHD -99%
...
NVIDIA GeForce RTX 2070 Mobile -6%
AMD Radeon Pro WX Vega M GL -5%
NVIDIA GeForce GTX 1650 Ti Max-Q -5%
NVIDIA Quadro P1000 -3%
NVIDIA Quadro P2000 Max-Q -2%
NVIDIA GeForce RTX 2080 Mobile -1%
NVIDIA GeForce RTX 2070 Super Max-Q 0%
NVIDIA Quadro P600 0%
NVIDIA GeForce RTX 2080 Super Max-Q
NVIDIA GeForce RTX 2070 Super Mobile 1%
NVIDIA GeForce GTX 1070 SLI (Laptop) 1%
AMD Radeon RX Vega M GH 3%
NVIDIA Quadro P620 14%
...
Cinebench R15 OpenGL Ref. Match 64 Bit + Cinebench R15 - Cinebench R15 OpenGL Ref. Match 64 Bit
99.6 % (100%)
GPU TDP ? TDP 91 W 100% 100%
...
NVIDIA GeForce GTX 1050 Max-Q 0%
NVIDIA GeForce RTX 2080 Super Max-Q
NVIDIA Quadro P3200 0%
NVIDIA Quadro T1000 (Laptop) 0%
NVIDIA Quadro RTX 4000 (Laptop) 0%
NVIDIA Quadro RTX 3000 (Laptop) 0%
...
GFXBench - GFXBench Car Chase Onscreen
217.4 fps (6%)
Intel HD Graphics (Cherry Trail) -97%
...
AMD Radeon RX 5300M -40%
NVIDIA GeForce RTX 2080 Max-Q -34%
NVIDIA GeForce RTX 2070 Mobile -34%
NVIDIA GeForce RTX 2080 Mobile -34%
NVIDIA Quadro RTX 5000 Max-Q -25%
NVIDIA GeForce GTX 1660 Ti Max-Q -22%
NVIDIA GeForce RTX 2080 Super Max-Q
NVIDIA GeForce RTX 2070 Super Mobile 6%
NVIDIA GeForce RTX 2080 Super Mobile 15%
GFXBench - GFXBench Car Chase Offscreen
368.4 fps (2%)
Intel HD Graphics 500 -98%
...
NVIDIA Quadro RTX 4000 (Laptop) -17%
NVIDIA Quadro RTX 5000 Max-Q -15%
Apple M1 Pro 14-Core GPU -14%
NVIDIA GeForce RTX 2080 Max-Q -12%
NVIDIA GeForce RTX 2070 Mobile -11%
NVIDIA GeForce GTX 1080 Mobile -10%
Apple M1 Pro 16-Core GPU -6%
NVIDIA GeForce RTX 2070 Super Max-Q -5%
NVIDIA GeForce RTX 2080 Super Max-Q
NVIDIA GeForce RTX 2080 Mobile 5%
NVIDIA GeForce RTX 2070 Super Mobile 9%
NVIDIA GeForce RTX 2080 Super Mobile 12%
Apple M1 Max 24-Core GPU 13%
NVIDIA Quadro RTX 5000 (Laptop) 18%
Apple M1 Max 32-Core GPU 19%
ComputeMark v2.1 - ComputeMark v2.1 Result
16221 poäng (31%)
...
NVIDIA Quadro RTX 4000 (Laptop) -16%
NVIDIA GeForce RTX 2070 Super Max-Q -14%
NVIDIA Quadro RTX 5000 Max-Q -13%
NVIDIA GeForce RTX 2070 Mobile -11%
NVIDIA GeForce RTX 2080 Max-Q -10%
NVIDIA GeForce RTX 2070 Super Mobile -4%
NVIDIA Quadro P5200 -2%
NVIDIA GeForce RTX 2080 Super Max-Q
NVIDIA GeForce GTX 1080 Mobile 1%
NVIDIA GeForce GTX 1080 SLI (Laptop) 2%
NVIDIA GeForce RTX 2080 Super Mobile 6%
NVIDIA GeForce RTX 2080 Mobile 12%
NVIDIA Quadro RTX 5000 (Laptop) 21%
...
Power Consumption - Furmark Stress Test Power Consumption - external Monitor *
161 Watt (25%)
Intel HD Graphics 500 -94%
...
NVIDIA Quadro RTX 4000 Max-Q -7%
NVIDIA GeForce RTX 2070 Max-Q -3%
NVIDIA GeForce RTX 2080 Super Max-Q
NVIDIA GeForce RTX 2070 Super Mobile 9%
NVIDIA GeForce RTX 2080 Mobile 29%
0 10 20 30 40 50 60 70 80 90 100 110 120 130 140 150 160 170 180 Tooltip
Power Consumption - The Witcher 3 Power Consumption - external Monitor *
149 Watt (21%)
...
AMD Radeon RX 5500M -17%
NVIDIA GeForce RTX 2080 Max-Q -12%
NVIDIA GeForce RTX 2080 Super Max-Q
NVIDIA Quadro RTX 4000 Max-Q 3%
NVIDIA GeForce RTX 2070 Super Max-Q 3%
NVIDIA GeForce RTX 2070 Max-Q 9%
...
NVIDIA GeForce GTX 1080 Mobile 48%
0 10 20 30 40 50 60 70 80 90 100 110 120 130 140 150 160 Tooltip
Power Consumption - Witcher 3 Power Consumption *
min: 140 avg: 150.1 median: 146.1 (32%) max: 170 Watt
GPU TDP ? TDP 91 W 103% 100%
Intel UHD Graphics 605 -92%
...
AMD Radeon RX 5500M -16%
NVIDIA Quadro RTX 3000 (Laptop) -4%
NVIDIA GeForce RTX 2070 Max-Q -1%
NVIDIA GeForce RTX 2080 Super Max-Q
NVIDIA Quadro RTX 5000 Max-Q 1%
NVIDIA GeForce RTX 2070 Super Max-Q 4%
NVIDIA Quadro RTX 4000 (Laptop) 6%
NVIDIA GeForce RTX 2080 Max-Q 8%
NVIDIA Quadro RTX 4000 Max-Q 12%
...
NVIDIA GeForce GTX 1080 SLI (Laptop) 178%
0 10 20 30 40 50 60 70 80 90 100 110 120 130 140 150 160 170 Tooltip
Power Consumption - Witcher 3 ultra Power Efficiency
min: 0.4418 avg: 0.6 median: 0.6 (0%) max: 0.635 Points per Watt
GPU TDP ? TDP 91 W 99% 100%
...
NVIDIA Quadro RTX 5000 Max-Q -6%
NVIDIA GeForce RTX 2080 Super Max-Q
Intel Iris Plus Graphics G7 (Ice Lake 64 EU) 301%
...
Power Consumption - Witcher 3 ultra Power Efficiency - external Monitor
0.6 Points per Watt (0%)
...
NVIDIA GeForce GTX 1660 Ti Max-Q -11%
NVIDIA GeForce RTX 2080 Super Max-Q
NVIDIA GeForce RTX 2080 Max-Q 0%
NVIDIA Quadro RTX 5000 Max-Q 15%
...
Clock Speed - GPU Clock Witcher 3 ultra
min: 1215 avg: 1371 median: 1387.5 (69%) max: 1506 MHz
GPU TDP ? TDP 91 W 89% 100%
AMD Radeon R7 (Bristol Ridge) -66%
...
NVIDIA GeForce RTX 2080 Max-Q -9%
NVIDIA Quadro P4000 Max-Q -9%
NVIDIA GeForce RTX 2070 Max-Q -3%
NVIDIA GeForce RTX 2070 Super Max-Q -1%
NVIDIA GeForce RTX 2080 Super Max-Q
NVIDIA GeForce GTX 1650 Max-Q 1%
NVIDIA GeForce GTX 1050 Ti Max-Q 2%
NVIDIA GeForce GTX 1650 Ti Max-Q 2%
AMD Radeon RX 5300M 5%
...
Clock Speed - GPU Clock Speed Furmark
819 MHz (32%)
Intel HD Graphics 500 -45%
...
NVIDIA Quadro RTX 3000 Max-Q -27%
Intel HD Graphics 615 -23%
Intel Iris Plus Graphics 640 -23%
NVIDIA GeForce RTX 2080 Super Max-Q
Intel Iris Plus Graphics 650 4%
AMD Radeon Pro 555 4%
Intel Iris Plus Graphics G7 (Ice Lake 64 EU) 5%
NVIDIA GeForce RTX 2070 Max-Q 6%
NVIDIA Quadro RTX 5000 Max-Q 12%
Intel UHD Graphics 610 16%
...
NVIDIA Quadro T1000 (Laptop) 88%
- Bredd på benchmark-värden för det här grafikkortet
- Genomsnittliga benchmark-värden för det här grafikkortet
* Smaller numbers mean a higher performance
Speltester Följande tester/benchmarks kommer från våra laptoprecensioner. Prestandan beror på typen av grafikminne, klockfrekvens, processor, systeminställningar och operativsystem. Resultaten är därför inte nödvändigtvis representativa för alla bärbara datorer med denna GPU. För detaljerad information om resultaten, klicka på fps-värdet.
...
NVIDIA GeForce RTX 2070 Max-Q -16%
NVIDIA GeForce RTX 2070 Mobile -11%
NVIDIA GeForce RTX 2070 Super Max-Q -2%
NVIDIA GeForce RTX 2070 Super Mobile -2%
NVIDIA GeForce RTX 2080 Super Max-Q
NVIDIA GeForce RTX 2080 Mobile 9%
...
NVIDIA GeForce RTX 2080 Mobile 9%
Intel UHD Graphics Xe 16EUs (Tiger Lake-H) -94%
...
NVIDIA GeForce GTX 1080 Mobile -23%
NVIDIA GeForce RTX 2070 Max-Q -16%
NVIDIA GeForce RTX 2070 Mobile -8%
NVIDIA Quadro RTX 5000 Max-Q -6%
NVIDIA GeForce RTX 2080 Super Max-Q
NVIDIA GeForce RTX 2070 Super Mobile 8%
NVIDIA GeForce RTX 2070 Super Max-Q 10%
NVIDIA GeForce RTX 2080 Mobile 11%
AMD Radeon RX Vega 6 (Ryzen 4000/5000) -90%
...
NVIDIA GeForce GTX 1080 Mobile -19%
NVIDIA GeForce RTX 2070 Max-Q -14%
NVIDIA GeForce RTX 2070 Mobile -6%
NVIDIA GeForce RTX 2080 Super Max-Q
NVIDIA Quadro RTX 5000 Max-Q 3%
NVIDIA GeForce RTX 2080 Mobile 14%
NVIDIA GeForce RTX 2070 Super Mobile 17%
NVIDIA GeForce RTX 2070 Super Max-Q 19%
NVIDIA GeForce RTX 2080 Super Mobile 41%
...
74 [X] Schenker Key 15 Comet Lake Intel Core i7-10875H 2.3GHz
GeForce RTX 2080 Super Max-Q
76 [X] Schenker Key 15 Comet Lake Leistungsmodus
Intel Core i7-10875H 2.3GHz
GeForce RTX 2080 Super Max-Q
~ 75 fps
+ Jämför
- Dölj jämförelse
...
NVIDIA GeForce GTX 1080 Mobile -17%
NVIDIA GeForce RTX 2070 Max-Q -15%
NVIDIA GeForce RTX 2070 Mobile -11%
NVIDIA GeForce RTX 2080 Super Max-Q
NVIDIA GeForce RTX 2080 Mobile 12%
NVIDIA GeForce RTX 2070 Super Mobile 13%
NVIDIA Quadro RTX 5000 Max-Q 17%
NVIDIA GeForce RTX 2070 Super Max-Q 24%
NVIDIA GeForce RTX 2080 Super Mobile 39%
...
» Spelbart med alla testade laptops med inställningen ultra
139.8 [X] Razer Blade 15 RTX 2080 Super Max-Q Intel Core i7-10875H 2.3GHz
GeForce RTX 2080 Super Max-Q
166.1 [X] Schenker Key 15 Comet Lake Intel Core i7-10875H 2.3GHz
GeForce RTX 2080 Super Max-Q
~ 153 fps
+ Jämför
- Dölj jämförelse
...
NVIDIA GeForce GTX 1660 Ti Max-Q -11%
NVIDIA GeForce GTX 1080 Mobile -10%
NVIDIA GeForce RTX 2070 Super Mobile -8%
NVIDIA GeForce RTX 2070 Mobile 0%
NVIDIA GeForce RTX 2080 Super Max-Q
NVIDIA GeForce RTX 2070 Super Max-Q 7%
NVIDIA GeForce RTX 2080 Mobile 18%
118.7 [X] Razer Blade 15 RTX 2080 Super Max-Q Intel Core i7-10875H 2.3GHz
GeForce RTX 2080 Super Max-Q
123.5 [X] Schenker Key 15 Comet Lake Intel Core i7-10875H 2.3GHz
GeForce RTX 2080 Super Max-Q
~ 121 fps
+ Jämför
- Dölj jämförelse
...
NVIDIA GeForce RTX 2070 Max-Q -20%
NVIDIA GeForce GTX 1080 Mobile -12%
NVIDIA Quadro RTX 5000 Max-Q -12%
NVIDIA GeForce RTX 2070 Super Max-Q -5%
NVIDIA GeForce RTX 2080 Super Max-Q
NVIDIA GeForce RTX 2070 Mobile 4%
NVIDIA GeForce RTX 2070 Super Mobile 6%
NVIDIA GeForce RTX 2080 Mobile 28%
108.6 [X] Razer Blade 15 RTX 2080 Super Max-Q Intel Core i7-10875H 2.3GHz
GeForce RTX 2080 Super Max-Q
114.5 [X] Schenker Key 15 Comet Lake Intel Core i7-10875H 2.3GHz
GeForce RTX 2080 Super Max-Q
~ 112 fps
+ Jämför
- Dölj jämförelse
AMD Radeon RX Vega 6 (Ryzen 2000/3000) -91%
...
NVIDIA Quadro RTX 5000 Max-Q -10%
NVIDIA GeForce GTX 1080 Mobile -7%
NVIDIA GeForce RTX 2070 Super Max-Q -7%
NVIDIA GeForce RTX 2080 Super Max-Q
NVIDIA GeForce RTX 2070 Mobile 3%
NVIDIA GeForce RTX 2070 Super Mobile 6%
NVIDIA GeForce RTX 2080 Mobile 26%
NVIDIA GeForce RTX 2080 Super Mobile 33%
...
104.5 [X] Razer Blade 15 RTX 2080 Super Max-Q Intel Core i7-10875H 2.3GHz
GeForce RTX 2080 Super Max-Q
112.8 [X] Schenker Key 15 Comet Lake Intel Core i7-10875H 2.3GHz
GeForce RTX 2080 Super Max-Q
~ 109 fps
+ Jämför
- Dölj jämförelse
AMD Radeon RX Vega 6 (Ryzen 2000/3000) -91%
...
NVIDIA Quadro RTX 5000 Max-Q -9%
NVIDIA GeForce RTX 2070 Super Max-Q -7%
NVIDIA GeForce GTX 1080 Mobile -6%
NVIDIA GeForce RTX 2080 Super Max-Q
NVIDIA GeForce RTX 2070 Mobile 3%
NVIDIA GeForce RTX 2070 Super Mobile 10%
NVIDIA GeForce RTX 2080 Mobile 27%
NVIDIA GeForce RTX 2080 Super Mobile 35%
...
» Spelbart med alla testade laptops med inställningen ultra
219 [X] Razer Blade 15 RTX 2080 Super Max-Q Intel Core i7-10875H 2.3GHz
GeForce RTX 2080 Super Max-Q
min:
182 fps, max:
236 fps
253 268 [X] Schenker Key 15 Comet Lake Intel Core i7-10875H 2.3GHz
GeForce RTX 2080 Super Max-Q
min:
224 fps, max:
290 fps
~ 247 fps
+ Jämför
- Dölj jämförelse
Intel HD Graphics 615 -95%
...
NVIDIA GeForce GTX 1660 Ti Max-Q -11%
NVIDIA GeForce GTX 1080 Mobile -11%
NVIDIA GeForce RTX 2070 Max-Q -9%
NVIDIA GeForce RTX 2070 Super Mobile -8%
NVIDIA GeForce RTX 2080 Super Max-Q
NVIDIA GeForce RTX 2070 Super Max-Q 4%
NVIDIA Quadro RTX 4000 (Laptop) 15%
NVIDIA GeForce RTX 2080 Mobile 17%
167 174 [X] Razer Blade 15 RTX 2080 Super Max-Q Intel Core i7-10875H 2.3GHz
GeForce RTX 2080 Super Max-Q
min:
152 fps, max:
197 fps
184 [X] Schenker Key 15 Comet Lake Intel Core i7-10875H 2.3GHz
GeForce RTX 2080 Super Max-Q
min:
168 fps, max:
205 fps
~ 175 fps
+ Jämför
- Dölj jämförelse
Intel UHD Graphics 610 -96%
...
NVIDIA GeForce RTX 2070 Max-Q -17%
NVIDIA Quadro RTX 5000 Max-Q -7%
NVIDIA GeForce RTX 2070 Super Max-Q -7%
NVIDIA GeForce RTX 2070 Mobile -5%
NVIDIA GeForce RTX 2070 Super Mobile -4%
NVIDIA GeForce RTX 2080 Super Max-Q
NVIDIA GeForce GTX 1080 Mobile 11%
NVIDIA GeForce RTX 2080 Mobile 17%
NVIDIA Quadro RTX 4000 (Laptop) 18%
NVIDIA GeForce RTX 2080 Super Mobile 34%
...
149 150 [X] Razer Blade 15 RTX 2080 Super Max-Q Intel Core i7-10875H 2.3GHz
GeForce RTX 2080 Super Max-Q
min:
137 fps, max:
171 fps
161 [X] Schenker Key 15 Comet Lake Intel Core i7-10875H 2.3GHz
GeForce RTX 2080 Super Max-Q
min:
143 fps, max:
181 fps
~ 153 fps
+ Jämför
- Dölj jämförelse
Intel UHD Graphics 610 -96%
...
NVIDIA GeForce RTX 2070 Max-Q -16%
NVIDIA Quadro RTX 5000 Max-Q -9%
NVIDIA GeForce RTX 2070 Super Max-Q -5%
NVIDIA GeForce RTX 2070 Mobile -4%
NVIDIA GeForce RTX 2070 Super Mobile -4%
NVIDIA GeForce RTX 2080 Super Max-Q
NVIDIA Quadro RTX 4000 (Laptop) 12%
NVIDIA GeForce RTX 2080 Mobile 14%
NVIDIA GeForce GTX 1080 Mobile 16%
NVIDIA GeForce RTX 2080 Super Mobile 34%
...
102 [X] Schenker Key 15 Comet Lake Intel Core i7-10875H 2.3GHz
GeForce RTX 2080 Super Max-Q
min:
94 fps, max:
126 fps
115 [X] Razer Blade 15 RTX 2080 Super Max-Q Intel Core i7-10875H 2.3GHz
GeForce RTX 2080 Super Max-Q
min:
98 fps, max:
134 fps
118 119 [X] Razer Blade 15 RTX 2080 Super Max-Q GPU: Hoch
Intel Core i7-10875H 2.3GHz
GeForce RTX 2080 Super Max-Q
min:
99 fps, max:
137 fps
126 [X] Schenker Key 15 Comet Lake Leistungsmodus
Intel Core i7-10875H 2.3GHz
GeForce RTX 2080 Super Max-Q
min:
108 fps, max:
148 fps
~ 116 fps
+ Jämför
- Dölj jämförelse
Intel UHD Graphics Xe 32EUs (Tiger Lake-H) -91%
...
NVIDIA GeForce RTX 2070 Super Max-Q -10%
NVIDIA GeForce RTX 2070 Max-Q -9%
NVIDIA Quadro RTX 5000 Max-Q -7%
NVIDIA GeForce RTX 2070 Mobile -2%
NVIDIA GeForce RTX 2080 Super Max-Q
NVIDIA GeForce RTX 2070 Super Mobile 4%
NVIDIA Quadro RTX 4000 (Laptop) 4%
NVIDIA GeForce GTX 1080 Mobile 6%
NVIDIA GeForce RTX 2080 Mobile 20%
...
...
NVIDIA GeForce RTX 2070 Max-Q -11%
NVIDIA Quadro RTX 5000 Max-Q -7%
NVIDIA GeForce RTX 2070 Mobile -2%
NVIDIA GeForce RTX 2080 Super Max-Q
NVIDIA GeForce RTX 2080 Mobile 31%
NVIDIA GeForce RTX 2080 Super Mobile 35%
...
NVIDIA GeForce RTX 2080 Super Mobile 35%
...
NVIDIA Quadro RTX 5000 Max-Q -10%
NVIDIA GeForce RTX 2070 Max-Q -10%
NVIDIA Quadro RTX 4000 (Laptop) -2%
NVIDIA GeForce RTX 2070 Mobile -2%
NVIDIA GeForce RTX 2080 Super Max-Q
NVIDIA GeForce GTX 1080 Mobile 6%
NVIDIA GeForce RTX 2080 Mobile 31%
NVIDIA GeForce RTX 2080 Super Mobile 42%
» Spelbart med alla testade laptops med inställningen ultra
188.8 [X] Razer Blade 15 RTX 2080 Super Max-Q Intel Core i7-10875H 2.3GHz
GeForce RTX 2080 Super Max-Q
210.4 267.4 [X] Schenker Key 15 Comet Lake Intel Core i7-10875H 2.3GHz
GeForce RTX 2080 Super Max-Q
~ 222 fps
+ Jämför
- Dölj jämförelse
Intel UHD Graphics 600 -98%
...
NVIDIA GeForce GTX 1050 Ti Mobile -17%
Intel Arc A370M -15%
NVIDIA Quadro T1000 (Laptop) -14%
AMD Radeon 680M -11%
NVIDIA GeForce GTX 1060 Mobile -10%
NVIDIA Quadro RTX 5000 Max-Q -9%
NVIDIA GeForce GTX 1660 Ti Max-Q -3%
NVIDIA GeForce RTX 2080 Super Max-Q
NVIDIA GeForce RTX 2070 Max-Q 1%
AMD Radeon RX 5300M 4%
NVIDIA GeForce GTX 1080 Mobile 5%
NVIDIA GeForce RTX 2070 Mobile 7%
NVIDIA GeForce RTX 2070 Super Mobile 12%
...
161.2 171.6 [X] Razer Blade 15 RTX 2080 Super Max-Q Intel Core i7-10875H 2.3GHz
GeForce RTX 2080 Super Max-Q
184.5 [X] Schenker Key 15 Comet Lake Intel Core i7-10875H 2.3GHz
GeForce RTX 2080 Super Max-Q
~ 172 fps
+ Jämför
- Dölj jämförelse
...
NVIDIA Quadro RTX 5000 Max-Q -19%