Test: MSI GS66 Stealth 10SGS - Core i7 eller Core i9? (Sammanfattning)
Gradering | Datum | Modell | Vikt | Höjd | Storlek | Upplösning | Pris |
|---|---|---|---|---|---|---|---|
| 84 % v7 (old) | 05/2020 | MSI GS66 10SGS i7-10750H, GeForce RTX 2080 Super Max-Q | 2.2 kg | 20 mm | 15.60" | 1920x1080 | |
| 81.3 % v7 (old) | 05/2019 | Asus Zephyrus S GX502GW i7-9750H, GeForce RTX 2070 Mobile | 2.1 kg | 19 mm | 15.60" | 1920x1080 | |
| 88.8 % v6 (old) | 05/2019 | Razer Blade 15 RTX 2080 Max-Q i7-9750H, GeForce RTX 2080 Max-Q | 2.2 kg | 17.8 mm | 15.60" | 1920x1080 | |
| 84.8 % v7 (old) | Lenovo Legion Y740-15ICHg i7-9750H, GeForce RTX 2070 Max-Q | 2.3 kg | 25 mm | 15.60" | 1920x1080 | ||
| 83.3 % v7 (old) | 02/2020 | Schenker XMG Pro 15 i7-9750H, GeForce RTX 2070 Mobile | 2.5 kg | 30 mm | 15.60" | 1920x1080 |
| Networking | |
| iperf3 transmit AX12 | |
| Asus ZenBook Duo UX481FL | |
| MSI GP65 10SFK-047US | |
| MSI GS66 Stealth 10SFS | |
| MSI GS66 10SGS | |
| MSI GF75 Thin 10SCXR | |
| iperf3 receive AX12 | |
| Asus ZenBook Duo UX481FL | |
| MSI GS66 10SGS | |
| MSI GS66 Stealth 10SFS | |
| MSI GP65 10SFK-047US | |
| MSI GF75 Thin 10SCXR | |


| |||||||||||||||||||||||||
Distribution av ljusstyrkan: 92 %
Mitt på batteriet: 339.4 cd/m²
Kontrast: 1414:1 (Svärta: 0.24 cd/m²)
ΔE ColorChecker Calman: 1.58 | ∀{0.5-29.43 Ø4.72}
calibrated: 1.47
ΔE Greyscale Calman: 2.3 | ∀{0.09-98 Ø4.97}
99.4% sRGB (Argyll 1.6.3 3D)
64.8% AdobeRGB 1998 (Argyll 1.6.3 3D)
71.1% AdobeRGB 1998 (Argyll 3D)
99.1% sRGB (Argyll 3D)
69.9% Display P3 (Argyll 3D)
Gamma: 2.24
CCT: 6952 K
| MSI GS66 10SGS AU Optronics B156HAN12.0, IPS, 15.6", 1920x1080 | MSI GS65 Stealth 9SG Sharp LQ156M1JW03 (SHP14C5), IPS, 15.6", 1920x1080 | Asus Zephyrus S GX502GW AU Optronics B156HAN08.2 (AUO82ED), IPS, 15.6", 1920x1080 | Razer Blade 15 RTX 2080 Max-Q Sharp LQ156M1JW03 (SHP14C5), IPS, 15.6", 1920x1080 | HP Omen X 2S 15-dg0075cl AU Optronics AUO82ED, IPS, 15.6", 1920x1080 | Lenovo Legion Y740-15ICHg BOE NV156FHM-N4J, IPS, 15.6", 1920x1080 | |
|---|---|---|---|---|---|---|
| Display | -3% | -7% | -3% | -6% | -6% | |
| Display P3 Coverage (%) | 69.9 | 67.6 -3% | 64.9 -7% | 66.9 -4% | 66.2 -5% | 67.7 -3% |
| sRGB Coverage (%) | 99.1 | 97.5 -2% | 91 -8% | 98.1 -1% | 92.3 -7% | 91.6 -8% |
| AdobeRGB 1998 Coverage (%) | 71.1 | 68.9 -3% | 65.9 -7% | 68.5 -4% | 67.2 -5% | 67.1 -6% |
| Response Times | -21% | 24% | -9% | -22% | -35% | |
| Response Time Grey 50% / Grey 80% * (ms) | 11.2 ? | 13.6 ? -21% | 7.2 ? 36% | 12.8 ? -14% | 15.2 ? -36% | 19 ? -70% |
| Response Time Black / White * (ms) | 10 ? | 12 ? -20% | 8.8 ? 12% | 10.4 ? -4% | 10.8 ? -8% | 10 ? -0% |
| PWM Frequency (Hz) | 23260 ? | 23810 ? | ||||
| Screen | -0% | -23% | -6% | -58% | -18% | |
| Brightness middle (cd/m²) | 339.4 | 282.3 -17% | 286 -16% | 293 -14% | 324.8 -4% | 477 41% |
| Brightness (cd/m²) | 331 | 269 -19% | 275 -17% | 270 -18% | 316 -5% | 431 30% |
| Brightness Distribution (%) | 92 | 90 -2% | 90 -2% | 87 -5% | 84 -9% | 84 -9% |
| Black Level * (cd/m²) | 0.24 | 0.32 -33% | 0.37 -54% | 0.29 -21% | 0.26 -8% | 0.175 27% |
| Contrast (:1) | 1414 | 882 -38% | 773 -45% | 1010 -29% | 1249 -12% | 2726 93% |
| Colorchecker dE 2000 * | 1.58 | 1.17 26% | 2.19 -39% | 1.69 -7% | 4.96 -214% | 4.17 -164% |
| Colorchecker dE 2000 max. * | 3.8 | 3.29 13% | 4.4 -16% | 3.37 11% | 8.95 -136% | 6.97 -83% |
| Colorchecker dE 2000 calibrated * | 1.47 | 1.06 28% | 2.27 -54% | 1.24 16% | 3.23 -120% | 2.51 -71% |
| Greyscale dE 2000 * | 2.3 | 1.3 43% | 2.2 4% | 2.3 -0% | 5 -117% | 3.49 -52% |
| Gamma | 2.24 98% | 2.2 100% | 2.41 91% | 2.3 96% | 2.21 100% | 2.5 88% |
| CCT | 6952 93% | 6643 98% | 6405 101% | 6758 96% | 7742 84% | 7076 92% |
| Color Space (Percent of AdobeRGB 1998) (%) | 64.8 | 63.8 -2% | 59 -9% | 63 -3% | 59.8 -8% | 60 -7% |
| Color Space (Percent of sRGB) (%) | 99.4 | 97.5 -2% | 91 -8% | 98.5 -1% | 91.8 -8% | 91 -8% |
| Totalt genomsnitt (program/inställningar) | -8% /
-3% | -2% /
-14% | -6% /
-6% | -29% /
-44% | -20% /
-18% |
* ... mindre är bättre
Visa svarstider
| ↔ Svarstid svart till vitt | ||
|---|---|---|
| 10 ms ... stiga ↗ och falla ↘ kombinerat | ↗ 5.2 ms stiga | 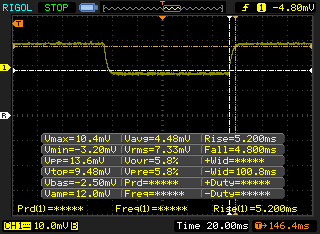 |
| ↘ 4.8 ms hösten | ||
| Skärmen visar bra svarsfrekvens i våra tester, men kan vara för långsam för konkurrenskraftiga spelare. I jämförelse sträcker sig alla testade enheter från 0.1 (minst) till 240 (maximalt) ms. » 27 % av alla enheter är bättre. Det betyder att den uppmätta svarstiden är bättre än genomsnittet av alla testade enheter (19.8 ms). | ||
| ↔ Svarstid 50 % grått till 80 % grått | ||
| 11.2 ms ... stiga ↗ och falla ↘ kombinerat | ↗ 6 ms stiga | 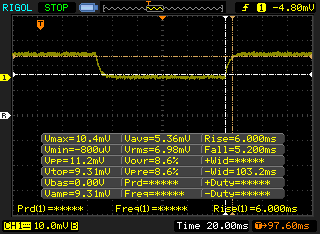 |
| ↘ 5.2 ms hösten | ||
| Skärmen visar bra svarsfrekvens i våra tester, men kan vara för långsam för konkurrenskraftiga spelare. I jämförelse sträcker sig alla testade enheter från 0.165 (minst) till 636 (maximalt) ms. » 25 % av alla enheter är bättre. Det betyder att den uppmätta svarstiden är bättre än genomsnittet av alla testade enheter (31 ms). | ||
Skärmflimmer / PWM (Puls-Width Modulation)
| Skärmflimmer / PWM upptäcktes inte | 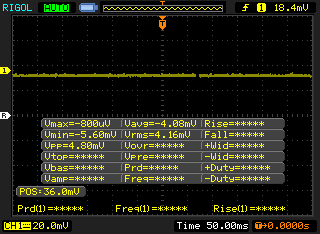 | ||
Som jämförelse: 52 % av alla testade enheter använder inte PWM för att dämpa skärmen. Om PWM upptäcktes mättes ett medelvärde av 7763 (minst: 5 - maximum: 343500) Hz. | |||
Cinebench R15: CPU Multi 64Bit | CPU Single 64Bit
Blender: v2.79 BMW27 CPU
7-Zip 18.03: 7z b 4 -mmt1 | 7z b 4
Geekbench 5.5: Single-Core | Multi-Core
HWBOT x265 Benchmark v2.2: 4k Preset
LibreOffice : 20 Documents To PDF
R Benchmark 2.5: Overall mean
| Cinebench R20 / CPU (Multi Core) | |
| Asus Zephyrus G14 GA401IV | |
| Gigabyte Aero 15 OLED XB-8DE51B0SP | |
| MSI GS66 Stealth 10SFS | |
| MSI GE65 Raider 9SF-049US | |
| MSI GS66 10SGS | |
| Medion Erazer X15805 | |
| Genomsnitt Intel Core i7-10750H (1749 - 3325, n=43) | |
| Genomsnitt Intel Core i7-9750H (2017 - 3133, n=55) | |
| Schenker XMG Pro 15 | |
| MSI GE63 Raider 8SG | |
| MSI GF75 Thin 10SCXR | |
| MSI GF63 Thin 9SC | |
| Cinebench R20 / CPU (Single Core) | |
| Gigabyte Aero 15 OLED XB-8DE51B0SP | |
| Medion Erazer X15805 | |
| Asus Zephyrus G14 GA401IV | |
| MSI GS66 Stealth 10SFS | |
| MSI GE65 Raider 9SF-049US | |
| Genomsnitt Intel Core i7-10750H (431 - 504, n=43) | |
| MSI GS66 10SGS | |
| Genomsnitt Intel Core i7-9750H (416 - 486, n=55) | |
| MSI GF75 Thin 10SCXR | |
| Schenker XMG Pro 15 | |
| MSI GF63 Thin 9SC | |
| MSI GE63 Raider 8SG | |
| Cinebench R15 / CPU Multi 64Bit | |
| Asus Zephyrus G14 GA401IV | |
| Gigabyte Aero 15 OLED XB-8DE51B0SP | |
| MSI GS66 Stealth 10SFS | |
| MSI GE65 Raider 9SF-049US | |
| MSI GS66 10SGS | |
| Genomsnitt Intel Core i7-10750H (804 - 1418, n=50) | |
| Medion Erazer X15805 | |
| Genomsnitt Intel Core i7-9750H (952 - 1306, n=85) | |
| Schenker XMG Pro 15 | |
| MSI GE63 Raider 8SG | |
| MSI GF75 Thin 10SCXR | |
| MSI GF63 Thin 9SC | |
| Cinebench R15 / CPU Single 64Bit | |
| Gigabyte Aero 15 OLED XB-8DE51B0SP | |
| Medion Erazer X15805 | |
| MSI GS66 Stealth 10SFS | |
| MSI GE65 Raider 9SF-049US | |
| Genomsnitt Intel Core i7-10750H (184 - 213, n=45) | |
| Asus Zephyrus G14 GA401IV | |
| MSI GS66 10SGS | |
| Genomsnitt Intel Core i7-9750H (170 - 194, n=82) | |
| MSI GF75 Thin 10SCXR | |
| Schenker XMG Pro 15 | |
| MSI GF63 Thin 9SC | |
| MSI GE63 Raider 8SG | |
| Blender / v2.79 BMW27 CPU | |
| MSI GF75 Thin 10SCXR | |
| Schenker XMG Pro 15 | |
| Genomsnitt Intel Core i7-9750H (342 - 495, n=21) | |
| Genomsnitt Intel Core i7-10750H (322 - 587, n=43) | |
| MSI GS66 10SGS | |
| Asus Zephyrus G14 GA401IV | |
| MSI GS66 Stealth 10SFS | |
| Gigabyte Aero 15 OLED XB-8DE51B0SP | |
| 7-Zip 18.03 / 7z b 4 -mmt1 | |
| Gigabyte Aero 15 OLED XB-8DE51B0SP | |
| MSI GS66 Stealth 10SFS | |
| Genomsnitt Intel Core i7-10750H (4504 - 5470, n=43) | |
| MSI GS66 10SGS | |
| Genomsnitt Intel Core i7-9750H (4580 - 5090, n=21) | |
| MSI GF75 Thin 10SCXR | |
| Asus Zephyrus G14 GA401IV | |
| Schenker XMG Pro 15 | |
| 7-Zip 18.03 / 7z b 4 | |
| Asus Zephyrus G14 GA401IV | |
| Gigabyte Aero 15 OLED XB-8DE51B0SP | |
| MSI GS66 Stealth 10SFS | |
| MSI GS66 10SGS | |
| Genomsnitt Intel Core i7-10750H (26040 - 37345, n=43) | |
| Schenker XMG Pro 15 | |
| Genomsnitt Intel Core i7-9750H (28512 - 35174, n=21) | |
| MSI GF75 Thin 10SCXR | |
| Geekbench 5.5 / Single-Core | |
| Gigabyte Aero 15 OLED XB-8DE51B0SP | |
| MSI GS66 Stealth 10SFS | |
| Genomsnitt Intel Core i7-10750H (1114 - 1333, n=43) | |
| Asus Zephyrus G14 GA401IV | |
| MSI GS66 10SGS | |
| Genomsnitt Intel Core i7-9750H (1117 - 1251, n=13) | |
| MSI GF75 Thin 10SCXR | |
| Schenker XMG Pro 15 | |
| Geekbench 5.5 / Multi-Core | |
| Gigabyte Aero 15 OLED XB-8DE51B0SP | |
| Asus Zephyrus G14 GA401IV | |
| MSI GS66 Stealth 10SFS | |
| MSI GS66 10SGS | |
| Genomsnitt Intel Core i7-10750H (4443 - 6674, n=43) | |
| Schenker XMG Pro 15 | |
| Genomsnitt Intel Core i7-9750H (4859 - 6262, n=13) | |
| MSI GF75 Thin 10SCXR | |
| HWBOT x265 Benchmark v2.2 / 4k Preset | |
| Gigabyte Aero 15 OLED XB-8DE51B0SP | |
| MSI GS66 Stealth 10SFS | |
| Asus Zephyrus G14 GA401IV | |
| MSI GS66 10SGS | |
| Genomsnitt Intel Core i7-10750H (5.54 - 11.6, n=43) | |
| Schenker XMG Pro 15 | |
| Genomsnitt Intel Core i7-9750H (7.1 - 10.7, n=21) | |
| MSI GF75 Thin 10SCXR | |
| LibreOffice / 20 Documents To PDF | |
| Genomsnitt Intel Core i7-9750H (54.5 - 64.7, n=9) | |
| MSI GF75 Thin 10SCXR | |
| MSI GS66 10SGS | |
| Genomsnitt Intel Core i7-10750H (43.1 - 99.2, n=43) | |
| MSI GS66 Stealth 10SFS | |
| Gigabyte Aero 15 OLED XB-8DE51B0SP | |
| R Benchmark 2.5 / Overall mean | |
| MSI GF75 Thin 10SCXR | |
| Schenker XMG Pro 15 | |
| Genomsnitt Intel Core i7-9750H (0.608 - 0.695, n=14) | |
| MSI GS66 10SGS | |
| Genomsnitt Intel Core i7-10750H (0.578 - 0.708, n=42) | |
| MSI GS66 Stealth 10SFS | |
| Gigabyte Aero 15 OLED XB-8DE51B0SP | |
* ... mindre är bättre
| PCMark 10 | |
| Score | |
| MSI GS66 Stealth 10SFS | |
| MSI GS66 10SGS | |
| Lenovo Legion Y740-15ICHg | |
| Razer Blade 15 RTX 2080 Max-Q | |
| MSI GS65 Stealth 9SG | |
| Asus Zephyrus S GX502GW | |
| Essentials | |
| MSI GS66 Stealth 10SFS | |
| MSI GS66 10SGS | |
| MSI GS65 Stealth 9SG | |
| Lenovo Legion Y740-15ICHg | |
| Asus Zephyrus S GX502GW | |
| Razer Blade 15 RTX 2080 Max-Q | |
| Productivity | |
| MSI GS66 Stealth 10SFS | |
| Razer Blade 15 RTX 2080 Max-Q | |
| MSI GS66 10SGS | |
| Asus Zephyrus S GX502GW | |
| MSI GS65 Stealth 9SG | |
| Lenovo Legion Y740-15ICHg | |
| Digital Content Creation | |
| MSI GS66 Stealth 10SFS | |
| Lenovo Legion Y740-15ICHg | |
| MSI GS66 10SGS | |
| Razer Blade 15 RTX 2080 Max-Q | |
| MSI GS65 Stealth 9SG | |
| Asus Zephyrus S GX502GW | |
| PCMark 8 | |
| Home Score Accelerated v2 | |
| Lenovo Legion Y740-15ICHg | |
| MSI GS66 10SGS | |
| MSI GS65 Stealth 9SG | |
| Razer Blade 15 RTX 2080 Max-Q | |
| Work Score Accelerated v2 | |
| MSI GS66 10SGS | |
| Lenovo Legion Y740-15ICHg | |
| MSI GS65 Stealth 9SG | |
| Razer Blade 15 RTX 2080 Max-Q | |
| PCMark 8 Home Score Accelerated v2 | 4579 poäng | |
| PCMark 8 Work Score Accelerated v2 | 6219 poäng | |
| PCMark 10 Score | 6154 poäng | |
Hjälp | ||
| DPC Latencies / LatencyMon - interrupt to process latency (max), Web, Youtube, Prime95 | |
| MSI GS66 10SGS | |
* ... mindre är bättre
| MSI GS66 10SGS Samsung SSD PM981 MZVLB512HAJQ | MSI GS65 Stealth 9SG Samsung SSD PM981 MZVLB512HAJQ | Asus Zephyrus S GX502GW 2x Intel SSD 660p SSDPEKNW512G8 (RAID 0) | Razer Blade 15 RTX 2080 Max-Q Samsung SSD PM981 MZVLB512HAJQ | Lenovo Legion Y740-15ICHg WDC PC SN520 SDAPMUW-128G | MSI GS66 Stealth 10SFS Samsung SSD PM981 MZVLB1T0HALR | |
|---|---|---|---|---|---|---|
| AS SSD | 9% | -6% | 3% | -49% | 9% | |
| Seq Read (MB/s) | 1086 | 2005 85% | 2506 131% | 1832 69% | 1372 26% | 1065 -2% |
| Seq Write (MB/s) | 1901 | 1580 -17% | 1712 -10% | 1864 -2% | 746 -61% | 2360 24% |
| 4K Read (MB/s) | 51 | 49.33 -3% | 48.32 -5% | 52.1 2% | 35.42 -31% | 48.09 -6% |
| 4K Write (MB/s) | 117.3 | 103.8 -12% | 103.6 -12% | 108.3 -8% | 99.9 -15% | 110.7 -6% |
| 4K-64 Read (MB/s) | 1503 | 1241 -17% | 624 -58% | 1159 -23% | 302.1 -80% | 1635 9% |
| 4K-64 Write (MB/s) | 1721 | 1730 1% | 1253 -27% | 1807 5% | 191.4 -89% | 1829 6% |
| Access Time Read * (ms) | 0.059 | 0.054 8% | 0.08 -36% | 0.05 15% | 0.132 -124% | 0.071 -20% |
| Access Time Write * (ms) | 0.1 | 0.036 64% | 0.04 60% | 0.034 66% | 0.037 63% | 0.034 66% |
| Score Read (Points) | 1662 | 1490 -10% | 923 -44% | 1394 -16% | 475 -71% | 1790 8% |
| Score Write (Points) | 2029 | 1991 -2% | 1528 -25% | 2102 4% | 366 -82% | 2176 7% |
| Score Total (Points) | 4588 | 4230 -8% | 2896 -37% | 4221 -8% | 1065 -77% | 4950 8% |
| Copy ISO MB/s (MB/s) | 2155 | 3025 40% | 2083 -3% | 1062 -51% | ||
| Copy Program MB/s (MB/s) | 715 | 713 0% | 496.5 -31% | 426 -40% | ||
| Copy Game MB/s (MB/s) | 1506 | 1554 3% | 977 -35% | 650 -57% | ||
| CrystalDiskMark 5.2 / 6 | -7% | -4% | -3% | -41% | 6% | |
| Write 4K (MB/s) | 132.5 | 91.3 -31% | 97 -27% | 137.2 4% | 134.2 1% | 131.3 -1% |
| Read 4K (MB/s) | 45.03 | 40.73 -10% | 49.58 10% | 46.82 4% | 37.72 -16% | 45.84 2% |
| Write Seq (MB/s) | 1987 | 1915 -4% | 1838 -7% | 1221 -39% | 389.2 -80% | 2370 19% |
| Read Seq (MB/s) | 1434 | 2051 43% | 2421 69% | 1217 -15% | 1030 -28% | 1509 5% |
| Write 4K Q32T1 (MB/s) | 467.5 | 308.3 -34% | 326.9 -30% | 527 13% | 238.9 -49% | 481.5 3% |
| Read 4K Q32T1 (MB/s) | 536 | 417.4 -22% | 372.9 -30% | 614 15% | 343.9 -36% | 560 4% |
| Write Seq Q32T1 (MB/s) | 2003 | 1922 -4% | 1894 -5% | 1986 -1% | 789 -61% | 2392 19% |
| Read Seq Q32T1 (MB/s) | 3306 | 3395 3% | 2828 -14% | 3234 -2% | 1502 -55% | 3232 -2% |
| Write 4K Q8T8 (MB/s) | 293.4 | |||||
| Read 4K Q8T8 (MB/s) | 405.8 | |||||
| Totalt genomsnitt (program/inställningar) | 1% /
3% | -5% /
-5% | 0% /
1% | -45% /
-46% | 8% /
8% |
* ... mindre är bättre

Diskstrypning: DiskSpd Read Loop, Queue Depth 8
| 3DMark 11 | |
| 1280x720 Performance GPU | |
| MSI RTX 2080 Ti Gaming X Trio | |
| Nvidia GeForce RTX 2080 Super FE | |
| Asus ROG Mothership GZ700GX | |
| Genomsnitt NVIDIA GeForce RTX 2080 Super Max-Q (26292 - 32995, n=10) | |
| Alienware m17 R2 P41E | |
| MSI GS66 10SGS | |
| MSI GS66 Stealth 10SFS | |
| MSI GS65 Stealth 9SG | |
| Alienware 15 R3 Max-Q | |
| Xiaomi Mi Gaming Laptop 2019 | |
| Maingear Vector 15 | |
| MSI Alpha 15 A3DDK-034 | |
| MSI GT72S-6QEG16SR421BW | |
| 1280x720 Performance Combined | |
| MSI RTX 2080 Ti Gaming X Trio | |
| Asus ROG Mothership GZ700GX | |
| MSI GS66 Stealth 10SFS | |
| Alienware m17 R2 P41E | |
| Genomsnitt NVIDIA GeForce RTX 2080 Super Max-Q (11707 - 17126, n=10) | |
| MSI GS66 10SGS | |
| MSI GS65 Stealth 9SG | |
| Maingear Vector 15 | |
| Xiaomi Mi Gaming Laptop 2019 | |
| Nvidia GeForce RTX 2080 Super FE | |
| Alienware 15 R3 Max-Q | |
| MSI GT72S-6QEG16SR421BW | |
| MSI Alpha 15 A3DDK-034 | |
| 3DMark 11 Performance | 21793 poäng | |
| 3DMark Cloud Gate Standard Score | 39597 poäng | |
| 3DMark Fire Strike Score | 17585 poäng | |
| 3DMark Time Spy Score | 7475 poäng | |
Hjälp | ||
| Shadow of the Tomb Raider | |
| 1920x1080 Highest Preset AA:T | |
| Nvidia GeForce RTX 2080 Super | |
| MSI GE75 9SG | |
| Alienware m17 R2 P41E | |
| Aorus 17G XB | |
| MSI GS66 10SGS | |
| Genomsnitt NVIDIA GeForce RTX 2080 Super Max-Q (89 - 106, n=10) | |
| MSI GP65 10SFK-047US | |
| MSI GS66 Stealth 10SFS | |
| Walmart EVOO Gaming 17 | |
| Asus Zephyrus G14 GA401IV | |
| 1920x1080 High Preset AA:SM | |
| MSI GE75 9SG | |
| Nvidia GeForce RTX 2080 Super | |
| Aorus 17G XB | |
| Alienware m17 R2 P41E | |
| Genomsnitt NVIDIA GeForce RTX 2080 Super Max-Q (93 - 116, n=7) | |
| MSI GS66 10SGS | |
| MSI GS66 Stealth 10SFS | |
| MSI GP65 10SFK-047US | |
| Walmart EVOO Gaming 17 | |
| Asus Zephyrus G14 GA401IV | |
| The Witcher 3 | |
| 1920x1080 Ultra Graphics & Postprocessing (HBAO+) | |
| Nvidia GeForce RTX 2080 Super | |
| MSI GE75 9SG | |
| Genomsnitt NVIDIA GeForce RTX 2080 Super Max-Q (74.3 - 96, n=11) | |
| MSI GP65 10SFK-047US | |
| Alienware m17 R2 P41E | |
| MSI GS66 10SGS | |
| Aorus 17G XB | |
| MSI GS66 Stealth 10SFS | |
| Walmart EVOO Gaming 17 | |
| Asus Zephyrus G14 GA401IV | |
| 1920x1080 High Graphics & Postprocessing (Nvidia HairWorks Off) | |
| Nvidia GeForce RTX 2080 Super | |
| MSI GE75 9SG | |
| MSI GP65 10SFK-047US | |
| Alienware m17 R2 P41E | |
| Genomsnitt NVIDIA GeForce RTX 2080 Super Max-Q (138 - 160, n=7) | |
| MSI GS66 10SGS | |
| Aorus 17G XB | |
| Walmart EVOO Gaming 17 | |
| MSI GS66 Stealth 10SFS | |
| Asus Zephyrus G14 GA401IV | |
| Borderlands 3 | |
| 1920x1080 Badass Overall Quality (DX11) | |
| Genomsnitt NVIDIA GeForce RTX 2080 Super Max-Q (62.5 - 71.6, n=4) | |
| MSI GS66 10SGS | |
| MSI GS66 Stealth 10SFS | |
| Aorus 17G XB | |
| Asus Zephyrus G14 GA401IV | |
| 1920x1080 High Overall Quality (DX11) | |
| MSI GS66 10SGS | |
| Genomsnitt NVIDIA GeForce RTX 2080 Super Max-Q (78.2 - 84.3, n=4) | |
| Aorus 17G XB | |
| MSI GS66 Stealth 10SFS | |
| Asus Zephyrus G14 GA401IV | |
| låg | med. | hög | ultra | |
|---|---|---|---|---|
| The Witcher 3 (2015) | 310.3 | 239.5 | 142.7 | 74.3 |
| Dota 2 Reborn (2015) | 147 | 132 | 122 | 116 |
| X-Plane 11.11 (2018) | 102 | 90.9 | 76.8 | |
| Shadow of the Tomb Raider (2018) | 138 | 109 | 104 | 96 |
| Assassin´s Creed Odyssey (2018) | 102 | 87 | 75 | 54 |
| Apex Legends (2019) | 299 | 196 | 148.8 | 147.6 |
| Metro Exodus (2019) | 143.3 | 96.2 | 74.4 | 59 |
| Dirt Rally 2.0 (2019) | 252 | 168.4 | 158.5 | 90 |
| The Division 2 (2019) | 165 | 117 | 96 | 73 |
| Anno 1800 (2019) | 159 | 98.2 | 76.7 | 44.4 |
| Total War: Three Kingdoms (2019) | 233 | 127.8 | 88.5 | 64.1 |
| F1 2019 (2019) | 205 | 168 | 147 | 142 |
| Borderlands 3 (2019) | 132.5 | 105.7 | 81.1 | 63.5 |
| Ghost Recon Breakpoint (2019) | 117 | 96 | 86 | 65 |
| GRID 2019 (2019) | 174.8 | 125 | 111 | 74 |
| Need for Speed Heat (2019) | 101.9 | 92 | 84 | 76.9 |
| Escape from Tarkov (2020) | 121 | 121 | 120 | 120 |
| Hunt Showdown (2020) | 207.4 | 121.4 | 102 | |
| Doom Eternal (2020) | 256 | 167.6 | 147.1 | 140 |
| MSI GS66 10SGS GeForce RTX 2080 Super Max-Q, i7-10750H, Samsung SSD PM981 MZVLB512HAJQ | MSI GS65 Stealth 9SG GeForce RTX 2080 Max-Q, i7-9750H, Samsung SSD PM981 MZVLB512HAJQ | Asus Zephyrus S GX502GW GeForce RTX 2070 Mobile, i7-9750H, 2x Intel SSD 660p SSDPEKNW512G8 (RAID 0) | Razer Blade 15 RTX 2080 Max-Q GeForce RTX 2080 Max-Q, i7-9750H, Samsung SSD PM981 MZVLB512HAJQ | HP Omen X 2S 15-dg0075cl GeForce RTX 2070 Max-Q, i7-9750H, WDC PC SN720 SDAPNTW-1T00 | Lenovo Legion Y740-15ICHg GeForce RTX 2070 Max-Q, i7-9750H, WDC PC SN520 SDAPMUW-128G | MSI GS66 Stealth 10SFS GeForce RTX 2070 Super Max-Q, i9-10980HK, Samsung SSD PM981 MZVLB1T0HALR | |
|---|---|---|---|---|---|---|---|
| Noise | 2% | -10% | 9% | -1% | 2% | -11% | |
| av / miljö * (dB) | 28.5 | 28.3 1% | 30 -5% | 28.3 1% | 29 -2% | 30 -5% | 30 -5% |
| Idle Minimum * (dB) | 30 | 30.4 -1% | 31 -3% | 28.8 4% | 30.5 -2% | 31.3 -4% | 32 -7% |
| Idle Average * (dB) | 30 | 30.5 -2% | 33 -10% | 28.8 4% | 31.5 -5% | 31.3 -4% | 34 -13% |
| Idle Maximum * (dB) | 30.9 | 30.6 1% | 38 -23% | 29 6% | 31.5 -2% | 31.3 -1% | 39 -26% |
| Load Average * (dB) | 39.5 | 37.6 5% | 50 -27% | 33.5 15% | 40.6 -3% | 42 -6% | 53 -34% |
| Witcher 3 ultra * (dB) | 48 | 46 4% | 53 -10% | 45 6% | 49.5 -3% | 42.1 12% | 48 -0% |
| Load Maximum * (dB) | 59.4 | 55.1 7% | 56 6% | 45.2 24% | 53.4 10% | 46.5 22% | 53 11% |
* ... mindre är bättre
Ljudnivå
| Låg belastning |
| 30 / 30 / 30.9 dB(A) |
| Hög belastning |
| 39.5 / 59.4 dB(A) |
 | ||
30 dB tyst 40 dB(A) hörbar 50 dB(A) högt ljud |
||
min: | ||
(-) Den maximala temperaturen på ovansidan är 47.8 °C / 118 F, jämfört med genomsnittet av 40.4 °C / 105 F , allt från 21.2 till 68.8 °C för klassen Gaming.
(-) Botten värms upp till maximalt 54.4 °C / 130 F, jämfört med genomsnittet av 43.2 °C / 110 F
(+) Vid tomgångsbruk är medeltemperaturen för ovansidan 25.9 °C / 79 F, jämfört med enhetsgenomsnittet på 33.9 °C / ### class_avg_f### F.
(±) När du spelar The Witcher 3 är medeltemperaturen för ovansidan 33.3 °C / 92 F, jämfört med enhetsgenomsnittet på 33.9 °C / ## #class_avg_f### F.
(+) Handledsstöden och pekplattan är kallare än hudtemperaturen med maximalt 28.6 °C / 83.5 F och är därför svala att ta på.
(±) Medeltemperaturen för handledsstödsområdet på liknande enheter var 28.8 °C / 83.8 F (+0.2 °C / 0.3 F).
MSI GS66 10SGS ljudanalys
(+) | högtalare kan spela relativt högt (92.3 dB)
Bas 100 - 315 Hz
(-) | nästan ingen bas - i genomsnitt 29.8% lägre än medianen
(±) | linjäriteten för basen är genomsnittlig (7.5% delta till föregående frekvens)
Mellan 400 - 2000 Hz
(±) | högre mellan - i genomsnitt 9.3% högre än median
(±) | linjäriteten för mids är genomsnittlig (9.2% delta till föregående frekvens)
Högsta 2 - 16 kHz
(±) | reducerade toppar - i genomsnitt 6.1% lägre än medianen
(±) | linjäriteten för toppar är genomsnittlig (7.5% delta till föregående frekvens)
Totalt 100 - 16 000 Hz
(±) | linjäriteten för det totala ljudet är genomsnittlig (29.4% skillnad mot median)
Jämfört med samma klass
» 95% av alla testade enheter i den här klassen var bättre, 2% liknande, 3% sämre
» Den bästa hade ett delta på 6%, genomsnittet var 18%, sämst var 132%
Jämfört med alla testade enheter
» 87% av alla testade enheter var bättre, 3% liknande, 10% sämre
» Den bästa hade ett delta på 4%, genomsnittet var 24%, sämst var 134%
Apple MacBook 12 (Early 2016) 1.1 GHz ljudanalys
(+) | högtalare kan spela relativt högt (83.6 dB)
Bas 100 - 315 Hz
(±) | reducerad bas - i genomsnitt 11.3% lägre än medianen
(±) | linjäriteten för basen är genomsnittlig (14.2% delta till föregående frekvens)
Mellan 400 - 2000 Hz
(+) | balanserad mellan - endast 2.4% från medianen
(+) | mids är linjära (5.5% delta till föregående frekvens)
Högsta 2 - 16 kHz
(+) | balanserade toppar - endast 2% från medianen
(+) | toppar är linjära (4.5% delta till föregående frekvens)
Totalt 100 - 16 000 Hz
(+) | det totala ljudet är linjärt (10.2% skillnad mot median)
Jämfört med samma klass
» 7% av alla testade enheter i den här klassen var bättre, 2% liknande, 91% sämre
» Den bästa hade ett delta på 5%, genomsnittet var 18%, sämst var 53%
Jämfört med alla testade enheter
» 5% av alla testade enheter var bättre, 1% liknande, 94% sämre
» Den bästa hade ett delta på 4%, genomsnittet var 24%, sämst var 134%
| Av/Standby | |
| Låg belastning | |
| Hög belastning |
|
Förklaring:
min: | |
| MSI GS66 10SGS i7-10750H, GeForce RTX 2080 Super Max-Q, Samsung SSD PM981 MZVLB512HAJQ, IPS, 1920x1080, 15.6" | MSI GS65 Stealth 9SG i7-9750H, GeForce RTX 2080 Max-Q, Samsung SSD PM981 MZVLB512HAJQ, IPS, 1920x1080, 15.6" | Asus Zephyrus S GX502GW i7-9750H, GeForce RTX 2070 Mobile, 2x Intel SSD 660p SSDPEKNW512G8 (RAID 0), IPS, 1920x1080, 15.6" | Razer Blade 15 RTX 2080 Max-Q i7-9750H, GeForce RTX 2080 Max-Q, Samsung SSD PM981 MZVLB512HAJQ, IPS, 1920x1080, 15.6" | HP Omen X 2S 15-dg0075cl i7-9750H, GeForce RTX 2070 Max-Q, WDC PC SN720 SDAPNTW-1T00, IPS, 1920x1080, 15.6" | Lenovo Legion Y740-15ICHg i7-9750H, GeForce RTX 2070 Max-Q, WDC PC SN520 SDAPMUW-128G, IPS, 1920x1080, 15.6" | MSI GS66 Stealth 10SFS i9-10980HK, GeForce RTX 2070 Super Max-Q, Samsung SSD PM981 MZVLB1T0HALR, IPS, 1920x1080, 15.6" | |
|---|---|---|---|---|---|---|---|
| Power Consumption | -8% | -31% | 9% | -97% | -15% | -1% | |
| Idle Minimum * (Watt) | 14.9 | 18.3 -23% | 24 -61% | 12.5 16% | 46 -209% | 22.2 -49% | 13 13% |
| Idle Average * (Watt) | 17.5 | 22 -26% | 27 -54% | 15.3 13% | 59 -237% | 24.9 -42% | 16 9% |
| Idle Maximum * (Watt) | 29.5 | 28.8 2% | 33 -12% | 20.7 30% | 65.5 -122% | 30.6 -4% | 27 8% |
| Load Average * (Watt) | 94.8 | 93 2% | 129 -36% | 90.2 5% | 99.8 -5% | 101 -7% | 109 -15% |
| Witcher 3 ultra * (Watt) | 146.1 | 142.6 2% | 176 -20% | 162 -11% | 154.1 -5% | 143 2% | 155 -6% |
| Load Maximum * (Watt) | 210.9 | 215.9 -2% | 216 -2% | 209.3 1% | 222.7 -6% | 186 12% | 236 -12% |
* ... mindre är bättre
| MSI GS66 10SGS i7-10750H, GeForce RTX 2080 Super Max-Q, 99.99 Wh | MSI GS65 Stealth 9SG i7-9750H, GeForce RTX 2080 Max-Q, 82 Wh | Asus Zephyrus S GX502GW i7-9750H, GeForce RTX 2070 Mobile, 76 Wh | Razer Blade 15 RTX 2080 Max-Q i7-9750H, GeForce RTX 2080 Max-Q, 80 Wh | Lenovo Legion Y740-15ICHg i7-9750H, GeForce RTX 2070 Max-Q, 57 Wh | MSI GS66 Stealth 10SFS i9-10980HK, GeForce RTX 2070 Super Max-Q, 99.99 Wh | |
|---|---|---|---|---|---|---|
| Batteridrifttid | -13% | -42% | 19% | -57% | -8% | |
| Reader / Idle (h) | 10.2 | 5.9 -42% | 15.9 56% | 8.4 -18% | ||
| WiFi v1.3 (h) | 6.9 | 6 -13% | 3.7 -46% | 6.6 -4% | 3 -57% | 6.1 -12% |
| Load (h) | 1.6 | 1 -37% | 1.7 6% | 1.7 6% |
För
Emot

Läs den fullständiga versionen av den här recensionen på engelska här.
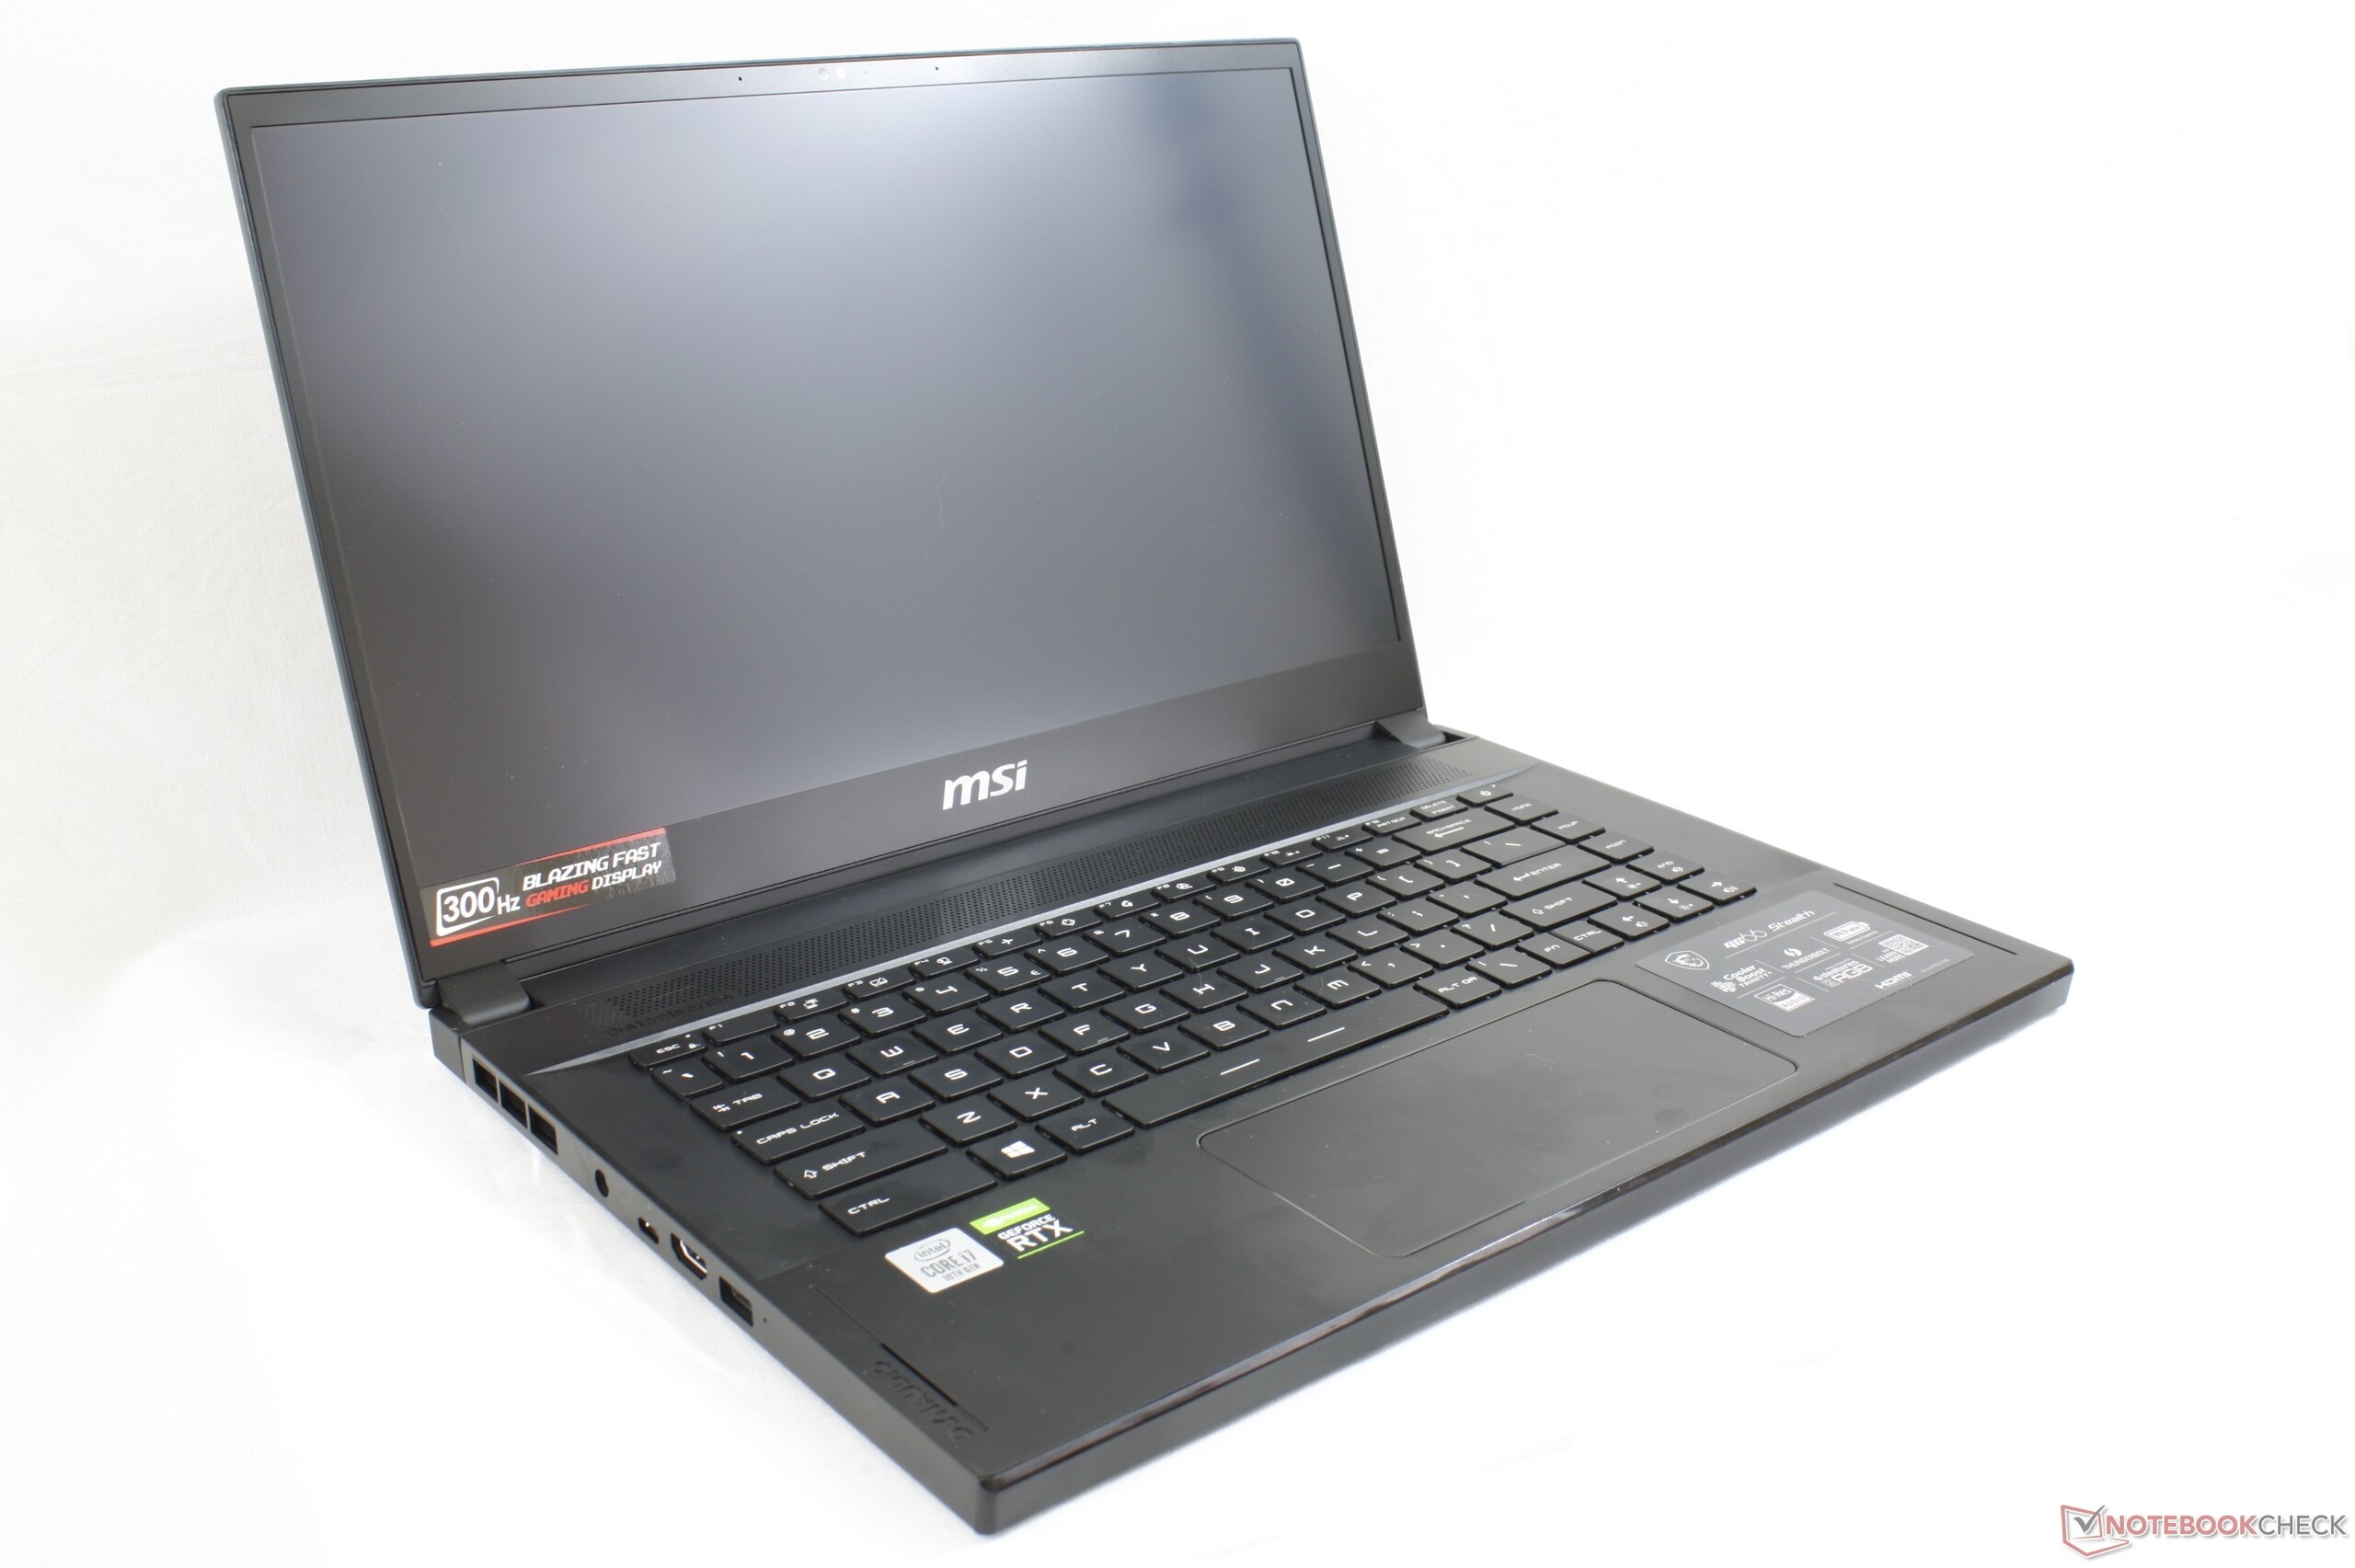
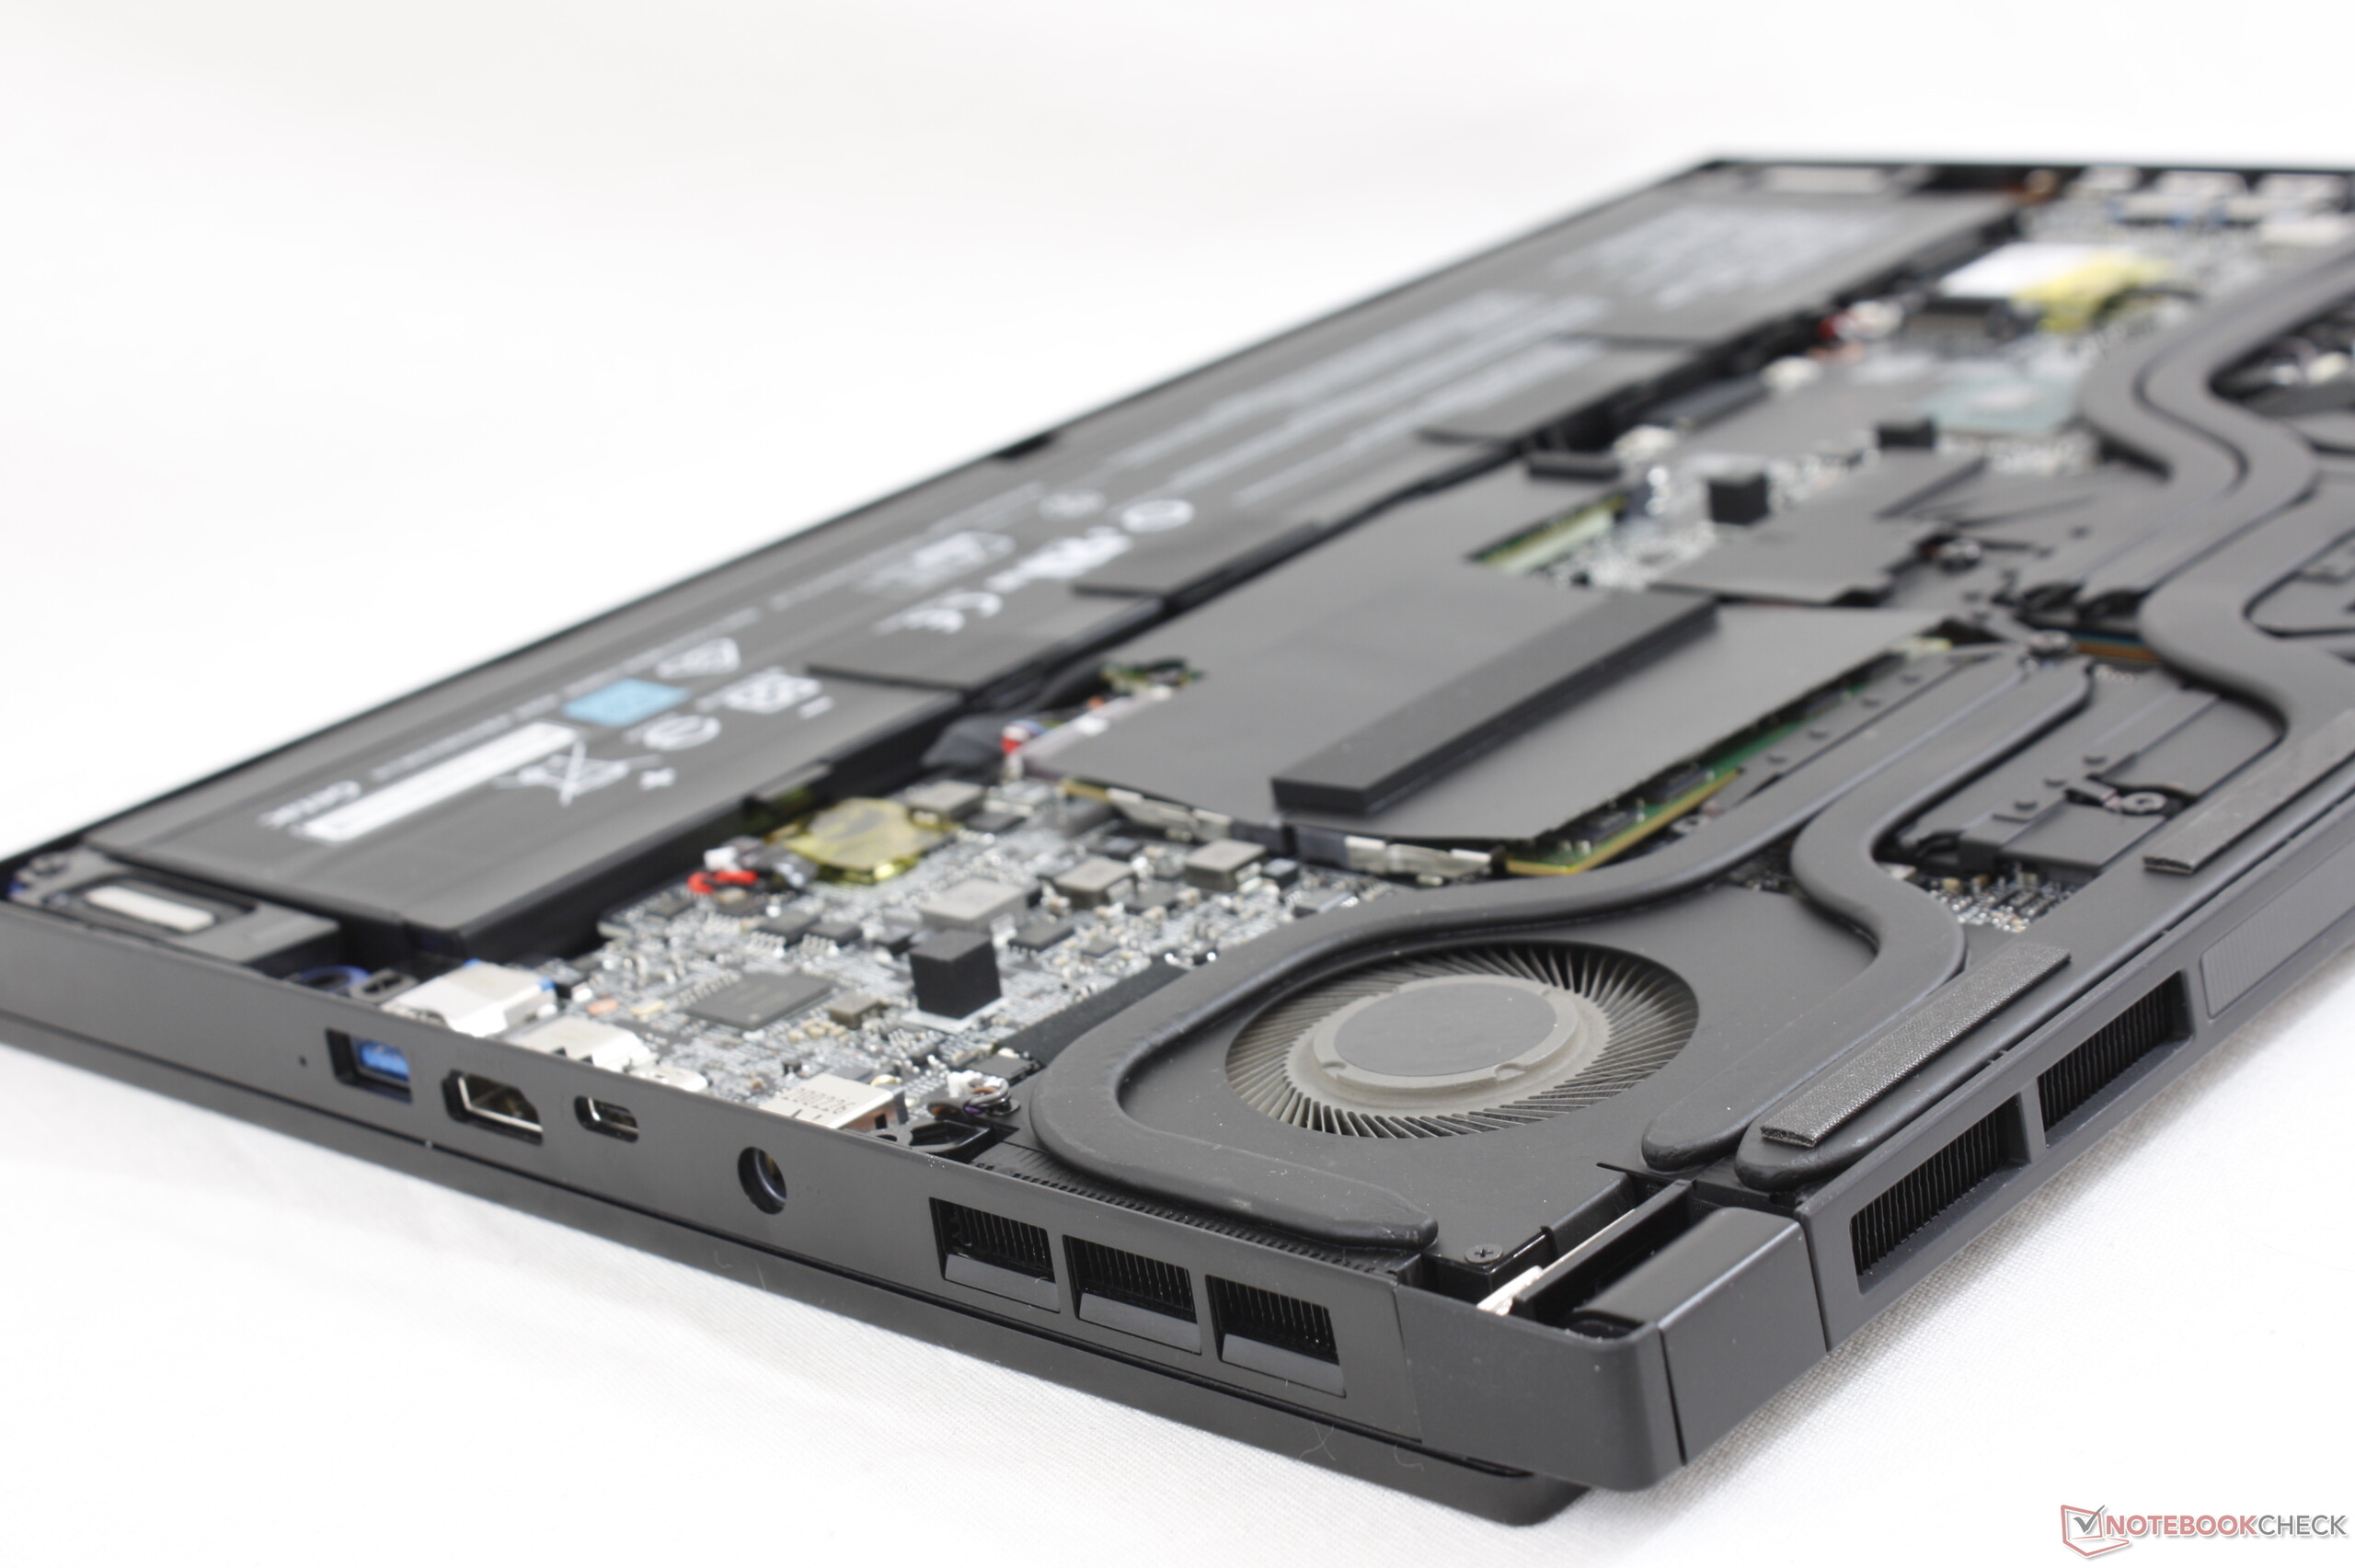
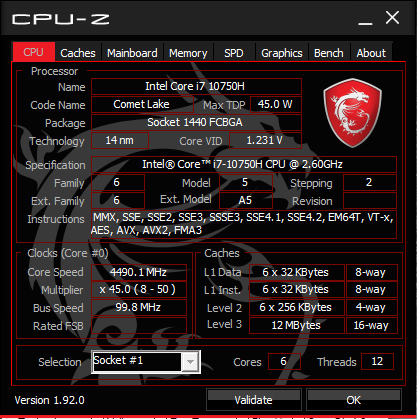
MSI GS66 kommer i ett flertal varianter med två CPU-alternativ (Core i7-10750H eller Core i9-10980HK) samt tre GPU-alternativ (GeForce RTX 2060, RTX 2070 Super Max-Q, RTX 2080 Super Max-Q). Vi har testat två varianter hittills: GS66 10SGS (Core i7-10750H, RTX 2080 Super Max-Q) och GS66 10SFS (Core i9-10980HK, RTX 2070 Super Max-Q). Om vi för spelsyften skulle behöva välja mellan en snabbare CPU med en långsammare GPU eller en långsammare CPU med en snabbare GPU faller valet onekligen på det sistnämnda eftersom spelen kommer köras en aning snabbare i den konfigurationen.
Om du planerar att använda GS66 för CPU-tunga uppgifter som inte är spel kan den åttakärniga Core i9-varianten kännas rimligare då den har 25 - 35 procent högre multitrådad prestanda jämfört med den sexkärniga Core i7-processorn. I övrigt är skillnaderna när man spelar så små att det snabbare GPU-alternativet oftast får företräde. Den som vill ha det bästa från båda världar kan välja den riktigt avancerade konfigurationen GS66 10SGS-031.
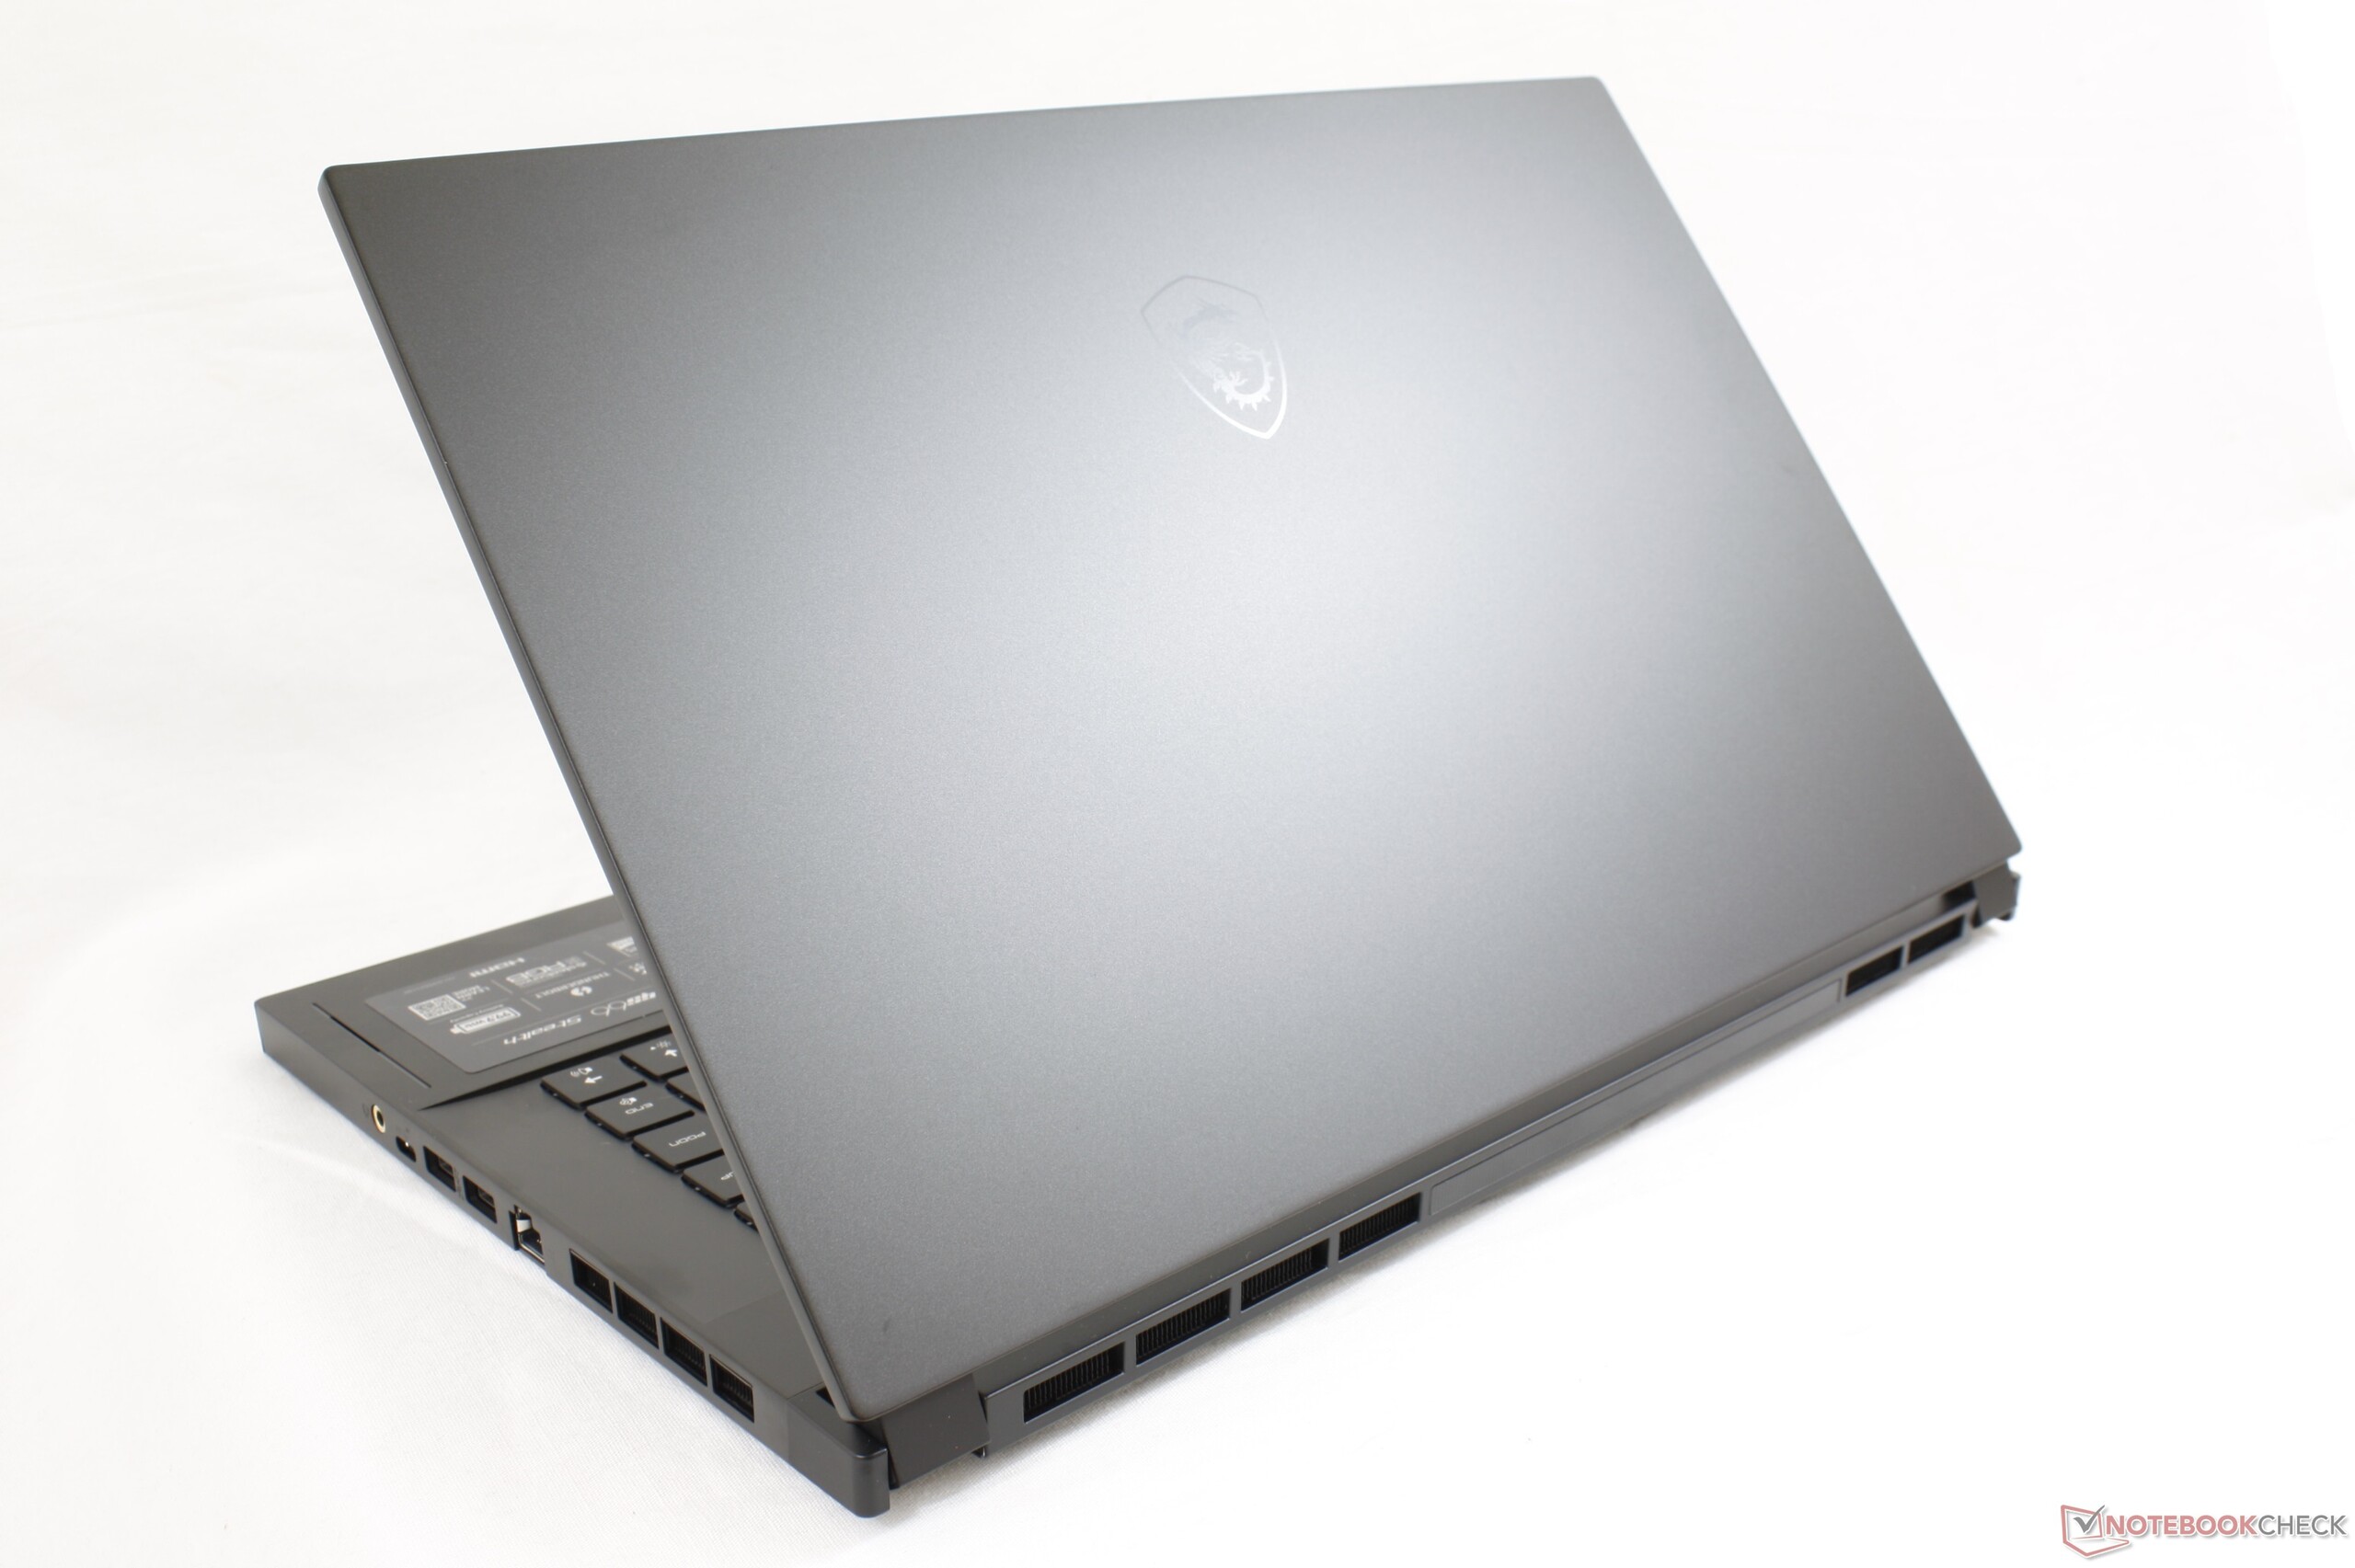
Ett imponerande nytt chassi med inte lika imponerande speluppgraderingar. GeForce RTX 2080 Super Max-Q har i GS66 bara 5 till 10 procent snabbare grafikprestanda än den äldre MSI GS65 med GeForce RTX 2080 Max-Q. Den bästa anledningen att köpa GS66 framför GS65 är således för det starkare chassit och uppgraderingsmöjligheterna snarare än en liten prestandaökning när man spelar.
MSI GS66 10SGS
- 05/17/2020 v7 (old)
Allen Ngo
Price comparison
