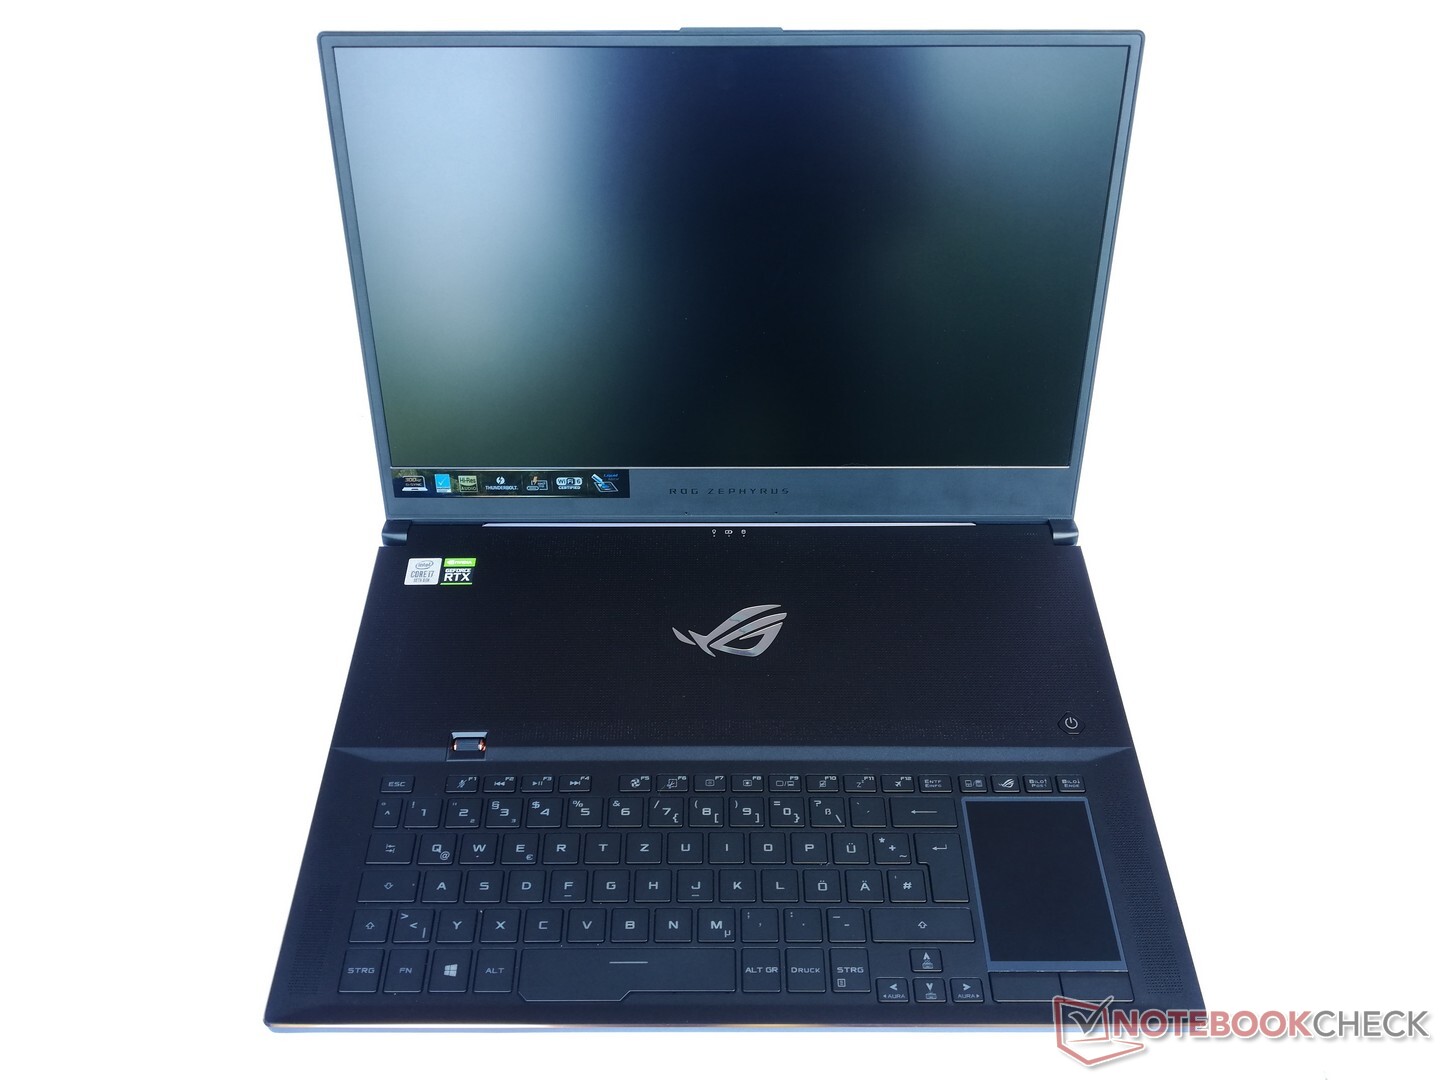
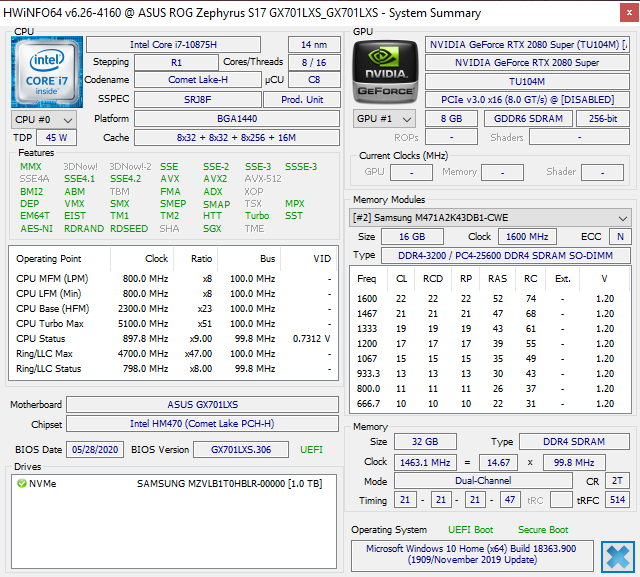
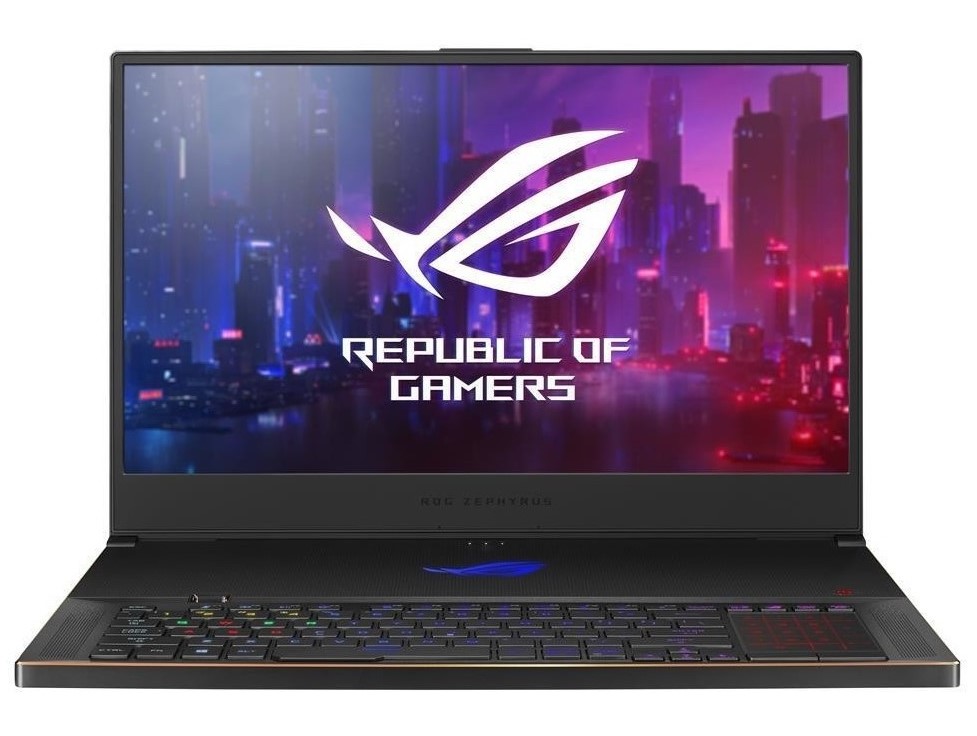
Test: Asus ROG Zephyrus S17 - Gigantisk men tunn spellaptop med 300 Hz-skärm (Sammanfattning)
Gradering | Datum | Modell | Vikt | Höjd | Storlek | Upplösning | Pris |
|---|---|---|---|---|---|---|---|
| 82.4 % v7 (old) | 08/2020 | Asus Zephyrus S17 GX701LXS i7-10875H, GeForce RTX 2080 Super Max-Q | 2.6 kg | 18.7 mm | 17.30" | 1920x1080 | |
| 87.4 % v7 (old) | 06/2020 | Razer Blade Pro 17 RTX 2070 Max-Q 300 Hz i7-10875H, GeForce RTX 2070 Max-Q | 2.7 kg | 19.9 mm | 17.30" | 1920x1080 | |
| 83.7 % v7 (old) | MSI GS75 10SF-609US i7-10875H, GeForce RTX 2070 Max-Q | 2.3 kg | 18.9 mm | 17.30" | 1920x1080 | ||
| 84 % v7 (old) | 05/2020 | Lenovo Legion Y740-17IRHg-81UJ001VGE i7-9750H, GeForce RTX 2080 Max-Q | 3 kg | 25.5 mm | 17.30" | 1920x1080 | |
| 84.2 % v7 (old) | 03/2020 | Alienware m17 R2 P41E i9-9980HK, GeForce RTX 2080 Max-Q | 2.6 kg | 20.5 mm | 17.30" | 1920x1080 |
| Networking | |
| iperf3 transmit AX12 | |
| Asus Zephyrus S17 GX701LXS | |
| Razer Blade Pro 17 RTX 2070 Max-Q 300 Hz | |
| MSI GS75 10SF-609US | |
| Genomsnitt Intel Wi-Fi 6 AX201 (49.8 - 1775, n=324) | |
| iperf3 receive AX12 | |
| Genomsnitt Intel Wi-Fi 6 AX201 (136 - 1743, n=324) | |
| Asus Zephyrus S17 GX701LXS | |
| Razer Blade Pro 17 RTX 2070 Max-Q 300 Hz | |
| MSI GS75 10SF-609US | |
| |||||||||||||||||||||||||
Distribution av ljusstyrkan: 76 %
Mitt på batteriet: 308 cd/m²
Kontrast: 906:1 (Svärta: 0.34 cd/m²)
ΔE ColorChecker Calman: 1.49 | ∀{0.5-29.43 Ø4.73}
calibrated: 0.99
ΔE Greyscale Calman: 2.3 | ∀{0.09-98 Ø4.97}
96% sRGB (Argyll 1.6.3 3D)
74% AdobeRGB 1998 (Argyll 1.6.3 3D)
73.7% AdobeRGB 1998 (Argyll 3D)
99.7% sRGB (Argyll 3D)
73.6% Display P3 (Argyll 3D)
Gamma: 2.193
CCT: 6981 K
| Asus Zephyrus S17 GX701LXS Sharp SHP14DC, IPS, 1920x1080, 17.3" | Razer Blade Pro 17 RTX 2070 Max-Q 300 Hz Sharp LQ173M1JW02, IPS, 1920x1080, 17.3" | MSI GS75 10SF-609US Sharp LQ173M1JW05, IPS, 1920x1080, 17.3" | Lenovo Legion Y740-17IRHg-81UJ001VGE AUO_B173HAN03, IPS, 1920x1080, 17.3" | Alienware m17 R2 P41E Chi Mei 173HCE, CMN175F, IPS, 1920x1080, 17.3" | |
|---|---|---|---|---|---|
| Display | -1% | 2% | -10% | -2% | |
| Display P3 Coverage (%) | 73.6 | 72.2 -2% | 75.6 3% | 63.8 -13% | 70.8 -4% |
| sRGB Coverage (%) | 99.7 | 98.5 -1% | 99.8 0% | 92.7 -7% | 98.5 -1% |
| AdobeRGB 1998 Coverage (%) | 73.7 | 73 -1% | 75.1 2% | 65.3 -11% | 72.2 -2% |
| Response Times | -16% | 9% | -129% | -140% | |
| Response Time Grey 50% / Grey 80% * (ms) | 5 ? | 5.6 ? -12% | 5 ? -0% | 16 ? -220% | 17.2 ? -244% |
| Response Time Black / White * (ms) | 8 ? | 9.6 ? -20% | 6.6 ? 17% | 11 ? -38% | 10.8 ? -35% |
| PWM Frequency (Hz) | 26320 ? | ||||
| Screen | -59% | -8% | -35% | 13% | |
| Brightness middle (cd/m²) | 308 | 328 6% | 299.4 -3% | 310 1% | 384.2 25% |
| Brightness (cd/m²) | 310 | 329 6% | 299 -4% | 281 -9% | 357 15% |
| Brightness Distribution (%) | 76 | 78 3% | 84 11% | 85 12% | 90 18% |
| Black Level * (cd/m²) | 0.34 | 0.35 -3% | 0.31 9% | 0.31 9% | 0.29 15% |
| Contrast (:1) | 906 | 937 3% | 966 7% | 1000 10% | 1325 46% |
| Colorchecker dE 2000 * | 1.49 | 4.74 -218% | 1.82 -22% | 3.86 -159% | 1.35 9% |
| Colorchecker dE 2000 max. * | 3.97 | 8.99 -126% | 3.91 2% | 7.8 -96% | 3.45 13% |
| Colorchecker dE 2000 calibrated * | 0.99 | 2.12 -114% | 1.59 -61% | 1.42 -43% | |
| Greyscale dE 2000 * | 2.3 | 6.8 -196% | 2.7 -17% | 4.48 -95% | 1.2 48% |
| Gamma | 2.193 100% | 2.2 100% | 2.18 101% | 2.5 88% | 2.23 99% |
| CCT | 6981 93% | 6446 101% | 6837 95% | 7542 86% | 6580 99% |
| Color Space (Percent of AdobeRGB 1998) (%) | 74 | 64.8 -12% | 67.1 -9% | 60 -19% | 65.5 -11% |
| Color Space (Percent of sRGB) (%) | 96 | 98.6 3% | 99.8 4% | 93 -3% | 98.5 3% |
| Totalt genomsnitt (program/inställningar) | -25% /
-43% | 1% /
-4% | -58% /
-43% | -43% /
-9% |
* ... mindre är bättre
Visa svarstider
| ↔ Svarstid svart till vitt | ||
|---|---|---|
| 8 ms ... stiga ↗ och falla ↘ kombinerat | ↗ 3.6 ms stiga | 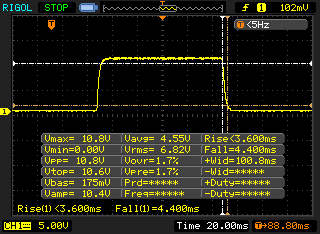 |
| ↘ 4.4 ms hösten | ||
| Skärmen visar snabba svarsfrekvenser i våra tester och bör passa för spel. I jämförelse sträcker sig alla testade enheter från 0.1 (minst) till 240 (maximalt) ms. » 22 % av alla enheter är bättre. Det betyder att den uppmätta svarstiden är bättre än genomsnittet av alla testade enheter (19.9 ms). | ||
| ↔ Svarstid 50 % grått till 80 % grått | ||
| 5 ms ... stiga ↗ och falla ↘ kombinerat | ↗ 2.2 ms stiga | 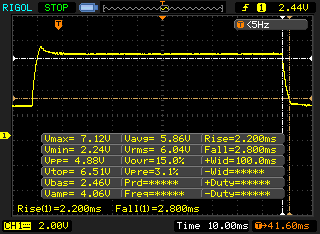 |
| ↘ 2.8 ms hösten | ||
| Skärmen visar väldigt snabba svarsfrekvenser i våra tester och borde vara mycket väl lämpad för fartfyllt spel. I jämförelse sträcker sig alla testade enheter från 0.165 (minst) till 636 (maximalt) ms. » 17 % av alla enheter är bättre. Det betyder att den uppmätta svarstiden är bättre än genomsnittet av alla testade enheter (31.1 ms). | ||
Skärmflimmer / PWM (Puls-Width Modulation)
| Skärmflimmer / PWM upptäcktes inte | 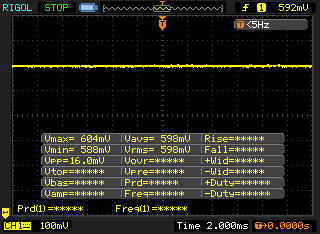 | ||
Som jämförelse: 52 % av alla testade enheter använder inte PWM för att dämpa skärmen. Om PWM upptäcktes mättes ett medelvärde av 7794 (minst: 5 - maximum: 343500) Hz. | |||
| HWBOT x265 Benchmark v2.2 - 4k Preset | |
| Genomsnitt av klass Gaming (11.5 - 44.3, n=110, senaste 2 åren) | |
| Asus Zephyrus S17 GX701LXS | |
| MSI GS75 10SF-609US | |
| Genomsnitt Intel Core i7-10875H (7.27 - 14.1, n=27) | |
| Lenovo Legion Y740-17IRHg-81UJ001VGE | |
| LibreOffice - 20 Documents To PDF | |
| Razer Blade Pro 17 RTX 2070 Max-Q 300 Hz | |
| Genomsnitt Intel Core i7-10875H (30.2 - 84.3, n=30) | |
| MSI GS75 10SF-609US | |
| Genomsnitt av klass Gaming (19 - 88.8, n=110, senaste 2 åren) | |
| Asus Zephyrus S17 GX701LXS | |
| R Benchmark 2.5 - Overall mean | |
| Lenovo Legion Y740-17IRHg-81UJ001VGE | |
| MSI GS75 10SF-609US | |
| Asus Zephyrus S17 GX701LXS | |
| Genomsnitt Intel Core i7-10875H (0.546 - 0.662, n=29) | |
| Genomsnitt av klass Gaming (0.3439 - 0.759, n=111, senaste 2 åren) | |
* ... mindre är bättre
| PCMark 8 Home Score Accelerated v2 | 4666 poäng | |
| PCMark 8 Work Score Accelerated v2 | 6370 poäng | |
| PCMark 10 Score | 5231 poäng | |
Hjälp | ||
| DPC Latencies / LatencyMon - interrupt to process latency (max), Web, Youtube, Prime95 | |
| Razer Blade Pro 17 RTX 2070 Max-Q 300 Hz | |
| Asus Zephyrus S17 GX701LXS | |
| MSI GS75 10SF-609US | |
* ... mindre är bättre
| Asus Zephyrus S17 GX701LXS Samsung PM981a MZVLB1T0HBLR | Razer Blade Pro 17 RTX 2070 Max-Q 300 Hz Lite-On CA5-8D512 | MSI GS75 10SF-609US WDC PC SN730 SDBPNTY-512G | Lenovo Legion Y740-17IRHg-81UJ001VGE Samsung SSD PM981 MZVLB1T0HALR | Alienware m17 R2 P41E 2x SK Hynix PC601 NVMe 512 GB (RAID 0) | Genomsnitt Samsung PM981a MZVLB1T0HBLR | |
|---|---|---|---|---|---|---|
| CrystalDiskMark 5.2 / 6 | 9% | 18% | 1% | 4% | 9% | |
| Write 4K (MB/s) | 120 | 119 -1% | 177.9 48% | 101.2 -16% | 110.6 -8% | 139.7 ? 16% |
| Read 4K (MB/s) | 45.24 | 51.9 15% | 47.42 5% | 44.61 -1% | 41.46 -8% | 49.9 ? 10% |
| Write Seq (MB/s) | 2090 | 2258 8% | 2707 30% | 2295 10% | 2378 14% | 2036 ? -3% |
| Read Seq (MB/s) | 2246 | 2283 2% | 2369 5% | 2174 -3% | 2114 -6% | 2014 ? -10% |
| Write 4K Q32T1 (MB/s) | 392.5 | 491 25% | 427.8 9% | 401.2 2% | 445.4 13% | 461 ? 17% |
| Read 4K Q32T1 (MB/s) | 348.4 | 540 55% | 543 56% | 475.5 36% | 509 46% | 499 ? 43% |
| Write Seq Q32T1 (MB/s) | 3015 | 2253 -25% | 2703 -10% | 2397 -20% | 2735 -9% | 2903 ? -4% |
| Read Seq Q32T1 (MB/s) | 3445 | 3172 -8% | 3387 -2% | 3337 -3% | 3206 -7% | 3479 ? 1% |
| AS SSD | -60% | -13% | 9% | -27% | 13% | |
| Seq Read (MB/s) | 2744 | 2019 -26% | 2327 -15% | 2800 2% | 1938 -29% | 2553 ? -7% |
| Seq Write (MB/s) | 1351 | 1314 -3% | 2479 83% | 2424 79% | 2094 55% | 2084 ? 54% |
| 4K Read (MB/s) | 47.24 | 46.61 -1% | 45.46 -4% | 42.77 -9% | 25.88 -45% | 53.1 ? 12% |
| 4K Write (MB/s) | 109.1 | 90.2 -17% | 157.4 44% | 94.8 -13% | 100.8 -8% | 131.2 ? 20% |
| 4K-64 Read (MB/s) | 1118 | 665 -41% | 1050 -6% | 1406 26% | 1217 9% | 1477 ? 32% |
| 4K-64 Write (MB/s) | 1926 | 813 -58% | 938 -51% | 1697 -12% | 1137 -41% | 1805 ? -6% |
| Access Time Read * (ms) | 0.064 | 0.058 9% | 0.076 -19% | 0.05 22% | 0.051 20% | 0.04983 ? 22% |
| Access Time Write * (ms) | 0.034 | 0.167 -391% | 0.071 -109% | 0.039 -15% | 0.107 -215% | 0.04222 ? -24% |
| Score Read (Points) | 1439 | 913 -37% | 1328 -8% | 1729 20% | 1437 0% | 1786 ? 24% |
| Score Write (Points) | 2170 | 1034 -52% | 1343 -38% | 2034 -6% | 1447 -33% | 2144 ? -1% |
| Score Total (Points) | 4283 | 2392 -44% | 3366 -21% | 4630 8% | 3624 -15% | 4826 ? 13% |
| Totalt genomsnitt (program/inställningar) | -26% /
-31% | 3% /
-0% | 5% /
6% | -12% /
-14% | 11% /
11% |
* ... mindre är bättre

Constant Performance Reads: DiskSpd Read Loop, Queue Depth 8
| 3DMark 11 Performance | 25058 poäng | |
| 3DMark Cloud Gate Standard Score | 45467 poäng | |
| 3DMark Fire Strike Score | 19929 poäng | |
| 3DMark Time Spy Score | 8883 poäng | |
Hjälp | ||
| The Witcher 3 - 1920x1080 Ultra Graphics & Postprocessing (HBAO+) | |
| Genomsnitt av klass Gaming (95 - 240, n=8, senaste 2 åren) | |
| Genomsnitt NVIDIA GeForce RTX 2080 Super Max-Q (74.3 - 96, n=11) | |
| Asus Zephyrus S17 GX701LXS | |
| Lenovo Legion Y740-17IRHg-81UJ001VGE | |
| Razer Blade Pro 17 RTX 2070 Max-Q 300 Hz | |
| Alienware m17 R2 P41E | |
| MSI GS75 10SF-609US | |
| X-Plane 11.11 - 1920x1080 high (fps_test=3) | |
| Genomsnitt av klass Gaming (52.1 - 143.5, n=115, senaste 2 åren) | |
| Razer Blade Pro 17 RTX 2070 Max-Q 300 Hz | |
| MSI GS75 10SF-609US | |
| Asus Zephyrus S17 GX701LXS | |
| Genomsnitt NVIDIA GeForce RTX 2080 Super Max-Q (76.8 - 87.6, n=6) | |
| Lenovo Legion Y740-17IRHg-81UJ001VGE | |
| Dota 2 Reborn | |
| 1920x1080 high (2/3) | |
| Genomsnitt av klass Gaming (82.8 - 275, n=111, senaste 2 åren) | |
| Razer Blade Pro 17 RTX 2070 Max-Q 300 Hz | |
| MSI GS75 10SF-609US | |
| Genomsnitt NVIDIA GeForce RTX 2080 Super Max-Q (117.4 - 139, n=6) | |
| Lenovo Legion Y740-17IRHg-81UJ001VGE | |
| Asus Zephyrus S17 GX701LXS | |
| 1920x1080 ultra (3/3) best looking | |
| Genomsnitt av klass Gaming (84.8 - 248, n=112, senaste 2 åren) | |
| Razer Blade Pro 17 RTX 2070 Max-Q 300 Hz | |
| MSI GS75 10SF-609US | |
| Genomsnitt NVIDIA GeForce RTX 2080 Super Max-Q (115 - 128, n=6) | |
| Lenovo Legion Y740-17IRHg-81UJ001VGE | |
| Asus Zephyrus S17 GX701LXS | |
| Far Cry 5 - 1920x1080 Ultra Preset AA:T | |
| Genomsnitt av klass Gaming (70 - 151, n=10, senaste 2 åren) | |
| Asus Zephyrus S17 GX701LXS | |
| Genomsnitt NVIDIA GeForce RTX 2080 Super Max-Q (91 - 110, n=4) | |
| Doom Eternal - 1920x1080 Ultra Preset | |
| Asus Zephyrus S17 GX701LXS | |
| Genomsnitt NVIDIA GeForce RTX 2080 Super Max-Q (140 - 177.7, n=8) | |
| Final Fantasy XV Benchmark - 1920x1080 High Quality | |
| Genomsnitt av klass Gaming (41 - 215, n=103, senaste 2 åren) | |
| Genomsnitt NVIDIA GeForce RTX 2080 Super Max-Q (67 - 80.8, n=2) | |
| Asus Zephyrus S17 GX701LXS | |
| låg | med. | hög | ultra | |
|---|---|---|---|---|
| The Witcher 3 (2015) | 82.6 | |||
| Dota 2 Reborn (2015) | 146.6 | 135.8 | 124.2 | 117.7 |
| Final Fantasy XV Benchmark (2018) | 67 | |||
| X-Plane 11.11 (2018) | 114 | 97.6 | 82.8 | |
| Far Cry 5 (2018) | 101 | |||
| Doom Eternal (2020) | 177.7 |
Ljudnivå
| Låg belastning |
| 32 / 35 / 43 dB(A) |
| Hög belastning |
| 44 / 45 dB(A) |
 | ||
30 dB tyst 40 dB(A) hörbar 50 dB(A) högt ljud |
||
min: | ||
(-) Den maximala temperaturen på ovansidan är 57 °C / 135 F, jämfört med genomsnittet av 40.4 °C / 105 F , allt från 21.2 till 68.8 °C för klassen Gaming.
(-) Botten värms upp till maximalt 51 °C / 124 F, jämfört med genomsnittet av 43.2 °C / 110 F
(+) Vid tomgångsbruk är medeltemperaturen för ovansidan 27.6 °C / 82 F, jämfört med enhetsgenomsnittet på 33.9 °C / ### class_avg_f### F.
(-) När du spelar The Witcher 3 är medeltemperaturen för ovansidan 48.6 °C / 119 F, jämfört med enhetsgenomsnittet på 33.9 °C / ## #class_avg_f### F.
(-) Handledsstöden och pekplattan kan bli väldigt varma vid beröring med maximalt 40 °C / 104 F.
(-) Medeltemperaturen för handledsstödsområdet på liknande enheter var 28.8 °C / 83.8 F (-11.2 °C / -20.2 F).
Asus Zephyrus S17 GX701LXS ljudanalys
(+) | högtalare kan spela relativt högt (82 dB)
Bas 100 - 315 Hz
(±) | reducerad bas - i genomsnitt 8.4% lägre än medianen
(±) | linjäriteten för basen är genomsnittlig (11.6% delta till föregående frekvens)
Mellan 400 - 2000 Hz
(+) | balanserad mellan - endast 2.2% från medianen
(+) | mids är linjära (2.9% delta till föregående frekvens)
Högsta 2 - 16 kHz
(+) | balanserade toppar - endast 4.3% från medianen
(+) | toppar är linjära (4.3% delta till föregående frekvens)
Totalt 100 - 16 000 Hz
(+) | det totala ljudet är linjärt (11% skillnad mot median)
Jämfört med samma klass
» 7% av alla testade enheter i den här klassen var bättre, 3% liknande, 89% sämre
» Den bästa hade ett delta på 6%, genomsnittet var 18%, sämst var 132%
Jämfört med alla testade enheter
» 6% av alla testade enheter var bättre, 2% liknande, 92% sämre
» Den bästa hade ett delta på 4%, genomsnittet var 24%, sämst var 134%
| Av/Standby | |
| Låg belastning | |
| Hög belastning |
|
Förklaring:
min: | |
| Asus Zephyrus S17 GX701LXS i7-10875H, GeForce RTX 2080 Super Max-Q | Razer Blade Pro 17 RTX 2070 Max-Q 300 Hz i7-10875H, GeForce RTX 2070 Max-Q | MSI GS75 10SF-609US i7-10875H, GeForce RTX 2070 Max-Q | Lenovo Legion Y740-17IRHg-81UJ001VGE i7-9750H, GeForce RTX 2080 Max-Q | Alienware m17 R2 P41E i9-9980HK, GeForce RTX 2080 Max-Q | Genomsnitt NVIDIA GeForce RTX 2080 Super Max-Q | Genomsnitt av klass Gaming | |
|---|---|---|---|---|---|---|---|
| Power Consumption | -25% | -26% | -18% | -75% | -3% | -7% | |
| Idle Minimum * (Watt) | 10 | 19.6 -96% | 19.2 -92% | 15.7 -57% | 24.7 -147% | 12.9 ? -29% | 13.2 ? -32% |
| Idle Average * (Watt) | 16 | 21.7 -36% | 22.4 -40% | 26.3 -64% | 35.9 -124% | 17.3 ? -8% | 18.9 ? -18% |
| Idle Maximum * (Watt) | 29 | 36.1 -24% | 34.7 -20% | 28 3% | 69.6 -140% | 26.9 ? 7% | 24.3 ? 16% |
| Load Average * (Watt) | 143 | 115.6 19% | 106.7 25% | 136 5% | 141.8 1% | 123.9 ? 13% | 108 ? 24% |
| Witcher 3 ultra * (Watt) | 146 | 157 -8% | 160.5 -10% | 160 -10% | 185.8 -27% | ||
| Load Maximum * (Watt) | 205 | 219.9 -7% | 248.7 -21% | 177 14% | 235.4 -15% | 205 ? -0% | 254 ? -24% |
* ... mindre är bättre
| Asus Zephyrus S17 GX701LXS i7-10875H, GeForce RTX 2080 Super Max-Q, 76 Wh | Razer Blade Pro 17 RTX 2070 Max-Q 300 Hz i7-10875H, GeForce RTX 2070 Max-Q, 70 Wh | MSI GS75 10SF-609US i7-10875H, GeForce RTX 2070 Max-Q, 80.25 Wh | Lenovo Legion Y740-17IRHg-81UJ001VGE i7-9750H, GeForce RTX 2080 Max-Q, 76 Wh | Alienware m17 R2 P41E i9-9980HK, GeForce RTX 2080 Max-Q, 76 Wh | Genomsnitt av klass Gaming | |
|---|---|---|---|---|---|---|
| Batteridrifttid | 75% | 131% | -1% | 36% | 99% | |
| Reader / Idle (h) | 3.5 | 8.6 146% | 3.8 9% | 7.1 103% | 8.71 ? 149% | |
| WiFi v1.3 (h) | 2.8 | 4.9 75% | 4.9 75% | 3 7% | 4.8 71% | 7.02 ? 151% |
| Load (h) | 1.5 | 4.1 173% | 1.2 -20% | 0.5 -67% | 1.47 ? -2% |
För
Emot
Omdöme - En modern spellaptop med hög prestanda
Läs den fullständiga versionen av den här recensionen på engelska här.
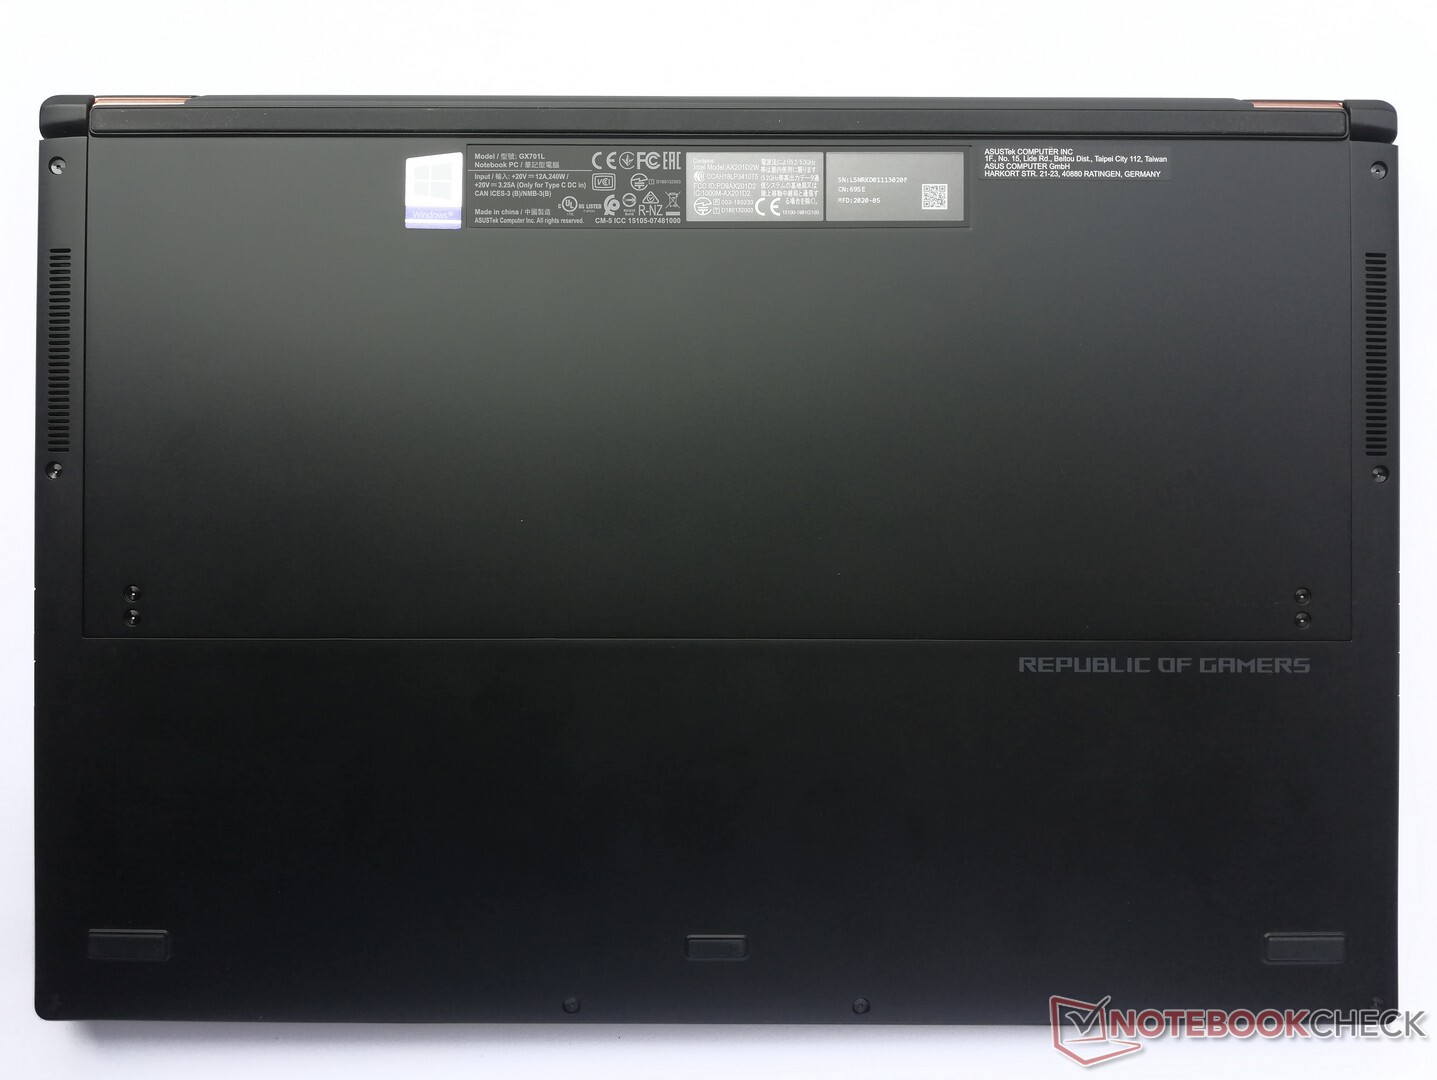
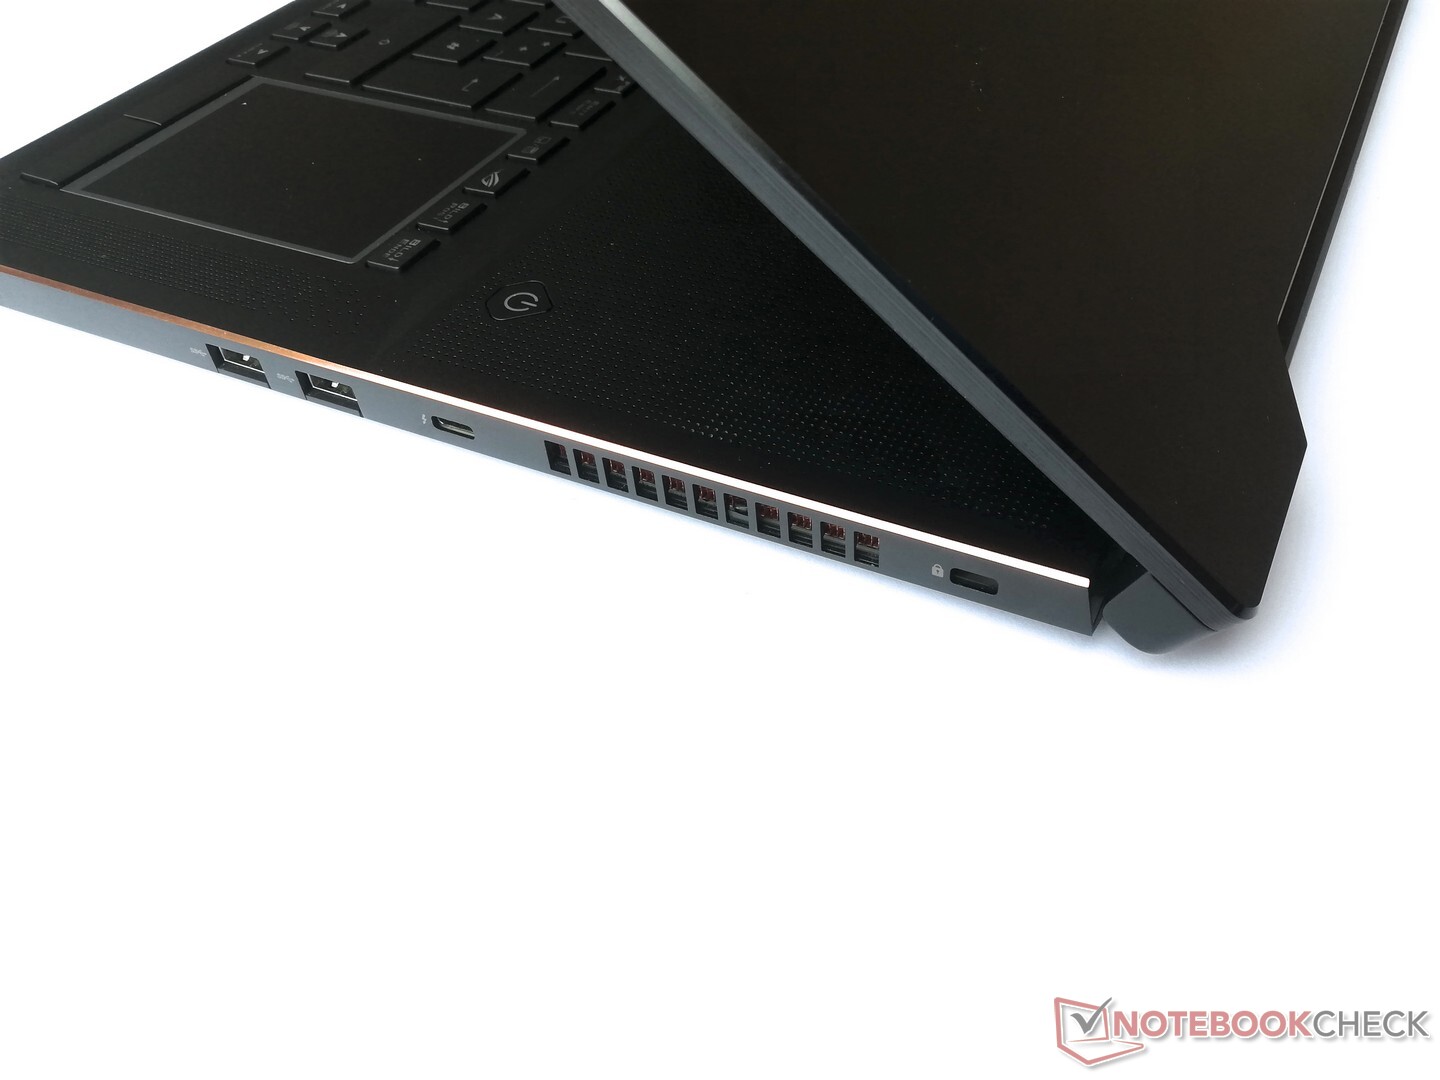
Köper du Zephyrus S17 GX701LXS kommer du inte behöva oroa dig för hårdvarans prestanda på väldigt länge. Detta räcker helt och hållet för aktuella spel och de kan till och med spelas i det tystare "Quiet"-läget som gör att fläktarna inte längre låter som ett motorrum. I vårt tycke fungerar Asus kyllösning bra och vi påverkades inte av den resulterande tangentbordsplaceringen i vårt dagliga arbete. Men den lilla öppningen på höljets undersida när locket är öppnat skapar ett väldigt instabilt intryck, så vi skulle bara använda Zephyrus S17 på ett fast underlag.
Asus Zephyrus S17 har massor av prestanda som den dessutom kan upprätthålla under längre tidsperioder tack vare ett raffinerat kylsystem.
Men den som vill få ut mesta möjliga från sin Asus Zephyrus S17 kommer förr eller senare vilja använda "Turbo"-läget. I synnerhet lär prestandakraven vara högre för 4K eller VR-program än för de Full HD-spel vi testat här. Vi hade dock oroat oss mindre för konsekvent prestanda och mer för ljudnivån. När fläktarna sätter igång helt och hållet är det bara hörlurar som gäller. Men eftersom detta inte är något ovanligt för en spellaptop lämnar Asus Zephyrus S17 ändå ett totalt sett bra intryck.
Asus Zephyrus S17 GX701LXS
- 08/16/2020 v7 (old)
Mike Wobker
Price comparison
