Test: Acer Predator Triton 500 - Superstjärna (Sammanfattning)
Gradering | Datum | Modell | Vikt | Höjd | Storlek | Upplösning | Pris |
|---|---|---|---|---|---|---|---|
v (old) | 04/2020 | Acer Predator Triton 500 PT515-52-70N3 i7-10750H, GeForce RTX 2080 Super Max-Q | 2.1 kg | 18 mm | 15.60" | 1920x1080 | |
| 83.8 % v7 (old) | 06/2019 | MSI GS65 Stealth 9SG i7-9750H, GeForce RTX 2080 Max-Q | 2 kg | 18 mm | 15.60" | 1920x1080 | |
| 88.8 % v6 (old) | 05/2019 | Razer Blade 15 RTX 2080 Max-Q i7-9750H, GeForce RTX 2080 Max-Q | 2.2 kg | 17.8 mm | 15.60" | 1920x1080 | |
| 83 % v7 (old) | 09/2019 | Alienware m15 R2 P87F i7-9750H, GeForce RTX 2080 Max-Q | 2.2 kg | 18.3 mm | 15.60" | 1920x1080 |
| Networking | |
| iperf3 transmit AX12 | |
| Acer Predator Triton 500 PT515-52-70N3 | |
| iperf3 receive AX12 | |
| Acer Predator Triton 500 PT515-52-70N3 | |


| |||||||||||||||||||||||||
Distribution av ljusstyrkan: 88 %
Mitt på batteriet: 320 cd/m²
Kontrast: 1333:1 (Svärta: 0.24 cd/m²)
ΔE ColorChecker Calman: 4.03 | ∀{0.5-29.43 Ø4.73}
calibrated: 0.98
ΔE Greyscale Calman: 5.94 | ∀{0.09-98 Ø4.97}
99% sRGB (Argyll 1.6.3 3D)
66% AdobeRGB 1998 (Argyll 1.6.3 3D)
72.2% AdobeRGB 1998 (Argyll 3D)
99.5% sRGB (Argyll 3D)
70.3% Display P3 (Argyll 3D)
Gamma: 2.42
CCT: 6751 K
| Acer Predator Triton 500 PT515-52-70N3 AUO B156HAN12.0 (AUO7A8C), IPS, 1920x1080, 15.6" | MSI GS65 Stealth 9SG Sharp LQ156M1JW03 (SHP14C5), IPS, 1920x1080, 15.6" | Razer Blade 15 RTX 2080 Max-Q Sharp LQ156M1JW03 (SHP14C5), IPS, 1920x1080, 15.6" | Alienware m15 R2 P87F Sharp LQ156M1, IPS, 1920x1080, 15.6" | |
|---|---|---|---|---|
| Display | -4% | -4% | -7% | |
| Display P3 Coverage (%) | 70.3 | 67.6 -4% | 66.9 -5% | 65.3 -7% |
| sRGB Coverage (%) | 99.5 | 97.5 -2% | 98.1 -1% | 95.1 -4% |
| AdobeRGB 1998 Coverage (%) | 72.2 | 68.9 -5% | 68.5 -5% | 65.9 -9% |
| Response Times | -5% | 6% | 1% | |
| Response Time Grey 50% / Grey 80% * (ms) | 14.4 ? | 13.6 ? 6% | 12.8 ? 11% | 16.4 ? -14% |
| Response Time Black / White * (ms) | 10.4 ? | 12 ? -15% | 10.4 ? -0% | 8.8 ? 15% |
| PWM Frequency (Hz) | 23260 ? | 23810 ? | 23810 ? | |
| Screen | 10% | 7% | -26% | |
| Brightness middle (cd/m²) | 320 | 282.3 -12% | 293 -8% | 324.2 1% |
| Brightness (cd/m²) | 318 | 269 -15% | 270 -15% | 304 -4% |
| Brightness Distribution (%) | 88 | 90 2% | 87 -1% | 90 2% |
| Black Level * (cd/m²) | 0.24 | 0.32 -33% | 0.29 -21% | 0.38 -58% |
| Contrast (:1) | 1333 | 882 -34% | 1010 -24% | 853 -36% |
| Colorchecker dE 2000 * | 4.03 | 1.17 71% | 1.69 58% | 5.01 -24% |
| Colorchecker dE 2000 max. * | 8.43 | 3.29 61% | 3.37 60% | 12.7 -51% |
| Colorchecker dE 2000 calibrated * | 0.98 | 1.06 -8% | 1.24 -27% | 1.64 -67% |
| Greyscale dE 2000 * | 5.94 | 1.3 78% | 2.3 61% | 7.9 -33% |
| Gamma | 2.42 91% | 2.2 100% | 2.3 96% | 2.35 94% |
| CCT | 6751 96% | 6643 98% | 6758 96% | 8455 77% |
| Color Space (Percent of AdobeRGB 1998) (%) | 66 | 63.8 -3% | 63 -5% | 60.8 -8% |
| Color Space (Percent of sRGB) (%) | 99 | 97.5 -2% | 98.5 -1% | 95.5 -4% |
| Totalt genomsnitt (program/inställningar) | 0% /
5% | 3% /
5% | -11% /
-19% |
* ... mindre är bättre
Visa svarstider
| ↔ Svarstid svart till vitt | ||
|---|---|---|
| 10.4 ms ... stiga ↗ och falla ↘ kombinerat | ↗ 5.2 ms stiga | 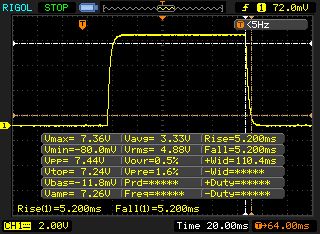 |
| ↘ 5.2 ms hösten | ||
| Skärmen visar bra svarsfrekvens i våra tester, men kan vara för långsam för konkurrenskraftiga spelare. I jämförelse sträcker sig alla testade enheter från 0.1 (minst) till 240 (maximalt) ms. » 28 % av alla enheter är bättre. Det betyder att den uppmätta svarstiden är bättre än genomsnittet av alla testade enheter (19.9 ms). | ||
| ↔ Svarstid 50 % grått till 80 % grått | ||
| 14.4 ms ... stiga ↗ och falla ↘ kombinerat | ↗ 7.2 ms stiga | 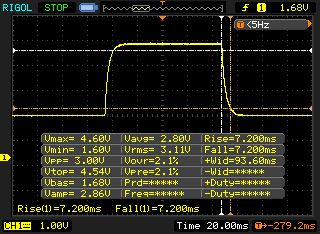 |
| ↘ 7.2 ms hösten | ||
| Skärmen visar bra svarsfrekvens i våra tester, men kan vara för långsam för konkurrenskraftiga spelare. I jämförelse sträcker sig alla testade enheter från 0.165 (minst) till 636 (maximalt) ms. » 28 % av alla enheter är bättre. Det betyder att den uppmätta svarstiden är bättre än genomsnittet av alla testade enheter (31.1 ms). | ||
Skärmflimmer / PWM (Puls-Width Modulation)
| Skärmflimmer / PWM upptäcktes inte | 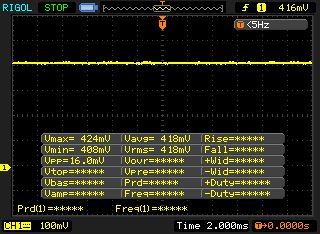 | ||
Som jämförelse: 52 % av alla testade enheter använder inte PWM för att dämpa skärmen. Om PWM upptäcktes mättes ett medelvärde av 7798 (minst: 5 - maximum: 343500) Hz. | |||
| DPC Latencies / LatencyMon - interrupt to process latency (max), Web, Youtube, Prime95 | |
| Acer Predator Triton 500 PT515-52-70N3 | |
* ... mindre är bättre
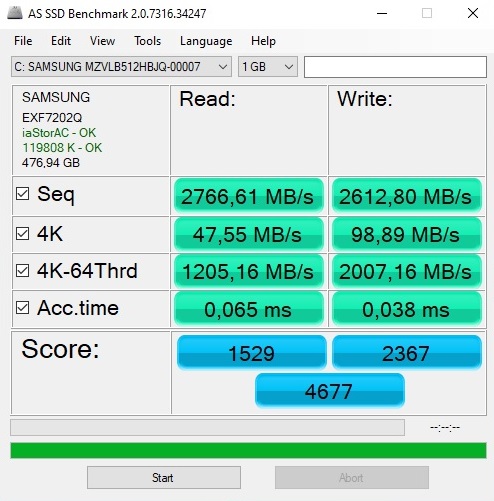
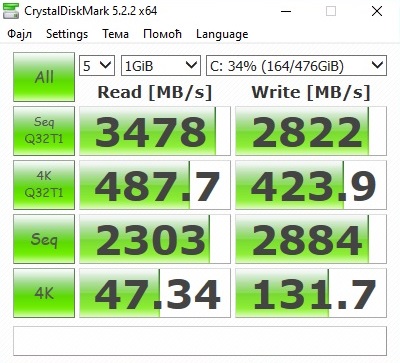
| Acer Predator Triton 500 PT515-52-70N3 Samsung SSD PM981a MZVLB512HBJQ | MSI GS65 Stealth 9SG Samsung SSD PM981 MZVLB512HAJQ | Razer Blade 15 RTX 2080 Max-Q Samsung SSD PM981 MZVLB512HAJQ | Alienware m15 R2 P87F 2x Toshiba XG6 KXG60ZNV512G (RAID 0) | |
|---|---|---|---|---|
| CrystalDiskMark 5.2 / 6 | -21% | -11% | 1% | |
| Write 4K (MB/s) | 131.7 | 91.3 -31% | 137.2 4% | 108.8 -17% |
| Read 4K (MB/s) | 47.34 | 40.73 -14% | 46.82 -1% | 45.41 -4% |
| Write Seq (MB/s) | 2884 | 1915 -34% | 1221 -58% | 2467 -14% |
| Read Seq (MB/s) | 2303 | 2051 -11% | 1217 -47% | 2456 7% |
| Write 4K Q32T1 (MB/s) | 423.9 | 308.3 -27% | 527 24% | 532 26% |
| Read 4K Q32T1 (MB/s) | 487.7 | 417.4 -14% | 614 26% | 590 21% |
| Write Seq Q32T1 (MB/s) | 2822 | 1922 -32% | 1986 -30% | 2801 -1% |
| Read Seq Q32T1 (MB/s) | 3478 | 3395 -2% | 3234 -7% | 3172 -9% |

| 3DMark 06 Standard Score | 38265 poäng | |
| 3DMark Vantage P Result | 60306 poäng | |
| 3DMark 11 Performance | 22730 poäng | |
| 3DMark Cloud Gate Standard Score | 38107 poäng | |
| 3DMark Fire Strike Score | 18678 poäng | |
| 3DMark Time Spy Score | 8043 poäng | |
Hjälp | ||
| The Witcher 3 - 1920x1080 Ultra Graphics & Postprocessing (HBAO+) | |
| Genomsnitt av klass Gaming (95 - 240, n=8, senaste 2 åren) | |
| Acer Predator Triton 500 PT515-52-70N3 | |
| Alienware m15 R2 P87F | |
| Razer Blade 15 RTX 2080 Max-Q | |
| MSI GS65 Stealth 9SG | |
| låg | med. | hög | ultra | QHD | 4K | |
|---|---|---|---|---|---|---|
| GTA V (2015) | 179 | 172 | 153 | 85.8 | ||
| The Witcher 3 (2015) | 236 | 143 | 83.4 | 58.2 | ||
| Dota 2 Reborn (2015) | 146 | 134 | 123 | 118 | ||
| Fortnite (2018) | 121 | 114 | 99.5 | 80.3 | 44.5 | |
| Final Fantasy XV Benchmark (2018) | 103 | 80.8 | 37.6 | |||
| Kingdom Come: Deliverance (2018) | 119 | 100 | 72 | 56.1 | 31.9 | |
| X-Plane 11.11 (2018) | 107 | 93.4 | 79.5 | |||
| Monster Hunter World (2018) | 105 | 97.7 | 90 | 63.3 | 31.9 | |
| Shadow of the Tomb Raider (2018) | 111 | 105 | 97 | 72 | 39 | |
| Assassin´s Creed Odyssey (2018) | 92 | 78 | 58 | 53 | 32 | |
| Hitman 2 (2018) | 86.7 | 78.6 | 77 | 76 | 46.1 | |
| Battlefield V (2018) | 139 | 127 | 119 | 96.1 | 58.7 | |
| Darksiders III (2018) | 112 | 109 | 103 | 82.1 | 43.2 | |
| Just Cause 4 (2018) | 152 | 113 | 105 | 73.9 | 41.3 | |
| Apex Legends (2019) | 194 | 165 | 163 | 118 | 65 | |
| Far Cry New Dawn (2019) | 103 | 97 | 87 | 71 | 48 | |
| Metro Exodus (2019) | 101 | 77.8 | 63.4 | 51.2 | 31.6 | |
| Dirt Rally 2.0 (2019) | 166 | 162 | 98.8 | 76.4 | ||
| The Division 2 (2019) | 129 | 112 | 80 | 59 | 31 | |
| Anno 1800 (2019) | 94 | 74.4 | 44.9 | 38.8 | 23.2 | |
| Rage 2 (2019) | 126 | 106 | 103 | 68.4 | 34.1 | |
| F1 2019 (2019) | 174 | 141 | 138 | 122 | 74 | |
| Control (2019) | 107 | 79.8 | 48.4 | 24.9 | ||
| Borderlands 3 (2019) | 107 | 84.3 | 68.1 | 49.1 | 26.6 | |
| FIFA 20 (2019) | 251 | 241 | 240 | 239 | 190 | |
| Ghost Recon Breakpoint (2019) | 102 | 92 | 70 | 53 | 31 | |
| GRID 2019 (2019) | 85.9 | 77.7 | 72 | 66.4 | 46.9 | |
| Call of Duty Modern Warfare 2019 (2019) | 134 | 129 | 107 | 78.9 | 44.5 | |
| Need for Speed Heat (2019) | 93 | 86.6 | 83.3 | 66.9 | 40.9 | |
| Star Wars Jedi Fallen Order (2019) | 95.7 | 93.1 | 89.9 | 76.2 | 42.7 | |
| Red Dead Redemption 2 (2019) | 98 | 67.4 | 43.7 | 37 | 23.8 | |
| Escape from Tarkov (2020) | 121 | 121 | 119 | 83.1 | 39.7 | |
| Hunt Showdown (2020) | 119 | 101 | 68.8 | 32.4 | ||
| Doom Eternal (2020) | 164 | 150 | 147 | 108 | 58 |
Ljudnivå
| Låg belastning |
| 30 / 33 / 36 dB(A) |
| Hög belastning |
| 50 / 50 dB(A) |
 | ||
30 dB tyst 40 dB(A) hörbar 50 dB(A) högt ljud |
||
min: | ||
| Acer Predator Triton 500 PT515-52-70N3 i7-10750H, GeForce RTX 2080 Super Max-Q | MSI GS65 Stealth 9SG i7-9750H, GeForce RTX 2080 Max-Q | Razer Blade 15 RTX 2080 Max-Q i7-9750H, GeForce RTX 2080 Max-Q | Alienware m15 R2 P87F i7-9750H, GeForce RTX 2080 Max-Q | Genomsnitt av klass Gaming | |
|---|---|---|---|---|---|
| Noise | 7% | 13% | -3% | 12% | |
| av / miljö * (dB) | 30 | 28.3 6% | 28.3 6% | 28.3 6% | 24.1 ? 20% |
| Idle Minimum * (dB) | 30 | 30.4 -1% | 28.8 4% | 28.5 5% | 25.8 ? 14% |
| Idle Average * (dB) | 33 | 30.5 8% | 28.8 13% | 28.5 14% | 27.4 ? 17% |
| Idle Maximum * (dB) | 36 | 30.6 15% | 29 19% | 49 -36% | 30 ? 17% |
| Load Average * (dB) | 50 | 37.6 25% | 33.5 33% | 49 2% | 43 ? 14% |
| Witcher 3 ultra * (dB) | 48 | 46 4% | 45 6% | 49 -2% | |
| Load Maximum * (dB) | 50 | 55.1 -10% | 45.2 10% | 55 -10% | 54 ? -8% |
* ... mindre är bättre
(±) Den maximala temperaturen på ovansidan är 44 °C / 111 F, jämfört med genomsnittet av 40.4 °C / 105 F , allt från 21.2 till 68.8 °C för klassen Gaming.
(-) Botten värms upp till maximalt 50 °C / 122 F, jämfört med genomsnittet av 43.2 °C / 110 F
(+) Vid tomgångsbruk är medeltemperaturen för ovansidan 27.9 °C / 82 F, jämfört med enhetsgenomsnittet på 33.9 °C / ### class_avg_f### F.
(-) När du spelar The Witcher 3 är medeltemperaturen för ovansidan 40.7 °C / 105 F, jämfört med enhetsgenomsnittet på 33.9 °C / ## #class_avg_f### F.
(-) Handledsstöden och pekplattan kan bli väldigt varma vid beröring med maximalt 40 °C / 104 F.
(-) Medeltemperaturen för handledsstödsområdet på liknande enheter var 28.8 °C / 83.8 F (-11.2 °C / -20.2 F).
| Acer Predator Triton 500 PT515-52-70N3 i7-10750H, GeForce RTX 2080 Super Max-Q | MSI GS65 Stealth 9SG i7-9750H, GeForce RTX 2080 Max-Q | Razer Blade 15 RTX 2080 Max-Q i7-9750H, GeForce RTX 2080 Max-Q | Alienware m15 R2 P87F i7-9750H, GeForce RTX 2080 Max-Q | Genomsnitt av klass Gaming | |
|---|---|---|---|---|---|
| Heat | -5% | -1% | -11% | -4% | |
| Maximum Upper Side * (°C) | 44 | 45.6 -4% | 47 -7% | 53.8 -22% | 45.2 ? -3% |
| Maximum Bottom * (°C) | 50 | 53.8 -8% | 49.2 2% | 58 -16% | 48 ? 4% |
| Idle Upper Side * (°C) | 29 | 28.6 1% | 28.6 1% | 29.8 -3% | 31.1 ? -7% |
| Idle Bottom * (°C) | 31 | 33.2 -7% | 31.4 -1% | 32.2 -4% | 34.2 ? -10% |
* ... mindre är bättre
Acer Predator Triton 500 PT515-52-70N3 ljudanalys
(+) | högtalare kan spela relativt högt (83 dB)
Bas 100 - 315 Hz
(-) | nästan ingen bas - i genomsnitt 20.2% lägre än medianen
(±) | linjäriteten för basen är genomsnittlig (11.3% delta till föregående frekvens)
Mellan 400 - 2000 Hz
(+) | balanserad mellan - endast 3.7% från medianen
(+) | mids är linjära (3.2% delta till föregående frekvens)
Högsta 2 - 16 kHz
(+) | balanserade toppar - endast 3.2% från medianen
(+) | toppar är linjära (6.1% delta till föregående frekvens)
Totalt 100 - 16 000 Hz
(±) | linjäriteten för det totala ljudet är genomsnittlig (17% skillnad mot median)
Jämfört med samma klass
» 45% av alla testade enheter i den här klassen var bättre, 12% liknande, 43% sämre
» Den bästa hade ett delta på 6%, genomsnittet var 18%, sämst var 132%
Jämfört med alla testade enheter
» 30% av alla testade enheter var bättre, 8% liknande, 62% sämre
» Den bästa hade ett delta på 4%, genomsnittet var 24%, sämst var 134%
MSI GS65 Stealth 9SG ljudanalys
(+) | högtalare kan spela relativt högt (89.4 dB)
Bas 100 - 315 Hz
(-) | nästan ingen bas - i genomsnitt 22.7% lägre än medianen
(±) | linjäriteten för basen är genomsnittlig (9% delta till föregående frekvens)
Mellan 400 - 2000 Hz
(±) | högre mellan - i genomsnitt 7% högre än median
(+) | mids är linjära (6.4% delta till föregående frekvens)
Högsta 2 - 16 kHz
(+) | balanserade toppar - endast 2.7% från medianen
(±) | linjäriteten för toppar är genomsnittlig (10.6% delta till föregående frekvens)
Totalt 100 - 16 000 Hz
(±) | linjäriteten för det totala ljudet är genomsnittlig (23.1% skillnad mot median)
Jämfört med samma klass
» 84% av alla testade enheter i den här klassen var bättre, 5% liknande, 12% sämre
» Den bästa hade ett delta på 6%, genomsnittet var 18%, sämst var 132%
Jämfört med alla testade enheter
» 69% av alla testade enheter var bättre, 5% liknande, 26% sämre
» Den bästa hade ett delta på 4%, genomsnittet var 24%, sämst var 134%
| Av/Standby | |
| Låg belastning | |
| Hög belastning |
|
Förklaring:
min: | |
| Acer Predator Triton 500 PT515-52-70N3 i7-10750H, GeForce RTX 2080 Super Max-Q | MSI GS65 Stealth 9SG i7-9750H, GeForce RTX 2080 Max-Q | Razer Blade 15 RTX 2080 Max-Q i7-9750H, GeForce RTX 2080 Max-Q | Alienware m15 R2 P87F i7-9750H, GeForce RTX 2080 Max-Q | Genomsnitt av klass Gaming | |
|---|---|---|---|---|---|
| Power Consumption | -22% | -2% | -71% | -15% | |
| Idle Minimum * (Watt) | 11 | 18.3 -66% | 12.5 -14% | 19 -73% | 13.2 ? -20% |
| Idle Average * (Watt) | 15 | 22 -47% | 15.3 -2% | 40.5 -170% | 18.9 ? -26% |
| Idle Maximum * (Watt) | 25 | 28.8 -15% | 20.7 17% | 52 -108% | 24.3 ? 3% |
| Load Average * (Watt) | 95 | 93 2% | 90.2 5% | 132.3 -39% | 108 ? -14% |
| Witcher 3 ultra * (Watt) | 140 | 142.6 -2% | 162 -16% | 183.3 -31% | |
| Load Maximum * (Watt) | 211 | 215.9 -2% | 209.3 1% | 217.2 -3% | 254 ? -20% |
* ... mindre är bättre
| Acer Predator Triton 500 PT515-52-70N3 i7-10750H, GeForce RTX 2080 Super Max-Q, 84 Wh | MSI GS65 Stealth 9SG i7-9750H, GeForce RTX 2080 Max-Q, 82 Wh | Razer Blade 15 RTX 2080 Max-Q i7-9750H, GeForce RTX 2080 Max-Q, 80 Wh | Alienware m15 R2 P87F i7-9750H, GeForce RTX 2080 Max-Q, 76 Wh | Genomsnitt av klass Gaming | |
|---|---|---|---|---|---|
| Batteridrifttid | -5% | 43% | -16% | 10% | |
| Reader / Idle (h) | 8.3 | 15.9 92% | 9.2 11% | 8.71 ? 5% | |
| WiFi v1.3 (h) | 6.3 | 6 -5% | 6.6 5% | 5.5 -13% | 7.02 ? 11% |
| Load (h) | 1.3 | 1.7 31% | 0.7 -46% | 1.47 ? 13% |
För
Emot
Läs den fullständiga versionen av den här recensionen på engelska här.
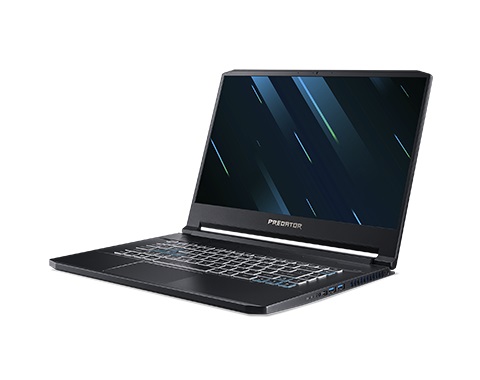
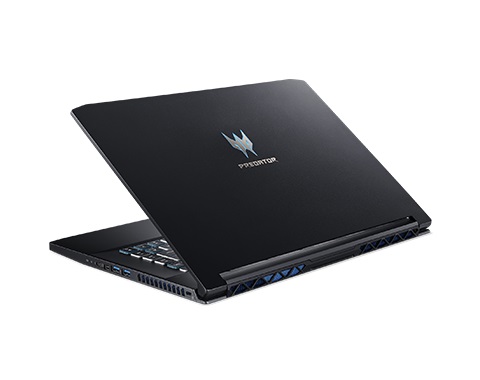
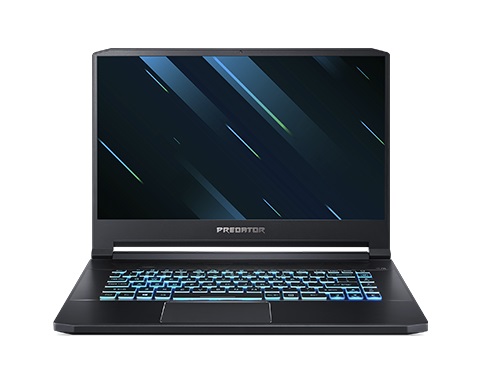
Även under 2020 imponerar Predator Triton 500 med sin kombination av låg vikt, kompakta dimensioner och generös styrka.
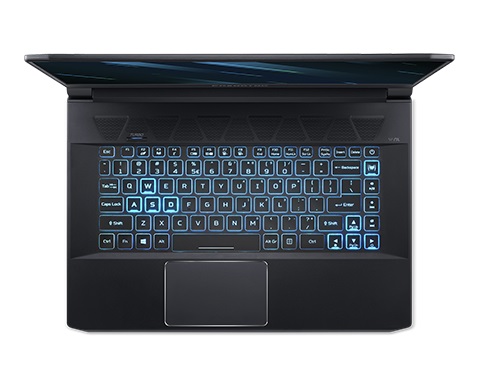
Det relativt lätta och tunna höljet på 15 tum kan ta sig an betydligt tjockare kollegor i ett flertal prestandatester, men Max-Q-versionen av RTX 2080 Super är inte direkt det bästa valet ur ett pris-prestanda perspektiv. Oavsett så säkrar den snabba GPU:n smidig bilduppdatering i Full HD även i moderna titlar (med maximala inställningar, förstås). En annan höjdpunkt är 300 Hz-skärmen, som inte bara kändes responsiv utan också hade rik kontrast.
Totalt sett finns det knappt något att ge den nya versionen av Triton 500 kritik för. Det enda vi har att anmärka på är, som ofta är fallet, hög ljudnivå vid belastning.
Price comparison