Test: Asus ROG Zephyrus Duo 15 GX550LXS - Unik spellaptop med mycket prestanda under huven (Sammanfattning)
Gradering | Datum | Modell | Vikt | Höjd | Storlek | Upplösning | Pris |
|---|---|---|---|---|---|---|---|
| 84.5 % v7 (old) | 07/2020 | Asus ROG Zephyrus Duo 15 GX550LXS i9-10980HK, GeForce RTX 2080 Super Max-Q | 2.5 kg | 20 mm | 15.60" | 3840x2160 | |
v (old) | 04/2020 | Acer Predator Triton 500 PT515-52-70N3 i7-10750H, GeForce RTX 2080 Super Max-Q | 2.1 kg | 18 mm | 15.60" | 1920x1080 | |
| 82.8 % v7 (old) | 05/2020 | MSI GS66 Stealth 10SFS i9-10980HK, GeForce RTX 2070 Super Max-Q | 2.2 kg | 20 mm | 15.60" | 1920x1080 | |
| 85.8 % v7 (old) | 05/2020 | Gigabyte Aero 15 OLED XB-8DE51B0SP i7-10875H, GeForce RTX 2070 Super Max-Q | 2.2 kg | 20 mm | 15.60" | 3840x2160 |
| |||||||||||||||||||||||||
Distribution av ljusstyrkan: 90 %
Mitt på batteriet: 398 cd/m²
Kontrast: 1421:1 (Svärta: 0.28 cd/m²)
ΔE ColorChecker Calman: 1.53 | ∀{0.5-29.43 Ø4.72}
calibrated: 0.77
ΔE Greyscale Calman: 2.4 | ∀{0.09-98 Ø4.97}
100% sRGB (Argyll 1.6.3 3D)
100% AdobeRGB 1998 (Argyll 1.6.3 3D)
99.9% AdobeRGB 1998 (Argyll 3D)
100% sRGB (Argyll 3D)
87% Display P3 (Argyll 3D)
Gamma: 2.19
CCT: 6996 K
| Asus ROG Zephyrus Duo 15 GX550LXS AU Optronics B156ZAN03.1, IPS, 3840x2160, 15.6" | Acer Predator Triton 500 PT515-52-70N3 AUO B156HAN12.0 (AUO7A8C), IPS, 1920x1080, 15.6" | MSI GS66 Stealth 10SFS AUO B156HAN12.0 (AUO328E), IPS, 1920x1080, 15.6" | Gigabyte Aero 15 OLED XB-8DE51B0SP Samsung SDCA029, OLED, 3840x2160, 15.6" | |
|---|---|---|---|---|
| Display | -16% | -16% | 4% | |
| Display P3 Coverage (%) | 87 | 70.3 -19% | 69.5 -20% | 99.9 15% |
| sRGB Coverage (%) | 100 | 99.5 0% | 99.6 0% | 100 0% |
| AdobeRGB 1998 Coverage (%) | 99.9 | 72.2 -28% | 70.8 -29% | 98.2 -2% |
| Response Times | 66% | 68% | 95% | |
| Response Time Grey 50% / Grey 80% * (ms) | 56.4 ? | 14.4 ? 74% | 14 ? 75% | 2.2 ? 96% |
| Response Time Black / White * (ms) | 24.4 ? | 10.4 ? 57% | 9.6 ? 61% | 1.8 ? 93% |
| PWM Frequency (Hz) | 60 ? | |||
| Screen | -48% | -31% | -30% | |
| Brightness middle (cd/m²) | 398 | 320 -20% | 316 -21% | 385 -3% |
| Brightness (cd/m²) | 385 | 318 -17% | 311 -19% | 390 1% |
| Brightness Distribution (%) | 90 | 88 -2% | 92 2% | 93 3% |
| Black Level * (cd/m²) | 0.28 | 0.24 14% | 0.21 25% | |
| Contrast (:1) | 1421 | 1333 -6% | 1505 6% | |
| Colorchecker dE 2000 * | 1.53 | 4.03 -163% | 3.03 -98% | 2.46 -61% |
| Colorchecker dE 2000 max. * | 3.69 | 8.43 -128% | 7.32 -98% | 4.01 -9% |
| Colorchecker dE 2000 calibrated * | 0.77 | 0.98 -27% | 1.1 -43% | 2.6 -238% |
| Greyscale dE 2000 * | 2.4 | 5.94 -148% | 3.9 -63% | 1.39 42% |
| Gamma | 2.19 100% | 2.42 91% | 2.42 91% | 2.31 95% |
| CCT | 6996 93% | 6751 96% | 7439 87% | 6395 102% |
| Color Space (Percent of AdobeRGB 1998) (%) | 100 | 66 -34% | 65 -35% | 98 -2% |
| Color Space (Percent of sRGB) (%) | 100 | 99 -1% | 100 0% | 100 0% |
| Totalt genomsnitt (program/inställningar) | 1% /
-28% | 7% /
-16% | 23% /
-5% |
* ... mindre är bättre
Visa svarstider
| ↔ Svarstid svart till vitt | ||
|---|---|---|
| 24.4 ms ... stiga ↗ och falla ↘ kombinerat | ↗ 10 ms stiga | 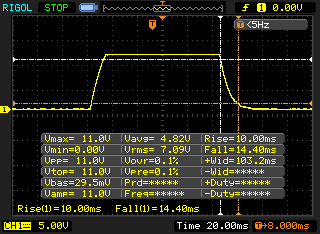 |
| ↘ 14.4 ms hösten | ||
| Skärmen visar bra svarsfrekvens i våra tester, men kan vara för långsam för konkurrenskraftiga spelare. I jämförelse sträcker sig alla testade enheter från 0.1 (minst) till 240 (maximalt) ms. » 57 % av alla enheter är bättre. Detta innebär att den uppmätta svarstiden är sämre än genomsnittet av alla testade enheter (19.8 ms). | ||
| ↔ Svarstid 50 % grått till 80 % grått | ||
| 56.4 ms ... stiga ↗ och falla ↘ kombinerat | ↗ 26.4 ms stiga | 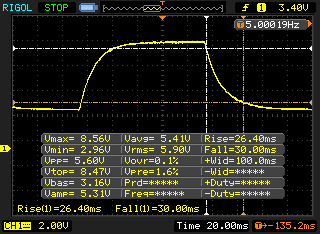 |
| ↘ 30 ms hösten | ||
| Skärmen visar långsamma svarsfrekvenser i våra tester och kommer att vara otillfredsställande för spelare. I jämförelse sträcker sig alla testade enheter från 0.165 (minst) till 636 (maximalt) ms. » 93 % av alla enheter är bättre. Detta innebär att den uppmätta svarstiden är sämre än genomsnittet av alla testade enheter (31 ms). | ||
Skärmflimmer / PWM (Puls-Width Modulation)
| Skärmflimmer / PWM upptäcktes inte | 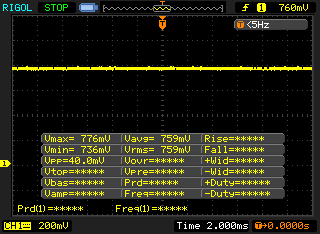 | ||
Som jämförelse: 52 % av alla testade enheter använder inte PWM för att dämpa skärmen. Om PWM upptäcktes mättes ett medelvärde av 7781 (minst: 5 - maximum: 343500) Hz. | |||


| Cinebench R15 | |
| CPU Single 64Bit | |
| Genomsnitt av klass Gaming (188.8 - 343, n=109, senaste 2 åren) | |
| Asus ROG Zephyrus Duo 15 GX550LXS (Turbo) | |
| Gigabyte Aero 15 OLED XB-8DE51B0SP | |
| Genomsnitt Intel Core i9-10980HK (198 - 219, n=15) | |
| Asus ROG Zephyrus Duo 15 GX550LXS | |
| MSI GS66 Stealth 10SFS | |
| Acer Predator Triton 500 PT515-52-70N3 | |
| CPU Multi 64Bit | |
| Genomsnitt av klass Gaming (1578 - 6271, n=109, senaste 2 åren) | |
| Asus ROG Zephyrus Duo 15 GX550LXS (Turbo) | |
| Gigabyte Aero 15 OLED XB-8DE51B0SP | |
| Asus ROG Zephyrus Duo 15 GX550LXS | |
| Genomsnitt Intel Core i9-10980HK (1606 - 1862, n=15) | |
| MSI GS66 Stealth 10SFS | |
| Acer Predator Triton 500 PT515-52-70N3 | |
| Blender - v2.79 BMW27 CPU | |
| Acer Predator Triton 500 PT515-52-70N3 | |
| MSI GS66 Stealth 10SFS | |
| Asus ROG Zephyrus Duo 15 GX550LXS (Turbo) | |
| Asus ROG Zephyrus Duo 15 GX550LXS | |
| Gigabyte Aero 15 OLED XB-8DE51B0SP | |
| Genomsnitt Intel Core i9-10980HK (239 - 299, n=13) | |
| Genomsnitt av klass Gaming (80 - 330, n=107, senaste 2 åren) | |
| 7-Zip 18.03 | |
| 7z b 4 -mmt1 | |
| Genomsnitt av klass Gaming (4199 - 7436, n=108, senaste 2 åren) | |
| Gigabyte Aero 15 OLED XB-8DE51B0SP | |
| Genomsnitt Intel Core i9-10980HK (5081 - 5542, n=13) | |
| Asus ROG Zephyrus Duo 15 GX550LXS | |
| MSI GS66 Stealth 10SFS | |
| Asus ROG Zephyrus Duo 15 GX550LXS (Turbo) | |
| Acer Predator Triton 500 PT515-52-70N3 | |
| 7z b 4 | |
| Genomsnitt av klass Gaming (33491 - 148086, n=108, senaste 2 åren) | |
| Asus ROG Zephyrus Duo 15 GX550LXS | |
| Gigabyte Aero 15 OLED XB-8DE51B0SP | |
| Genomsnitt Intel Core i9-10980HK (43786 - 49275, n=13) | |
| Asus ROG Zephyrus Duo 15 GX550LXS (Turbo) | |
| MSI GS66 Stealth 10SFS | |
| Acer Predator Triton 500 PT515-52-70N3 | |
| HWBOT x265 Benchmark v2.2 - 4k Preset | |
| Genomsnitt av klass Gaming (11.5 - 44.3, n=108, senaste 2 åren) | |
| Gigabyte Aero 15 OLED XB-8DE51B0SP | |
| Genomsnitt Intel Core i9-10980HK (12 - 14.6, n=13) | |
| Asus ROG Zephyrus Duo 15 GX550LXS | |
| Asus ROG Zephyrus Duo 15 GX550LXS (Turbo) | |
| MSI GS66 Stealth 10SFS | |
| Acer Predator Triton 500 PT515-52-70N3 | |
| LibreOffice - 20 Documents To PDF | |
| Asus ROG Zephyrus Duo 15 GX550LXS | |
| Genomsnitt Intel Core i9-10980HK (44 - 89, n=13) | |
| MSI GS66 Stealth 10SFS | |
| Gigabyte Aero 15 OLED XB-8DE51B0SP | |
| Acer Predator Triton 500 PT515-52-70N3 | |
| Genomsnitt av klass Gaming (19 - 88.8, n=108, senaste 2 åren) | |
| Asus ROG Zephyrus Duo 15 GX550LXS (Turbo) | |
| R Benchmark 2.5 - Overall mean | |
| Acer Predator Triton 500 PT515-52-70N3 | |
| Asus ROG Zephyrus Duo 15 GX550LXS (Turbo) | |
| MSI GS66 Stealth 10SFS | |
| Asus ROG Zephyrus Duo 15 GX550LXS | |
| Genomsnitt Intel Core i9-10980HK (0.561 - 0.596, n=13) | |
| Gigabyte Aero 15 OLED XB-8DE51B0SP | |
| Genomsnitt av klass Gaming (0.3439 - 0.759, n=109, senaste 2 åren) | |
* ... mindre är bättre
| PCMark 8 Home Score Accelerated v2 | 3821 poäng | |
| PCMark 8 Creative Score Accelerated v2 | 4210 poäng | |
| PCMark 8 Work Score Accelerated v2 | 4762 poäng | |
| PCMark 10 Score | 5277 poäng | |
Hjälp | ||
| DPC Latencies / LatencyMon - interrupt to process latency (max), Web, Youtube, Prime95 | |
| Acer Predator Triton 500 PT515-52-70N3 | |
| Asus ROG Zephyrus Duo 15 GX550LXS | |
| MSI GS66 Stealth 10SFS | |
| Gigabyte Aero 15 OLED XB-8DE51B0SP | |
* ... mindre är bättre

| Asus ROG Zephyrus Duo 15 GX550LXS 2x Samsung PM981a MZVLB1T0HBLR (RAID 0) | Acer Predator Triton 500 PT515-52-70N3 Samsung SSD PM981a MZVLB512HBJQ | MSI GS66 Stealth 10SFS Samsung SSD PM981 MZVLB1T0HALR | Gigabyte Aero 15 OLED XB-8DE51B0SP Intel Optane Memory H10 with Solid State Storage 32GB + 512GB HBRPEKNX0202A(L/H) | Genomsnitt 2x Samsung PM981a MZVLB1T0HBLR (RAID 0) | |
|---|---|---|---|---|---|
| CrystalDiskMark 5.2 / 6 | -8% | -13% | -4% | 23% | |
| Write 4K (MB/s) | 127.6 | 131.7 3% | 131.3 3% | 127.4 0% | 175.9 ? 38% |
| Read 4K (MB/s) | 48.4 | 47.34 -2% | 45.84 -5% | 147.5 205% | 49.7 ? 3% |
| Write Seq (MB/s) | 2958 | 2884 -3% | 2370 -20% | 485.9 -84% | 4078 ? 38% |
| Read Seq (MB/s) | 2984 | 2303 -23% | 1509 -49% | 1352 -55% | 3653 ? 22% |
| Write 4K Q32T1 (MB/s) | 472.7 | 423.9 -10% | 481.5 2% | 476.5 1% | 540 ? 14% |
| Read 4K Q32T1 (MB/s) | 529 | 487.7 -8% | 560 6% | 531 0% | 456 ? -14% |
| Write Seq Q32T1 (MB/s) | 3431 | 2822 -18% | 2392 -30% | 1061 -69% | 4457 ? 30% |
| Read Seq Q32T1 (MB/s) | 3536 | 3478 -2% | 3232 -9% | 2552 -28% | 5307 ? 50% |
| AS SSD | 2% | -1% | -36% | 9% | |
| Seq Read (MB/s) | 2981 | 2767 -7% | 1065 -64% | 1200 -60% | 3515 ? 18% |
| Seq Write (MB/s) | 2783 | 2613 -6% | 2360 -15% | 836 -70% | 2878 ? 3% |
| 4K Read (MB/s) | 43.98 | 47.55 8% | 48.09 9% | 65.8 50% | 48.4 ? 10% |
| 4K Write (MB/s) | 113.9 | 98.9 -13% | 110.7 -3% | 103.8 -9% | 165.6 ? 45% |
| 4K-64 Read (MB/s) | 1519 | 1205 -21% | 1635 8% | 789 -48% | 1419 ? -7% |
| 4K-64 Write (MB/s) | 1296 | 2007 55% | 1829 41% | 929 -28% | 1348 ? 4% |
| Access Time Read * (ms) | 0.062 | 0.065 -5% | 0.071 -15% | 0.103 -66% | 0.0455 ? 27% |
| Access Time Write * (ms) | 0.033 | 0.038 -15% | 0.034 -3% | 0.045 -36% | 0.04375 ? -33% |
| Score Read (Points) | 1861 | 1529 -18% | 1790 -4% | 975 -48% | 1818 ? -2% |
| Score Write (Points) | 1688 | 2367 40% | 2176 29% | 1117 -34% | 1801 ? 7% |
| Score Total (Points) | 4492 | 4677 4% | 4950 10% | 2594 -42% | 4521 ? 1% |
| Copy ISO MB/s (MB/s) | 2438 | 2919 ? 20% | |||
| Copy Program MB/s (MB/s) | 604 | 706 ? 17% | |||
| Copy Game MB/s (MB/s) | 1404 | 1560 ? 11% | |||
| Totalt genomsnitt (program/inställningar) | -3% /
-2% | -7% /
-6% | -20% /
-22% | 16% /
14% |
* ... mindre är bättre
Kontinuerlig inläsning: DiskSpd Read Loop, Queue Depth 8
| 3DMark 11 Performance | 23526 poäng | |
| 3DMark Cloud Gate Standard Score | 44534 poäng | |
| 3DMark Fire Strike Score | 17714 poäng | |
| 3DMark Time Spy Score | 7780 poäng | |
Hjälp | ||
| 3DMark 11 - 1280x720 Performance GPU | |
| Genomsnitt av klass Gaming (21841 - 80022, n=107, senaste 2 åren) | |
| Asus ROG Zephyrus Duo 15 GX550LXS (Turbo) | |
| Acer Predator Triton 500 PT515-52-70N3 | |
| Genomsnitt NVIDIA GeForce RTX 2080 Super Max-Q (26292 - 32995, n=10) | |
| Gigabyte Aero 15 OLED XB-8DE51B0SP | |
| Asus ROG Zephyrus Duo 15 GX550LXS | |
| MSI GS66 Stealth 10SFS | |
| 3DMark | |
| 1920x1080 Fire Strike Graphics | |
| Genomsnitt av klass Gaming (12242 - 62849, n=119, senaste 2 åren) | |
| Asus ROG Zephyrus Duo 15 GX550LXS (Turbo) | |
| Acer Predator Triton 500 PT515-52-70N3 | |
| Genomsnitt NVIDIA GeForce RTX 2080 Super Max-Q (19655 - 23649, n=10) | |
| Gigabyte Aero 15 OLED XB-8DE51B0SP | |
| Asus ROG Zephyrus Duo 15 GX550LXS | |
| MSI GS66 Stealth 10SFS | |
| 2560x1440 Time Spy Graphics | |
| Genomsnitt av klass Gaming (5012 - 26212, n=118, senaste 2 åren) | |
| Asus ROG Zephyrus Duo 15 GX550LXS (Turbo) | |
| Acer Predator Triton 500 PT515-52-70N3 | |
| Genomsnitt NVIDIA GeForce RTX 2080 Super Max-Q (7372 - 8979, n=11) | |
| Gigabyte Aero 15 OLED XB-8DE51B0SP | |
| Asus ROG Zephyrus Duo 15 GX550LXS | |
| MSI GS66 Stealth 10SFS | |
| The Witcher 3 - 1920x1080 Ultra Graphics & Postprocessing (HBAO+) | |
| Genomsnitt av klass Gaming (95 - 240, n=8, senaste 2 åren) | |
| Asus ROG Zephyrus Duo 15 GX550LXS (Turbo) | |
| Genomsnitt NVIDIA GeForce RTX 2080 Super Max-Q (74.3 - 96, n=11) | |
| Acer Predator Triton 500 PT515-52-70N3 | |
| Gigabyte Aero 15 OLED XB-8DE51B0SP | |
| Asus ROG Zephyrus Duo 15 GX550LXS | |
| MSI GS66 Stealth 10SFS | |
| BioShock Infinite - 1920x1080 Ultra Preset, DX11 (DDOF) | |
| Asus ROG Zephyrus Duo 15 GX550LXS (Turbo) | |
| Genomsnitt NVIDIA GeForce RTX 2080 Super Max-Q (170.2 - 181.1, n=4) | |
| Asus ROG Zephyrus Duo 15 GX550LXS | |
| Doom Eternal - 1920x1080 Ultra Preset | |
| Asus ROG Zephyrus Duo 15 GX550LXS (Turbo) | |
| Genomsnitt NVIDIA GeForce RTX 2080 Super Max-Q (140 - 177.7, n=8) | |
| Asus ROG Zephyrus Duo 15 GX550LXS | |
| Acer Predator Triton 500 PT515-52-70N3 | |
| MSI GS66 Stealth 10SFS | |
| Red Dead Redemption 2 - 1920x1080 Maximum Settings | |
| Asus ROG Zephyrus Duo 15 GX550LXS | |
| Acer Predator Triton 500 PT515-52-70N3 | |
| Genomsnitt NVIDIA GeForce RTX 2080 Super Max-Q (40.6 - 45, n=5) | |
| Gigabyte Aero 15 OLED XB-8DE51B0SP | |
| Call of Duty Modern Warfare 2019 - 1920x1080 Maximum Settings AA:T2X Filmic SM | |
| Acer Predator Triton 500 PT515-52-70N3 | |
| Genomsnitt NVIDIA GeForce RTX 2080 Super Max-Q (91.2 - 107, n=4) | |
| Asus ROG Zephyrus Duo 15 GX550LXS | |
| Far Cry 5 - 1920x1080 Ultra Preset AA:T | |
| Genomsnitt av klass Gaming (70 - 151, n=10, senaste 2 åren) | |
| Asus ROG Zephyrus Duo 15 GX550LXS | |
| Genomsnitt NVIDIA GeForce RTX 2080 Super Max-Q (91 - 110, n=4) | |
| Shadow of the Tomb Raider - 1920x1080 Highest Preset AA:T | |
| Genomsnitt av klass Gaming (96 - 116, n=2, senaste 2 åren) | |
| Gigabyte Aero 15 OLED XB-8DE51B0SP | |
| Acer Predator Triton 500 PT515-52-70N3 | |
| Genomsnitt NVIDIA GeForce RTX 2080 Super Max-Q (89 - 106, n=10) | |
| MSI GS66 Stealth 10SFS | |
| Asus ROG Zephyrus Duo 15 GX550LXS (Turbo) | |
| Asus ROG Zephyrus Duo 15 GX550LXS | |
| låg | med. | hög | ultra | QHD | 4K | |
|---|---|---|---|---|---|---|
| BioShock Infinite (2013) | 425.1 | 349.2 | 324.2 | 173.1 | ||
| The Witcher 3 (2015) | 330.5 | 237 | 143.4 | 75.8 | 53.5 | |
| Far Cry 5 (2018) | 143 | 115 | 108 | 102 | 77 | 42 |
| Shadow of the Tomb Raider (2018) | 103 | 95 | 93 | 89 | 67 | 36 |
| Total War: Three Kingdoms (2019) | 245.5 | 136.4 | 86.5 | 62.5 | 39.9 | 19.6 |
| Ghost Recon Breakpoint (2019) | 128 | 93 | 87 | 65 | 49 | 29 |
| Call of Duty Modern Warfare 2019 (2019) | 172.3 | 123.6 | 104.3 | 91.2 | 64.7 | 36.3 |
| Red Dead Redemption 2 (2019) | 131.4 | 99.7 | 68.3 | 44.9 | 36.2 | 23.5 |
| Doom Eternal (2020) | 205 | 168.3 | 154 | 152.1 | 116.7 | 64 |
| Gears Tactics (2020) | 210.4 | 161.2 | 110.6 | 89.7 | 57.9 | 30.3 |
| F1 2020 (2020) | 253 | 167 | 149 | 118 | 89 | 51 |
Ljudnivå
| Låg belastning |
| 33 / 34 / 35 dB(A) |
| Hög belastning |
| 48 / 49 dB(A) |
 | ||
30 dB tyst 40 dB(A) hörbar 50 dB(A) högt ljud |
||
min: | ||
| Asus ROG Zephyrus Duo 15 GX550LXS i9-10980HK, GeForce RTX 2080 Super Max-Q | Acer Predator Triton 500 PT515-52-70N3 i7-10750H, GeForce RTX 2080 Super Max-Q | MSI GS66 Stealth 10SFS i9-10980HK, GeForce RTX 2070 Super Max-Q | Gigabyte Aero 15 OLED XB-8DE51B0SP i7-10875H, GeForce RTX 2070 Super Max-Q | Genomsnitt NVIDIA GeForce RTX 2080 Super Max-Q | Genomsnitt av klass Gaming | |
|---|---|---|---|---|---|---|
| Noise | 0% | -4% | -5% | 4% | 13% | |
| av / miljö * (dB) | 30 | 30 -0% | 30 -0% | 30 -0% | 27.9 ? 7% | 24.1 ? 20% |
| Idle Minimum * (dB) | 33 | 30 9% | 32 3% | 34 -3% | 29.7 ? 10% | 25.8 ? 22% |
| Idle Average * (dB) | 34 | 33 3% | 34 -0% | 36 -6% | 30.8 ? 9% | 27.4 ? 19% |
| Idle Maximum * (dB) | 35 | 36 -3% | 39 -11% | 41 -17% | 35.4 ? -1% | 29.9 ? 15% |
| Load Average * (dB) | 48 | 50 -4% | 53 -10% | 48 -0% | 47.2 ? 2% | 43 ? 10% |
| Witcher 3 ultra * (dB) | 48 | 48 -0% | 48 -0% | 48 -0% | ||
| Load Maximum * (dB) | 49 | 50 -2% | 53 -8% | 54 -10% | 49.6 ? -1% | 54 ? -10% |
* ... mindre är bättre
(±) Den maximala temperaturen på ovansidan är 43 °C / 109 F, jämfört med genomsnittet av 40.4 °C / 105 F , allt från 21.2 till 68.8 °C för klassen Gaming.
(-) Botten värms upp till maximalt 53 °C / 127 F, jämfört med genomsnittet av 43.2 °C / 110 F
(+) Vid tomgångsbruk är medeltemperaturen för ovansidan 29.4 °C / 85 F, jämfört med enhetsgenomsnittet på 33.9 °C / ### class_avg_f### F.
(-) När du spelar The Witcher 3 är medeltemperaturen för ovansidan 40.1 °C / 104 F, jämfört med enhetsgenomsnittet på 33.9 °C / ## #class_avg_f### F.
(-) Handledsstöden och pekplattan kan bli väldigt varma vid beröring med maximalt 44 °C / 111.2 F.
(-) Medeltemperaturen för handledsstödsområdet på liknande enheter var 28.8 °C / 83.8 F (-15.2 °C / -27.4 F).
| Asus ROG Zephyrus Duo 15 GX550LXS i9-10980HK, GeForce RTX 2080 Super Max-Q | Acer Predator Triton 500 PT515-52-70N3 i7-10750H, GeForce RTX 2080 Super Max-Q | MSI GS66 Stealth 10SFS i9-10980HK, GeForce RTX 2070 Super Max-Q | Gigabyte Aero 15 OLED XB-8DE51B0SP i7-10875H, GeForce RTX 2070 Super Max-Q | Genomsnitt NVIDIA GeForce RTX 2080 Super Max-Q | Genomsnitt av klass Gaming | |
|---|---|---|---|---|---|---|
| Heat | 3% | -2% | -2% | -1% | -1% | |
| Maximum Upper Side * (°C) | 43 | 44 -2% | 53 -23% | 49 -14% | 47.9 ? -11% | 45.2 ? -5% |
| Maximum Bottom * (°C) | 53 | 50 6% | 55 -4% | 61 -15% | 51.9 ? 2% | 47.9 ? 10% |
| Idle Upper Side * (°C) | 32 | 29 9% | 28 12% | 27 16% | 30 ? 6% | 31.1 ? 3% |
| Idle Bottom * (°C) | 31 | 31 -0% | 29 6% | 29 6% | 31 ? -0% | 34.2 ? -10% |
* ... mindre är bättre
Asus ROG Zephyrus Duo 15 GX550LXS ljudanalys
(+) | högtalare kan spela relativt högt (87 dB)
Bas 100 - 315 Hz
(-) | nästan ingen bas - i genomsnitt 15.2% lägre än medianen
(+) | basen är linjär (6.2% delta till föregående frekvens)
Mellan 400 - 2000 Hz
(+) | balanserad mellan - endast 3.8% från medianen
(+) | mids är linjära (5.2% delta till föregående frekvens)
Högsta 2 - 16 kHz
(±) | högre toppar - i genomsnitt 5.6% högre än medianen
(+) | toppar är linjära (4.5% delta till föregående frekvens)
Totalt 100 - 16 000 Hz
(+) | det totala ljudet är linjärt (14.5% skillnad mot median)
Jämfört med samma klass
» 27% av alla testade enheter i den här klassen var bättre, 7% liknande, 66% sämre
» Den bästa hade ett delta på 6%, genomsnittet var 18%, sämst var 132%
Jämfört med alla testade enheter
» 18% av alla testade enheter var bättre, 4% liknande, 78% sämre
» Den bästa hade ett delta på 4%, genomsnittet var 24%, sämst var 134%
| Av/Standby | |
| Låg belastning | |
| Hög belastning |
|
Förklaring:
min: | |
| Asus ROG Zephyrus Duo 15 GX550LXS i9-10980HK, GeForce RTX 2080 Super Max-Q | Acer Predator Triton 500 PT515-52-70N3 i7-10750H, GeForce RTX 2080 Super Max-Q | MSI GS66 Stealth 10SFS i9-10980HK, GeForce RTX 2070 Super Max-Q | Gigabyte Aero 15 OLED XB-8DE51B0SP i7-10875H, GeForce RTX 2070 Super Max-Q | Genomsnitt NVIDIA GeForce RTX 2080 Super Max-Q | Genomsnitt av klass Gaming | |
|---|---|---|---|---|---|---|
| Power Consumption | 31% | 23% | 10% | 28% | 25% | |
| Idle Minimum * (Watt) | 23 | 11 52% | 13 43% | 18 22% | 12.9 ? 44% | 13.2 ? 43% |
| Idle Average * (Watt) | 30 | 15 50% | 16 47% | 21 30% | 17.3 ? 42% | 18.9 ? 37% |
| Idle Maximum * (Watt) | 39 | 25 36% | 27 31% | 38 3% | 26.9 ? 31% | 24.3 ? 38% |
| Load Average * (Watt) | 156 | 95 39% | 109 30% | 113 28% | 123.9 ? 21% | 108.3 ? 31% |
| Witcher 3 ultra * (Watt) | 152 | 140 8% | 155 -2% | 149 2% | ||
| Load Maximum * (Watt) | 208 | 211 -1% | 236 -13% | 256 -23% | 205 ? 1% | 254 ? -22% |
* ... mindre är bättre
| Asus ROG Zephyrus Duo 15 GX550LXS i9-10980HK, GeForce RTX 2080 Super Max-Q, 90 Wh | Acer Predator Triton 500 PT515-52-70N3 i7-10750H, GeForce RTX 2080 Super Max-Q, 84 Wh | MSI GS66 Stealth 10SFS i9-10980HK, GeForce RTX 2070 Super Max-Q, 99.99 Wh | Gigabyte Aero 15 OLED XB-8DE51B0SP i7-10875H, GeForce RTX 2070 Super Max-Q, 94.2 Wh | Genomsnitt av klass Gaming | |
|---|---|---|---|---|---|
| Batteridrifttid | 38% | 48% | 79% | 53% | |
| Reader / Idle (h) | 8 | 8.3 4% | 8.4 5% | 8.6 8% | 8.71 ? 9% |
| H.264 (h) | 5.4 | 8.26 ? 53% | |||
| WiFi v1.3 (h) | 3.1 | 6.3 103% | 6.1 97% | 6.1 97% | 7.04 ? 127% |
| Load (h) | 1.2 | 1.3 8% | 1.7 42% | 2.8 133% | 1.47 ? 23% |
För
Emot
Läs den fullständiga versionen av den här recensionen på engelska här.
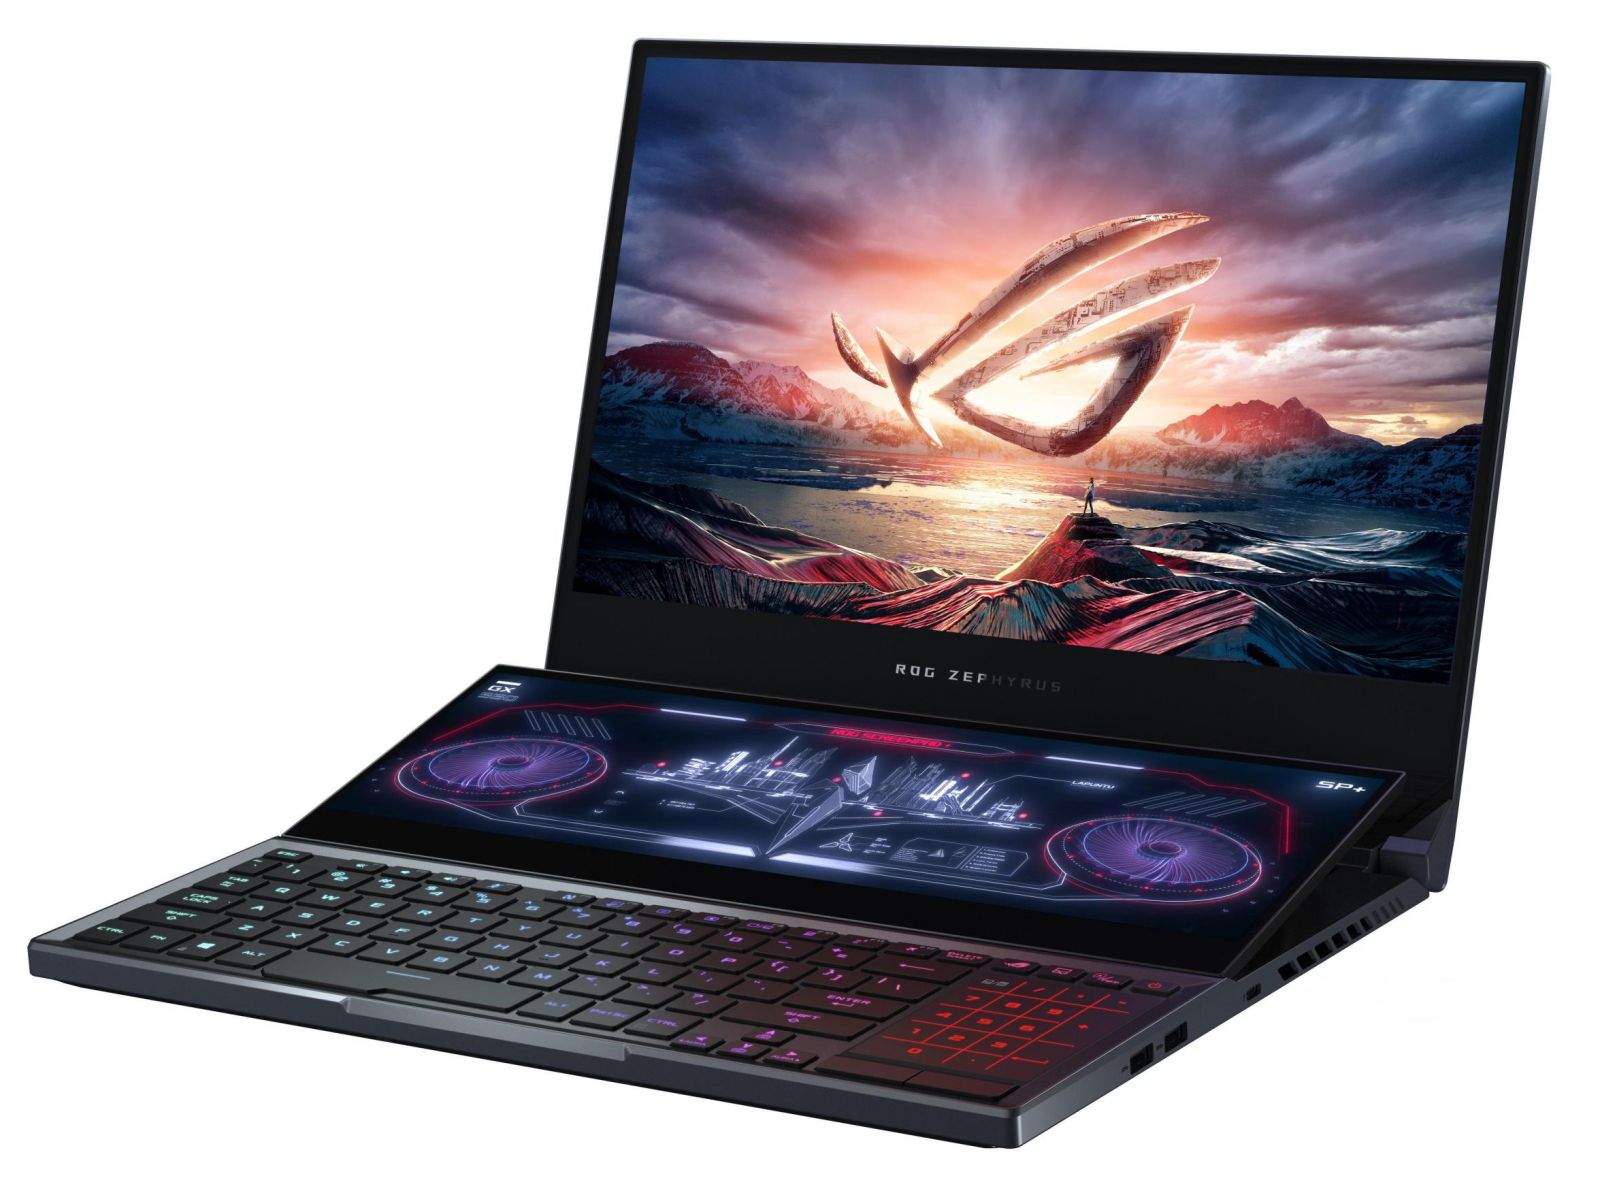
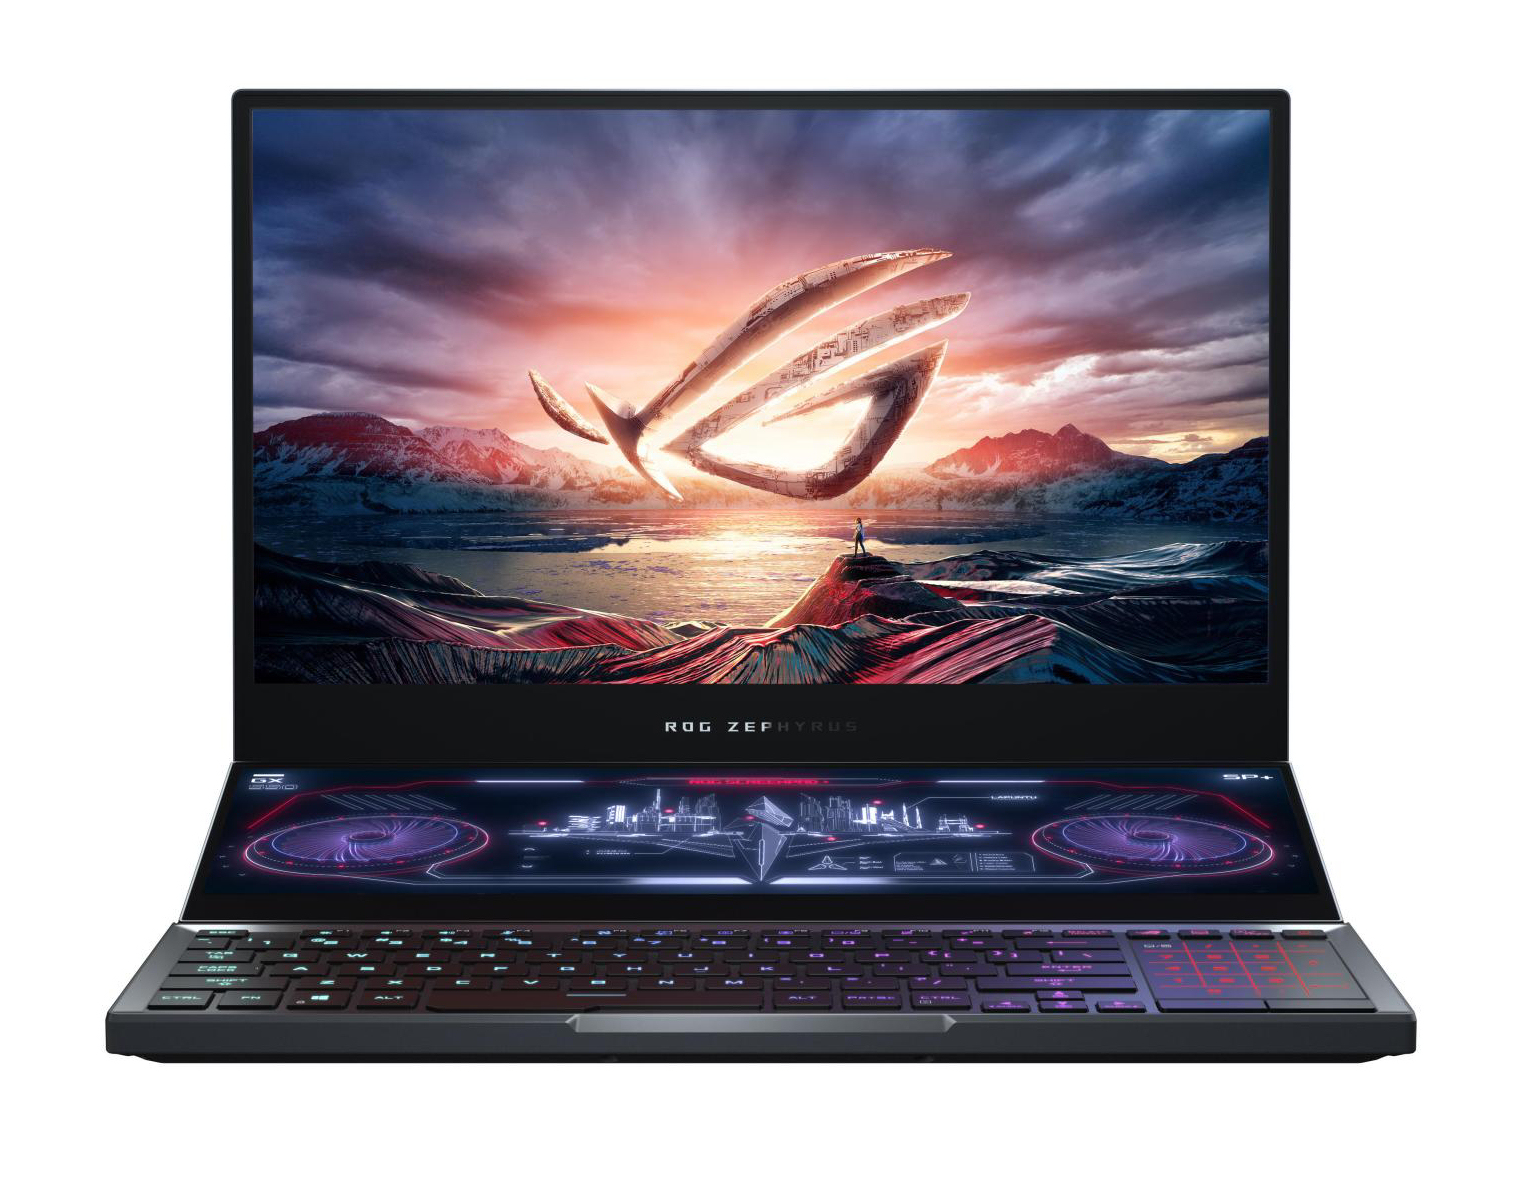
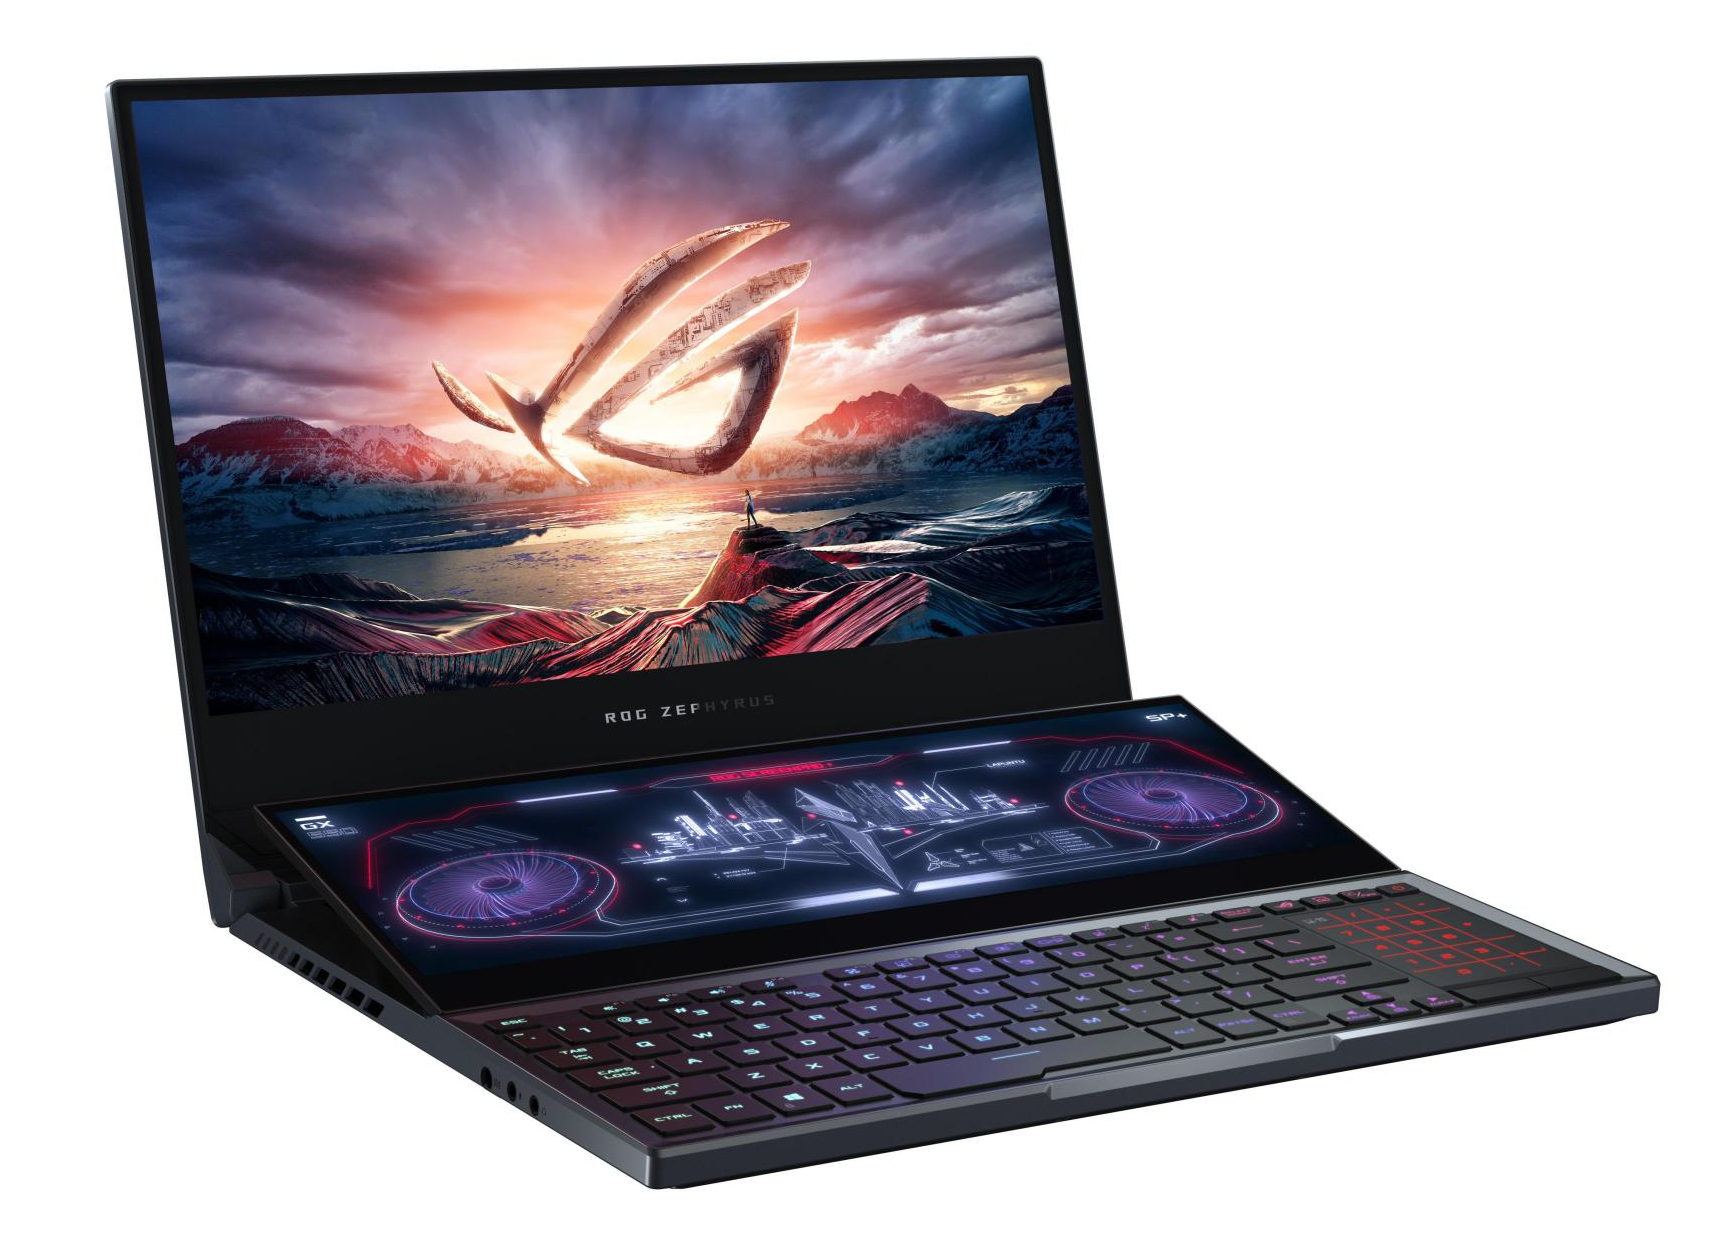
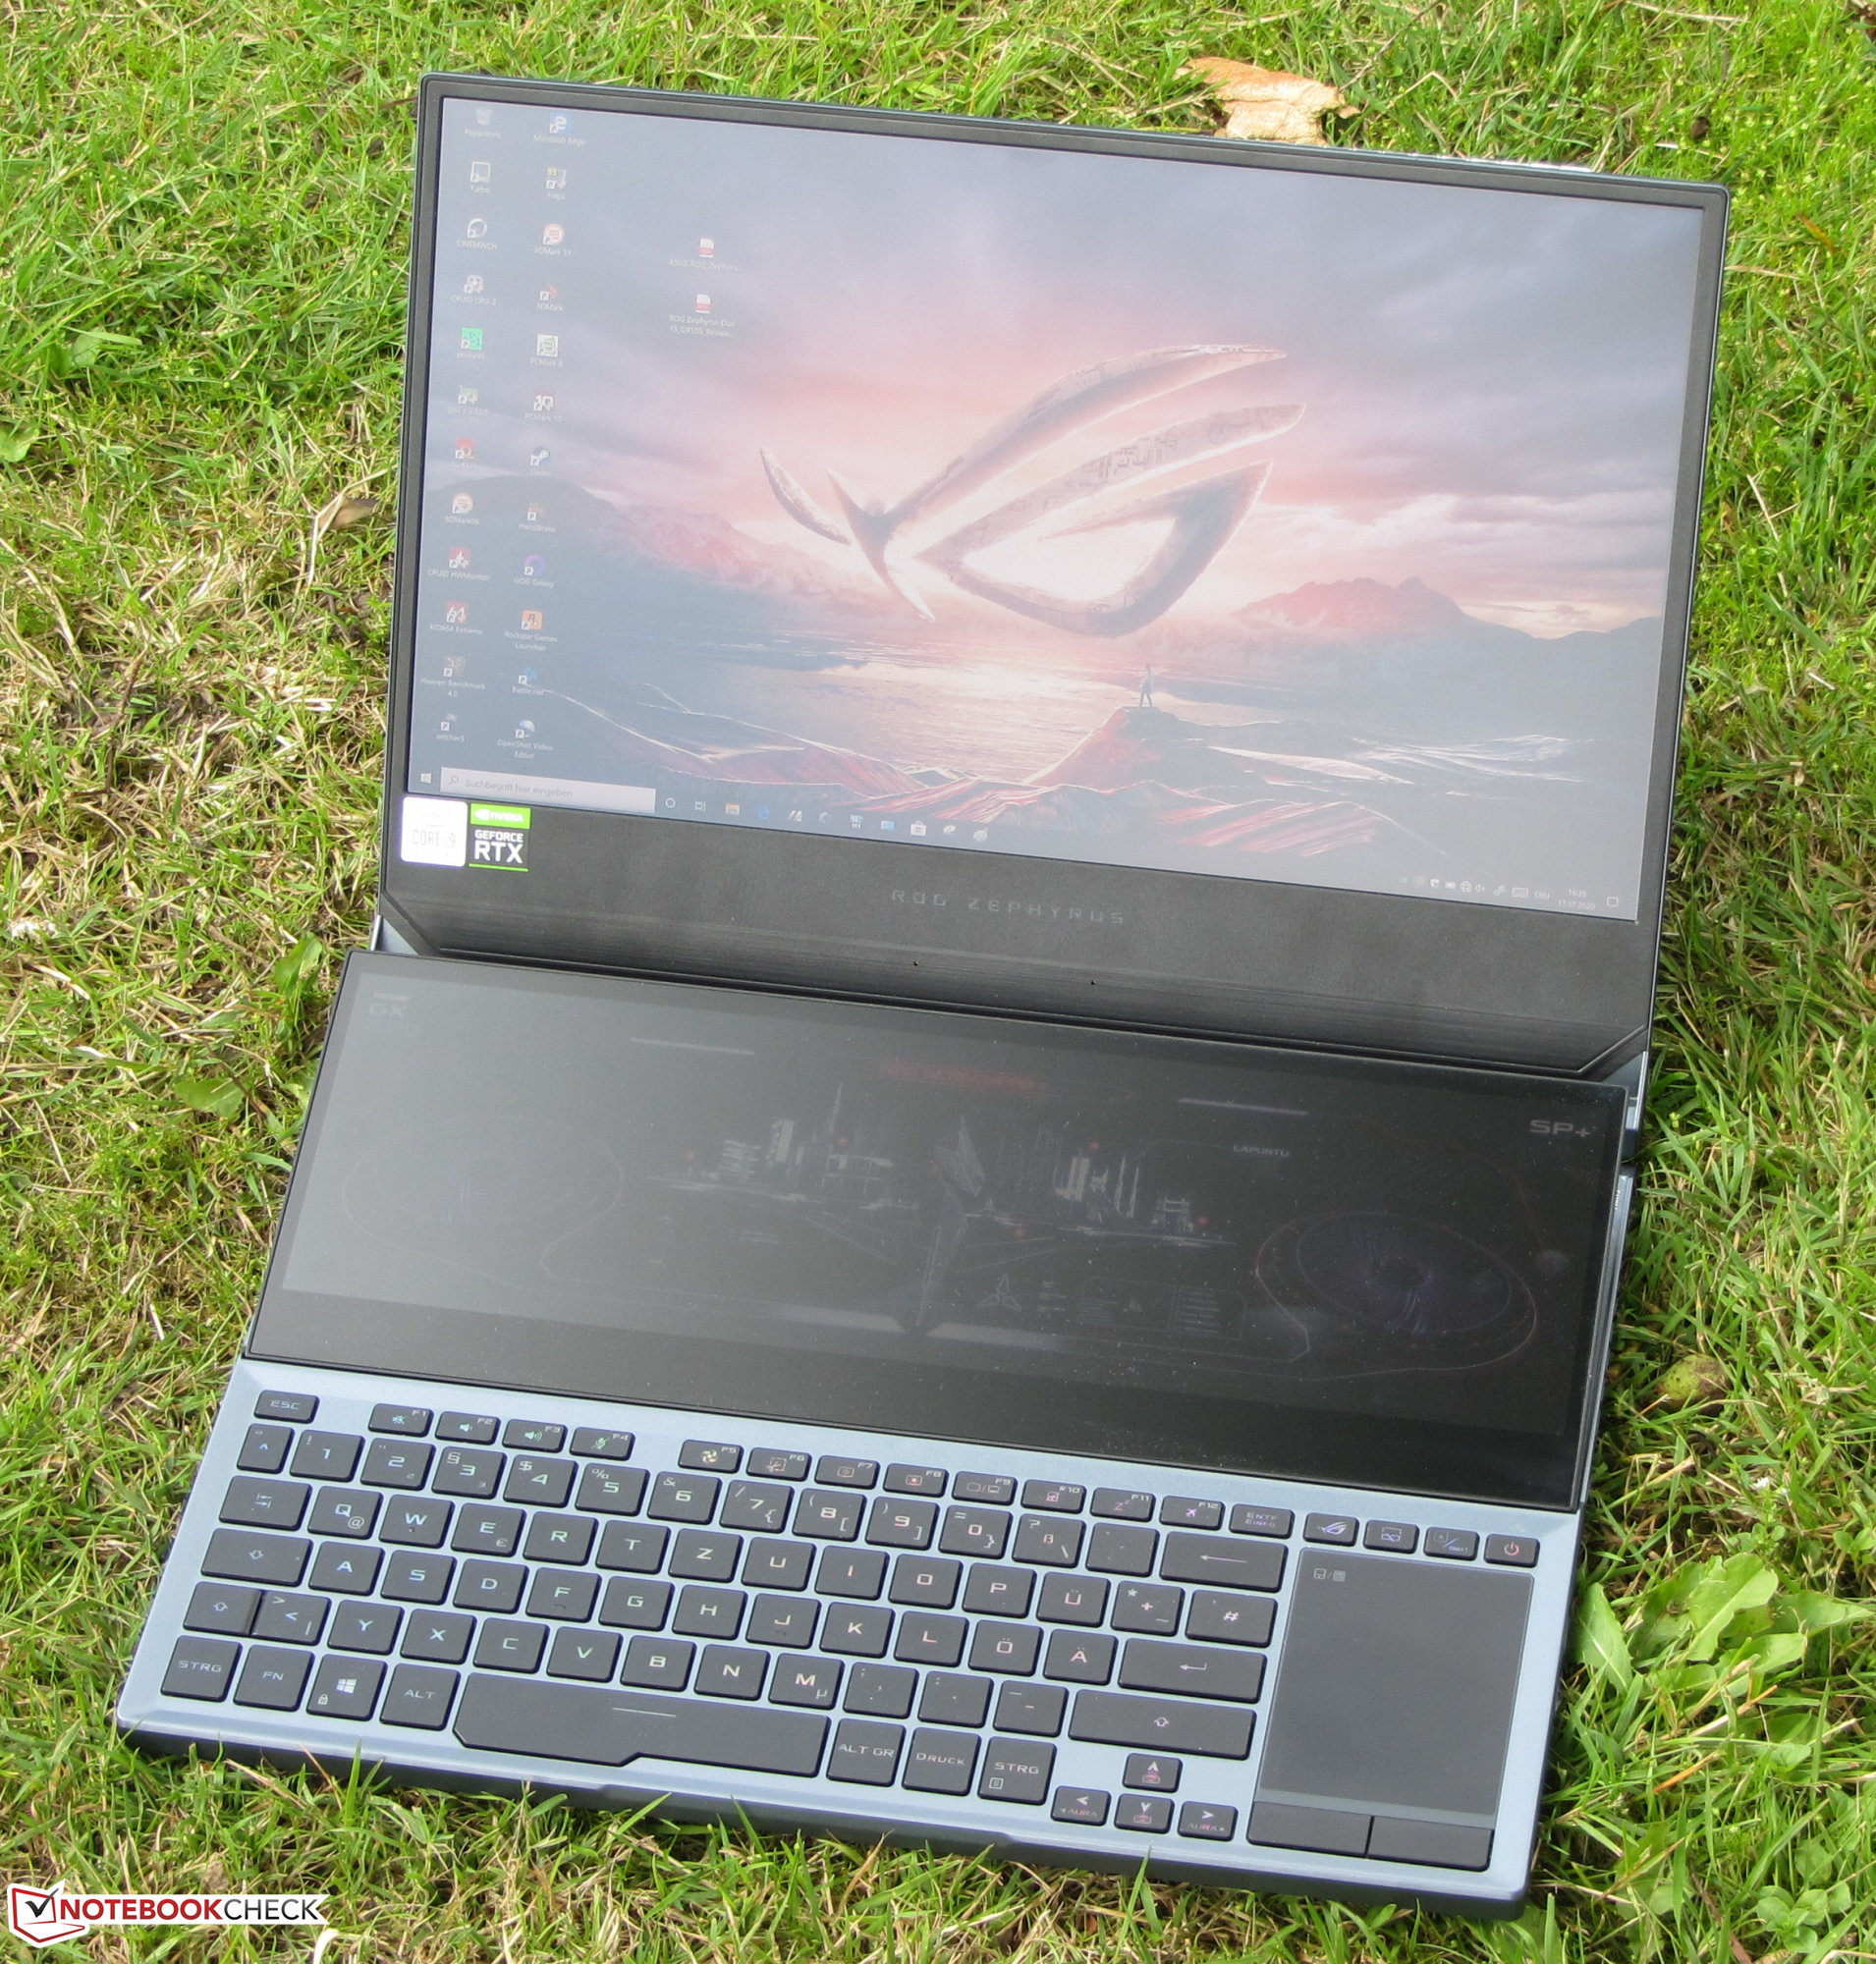
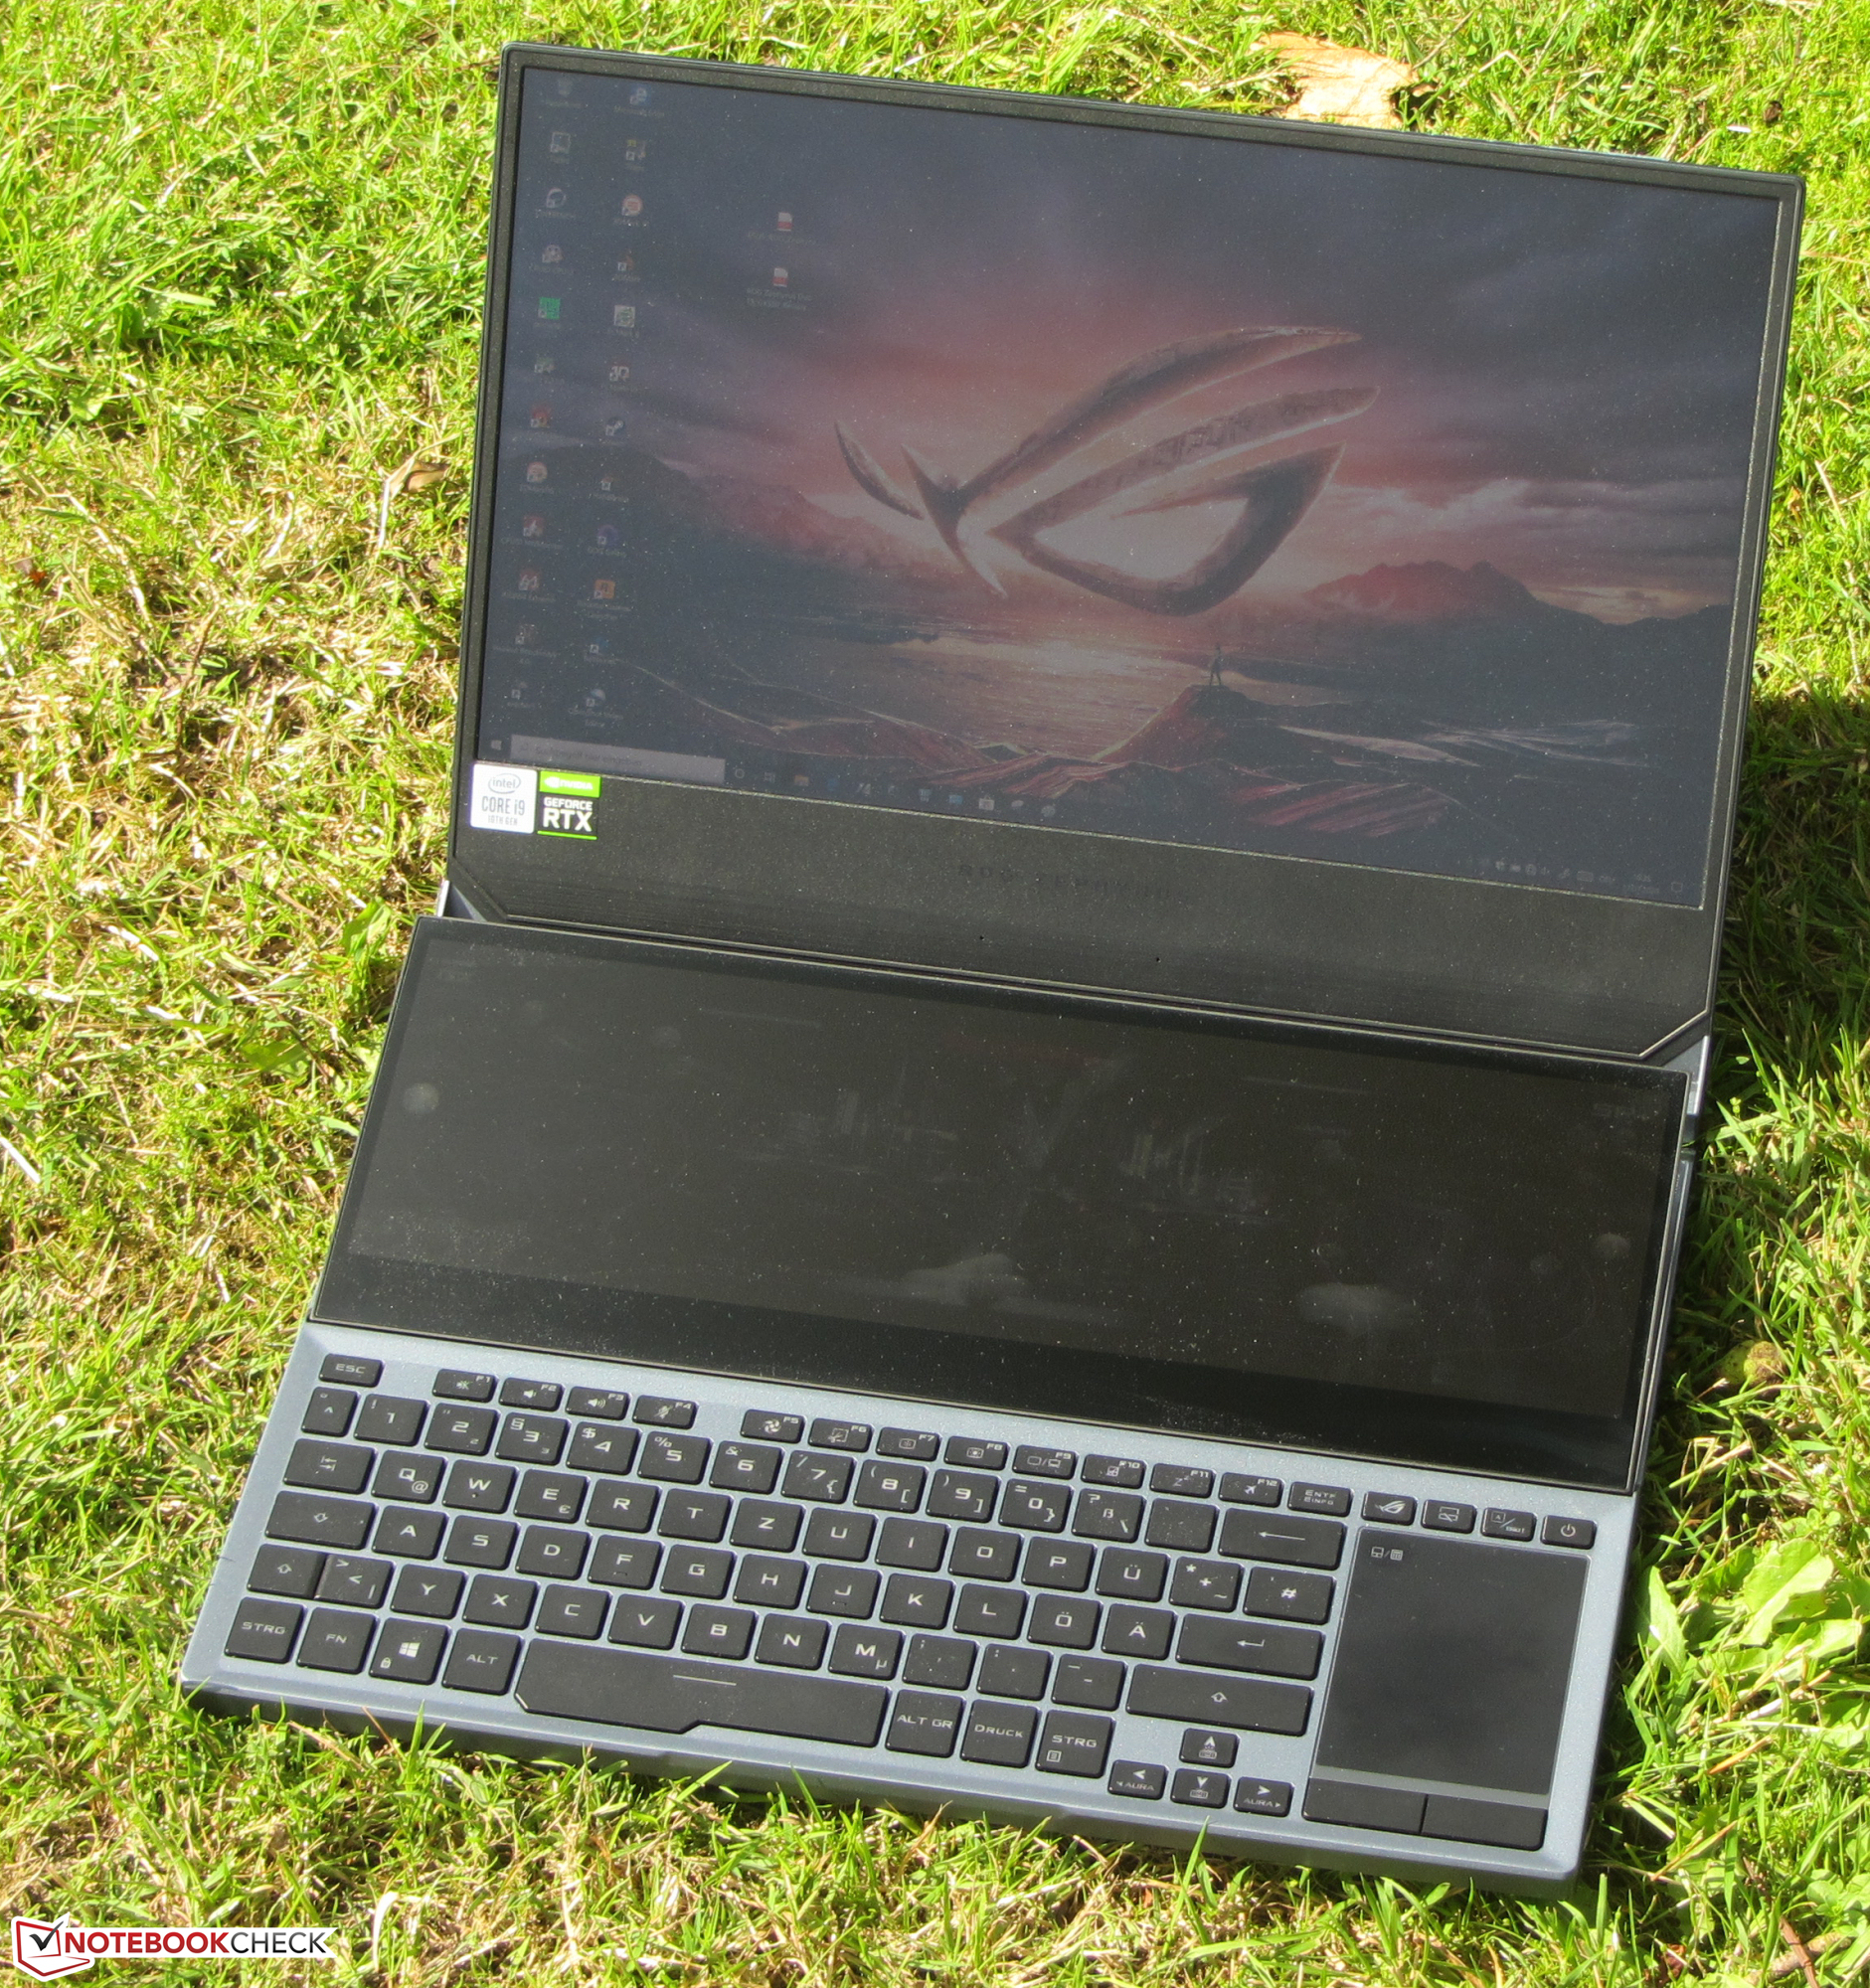
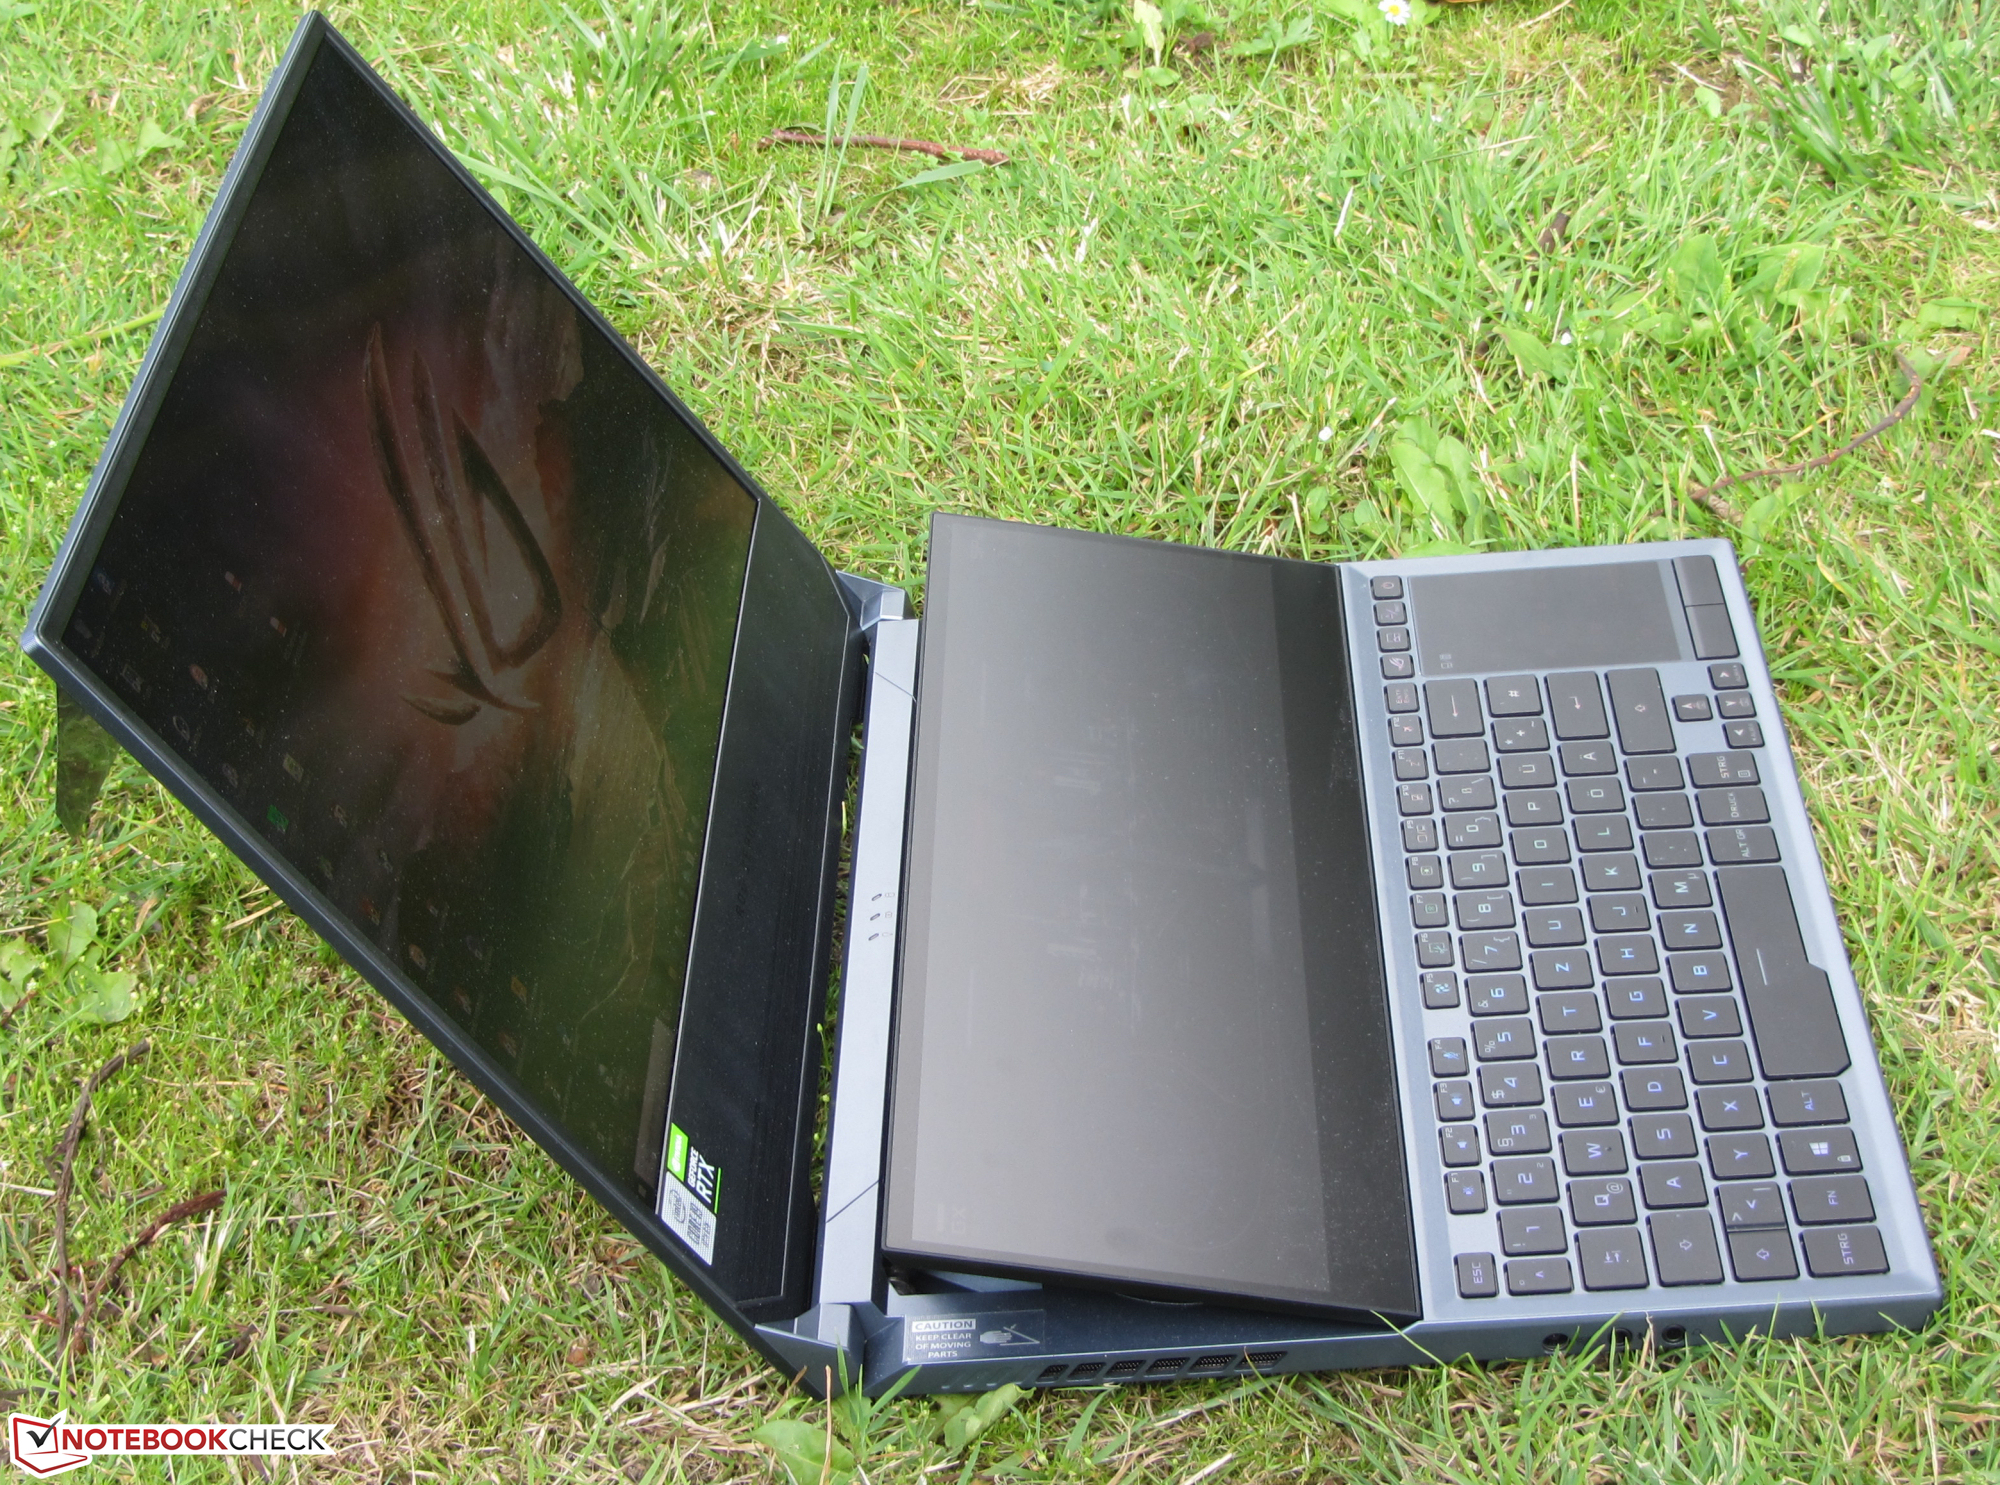
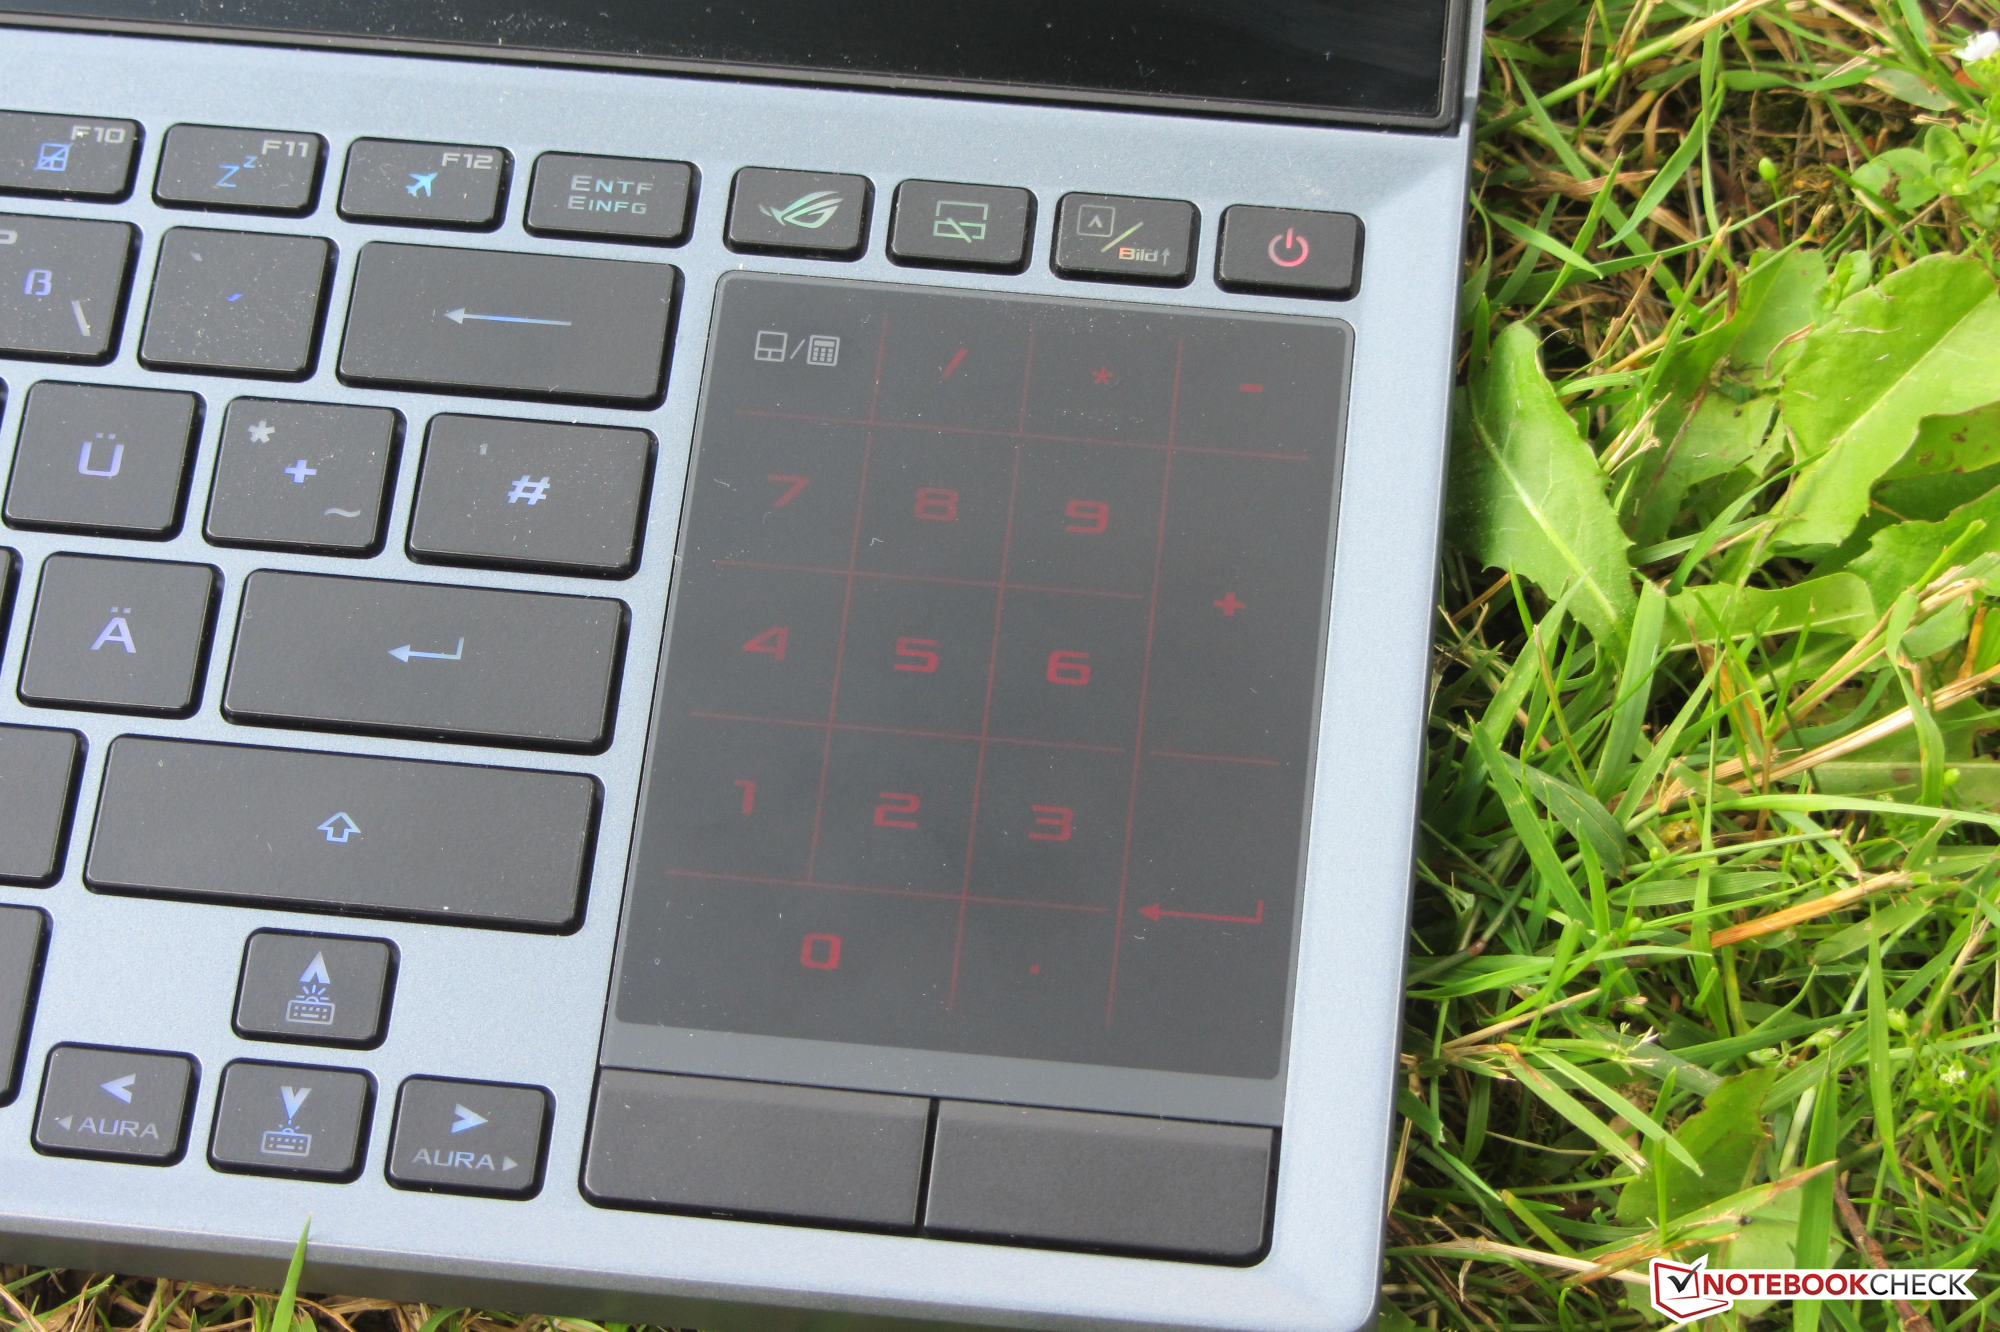
Genom att utrusta den här Zephyrus-enheten med Screenpad Plus försöker Asus tillföra extra värde åt sin målgrupp bestående av gamers, streamers och kreatörer. För det mesta brukar Screenpad vara användbar på ett eller annat sätt. Men den kommer med ett pris: Zephyrus är både större och väger mer än andra bärbara speldatorer som inte har någon extra skärm.
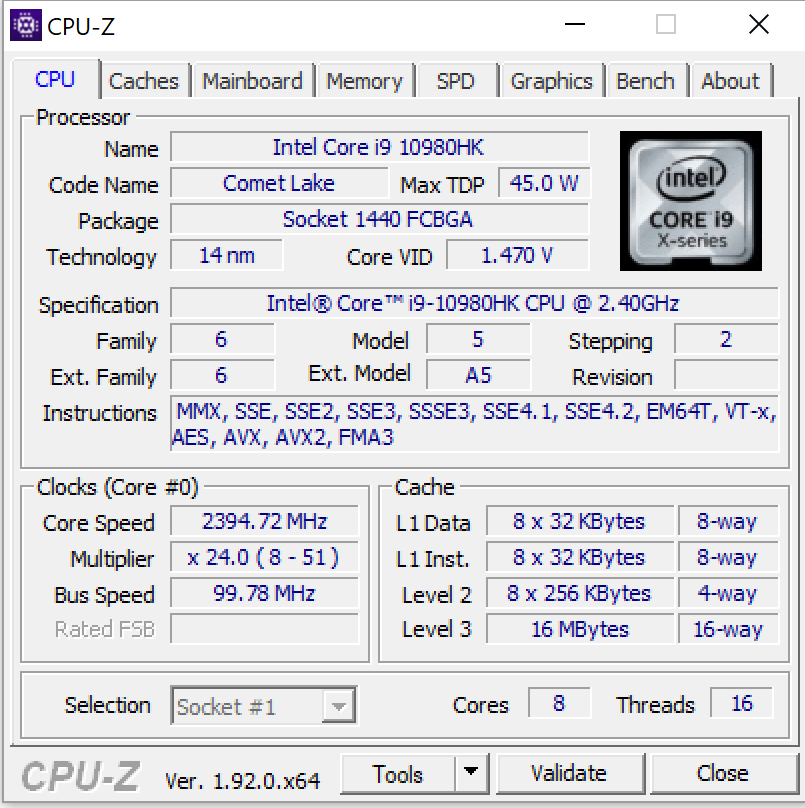
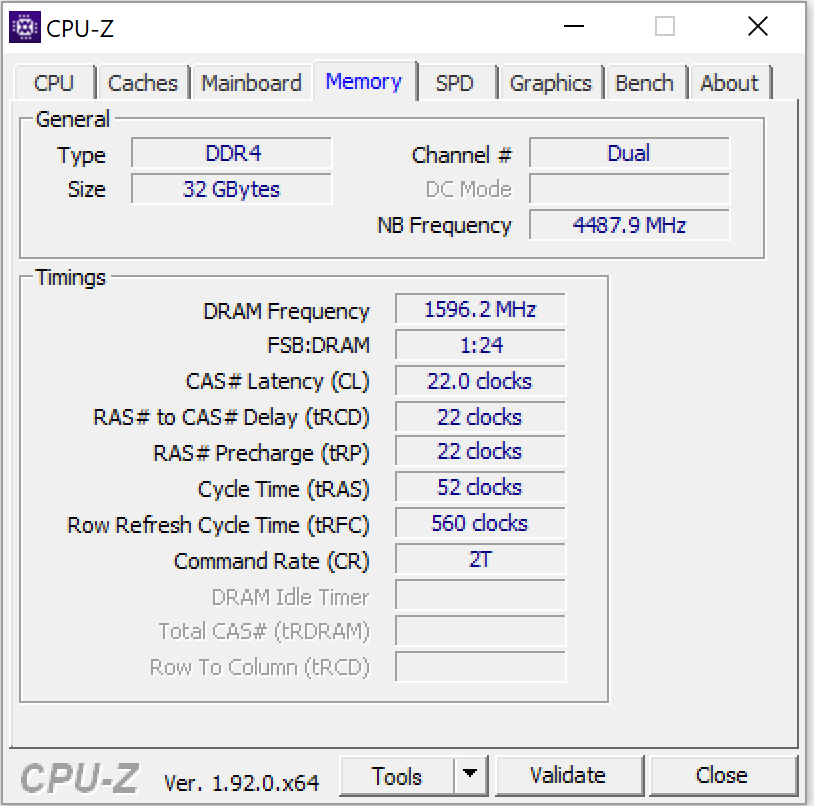
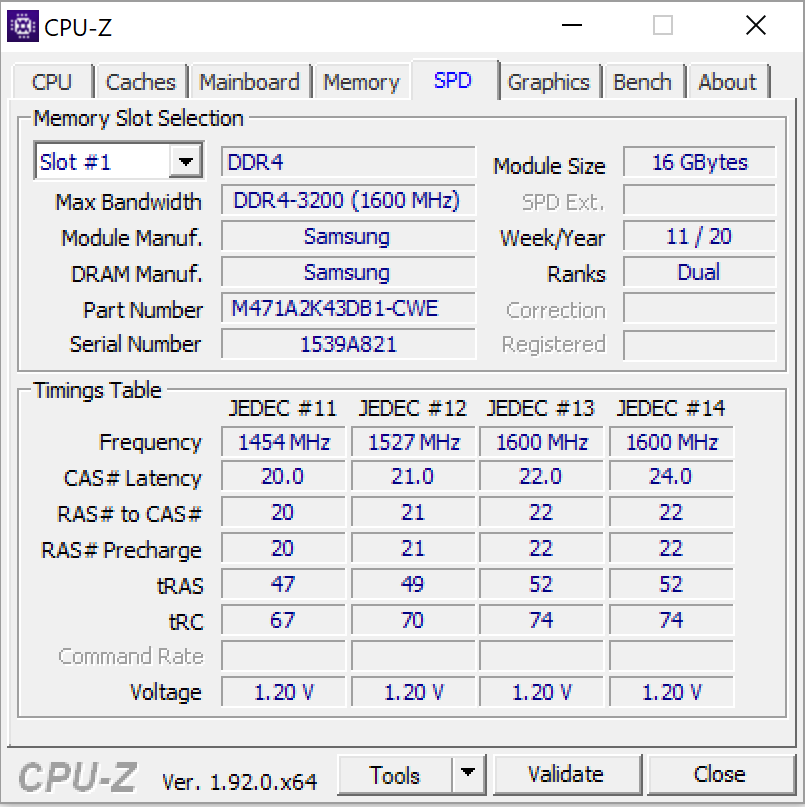
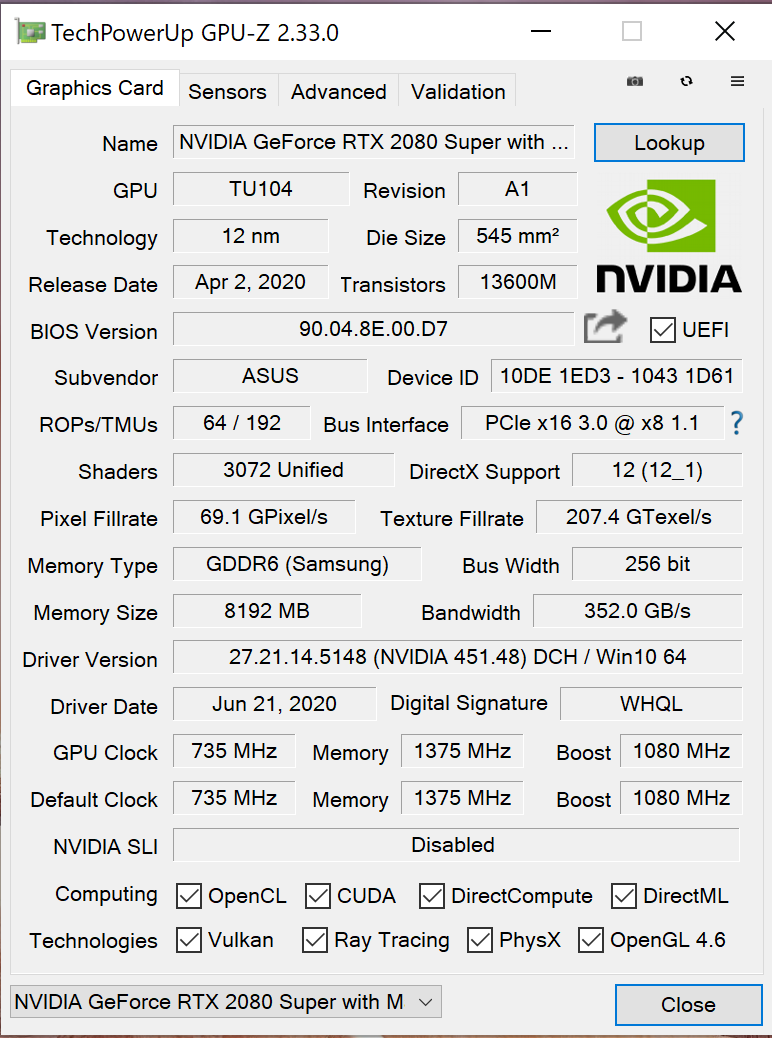
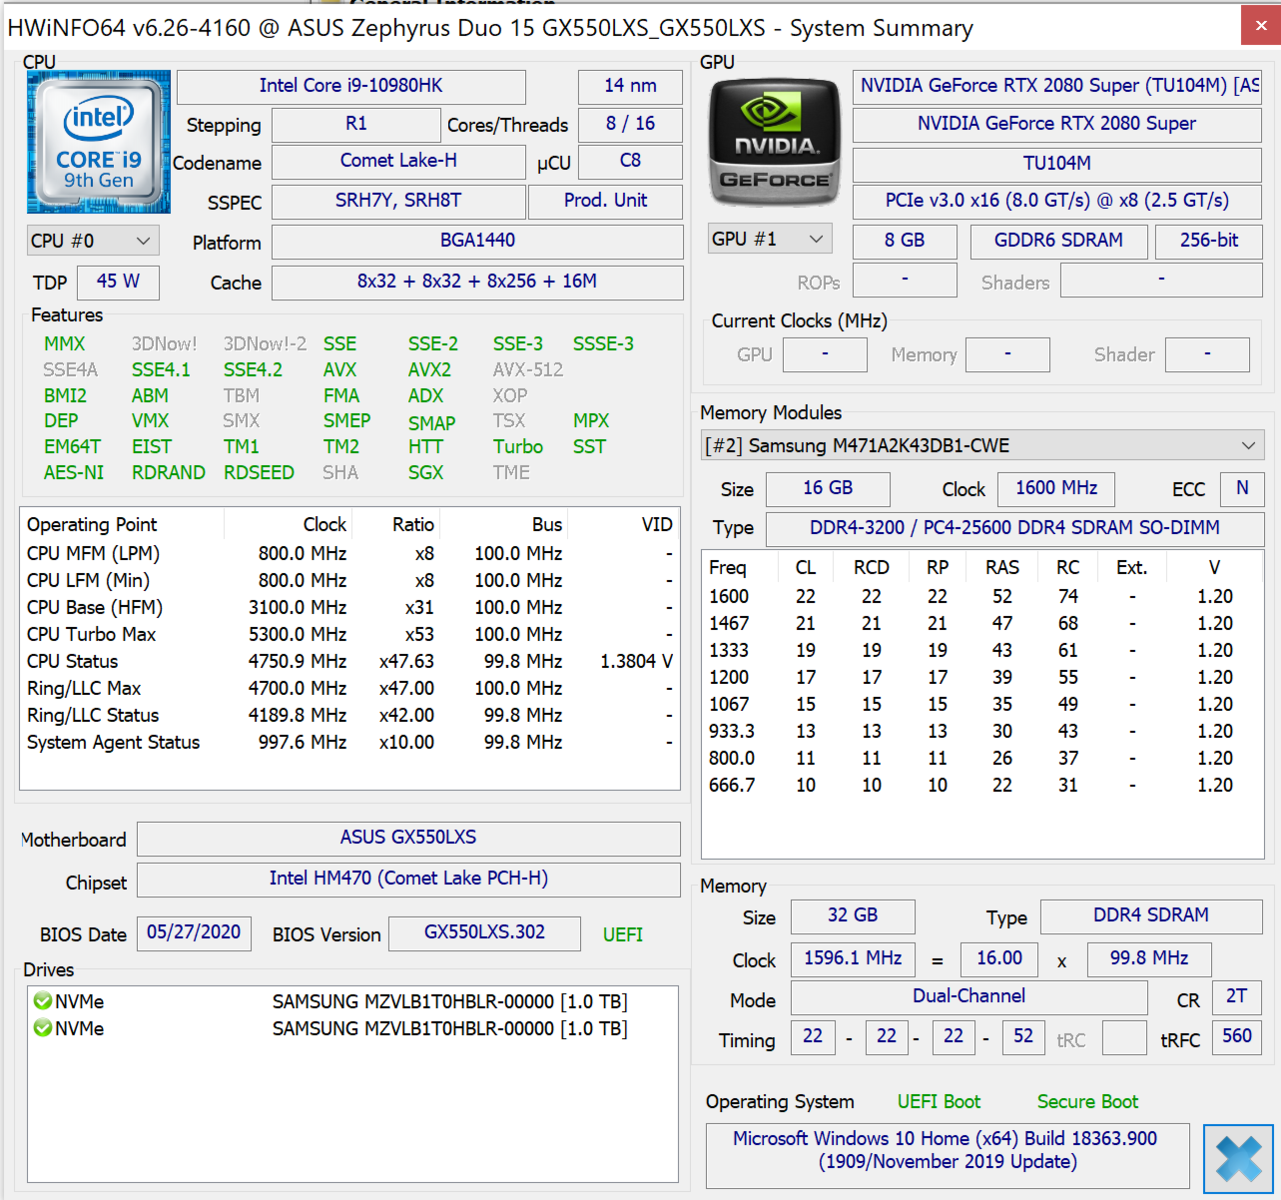
Tack vare en åttakärnig Core i9-10980HK CPU och en GeForce RTX 2080 Super Max-Q GPU saknar den inte prestanda. Processorerna har stöd av 32 GB RAM (med dubbla kanaler) bestående av en 16 GB-modul och 16 GB fastlött minne. Det är möjligt att uppgradera minnet till 48 GB. Två NVMe SSD-enheter i RAID 0 resulterar i höga överföringshastigheter och massor av lagring (2 TB).
Alla de senaste spelen går att spela smidigt på Asus Zephyrus Duo 15 GX550LXS.
IPS-skärmen har 4K-upplösning, stöd för G-Sync, hög ljusstyrka, ett bra kontrastförhållande, bra betraktningsvinklar samt - tack vare att den är Pantone-godkänd - utmärkta färger. Dessutom täcker den hela AdobeRGB-färgrymden. Responstiderna är däremot mediokra. Vill du ha bättre responstider finns en alternativ Full HD-skärm med 300 Hz bilduppdatering som också går att välja.
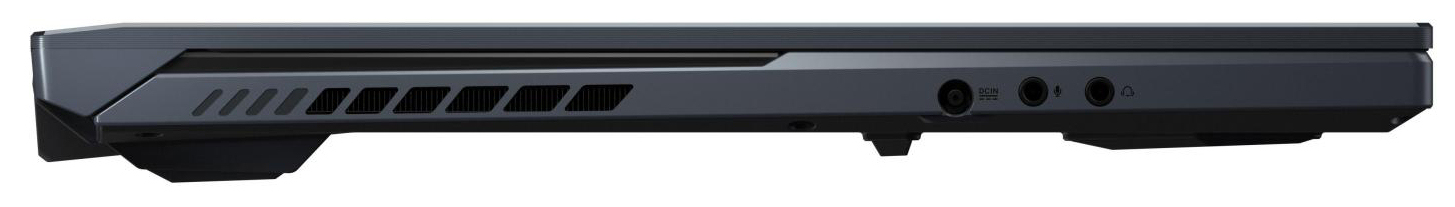
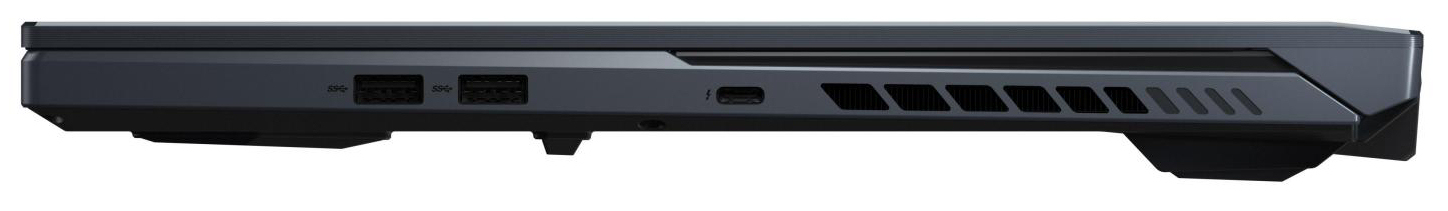
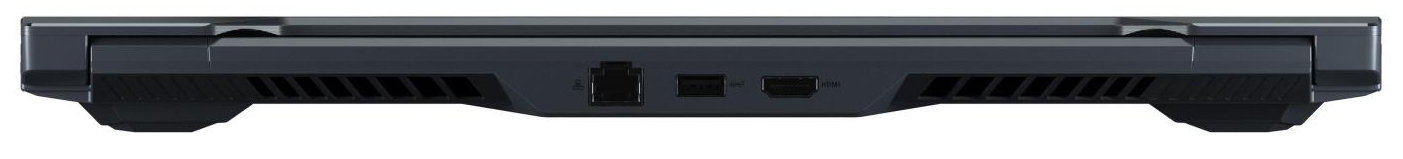
Det generösa portutbudet innehåller först och främst en Thunderbolt 3-port. Den kan användas för att ansluta funktionsrika dockningsstationer eller externa grafikkort. Dessutom kan porten användas för att ladda enheten med den extra inkluderade AC-adaptern (65 watt) när man är ute och reser, men då med sänkt prestanda.
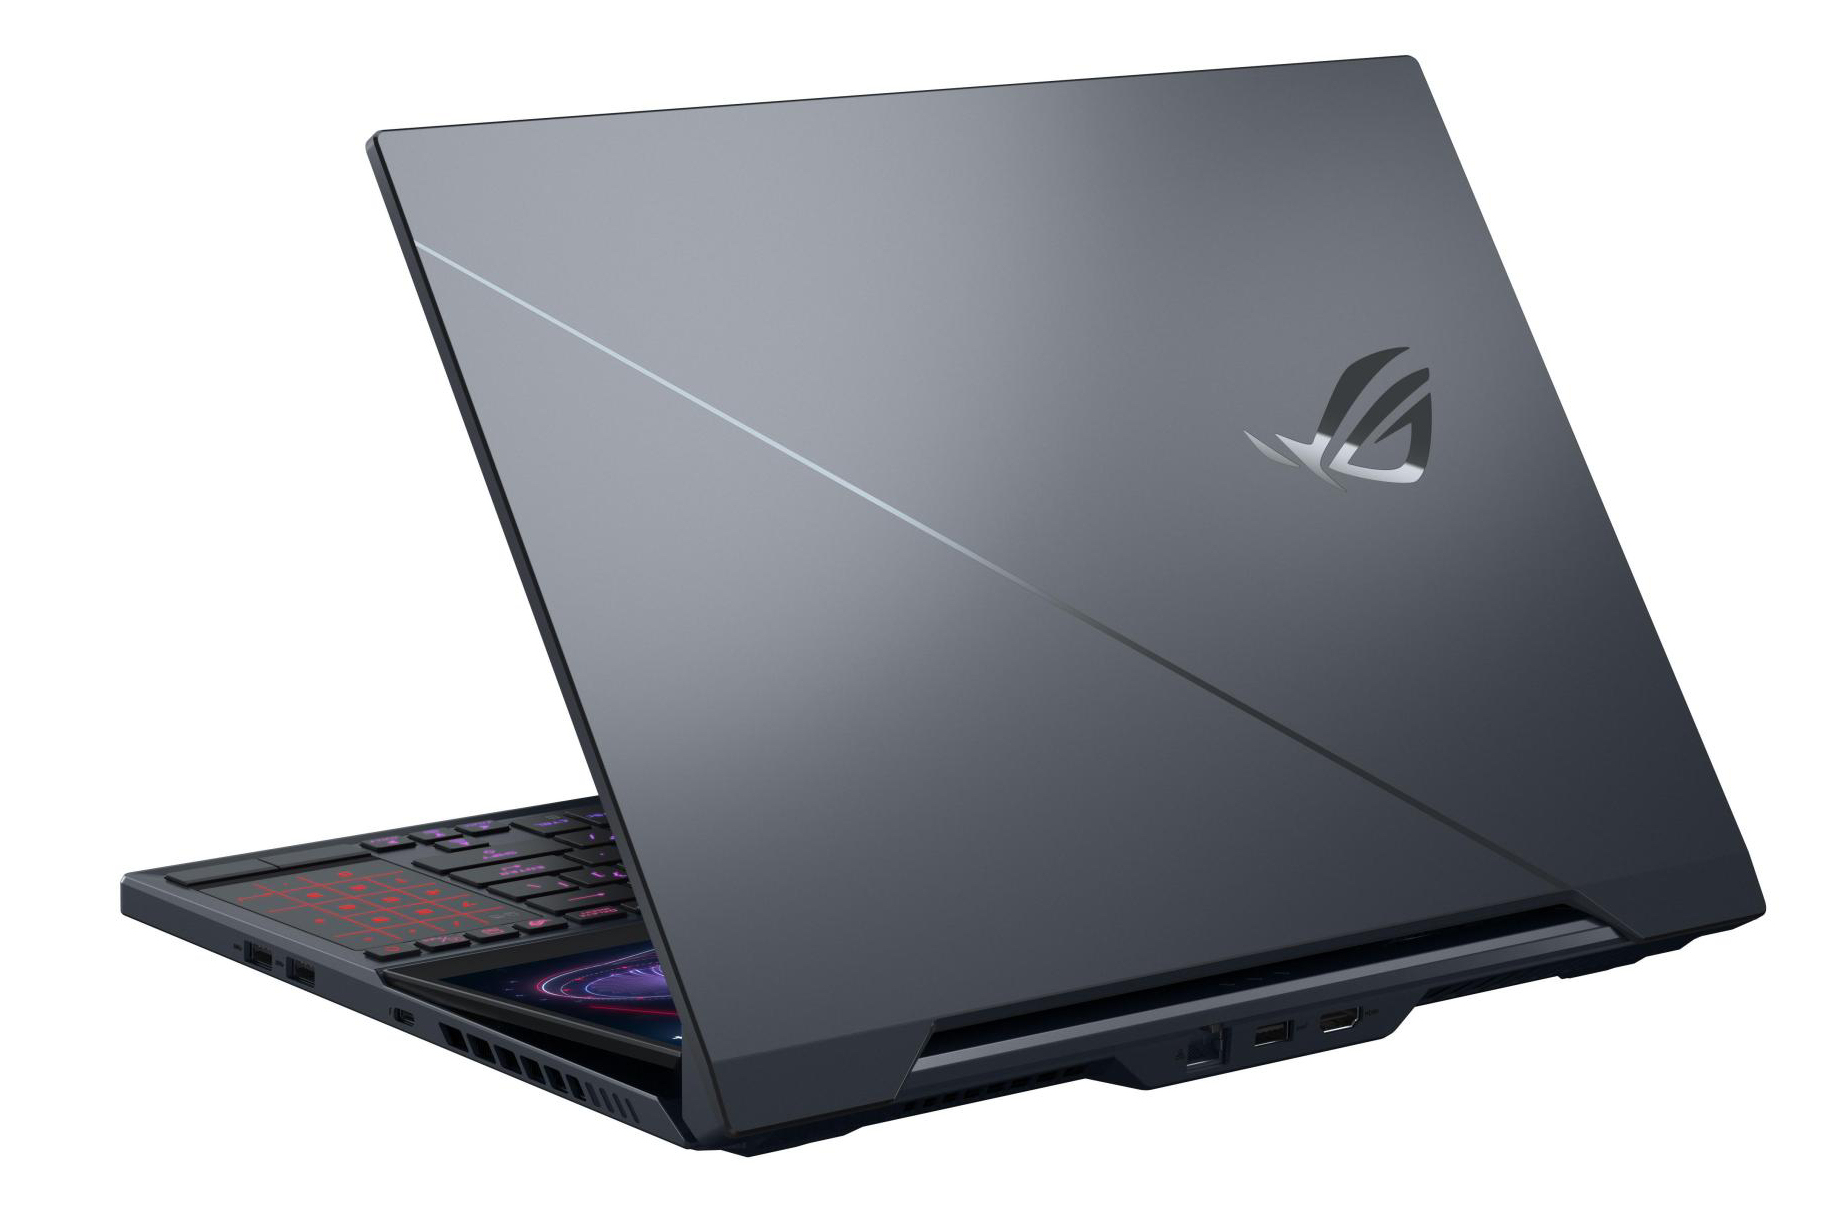
Asus ROG Zephyrus Duo 15 GX550LXS
- 07/22/2020 v7 (old)
Sascha Mölck
Price comparison
