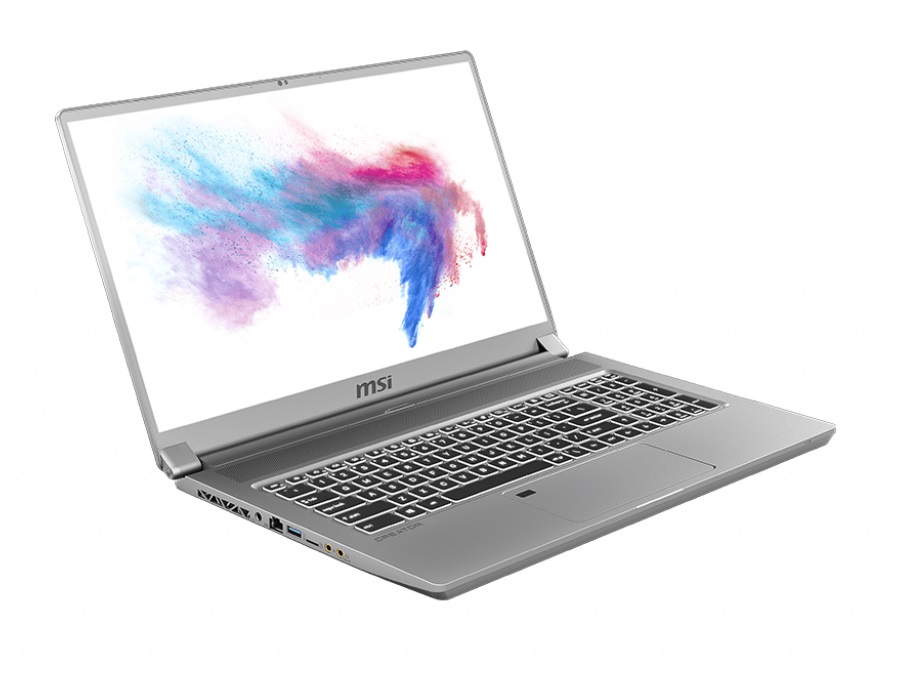
Test: MSI Creator 17 A10SGS - Vinner med en Mini LED-skärm (Sammanfattning)
Gradering | Datum | Modell | Vikt | Höjd | Storlek | Upplösning | Pris |
|---|---|---|---|---|---|---|---|
| 82.5 % v7 (old) | 07/2020 | MSI Creator 17 A10SGS i7-10875H, GeForce RTX 2080 Super Max-Q | 2.4 kg | 20 mm | 17.30" | 3840x2160 | |
| 82.9 % v7 (old) | 07/2019 | MSI GS75 Stealth 9SG i7-9750H, GeForce RTX 2080 Max-Q | 2.3 kg | 18.9 mm | 17.30" | 1920x1080 | |
| 87.7 % v7 (old) | 06/2019 | Razer Blade Pro 17 RTX 2080 Max-Q i7-9750H, GeForce RTX 2080 Max-Q | 2.8 kg | 19.9 mm | 17.30" | 1920x1080 | |
| 81.2 % v7 (old) | 12/2019 | Asus ROG Zephyrus S GX701GXR i7-9750H, GeForce RTX 2080 Max-Q | 2.7 kg | 18.7 mm | 17.30" | 1920x1080 | |
| 84.2 % v7 (old) | 03/2020 | Alienware m17 R2 P41E i9-9980HK, GeForce RTX 2080 Max-Q | 2.6 kg | 20.5 mm | 17.30" | 1920x1080 |


| |||||||||||||||||||||||||
Distribution av ljusstyrkan: 93 %
Mitt på batteriet: 996 cd/m²
Kontrast: 1465:1 (Svärta: 0.68 cd/m²)
ΔE ColorChecker Calman: 4.21 | ∀{0.5-29.43 Ø4.72}
calibrated: 2.03
ΔE Greyscale Calman: 4.1 | ∀{0.09-98 Ø4.97}
97% sRGB (Argyll 1.6.3 3D)
84% AdobeRGB 1998 (Argyll 1.6.3 3D)
84% AdobeRGB 1998 (Argyll 3D)
97.5% sRGB (Argyll 3D)
82% Display P3 (Argyll 3D)
Gamma: 2.207
CCT: 7491 K
| MSI Creator 17 A10SGS B173ZAN05.0 (AUO278E), Mini-LED IPS-Level, 3840x2160 | MSI Creator 17 A10SGS HDR 3840x2160 | MSI GS75 Stealth 9SG Chi Mei N173HCE-G33 (CMN175C), IPS, 1920x1080 | Razer Blade Pro 17 RTX 2080 Max-Q AU Optronics B173HAN04.0, IPS, 1920x1080 | Asus ROG Zephyrus S GX701GXR AU Optronics B173HAN05.1, IPS, 1920x1080 | Alienware m17 R2 P41E Chi Mei 173HCE, CMN175F, IPS, 1920x1080 | |
|---|---|---|---|---|---|---|
| Display | -17% | -20% | -10% | -9% | ||
| Display P3 Coverage (%) | 82 | 62.6 -24% | 60.6 -26% | 70 -15% | 70.8 -14% | |
| sRGB Coverage (%) | 97.5 | 93.5 -4% | 89 -9% | 96.6 -1% | 98.5 1% | |
| AdobeRGB 1998 Coverage (%) | 84 | 64.7 -23% | 62.1 -26% | 72.3 -14% | 72.2 -14% | |
| Response Times | 0% | -14% | -9% | 14% | -23% | |
| Response Time Grey 50% / Grey 80% * (ms) | 7.2 ? | 6.8 ? | 5.6 ? | 17.2 ? | ||
| Response Time Black / White * (ms) | 8.8 ? | 8.8 ? -0% | 10 ? -14% | 9.6 ? -9% | 7.6 ? 14% | 10.8 ? -23% |
| PWM Frequency (Hz) | 26600 ? | 26600 ? | 25510 ? | 26320 ? | ||
| Screen | 102% | 11% | -10% | 3% | 11% | |
| Brightness middle (cd/m²) | 996 | 770 -23% | 366 -63% | 299.3 -70% | 288 -71% | 384.2 -61% |
| Brightness (cd/m²) | 952 | 759 -20% | 343 -64% | 294 -69% | 276 -71% | 357 -62% |
| Brightness Distribution (%) | 93 | 94 1% | 91 -2% | 94 1% | 93 0% | 90 -3% |
| Black Level * (cd/m²) | 0.68 | 0.07 90% | 0.29 57% | 0.29 57% | 0.24 65% | 0.29 57% |
| Contrast (:1) | 1465 | 11000 651% | 1262 -14% | 1032 -30% | 1200 -18% | 1325 -10% |
| Colorchecker dE 2000 * | 4.21 | 1.51 64% | 2.55 39% | 1.92 54% | 1.35 68% | |
| Colorchecker dE 2000 max. * | 6.79 | 3.22 53% | 4.73 30% | 4.57 33% | 3.45 49% | |
| Colorchecker dE 2000 calibrated * | 2.03 | 0.71 65% | 2.9 -43% | 1.14 44% | 1.42 30% | |
| Greyscale dE 2000 * | 4.1 | 1.93 53% | 3.5 15% | 3.08 25% | 1.2 71% | |
| Gamma | 2.207 100% | 2.38 92% | 2.28 96% | 2.42 91% | 2.23 99% | |
| CCT | 7491 87% | 6881 94% | 7101 92% | 7055 92% | 6580 99% | |
| Color Space (Percent of AdobeRGB 1998) (%) | 84 | 94 12% | 60 -29% | 57 -32% | 65 -23% | 65.5 -22% |
| Color Space (Percent of sRGB) (%) | 97 | 99 2% | 94 -3% | 88.7 -9% | 96 -1% | 98.5 2% |
| Totalt genomsnitt (program/inställningar) | 51% /
89% | -7% /
3% | -13% /
-12% | 2% /
1% | -7% /
5% |
* ... mindre är bättre
Visa svarstider
| ↔ Svarstid svart till vitt | ||
|---|---|---|
| 8.8 ms ... stiga ↗ och falla ↘ kombinerat | ↗ 1.2 ms stiga | 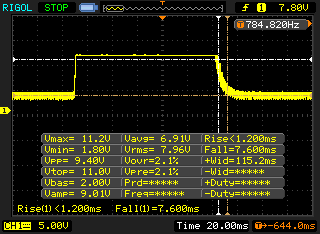 |
| ↘ 7.6 ms hösten | ||
| Skärmen visar snabba svarsfrekvenser i våra tester och bör passa för spel. I jämförelse sträcker sig alla testade enheter från 0.1 (minst) till 240 (maximalt) ms. » 24 % av alla enheter är bättre. Det betyder att den uppmätta svarstiden är bättre än genomsnittet av alla testade enheter (19.8 ms). | ||
Skärmflimmer / PWM (Puls-Width Modulation)
| Skärmflimmer / PWM upptäckt | 26600 Hz | ≤ 83 % ljusstyrka inställning | 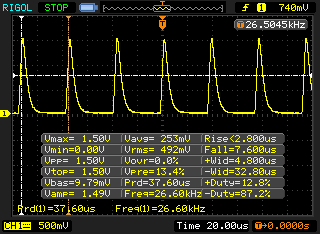 |
Displayens bakgrundsbelysning flimrar vid 26600 Hz (i värsta fall, t.ex. med PWM) Flimrande upptäckt vid en ljusstyrkeinställning på 83 % och lägre. Det ska inte finnas något flimmer eller PWM över denna ljusstyrkeinställning. Frekvensen för 26600 Hz är ganska hög, så de flesta användare som är känsliga för PWM bör inte märka något flimmer. Som jämförelse: 52 % av alla testade enheter använder inte PWM för att dämpa skärmen. Om PWM upptäcktes mättes ett medelvärde av 7769 (minst: 5 - maximum: 343500) Hz. | |||
| Blender - v2.79 BMW27 CPU | |
| MSI Creator 17 A10SGS | |
| Genomsnitt av klass Multimedia (100 - 557, n=65, senaste 2 åren) | |
| Geekbench 5.5 | |
| Single-Core | |
| Genomsnitt av klass Multimedia (805 - 2974, n=62, senaste 2 åren) | |
| MSI Creator 17 A10SGS | |
| Multi-Core | |
| Genomsnitt av klass Multimedia (4652 - 20422, n=62, senaste 2 åren) | |
| MSI Creator 17 A10SGS | |
| HWBOT x265 Benchmark v2.2 - 4k Preset | |
| Genomsnitt av klass Multimedia (5.26 - 36.1, n=63, senaste 2 åren) | |
| MSI Creator 17 A10SGS | |
| LibreOffice - 20 Documents To PDF | |
| MSI Creator 17 A10SGS | |
| Genomsnitt av klass Multimedia (23.9 - 146.7, n=64, senaste 2 åren) | |
| R Benchmark 2.5 - Overall mean | |
| MSI Creator 17 A10SGS | |
| Genomsnitt av klass Multimedia (0.3604 - 0.947, n=63, senaste 2 åren) | |
* ... mindre är bättre
| DPC Latencies / LatencyMon - interrupt to process latency (max), Web, Youtube, Prime95 | |
| MSI Creator 17 A10SGS | |
* ... mindre är bättre
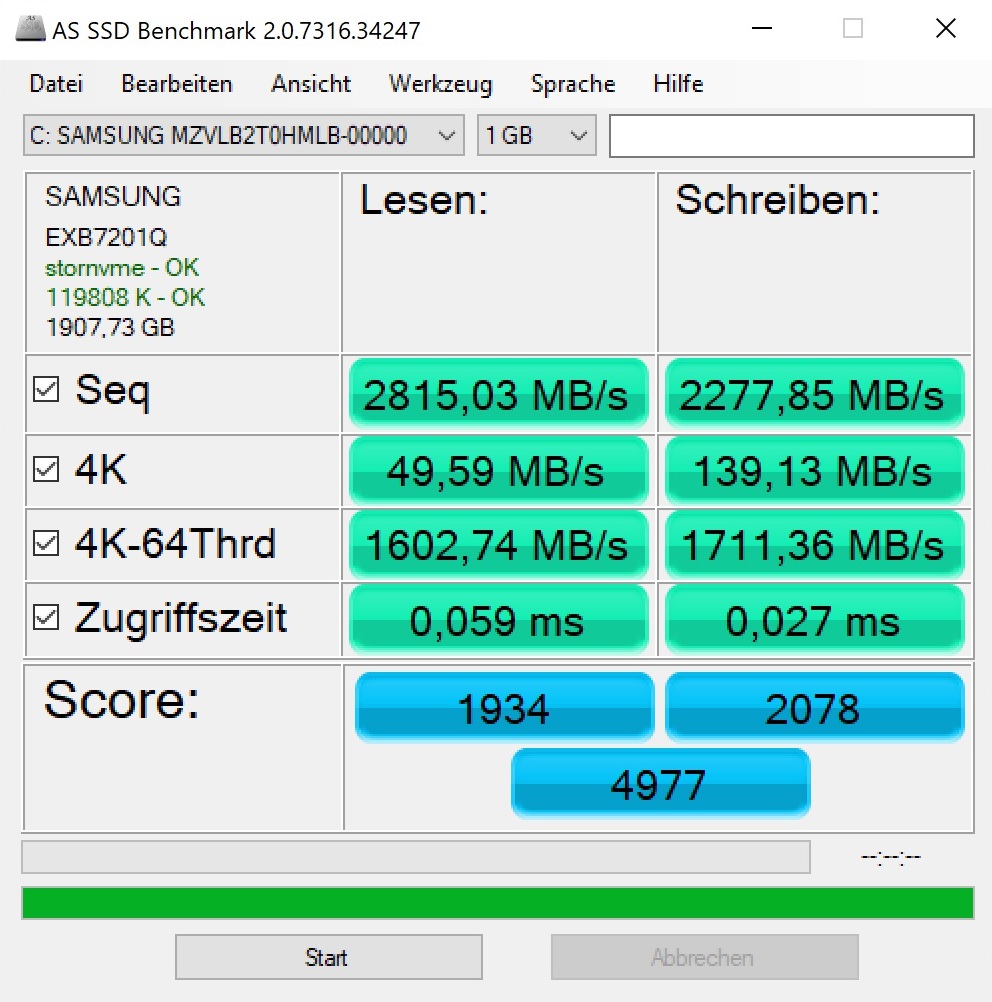
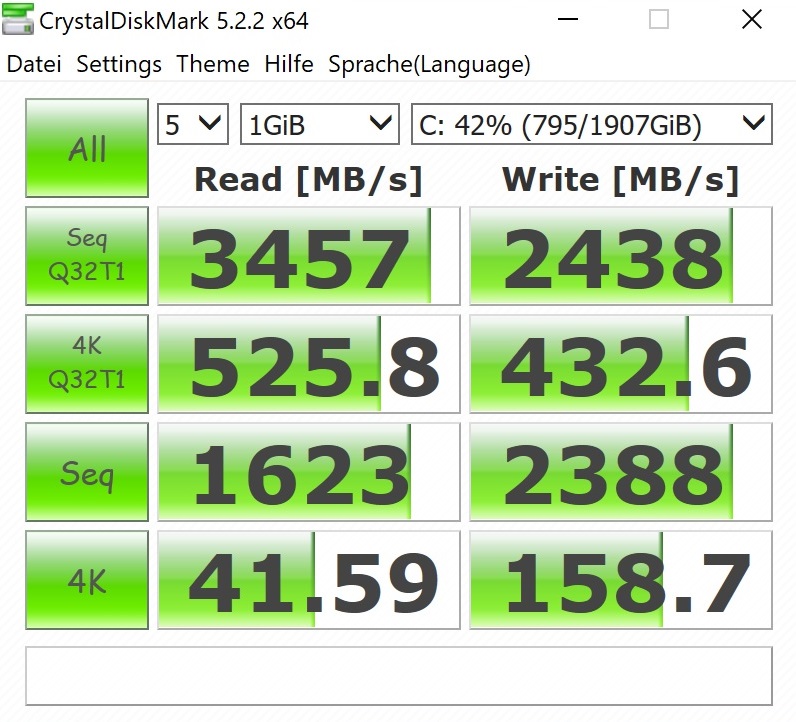
| MSI Creator 17 A10SGS Samsung SSD PM981 MZVLB2T0HMLB | MSI GS75 Stealth 9SG 2x Samsung SSD PM981 MZVLB1T0HALR (RAID 0) | Razer Blade Pro 17 RTX 2080 Max-Q Samsung SSD PM981 MZVLB512HAJQ | Asus ROG Zephyrus S GX701GXR Samsung SSD PM981 MZVLB1T0HALR | Alienware m17 R2 P41E 2x SK Hynix PC601 NVMe 512 GB (RAID 0) | |
|---|---|---|---|---|---|
| CrystalDiskMark 5.2 / 6 | 8% | -23% | -22% | 1% | |
| Write 4K (MB/s) | 158.7 | 95.5 -40% | 100.7 -37% | 96.1 -39% | 110.6 -30% |
| Read 4K (MB/s) | 41.59 | 42.59 2% | 41.03 -1% | 40.86 -2% | 41.46 0% |
| Write Seq (MB/s) | 2388 | 2851 19% | 1146 -52% | 1317 -45% | 2378 0% |
| Read Seq (MB/s) | 1623 | 2696 66% | 1115 -31% | 1030 -37% | 2114 30% |
| Write 4K Q32T1 (MB/s) | 432.6 | 402.6 -7% | 384.6 -11% | 350.4 -19% | 445.4 3% |
| Read 4K Q32T1 (MB/s) | 526 | 443.9 -16% | 429.5 -18% | 404.1 -23% | 509 -3% |
| Write Seq Q32T1 (MB/s) | 2438 | 3420 40% | 1859 -24% | 2396 -2% | 2735 12% |
| Read Seq Q32T1 (MB/s) | 3457 | 3514 2% | 3179 -8% | 3194 -8% | 3206 -7% |

Kontinuerlig inläsning: DiskSpd Read Loop, Queue Depth 8
| SPECviewperf 13 | |
| 3ds Max (3dsmax-06) | |
| Genomsnitt av klass Multimedia (n=1senaste 2 åren) | |
| MSI Creator 17 A10SGS | |
| Catia (catia-05) | |
| Genomsnitt av klass Multimedia (n=1senaste 2 åren) | |
| MSI Creator 17 A10SGS | |
| Creo (creo-02) | |
| Genomsnitt av klass Multimedia (n=1senaste 2 åren) | |
| MSI Creator 17 A10SGS | |
| Energy (energy-02) | |
| Genomsnitt av klass Multimedia (n=1senaste 2 åren) | |
| MSI Creator 17 A10SGS | |
| Maya (maya-05) | |
| Genomsnitt av klass Multimedia (n=1senaste 2 åren) | |
| MSI Creator 17 A10SGS | |
| Medical (medical-02) | |
| Genomsnitt av klass Multimedia (n=1senaste 2 åren) | |
| MSI Creator 17 A10SGS | |
| Showcase (showcase-02) | |
| Genomsnitt av klass Multimedia (n=1senaste 2 åren) | |
| MSI Creator 17 A10SGS | |
| Siemens NX (snx-03) | |
| Genomsnitt av klass Multimedia (n=1senaste 2 åren) | |
| MSI Creator 17 A10SGS | |
| Solidworks (sw-04) | |
| Genomsnitt av klass Multimedia (n=1senaste 2 åren) | |
| MSI Creator 17 A10SGS | |
| 3DMark 11 Performance | 22567 poäng | |
| 3DMark Fire Strike Score | 17053 poäng | |
| 3DMark Time Spy Score | 7482 poäng | |
Hjälp | ||
| The Witcher 3 - 1920x1080 Ultra Graphics & Postprocessing (HBAO+) | |
| Razer Blade Pro 17 RTX 2080 Max-Q | |
| Asus ROG Zephyrus S GX701GXR | |
| Alienware m17 R2 P41E | |
| MSI GS75 Stealth 9SG | |
| MSI Creator 17 A10SGS | |
| Genomsnitt av klass Multimedia (11 - 121, n=13, senaste 2 åren) | |
| låg | med. | hög | ultra | QHD | 4K | |
|---|---|---|---|---|---|---|
| GTA V (2015) | 180 | 174 | 157 | 85.3 | 71.5 | |
| The Witcher 3 (2015) | 138 | 75.1 | 49.8 | |||
| Dota 2 Reborn (2015) | 155 | 141 | 139 | 125 | 102 | |
| X-Plane 11.11 (2018) | 113 | 99.8 | 84.3 | 67 | ||
| Shadow of the Tomb Raider (2018) | 105 | 92 | 63 | 32 | ||
| Battlefield V (2018) | 127 | 118 | 95.4 | 52.6 | ||
| Far Cry New Dawn (2019) | 98 | 92 | 78 | 43 | ||
| Rage 2 (2019) | 102 | 101 | 63.8 | 30.9 | ||
| Control (2019) | 71.1 | 46.1 | 22 | |||
| Borderlands 3 (2019) | 79.8 | 71.6 | 51.7 | 26.9 | ||
| FIFA 20 (2019) | 217 | 213 | 189 | 114 | ||
| Call of Duty Modern Warfare 2019 (2019) | 114 | 91.8 | 67.3 | 36.8 | ||
| Star Wars Jedi Fallen Order (2019) | 102 | 95.2 | 72.2 | 36.8 | ||
| Red Dead Redemption 2 (2019) | 62.4 | 41 | 35 | 21.5 | ||
| Gears Tactics (2020) | 114 | 78.4 | 54 | 28.1 |
Ljudnivå
| Låg belastning |
| 32 / 33 / 40 dB(A) |
| Hög belastning |
| 47 / 48 dB(A) |
 | ||
30 dB tyst 40 dB(A) hörbar 50 dB(A) högt ljud |
||
min: | ||
| MSI Creator 17 A10SGS i7-10875H, GeForce RTX 2080 Super Max-Q | MSI GS75 Stealth 9SG i7-9750H, GeForce RTX 2080 Max-Q | Razer Blade Pro 17 RTX 2080 Max-Q i7-9750H, GeForce RTX 2080 Max-Q | Asus ROG Zephyrus S GX701GXR i7-9750H, GeForce RTX 2080 Max-Q | Alienware m17 R2 P41E i9-9980HK, GeForce RTX 2080 Max-Q | Genomsnitt av klass Multimedia | |
|---|---|---|---|---|---|---|
| Noise | 1% | 7% | 3% | 3% | 21% | |
| av / miljö * (dB) | 30 | 30 -0% | 28.2 6% | 30 -0% | 29.1 3% | 24.2 ? 19% |
| Idle Minimum * (dB) | 32 | 31 3% | 28.2 12% | 32 -0% | 29.4 8% | 24.3 ? 24% |
| Idle Average * (dB) | 33 | 32 3% | 28.2 15% | 33 -0% | 29.4 11% | 24.7 ? 25% |
| Idle Maximum * (dB) | 40 | 38 5% | 30.8 23% | 34 15% | 31.5 21% | 26.4 ? 34% |
| Load Average * (dB) | 47 | 47 -0% | 42 11% | 40 15% | 49.7 -6% | 37.3 ? 21% |
| Witcher 3 ultra * (dB) | 46 | 48 -4% | 51 -11% | 49 -7% | 49.5 -8% | |
| Load Maximum * (dB) | 48 | 49 -2% | 53 -10% | 50 -4% | 53.3 -11% | 45.8 ? 5% |
* ... mindre är bättre
(-) Den maximala temperaturen på ovansidan är 52 °C / 126 F, jämfört med genomsnittet av 36.8 °C / 98 F , allt från 21 till 71 °C för klassen Multimedia.
(-) Botten värms upp till maximalt 59 °C / 138 F, jämfört med genomsnittet av 39.1 °C / 102 F
(+) Vid tomgångsbruk är medeltemperaturen för ovansidan 30.9 °C / 88 F, jämfört med enhetsgenomsnittet på 31.3 °C / ### class_avg_f### F.
(-) När du spelar The Witcher 3 är medeltemperaturen för ovansidan 47.4 °C / 117 F, jämfört med enhetsgenomsnittet på 31.3 °C / ## #class_avg_f### F.
(-) Handledsstöden och pekplattan kan bli väldigt varma vid beröring med maximalt 43 °C / 109.4 F.
(-) Medeltemperaturen för handledsstödsområdet på liknande enheter var 28.7 °C / 83.7 F (-14.3 °C / -25.7 F).
| MSI Creator 17 A10SGS i7-10875H, GeForce RTX 2080 Super Max-Q | MSI GS75 Stealth 9SG i7-9750H, GeForce RTX 2080 Max-Q | Razer Blade Pro 17 RTX 2080 Max-Q i7-9750H, GeForce RTX 2080 Max-Q | Asus ROG Zephyrus S GX701GXR i7-9750H, GeForce RTX 2080 Max-Q | Alienware m17 R2 P41E i9-9980HK, GeForce RTX 2080 Max-Q | Genomsnitt av klass Multimedia | |
|---|---|---|---|---|---|---|
| Heat | -0% | 17% | 6% | -9% | 21% | |
| Maximum Upper Side * (°C) | 52 | 55 -6% | 43 17% | 50 4% | 54.2 -4% | 41.2 ? 21% |
| Maximum Bottom * (°C) | 59 | 65 -10% | 47.2 20% | 47 20% | 61.4 -4% | 43.8 ? 26% |
| Idle Upper Side * (°C) | 34 | 30 12% | 27.2 20% | 33 3% | 37.8 -11% | 27 ? 21% |
| Idle Bottom * (°C) | 33 | 32 3% | 30 9% | 34 -3% | 38.6 -17% | 28 ? 15% |
* ... mindre är bättre
MSI Creator 17 A10SGS ljudanalys
(+) | högtalare kan spela relativt högt (91 dB)
Bas 100 - 315 Hz
(-) | nästan ingen bas - i genomsnitt 33.3% lägre än medianen
(+) | basen är linjär (6% delta till föregående frekvens)
Mellan 400 - 2000 Hz
(±) | högre mellan - i genomsnitt 5.1% högre än median
(±) | linjäriteten för mids är genomsnittlig (7.1% delta till föregående frekvens)
Högsta 2 - 16 kHz
(+) | balanserade toppar - endast 1.8% från medianen
(+) | toppar är linjära (3.2% delta till föregående frekvens)
Totalt 100 - 16 000 Hz
(±) | linjäriteten för det totala ljudet är genomsnittlig (19.7% skillnad mot median)
Jämfört med samma klass
» 65% av alla testade enheter i den här klassen var bättre, 6% liknande, 29% sämre
» Den bästa hade ett delta på 5%, genomsnittet var 17%, sämst var 45%
Jämfört med alla testade enheter
» 50% av alla testade enheter var bättre, 7% liknande, 43% sämre
» Den bästa hade ett delta på 4%, genomsnittet var 24%, sämst var 134%
MSI GS75 Stealth 9SG ljudanalys
(±) | högtalarljudstyrkan är genomsnittlig men bra (81 dB)
Bas 100 - 315 Hz
(-) | nästan ingen bas - i genomsnitt 28.4% lägre än medianen
(±) | linjäriteten för basen är genomsnittlig (7.8% delta till föregående frekvens)
Mellan 400 - 2000 Hz
(±) | reducerade mids - i genomsnitt 5.8% lägre än median
(±) | linjäriteten för mids är genomsnittlig (10% delta till föregående frekvens)
Högsta 2 - 16 kHz
(+) | balanserade toppar - endast 2.3% från medianen
(+) | toppar är linjära (3.9% delta till föregående frekvens)
Totalt 100 - 16 000 Hz
(±) | linjäriteten för det totala ljudet är genomsnittlig (23.2% skillnad mot median)
Jämfört med samma klass
» 84% av alla testade enheter i den här klassen var bättre, 4% liknande, 11% sämre
» Den bästa hade ett delta på 6%, genomsnittet var 18%, sämst var 132%
Jämfört med alla testade enheter
» 69% av alla testade enheter var bättre, 5% liknande, 25% sämre
» Den bästa hade ett delta på 4%, genomsnittet var 24%, sämst var 134%
| Av/Standby | |
| Låg belastning | |
| Hög belastning |
|
Förklaring:
min: | |
| MSI Creator 17 A10SGS i7-10875H, GeForce RTX 2080 Super Max-Q | MSI GS75 Stealth 9SG i7-9750H, GeForce RTX 2080 Max-Q | Razer Blade Pro 17 RTX 2080 Max-Q i7-9750H, GeForce RTX 2080 Max-Q | Asus ROG Zephyrus S GX701GXR i7-9750H, GeForce RTX 2080 Max-Q | Alienware m17 R2 P41E i9-9980HK, GeForce RTX 2080 Max-Q | Genomsnitt av klass Multimedia | |
|---|---|---|---|---|---|---|
| Power Consumption | 16% | 9% | -19% | -38% | 57% | |
| Idle Minimum * (Watt) | 15 | 13 13% | 16.2 -8% | 32 -113% | 24.7 -65% | 5.64 ? 62% |
| Idle Average * (Watt) | 20 | 17 15% | 20.4 -2% | 34 -70% | 35.9 -80% | 10 ? 50% |
| Idle Maximum * (Watt) | 42 | 25 40% | 26.1 38% | 36 14% | 69.6 -66% | 12.2 ? 71% |
| Load Average * (Watt) | 150 | 96 36% | 96.5 36% | 95 37% | 141.8 5% | 64.8 ? 57% |
| Witcher 3 ultra * (Watt) | 170 | 156 8% | 182.9 -8% | 155 9% | 185.8 -9% | |
| Load Maximum * (Watt) | 210 | 239 -14% | 214.3 -2% | 187 11% | 235.4 -12% | 111.7 ? 47% |
* ... mindre är bättre
| MSI Creator 17 A10SGS i7-10875H, GeForce RTX 2080 Super Max-Q, 82 Wh | MSI GS75 Stealth 9SG i7-9750H, GeForce RTX 2080 Max-Q, 80.25 Wh | Razer Blade Pro 17 RTX 2080 Max-Q i7-9750H, GeForce RTX 2080 Max-Q, 70 Wh | Asus ROG Zephyrus S GX701GXR i7-9750H, GeForce RTX 2080 Max-Q, 76 Wh | Alienware m17 R2 P41E i9-9980HK, GeForce RTX 2080 Max-Q, 76 Wh | Genomsnitt av klass Multimedia | |
|---|---|---|---|---|---|---|
| Batteridrifttid | 17% | 1% | -22% | -16% | 158% | |
| Reader / Idle (h) | 7.2 | 7.7 7% | 4.9 -32% | 4.1 -43% | 7.1 -1% | 25.2 ? 250% |
| WiFi v1.3 (h) | 4.4 | 6 36% | 4.7 7% | 3 -32% | 4.8 9% | 12 ? 173% |
| Load (h) | 1.1 | 1.2 9% | 1.4 27% | 1.2 9% | 0.5 -55% | 1.675 ? 52% |
| H.264 (h) | 6.8 | 2.8 | 16.4 ? |
För
Emot
Läs den fullständiga versionen av den här recensionen på engelska här.
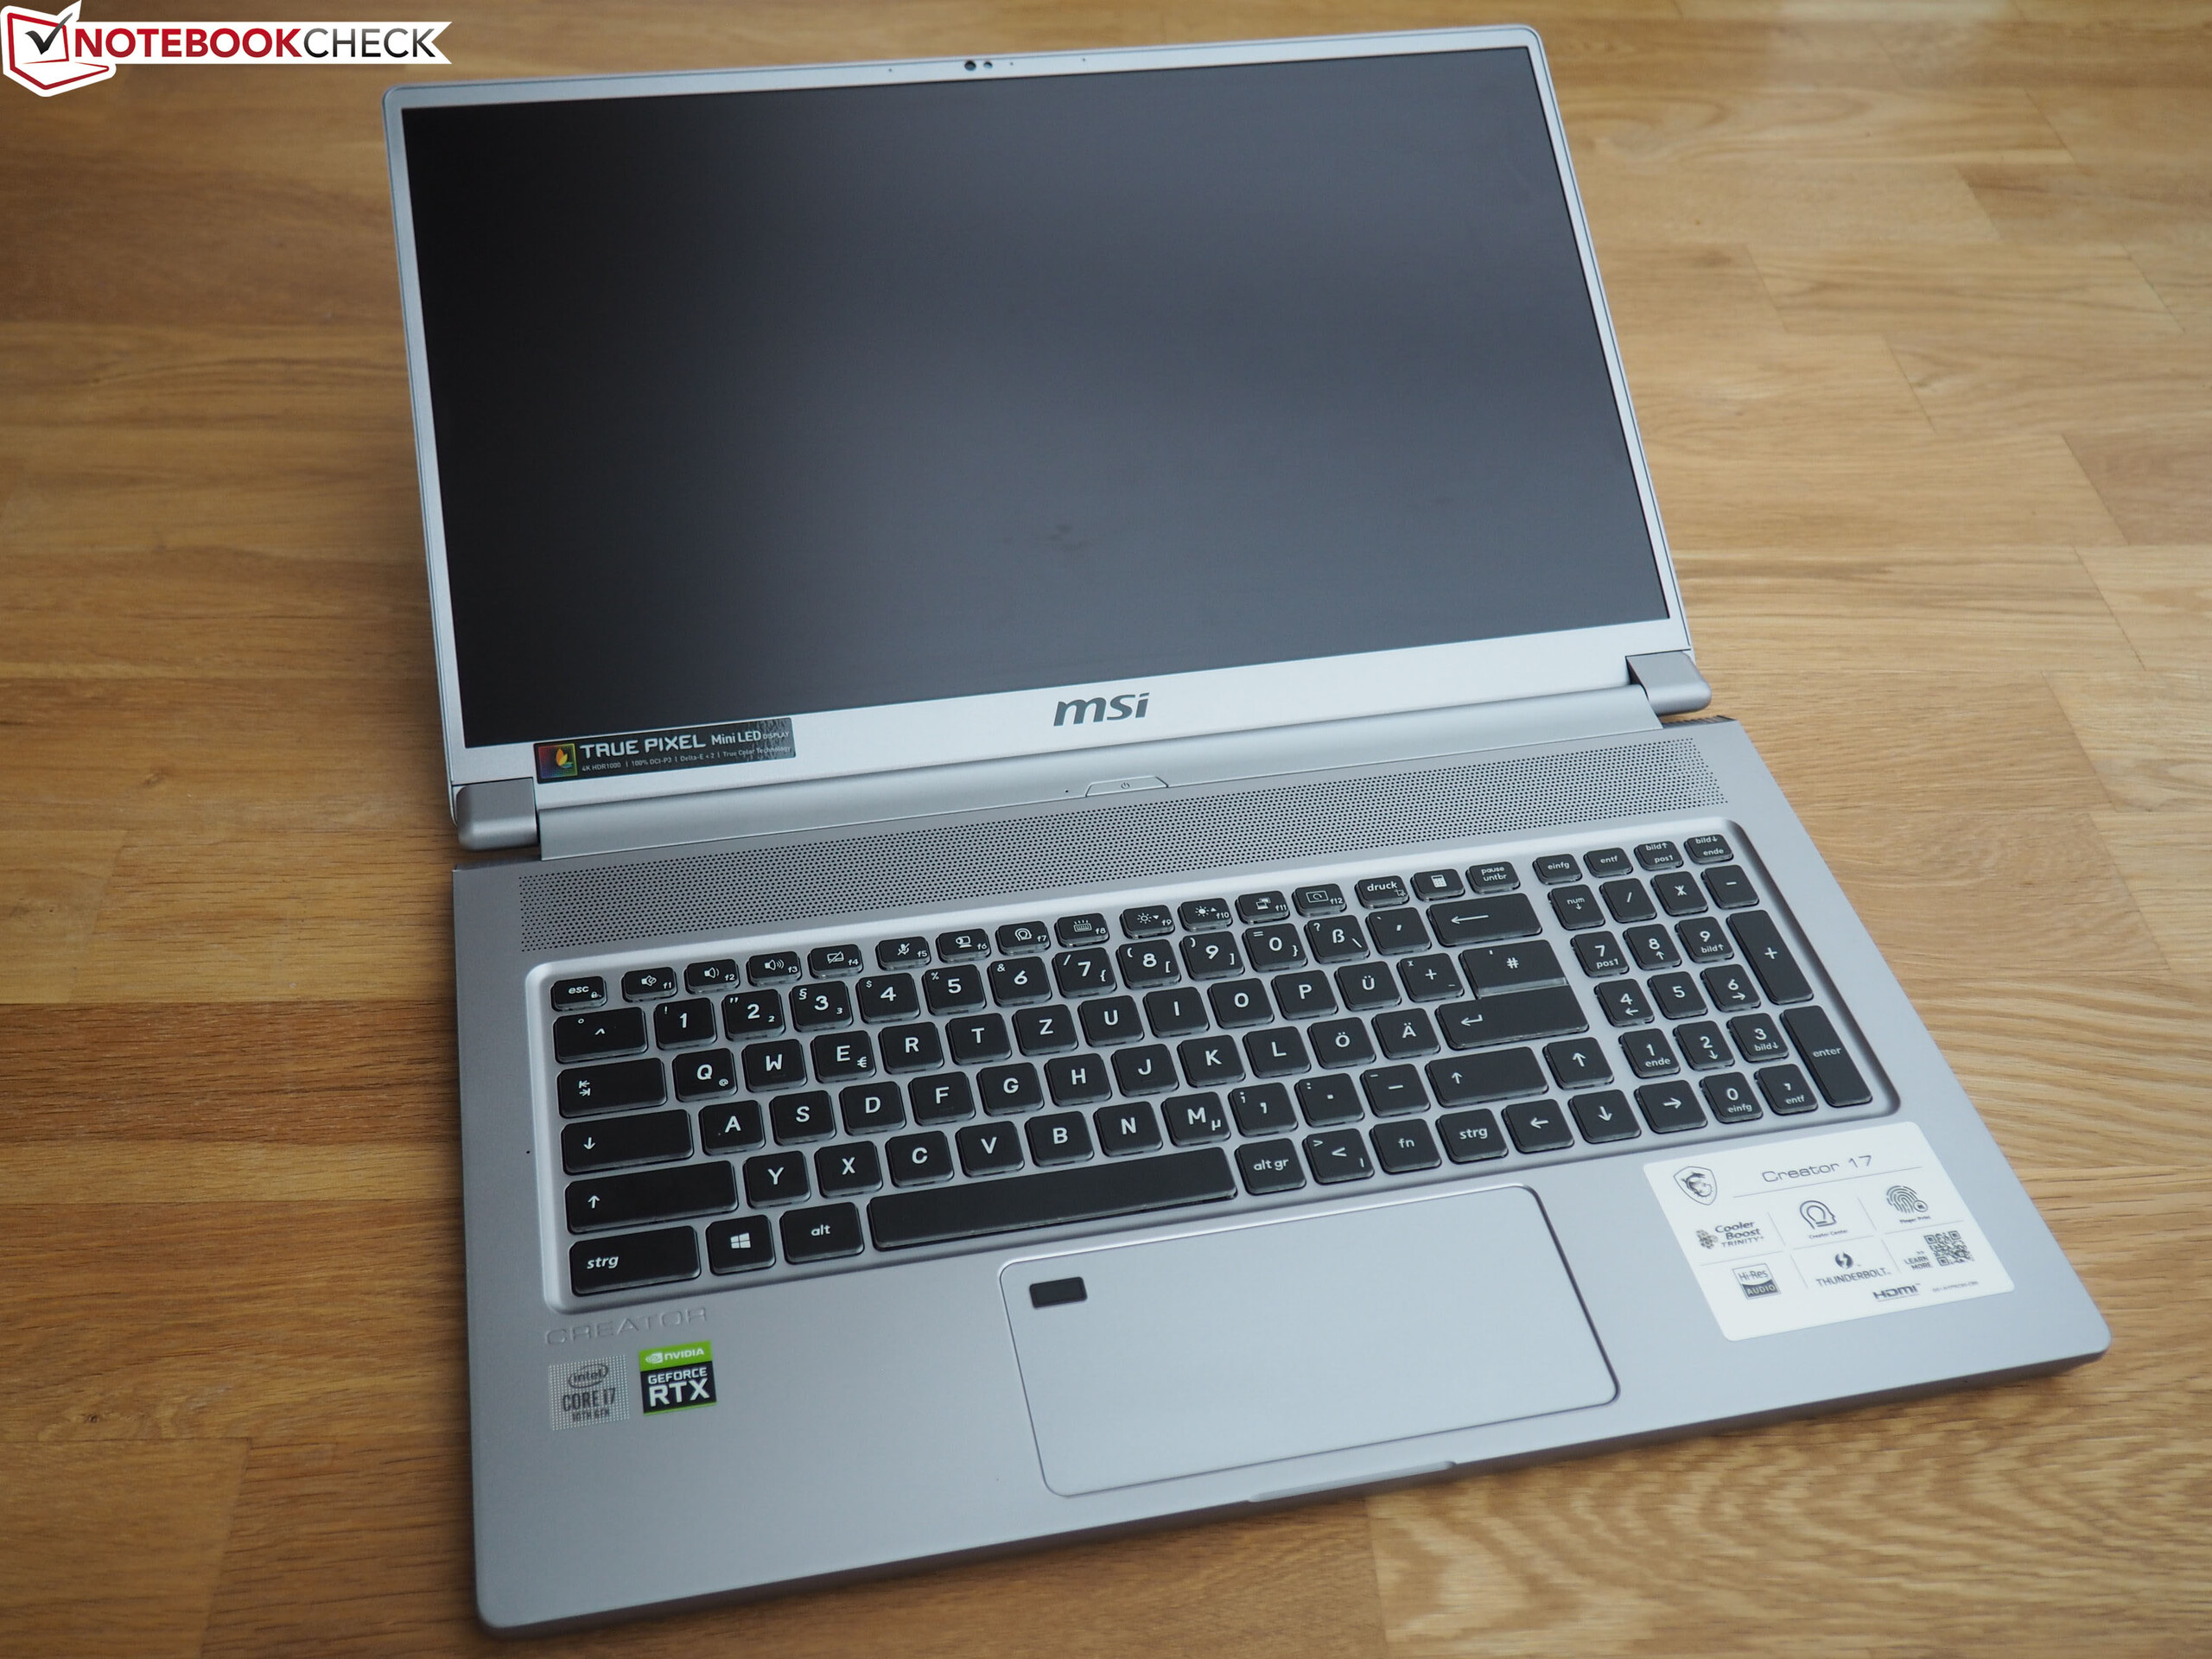
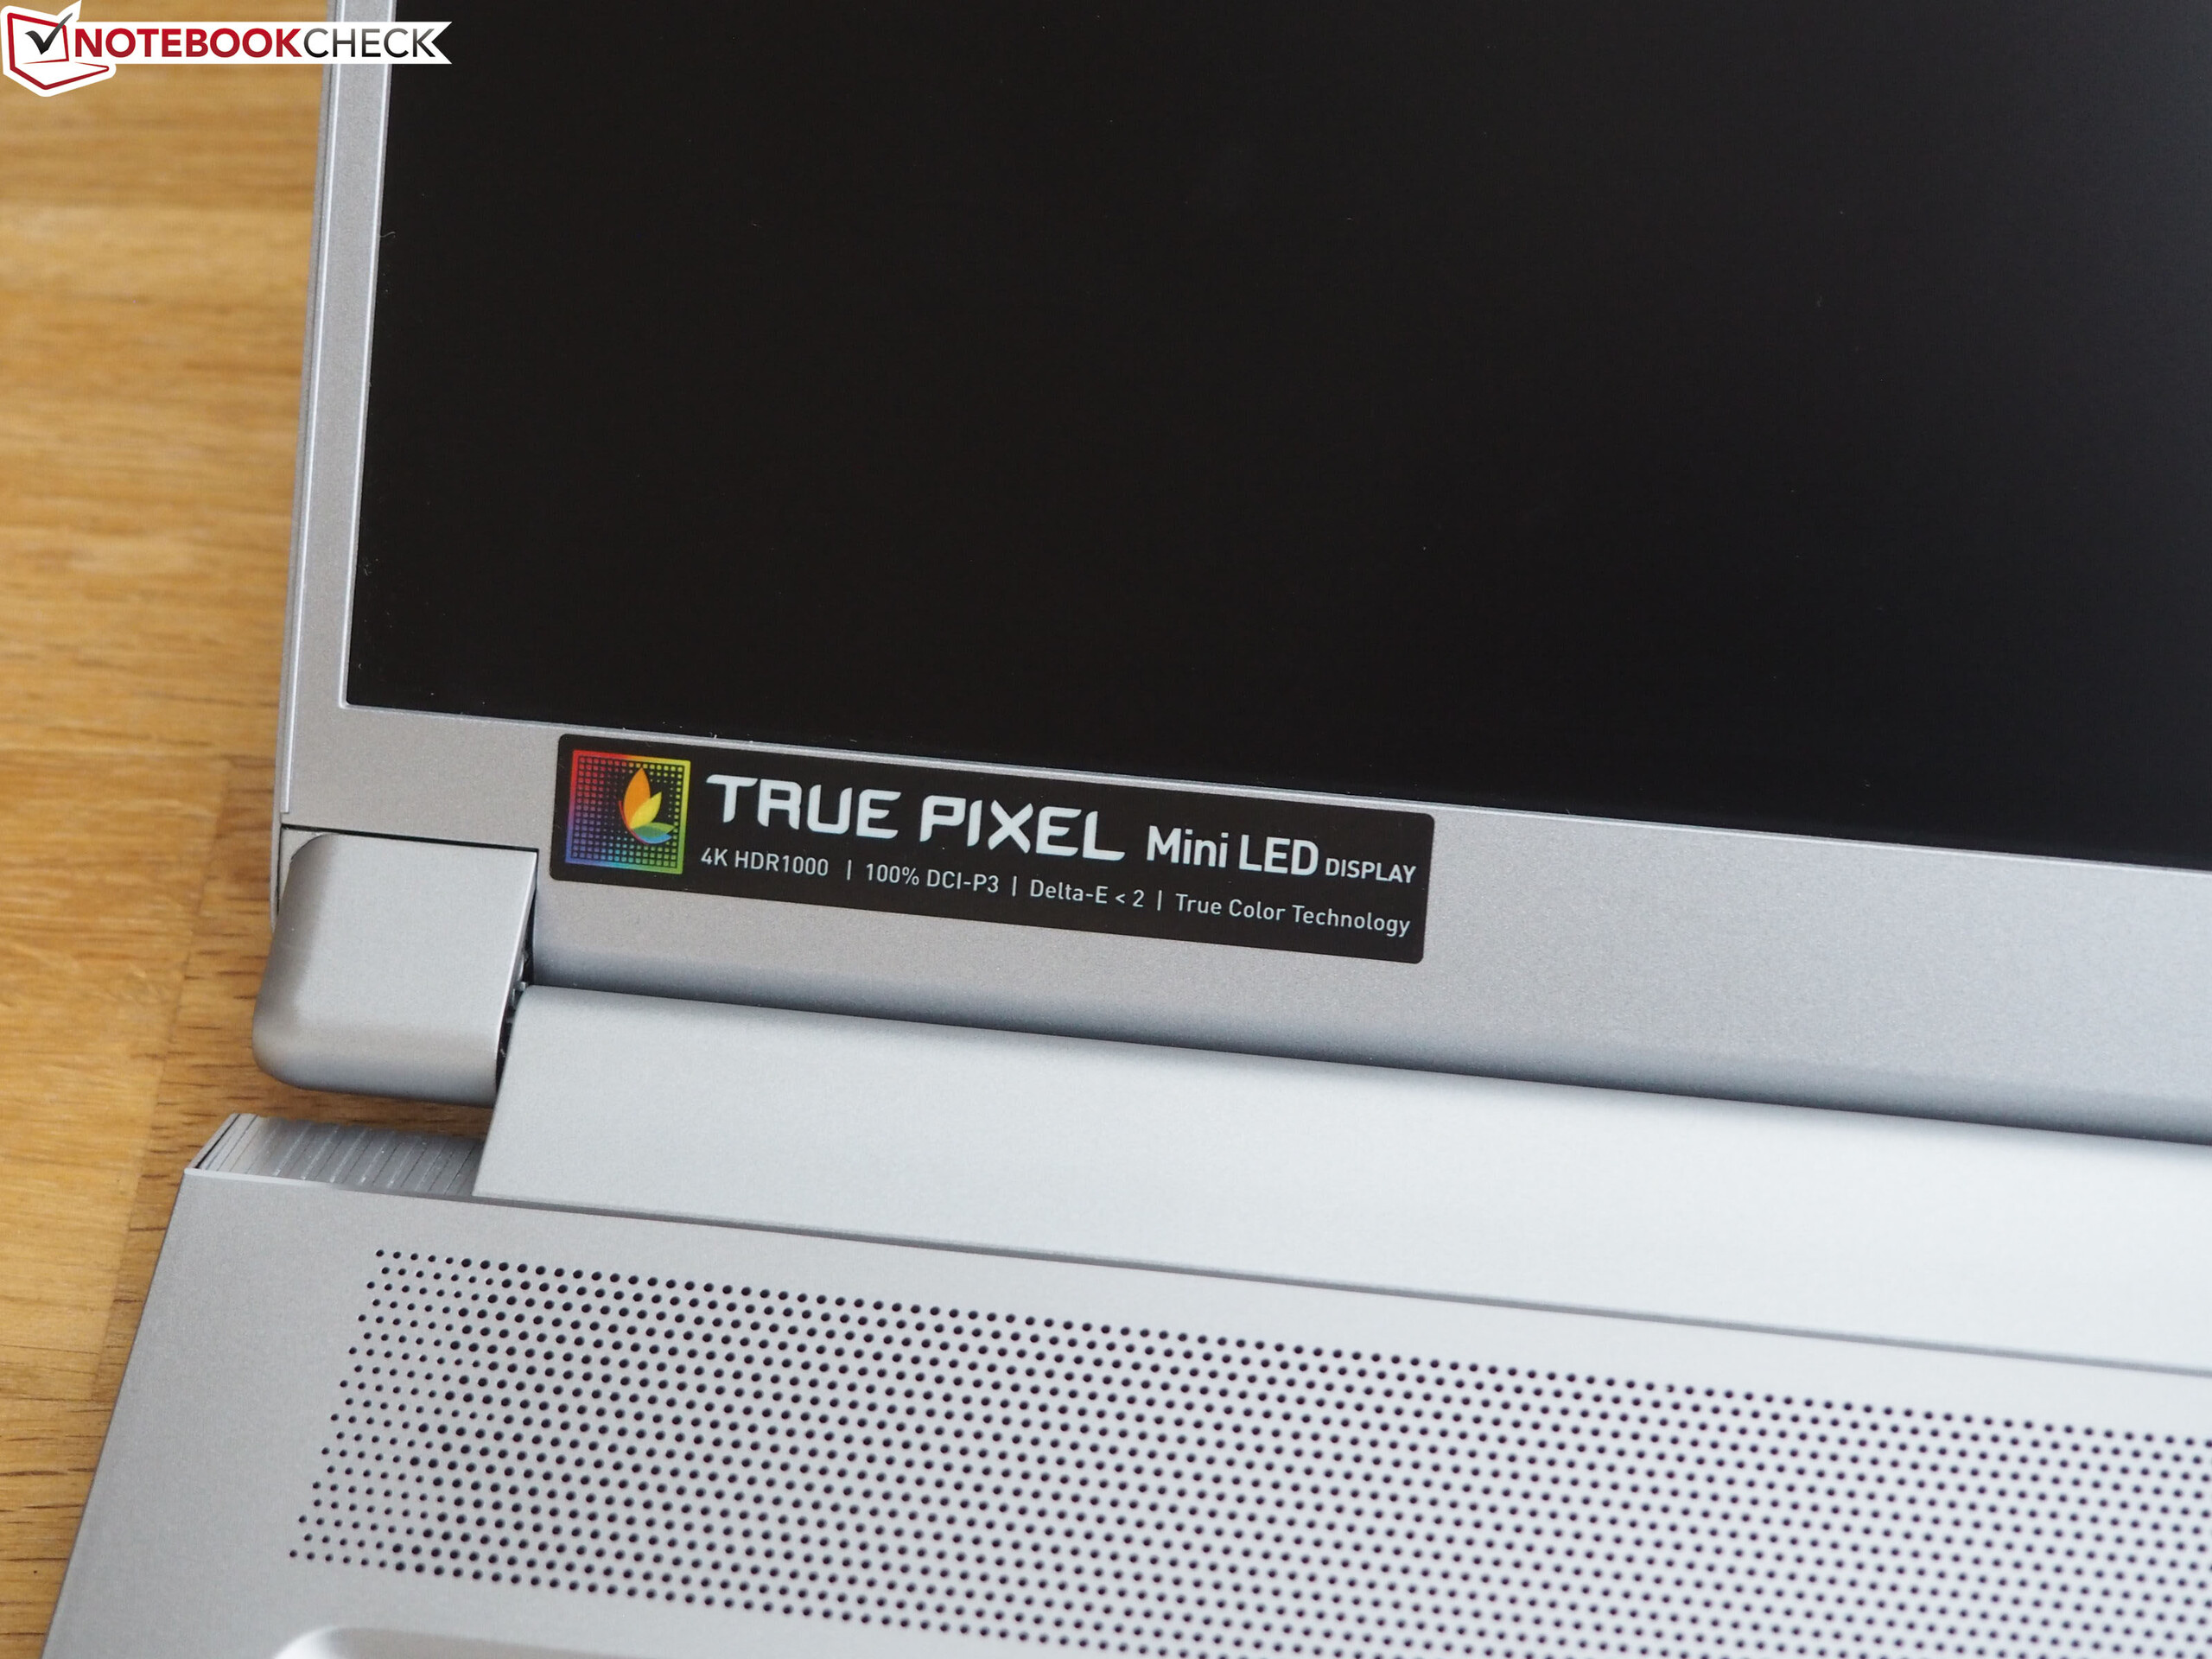
Den dyraste konfigurationen av Creator 17 lämnade ett blandat intryck i vårt test. Även om Mini LED-skärmen, som MSI är först med, lyckades övertyga på alla sätt och vis och stjäl rampljuset från konkurrenterna (nästan 1000 cd/m² ljusstyrka!) så hade höljet mindre än väntat att erbjuda (stabilitet, kvalitet, intryck, osv).
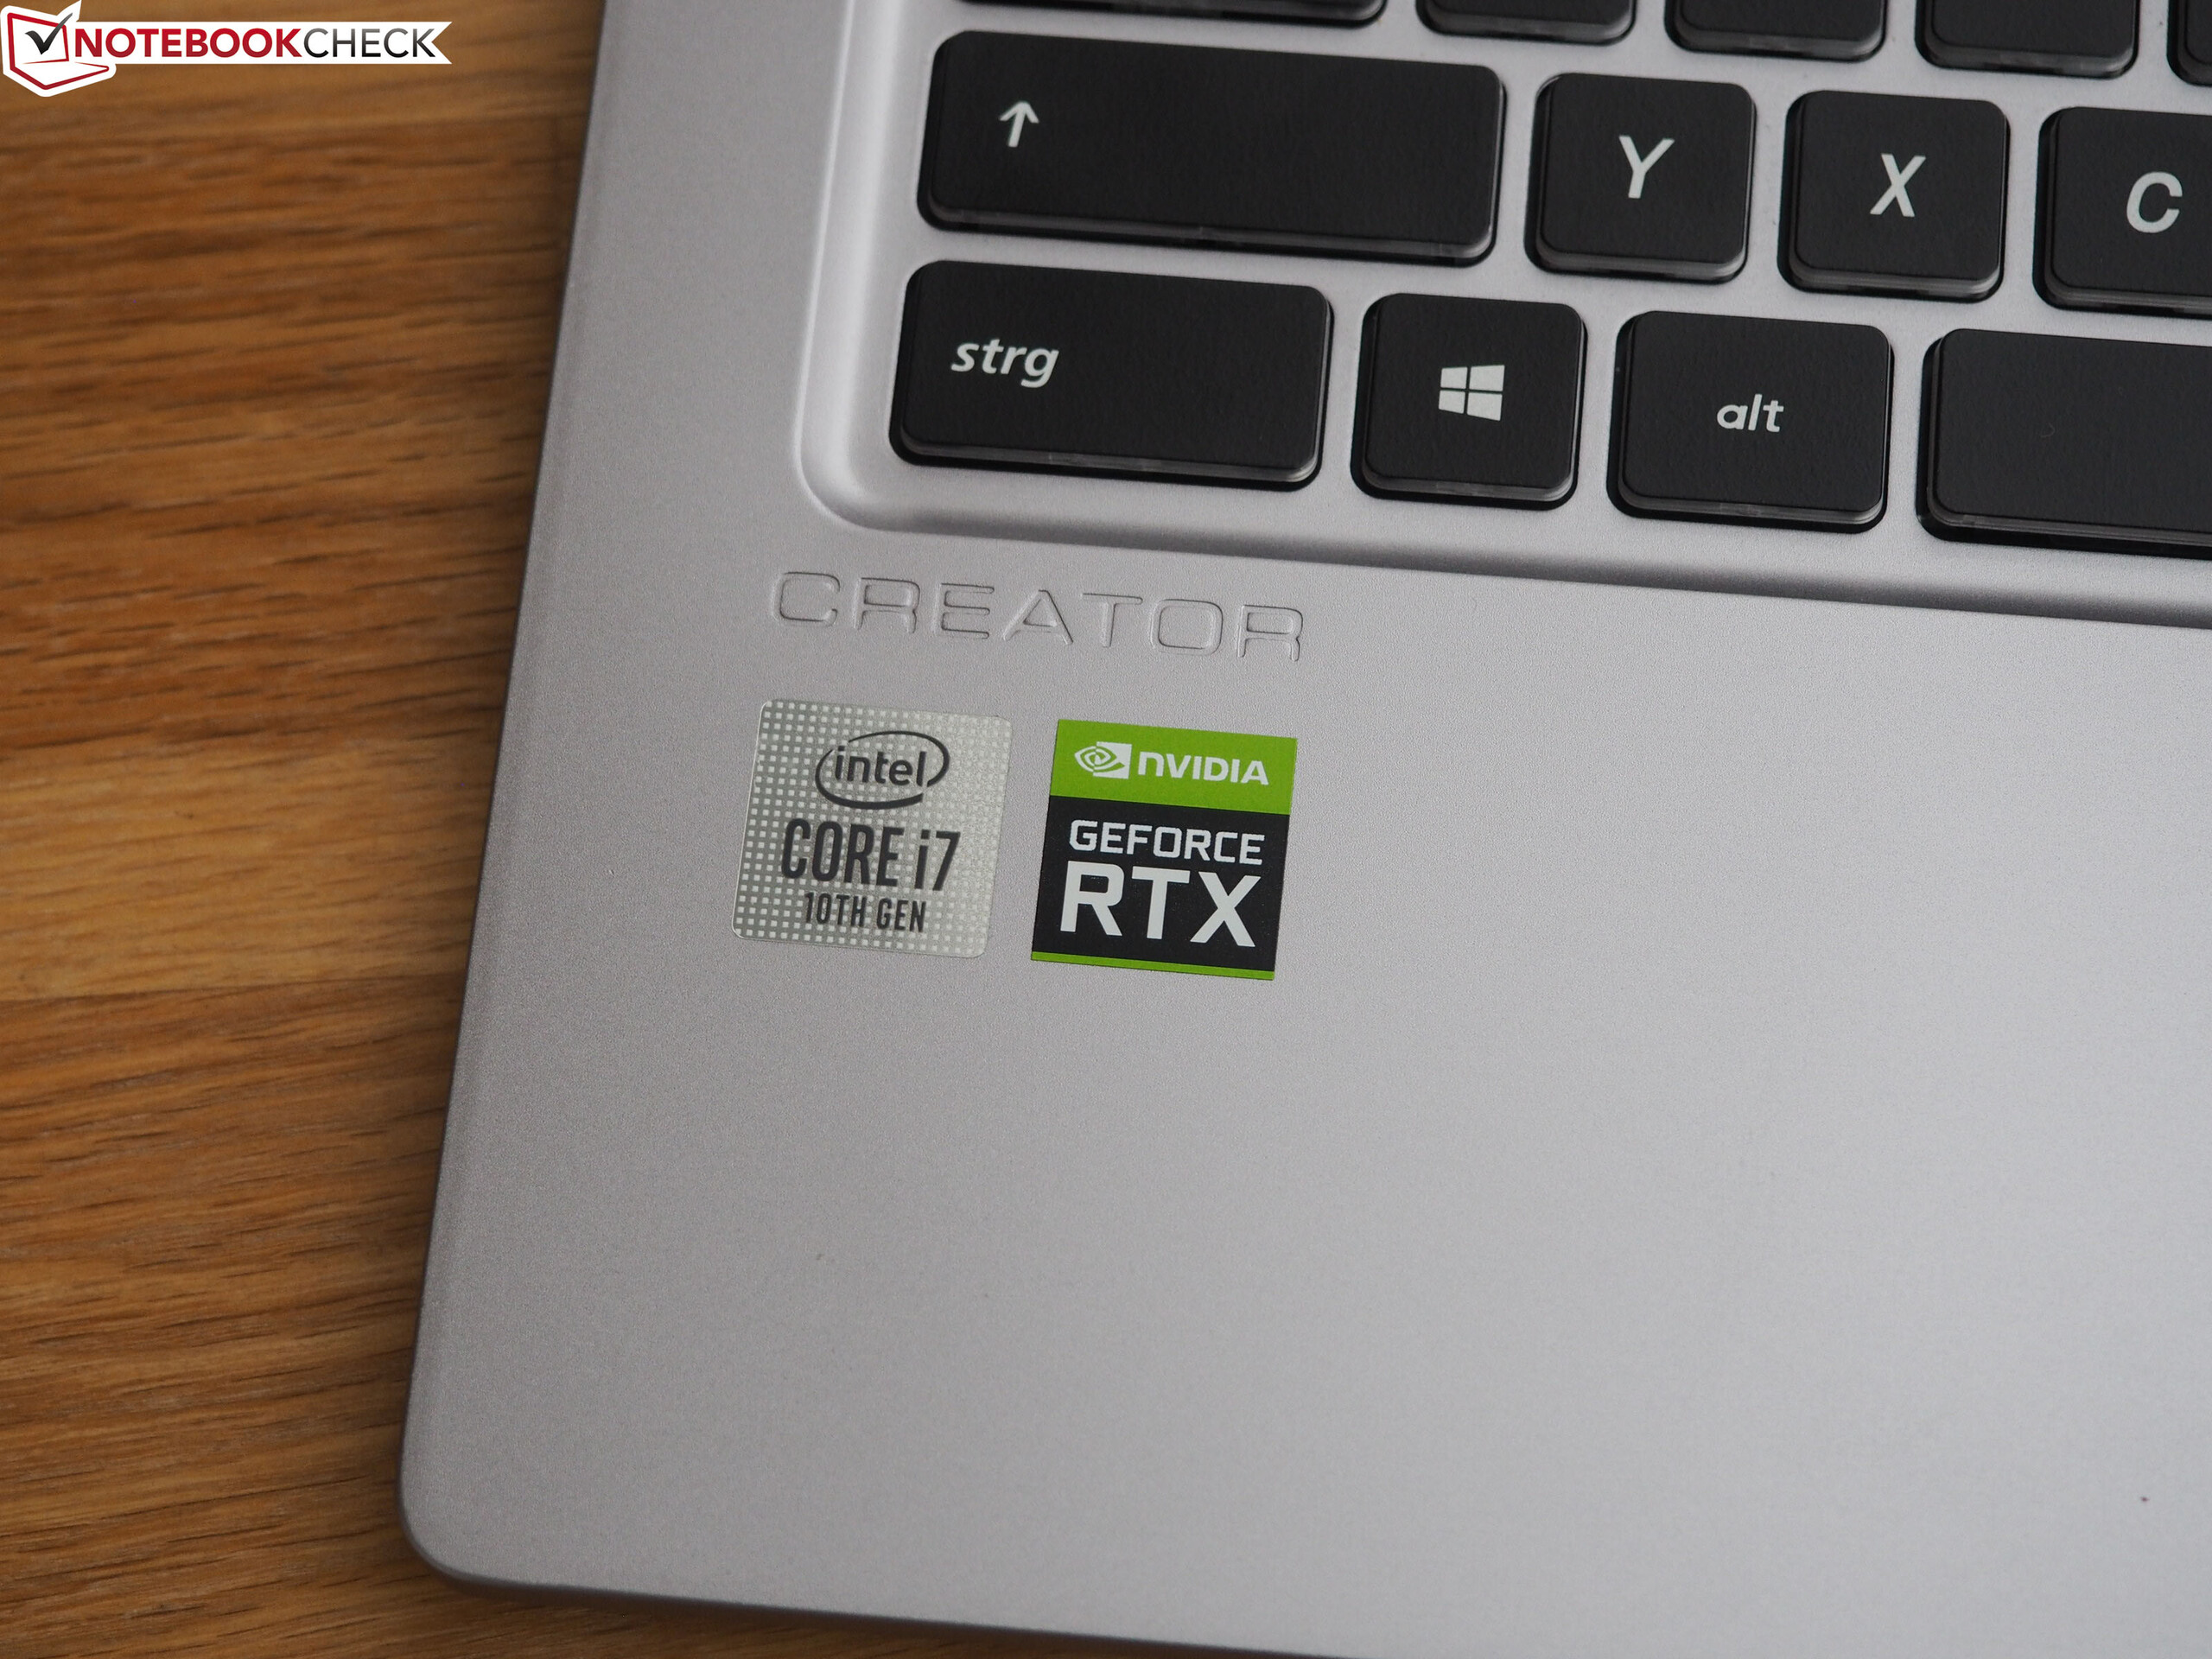
Med tanke på hur dess RTX 2080 Super Max-Q presterade, i relation till det höga priset, rekommenderar vi istället den billigare modellen med ett RTX 2070 (Super) Max-Q till intresserade köpare. Att använda en Core i7-10875H Turbo kan också vara bättre.
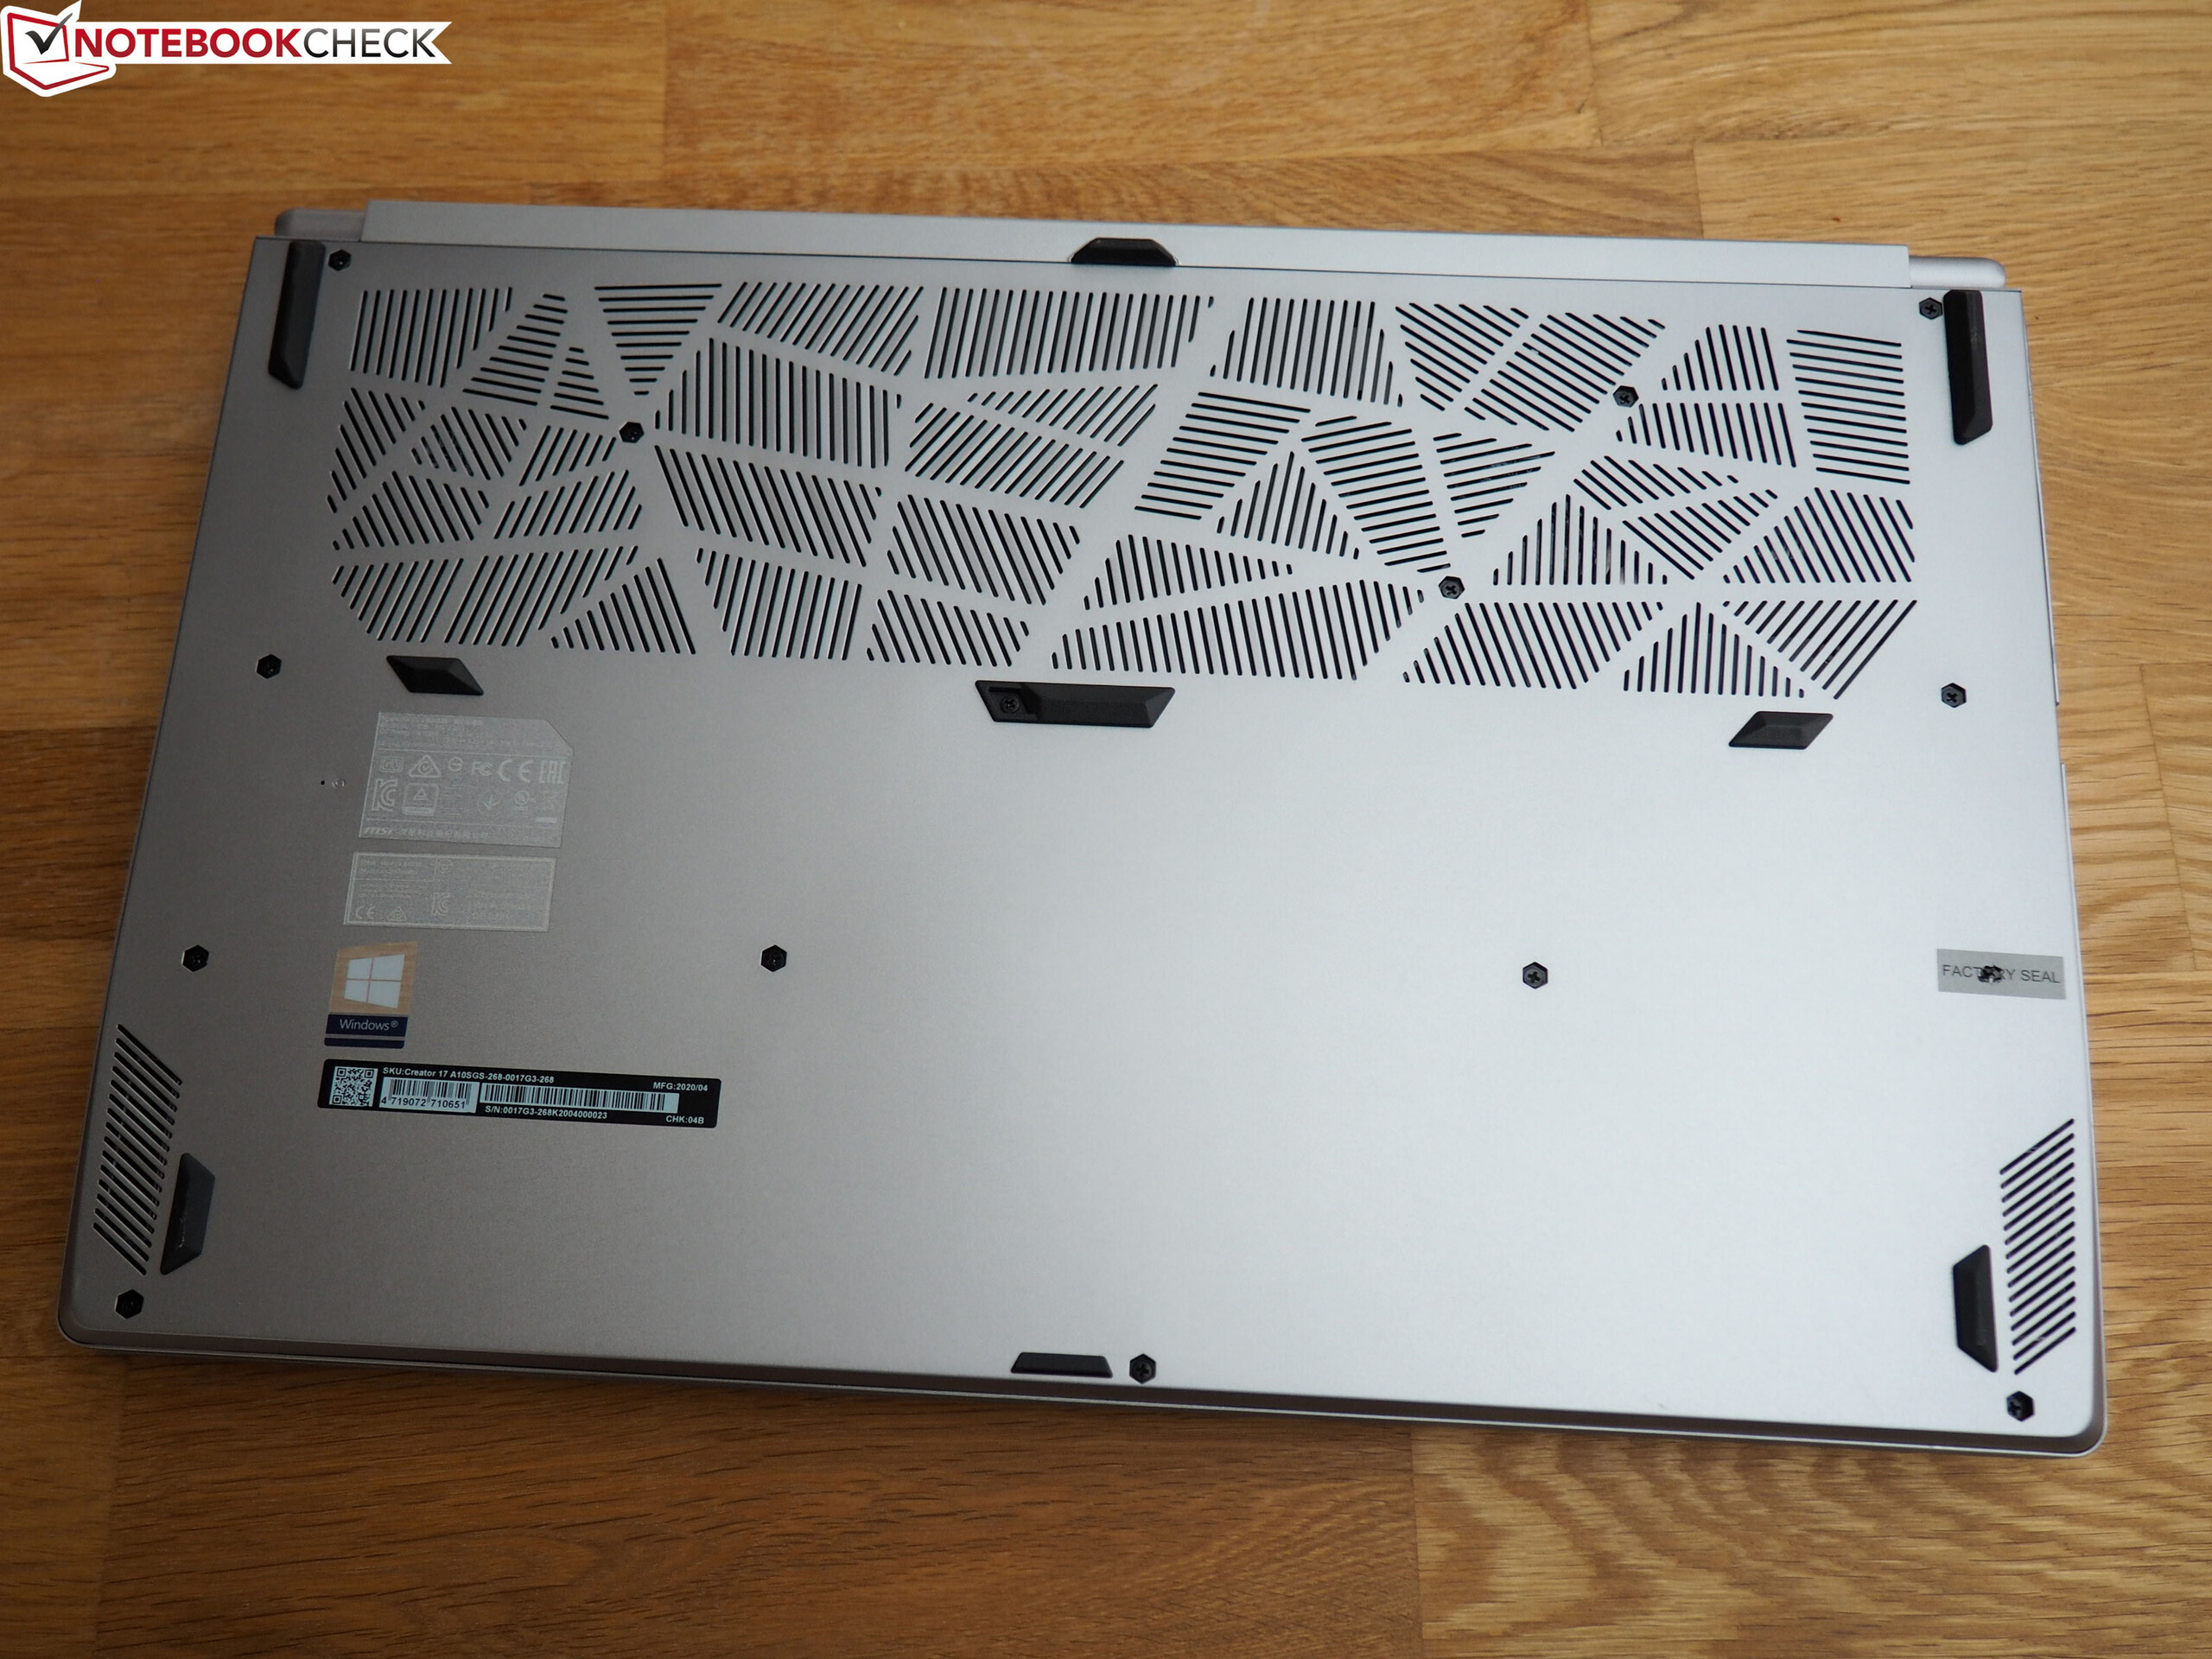
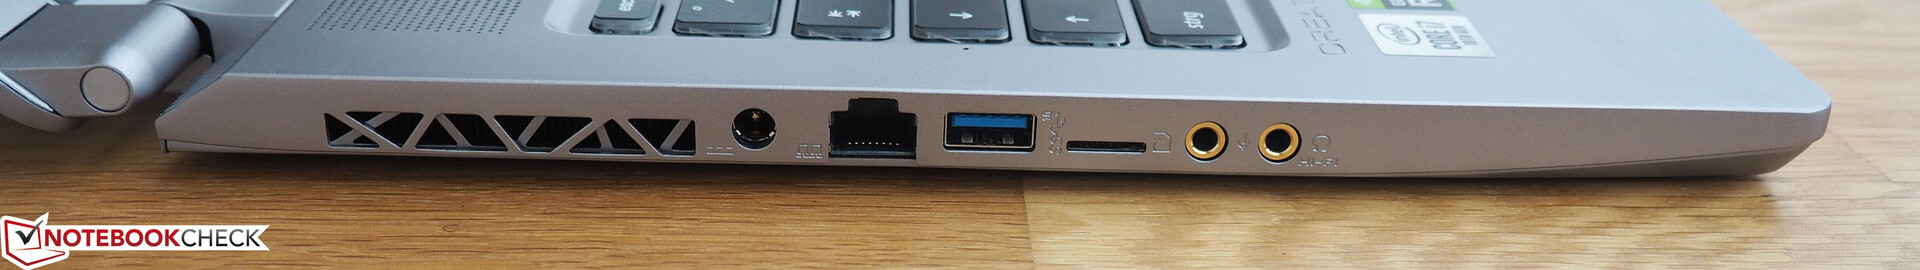
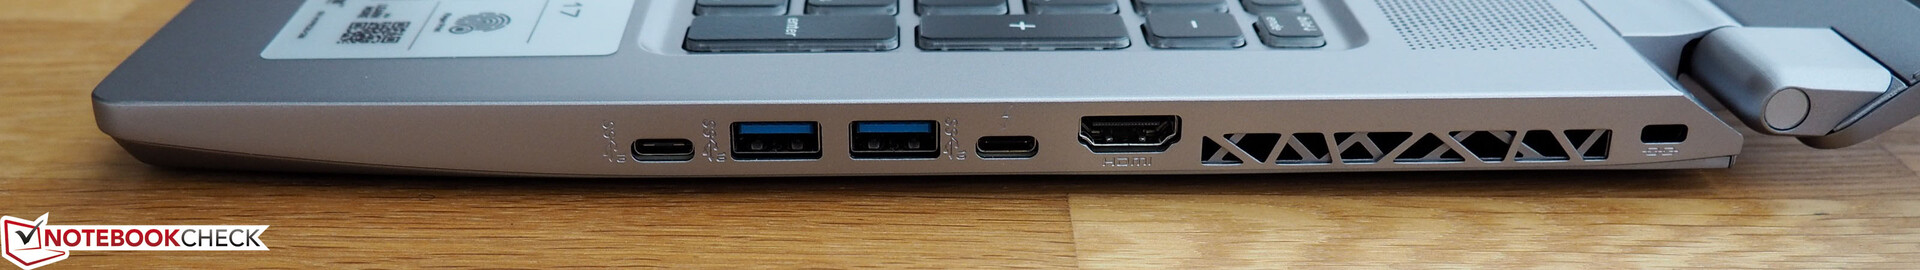
Faktum att Creator 17 kommer att landa på vår Topp 10-lista för Foto- och Videoredigering trots bristerna beror till stor del på att den har gott om anslutningsmöjligheter, inklusive Thunderbolt 3. För en eventuell efterföljare hade vi önskat oss ett robustare och tystare hölje med ett kylsystem som inte körs så nära bristningsgränsen.
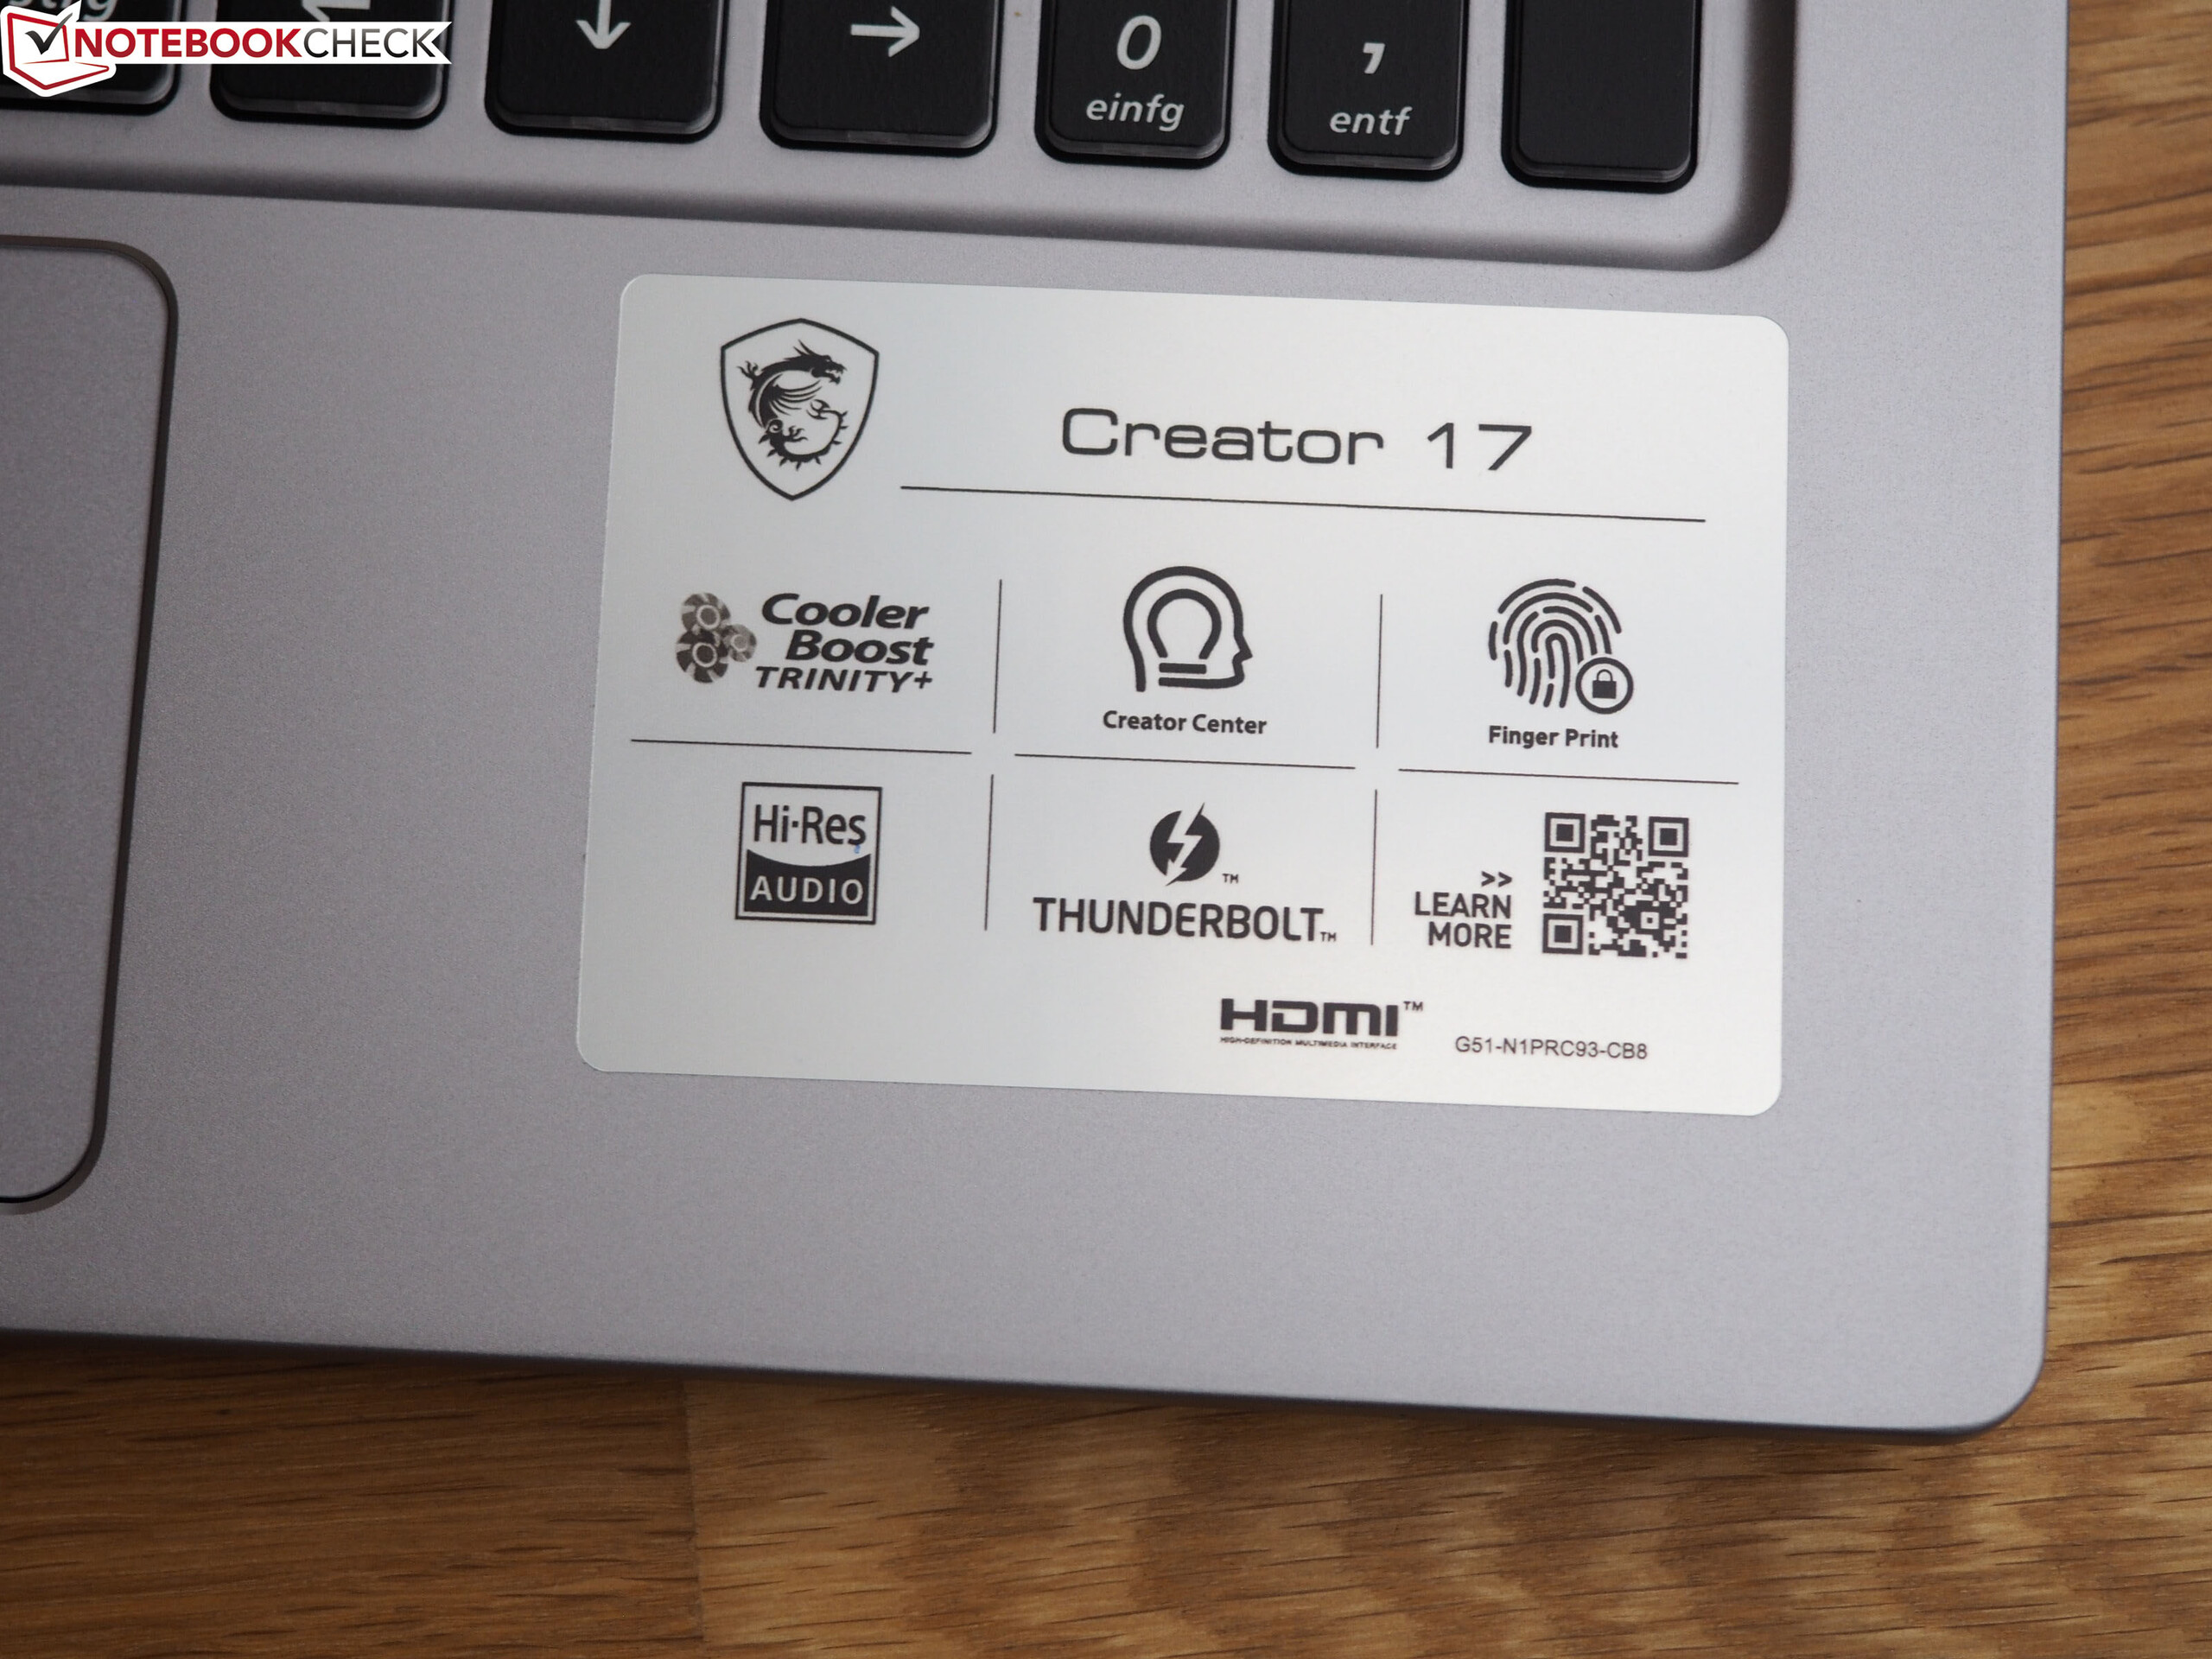
MSI Creator 17 A10SGS
- 07/05/2020 v7 (old)
Florian Glaser
Price comparison