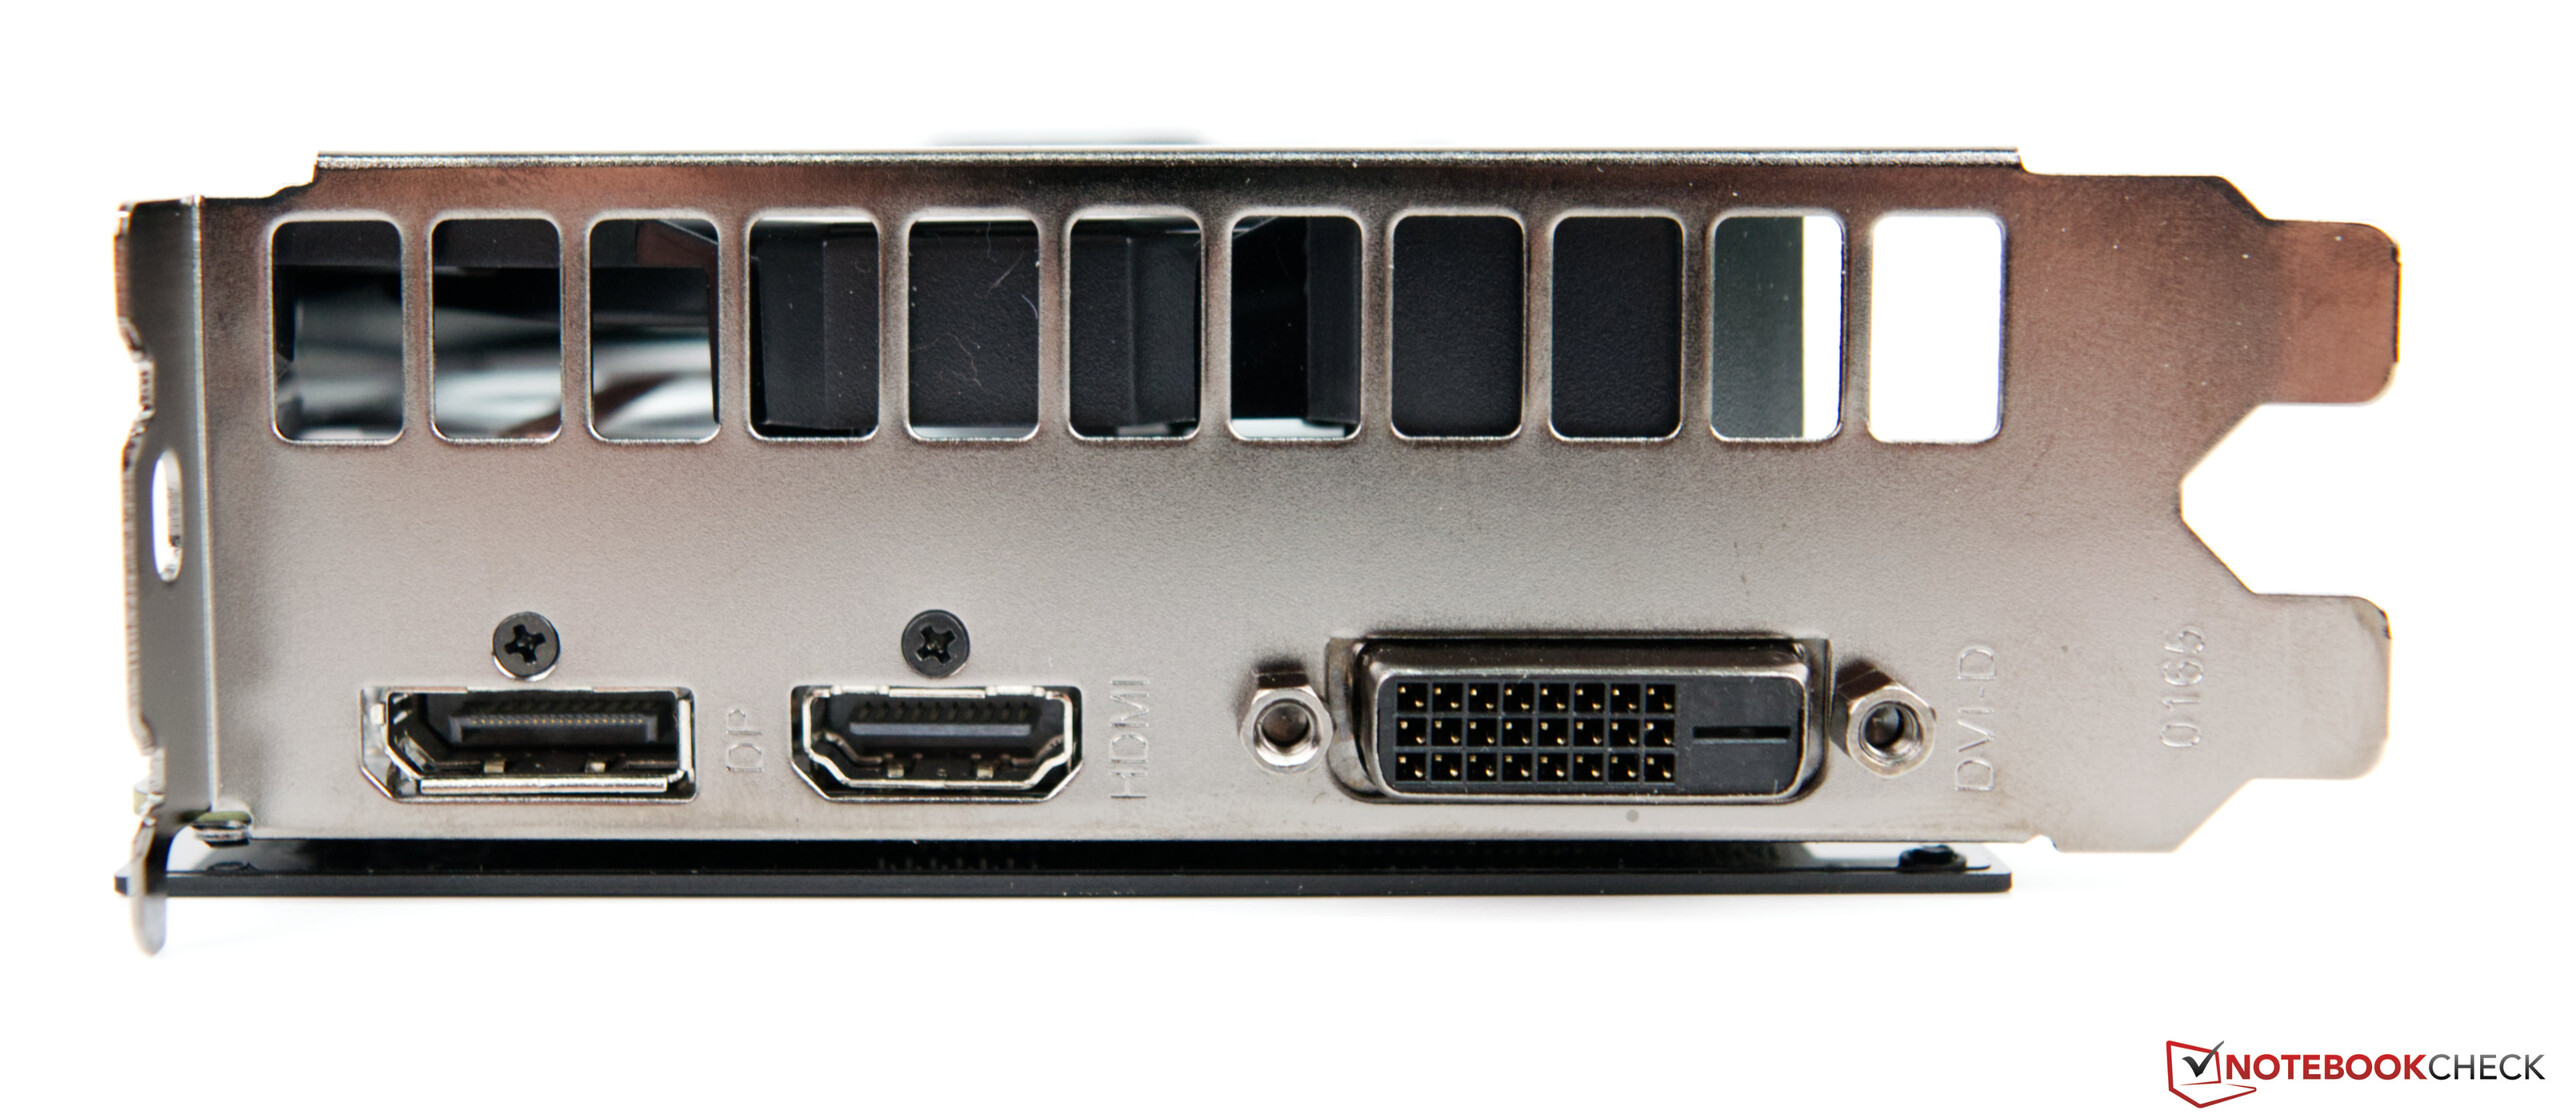
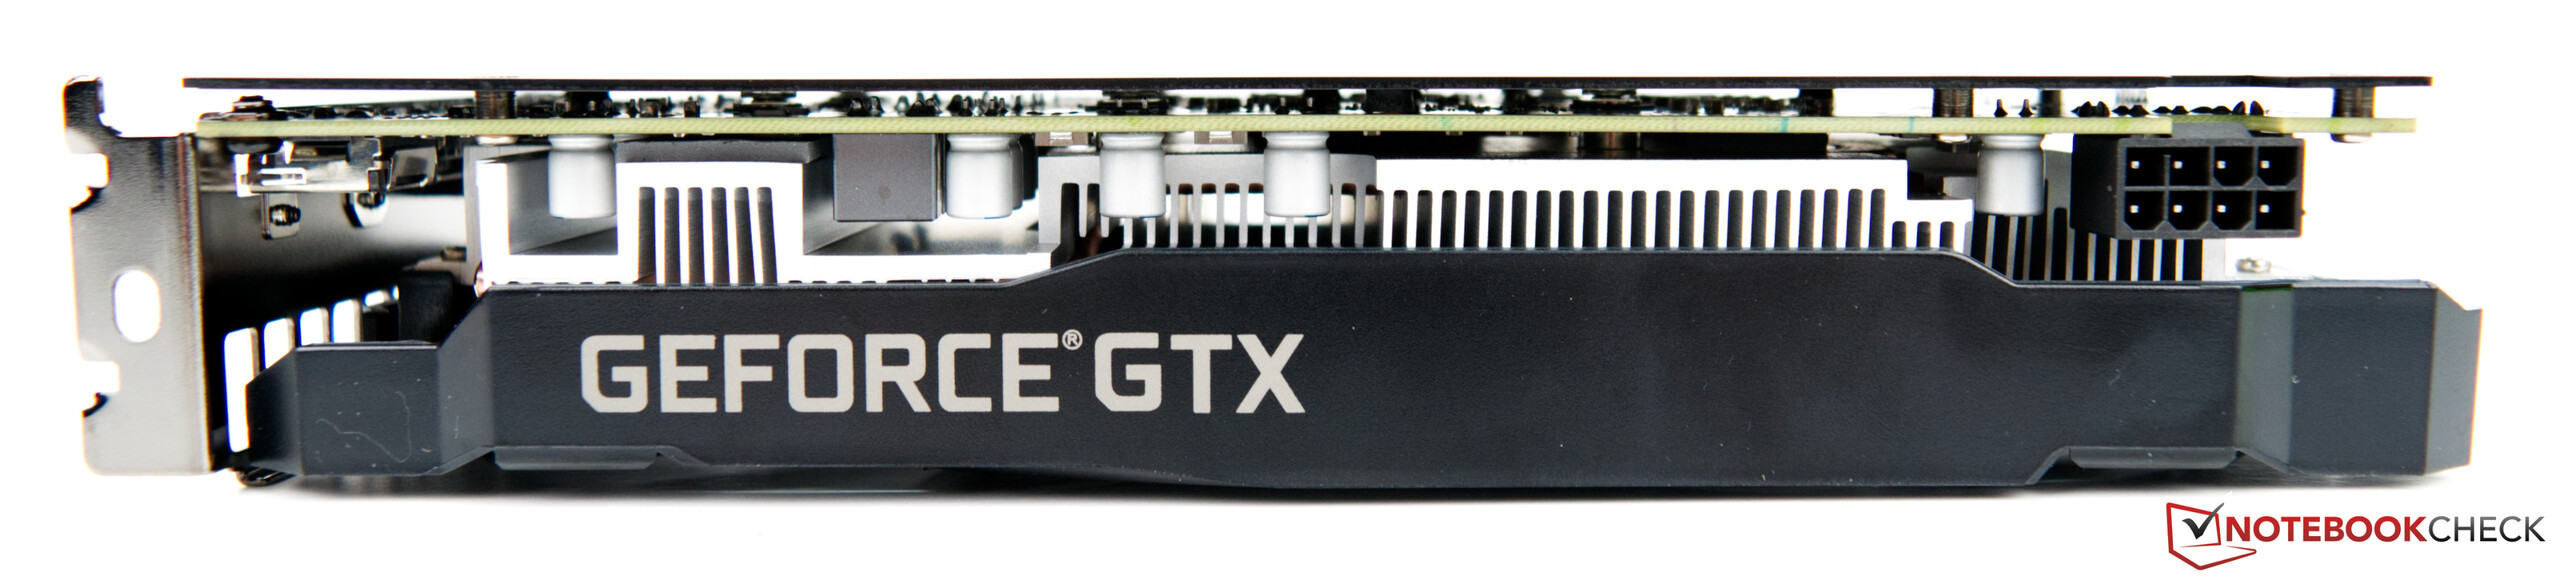
Test: KFA2 GeForce GTX 1660 SUPER - GTX 16-serien får också en SUPER-uppgradering (Sammanfattning)
| Performance rating - Percent | |
| AMD Radeon RX 5700 XT -1! | |
| Nvidia GeForce RTX 2060 Super -31! | |
| KFA2 GeForce RTX 2060 Super | |
| AMD Radeon RX 5700 -1! | |
| MSI RTX 2060 Gaming Z 6G | |
| Zotac GeForce GTX 1660 Ti 6 GB | |
| XFX AMD Radeon RX 590 OC+ 8 GB -3! | |
| KFA 2 GeForce GTX 1660 Super | |
| Sapphire NITRO+ RX 570 8 GB -1! | |
| PNY GeForce GTX 1660 | |
| Gainward GeForce GTX 1650 4 GB | |
| 3DMark | |
| 1920x1080 Fire Strike Graphics | |
| AMD Radeon RX 5700 XT | |
| AMD Radeon RX 5700 | |
| Nvidia GeForce RTX 2060 Super | |
| KFA2 GeForce RTX 2060 Super | |
| MSI RTX 2060 Gaming Z 6G | |
| XFX AMD Radeon RX 590 OC+ 8 GB | |
| Zotac GeForce GTX 1660 Ti 6 GB | |
| KFA 2 GeForce GTX 1660 Super | |
| PNY GeForce GTX 1660 | |
| Sapphire NITRO+ RX 570 8 GB | |
| Gainward GeForce GTX 1650 4 GB | |
| Fire Strike Extreme Graphics | |
| AMD Radeon RX 5700 XT | |
| AMD Radeon RX 5700 | |
| Nvidia GeForce RTX 2060 Super | |
| KFA2 GeForce RTX 2060 Super | |
| MSI RTX 2060 Gaming Z 6G | |
| XFX AMD Radeon RX 590 OC+ 8 GB | |
| Zotac GeForce GTX 1660 Ti 6 GB | |
| KFA 2 GeForce GTX 1660 Super | |
| PNY GeForce GTX 1660 | |
| Sapphire NITRO+ RX 570 8 GB | |
| Gainward GeForce GTX 1650 4 GB | |
| 3840x2160 Fire Strike Ultra Graphics | |
| AMD Radeon RX 5700 XT | |
| AMD Radeon RX 5700 | |
| Nvidia GeForce RTX 2060 Super | |
| KFA2 GeForce RTX 2060 Super | |
| MSI RTX 2060 Gaming Z 6G | |
| XFX AMD Radeon RX 590 OC+ 8 GB | |
| Zotac GeForce GTX 1660 Ti 6 GB | |
| KFA 2 GeForce GTX 1660 Super | |
| Sapphire NITRO+ RX 570 8 GB | |
| PNY GeForce GTX 1660 | |
| Gainward GeForce GTX 1650 4 GB | |
| 2560x1440 Time Spy Graphics | |
| KFA2 GeForce RTX 2060 Super | |
| AMD Radeon RX 5700 XT | |
| Nvidia GeForce RTX 2060 Super | |
| MSI RTX 2060 Gaming Z 6G | |
| AMD Radeon RX 5700 | |
| Zotac GeForce GTX 1660 Ti 6 GB | |
| KFA 2 GeForce GTX 1660 Super | |
| PNY GeForce GTX 1660 | |
| XFX AMD Radeon RX 590 OC+ 8 GB | |
| Sapphire NITRO+ RX 570 8 GB | |
| Gainward GeForce GTX 1650 4 GB | |
| 3DMark 11 - 1280x720 Performance GPU | |
| AMD Radeon RX 5700 XT | |
| AMD Radeon RX 5700 | |
| Nvidia GeForce RTX 2060 Super | |
| KFA2 GeForce RTX 2060 Super | |
| MSI RTX 2060 Gaming Z 6G | |
| XFX AMD Radeon RX 590 OC+ 8 GB | |
| Zotac GeForce GTX 1660 Ti 6 GB | |
| KFA 2 GeForce GTX 1660 Super | |
| PNY GeForce GTX 1660 | |
| Sapphire NITRO+ RX 570 8 GB | |
| Gainward GeForce GTX 1650 4 GB | |
| Unigine Heaven 4.0 | |
| Extreme Preset OpenGL | |
| KFA2 GeForce RTX 2060 Super | |
| MSI RTX 2060 Gaming Z 6G | |
| AMD Radeon RX 5700 XT | |
| AMD Radeon RX 5700 | |
| Zotac GeForce GTX 1660 Ti 6 GB | |
| KFA 2 GeForce GTX 1660 Super | |
| PNY GeForce GTX 1660 | |
| XFX AMD Radeon RX 590 OC+ 8 GB | |
| Sapphire NITRO+ RX 570 8 GB | |
| Gainward GeForce GTX 1650 4 GB | |
| Extreme Preset DX11 | |
| KFA2 GeForce RTX 2060 Super | |
| AMD Radeon RX 5700 XT | |
| MSI RTX 2060 Gaming Z 6G | |
| AMD Radeon RX 5700 | |
| Zotac GeForce GTX 1660 Ti 6 GB | |
| KFA 2 GeForce GTX 1660 Super | |
| PNY GeForce GTX 1660 | |
| XFX AMD Radeon RX 590 OC+ 8 GB | |
| Sapphire NITRO+ RX 570 8 GB | |
| Gainward GeForce GTX 1650 4 GB | |
| Unigine Valley 1.0 | |
| 1920x1080 Extreme HD DirectX AA:x8 | |
| KFA2 GeForce RTX 2060 Super | |
| AMD Radeon RX 5700 XT | |
| AMD Radeon RX 5700 | |
| MSI RTX 2060 Gaming Z 6G | |
| KFA 2 GeForce GTX 1660 Super | |
| Zotac GeForce GTX 1660 Ti 6 GB | |
| PNY GeForce GTX 1660 | |
| XFX AMD Radeon RX 590 OC+ 8 GB | |
| Sapphire NITRO+ RX 570 8 GB | |
| Gainward GeForce GTX 1650 4 GB | |
| 1920x1080 Extreme HD Preset OpenGL AA:x8 | |
| KFA2 GeForce RTX 2060 Super | |
| AMD Radeon RX 5700 XT | |
| MSI RTX 2060 Gaming Z 6G | |
| AMD Radeon RX 5700 | |
| Zotac GeForce GTX 1660 Ti 6 GB | |
| KFA 2 GeForce GTX 1660 Super | |
| PNY GeForce GTX 1660 | |
| XFX AMD Radeon RX 590 OC+ 8 GB | |
| Sapphire NITRO+ RX 570 8 GB | |
| Gainward GeForce GTX 1650 4 GB | |
| LuxMark v2.0 64Bit | |
| Room GPUs-only | |
| KFA2 GeForce RTX 2060 Super | |
| MSI RTX 2060 Gaming Z 6G | |
| KFA 2 GeForce GTX 1660 Super | |
| Zotac GeForce GTX 1660 Ti 6 GB | |
| AMD Radeon RX 5700 XT | |
| PNY GeForce GTX 1660 | |
| XFX AMD Radeon RX 590 OC+ 8 GB | |
| AMD Radeon RX 5700 | |
| Sapphire NITRO+ RX 570 8 GB | |
| Gainward GeForce GTX 1650 4 GB | |
| Sala GPUs-only | |
| KFA2 GeForce RTX 2060 Super | |
| AMD Radeon RX 5700 XT | |
| MSI RTX 2060 Gaming Z 6G | |
| AMD Radeon RX 5700 | |
| KFA 2 GeForce GTX 1660 Super | |
| Zotac GeForce GTX 1660 Ti 6 GB | |
| XFX AMD Radeon RX 590 OC+ 8 GB | |
| PNY GeForce GTX 1660 | |
| Sapphire NITRO+ RX 570 8 GB | |
| Gainward GeForce GTX 1650 4 GB | |
| SiSoft Sandra 2016 | |
| Image Processing | |
| KFA2 GeForce RTX 2060 Super | |
| AMD Radeon RX 5700 XT | |
| MSI RTX 2060 Gaming Z 6G | |
| AMD Radeon RX 5700 | |
| Zotac GeForce GTX 1660 Ti 6 GB | |
| KFA 2 GeForce GTX 1660 Super | |
| PNY GeForce GTX 1660 | |
| Gainward GeForce GTX 1650 4 GB | |
| GP Cryptography (Higher Security AES256+SHA2-512) | |
| KFA2 GeForce RTX 2060 Super | |
| MSI RTX 2060 Gaming Z 6G | |
| PNY GeForce GTX 1660 | |
| KFA 2 GeForce GTX 1660 Super | |
| Zotac GeForce GTX 1660 Ti 6 GB | |
| Sapphire NITRO+ RX 570 8 GB | |
| Gainward GeForce GTX 1650 4 GB | |
| GP Financial Analysis (FP High/Double Precision) | |
| Sapphire NITRO+ RX 570 8 GB | |
| KFA2 GeForce RTX 2060 Super | |
| MSI RTX 2060 Gaming Z 6G | |
| Zotac GeForce GTX 1660 Ti 6 GB | |
| PNY GeForce GTX 1660 | |
| KFA 2 GeForce GTX 1660 Super | |
| Gainward GeForce GTX 1650 4 GB | |
| AMD Radeon RX 5700 XT | |
| AMD Radeon RX 5700 | |
| 3DMark 05 Standard | 53106 poäng | |
| 3DMark 06 Standard Score | 44443 poäng | |
| 3DMark Vantage P Result | 60318 poäng | |
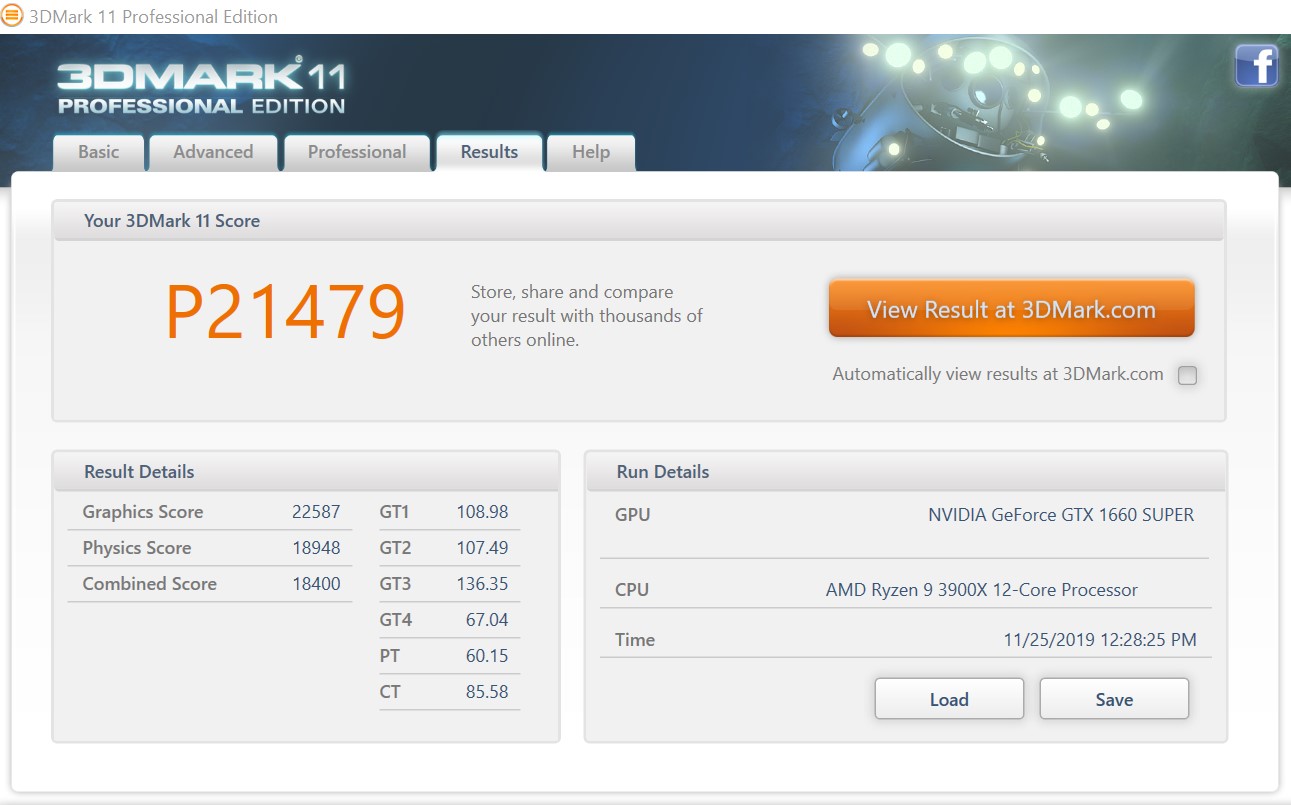
| 3DMark 11 Performance | 20610 poäng | |
| 3DMark Ice Storm Standard Score | 195904 poäng | |
| 3DMark Cloud Gate Standard Score | 48162 poäng | |
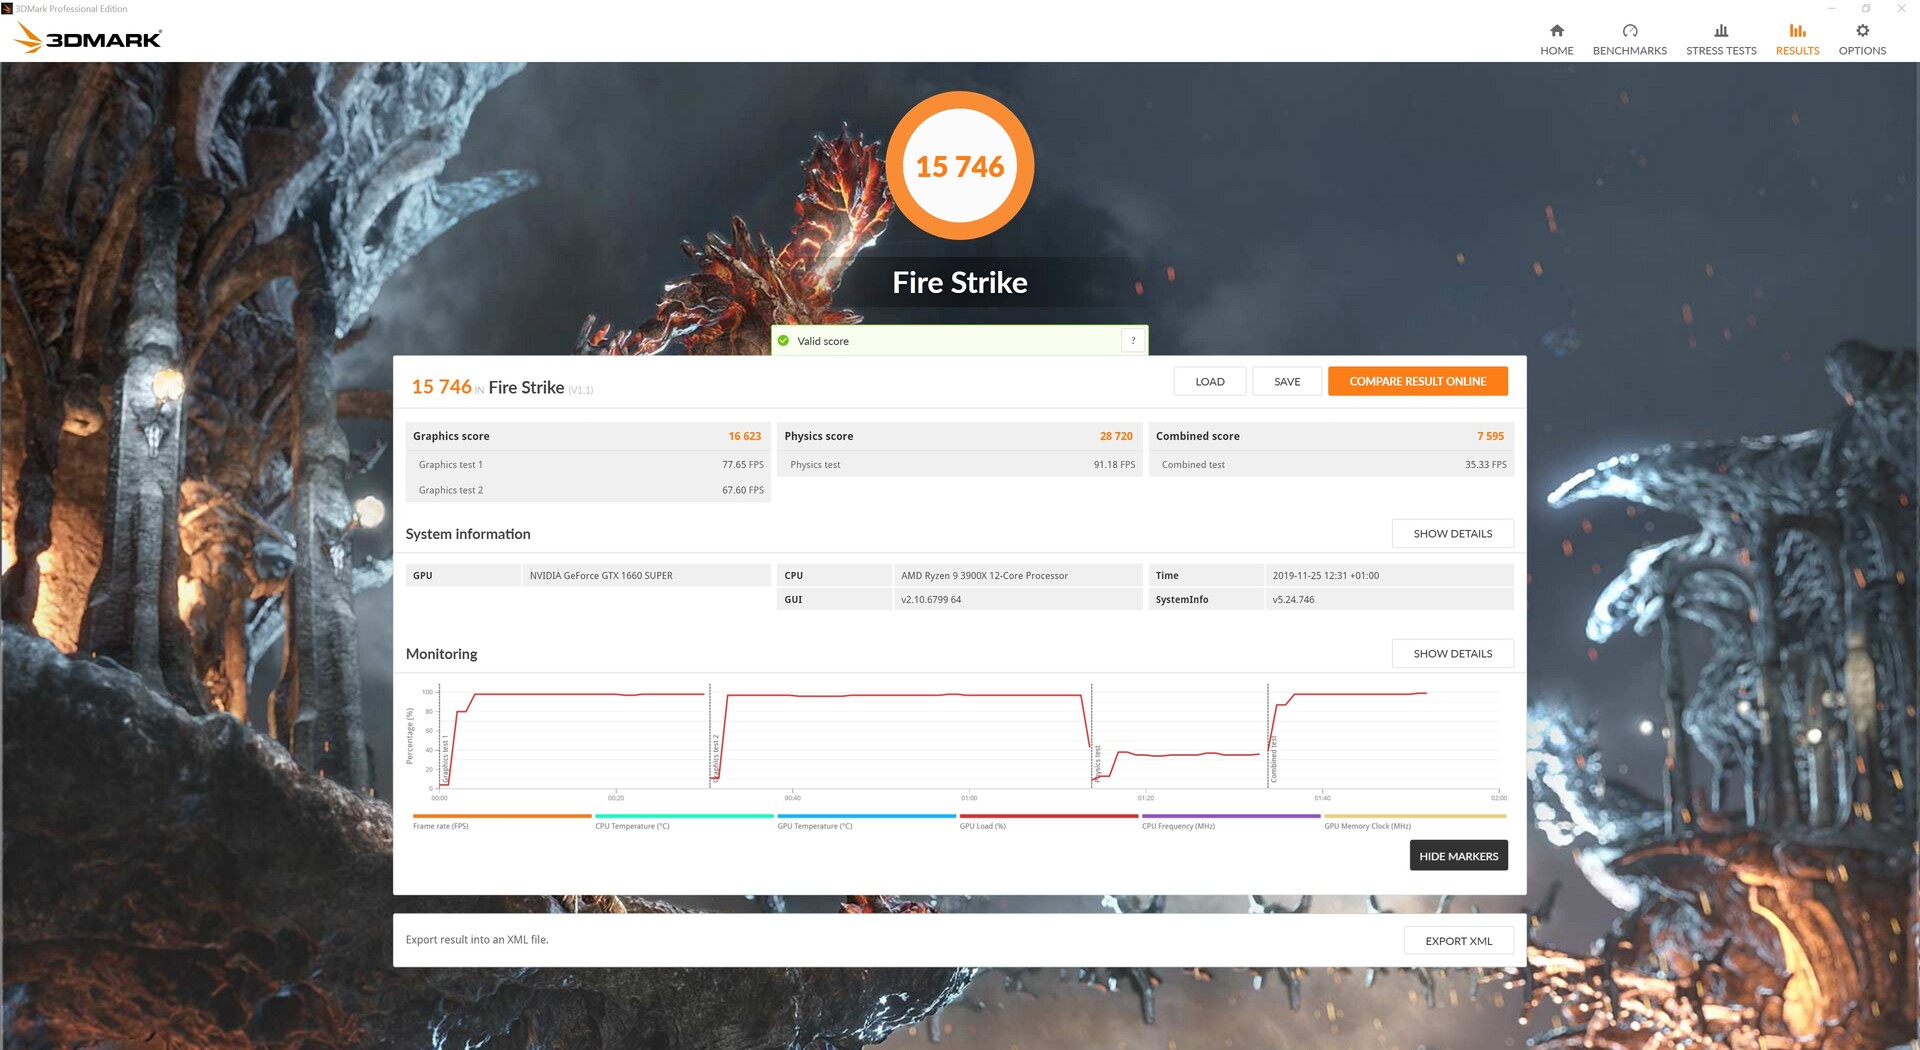
| 3DMark Fire Strike Score | 14656 poäng | |
| 3DMark Fire Strike Extreme Score | 6980 poäng | |
| 3DMark Time Spy Score | 6508 poäng | |
Hjälp | ||
The Witcher 3: Bilduppdatering – Ultra-inställningar
| Forza Horizon 4 - 1920x1080 Ultra Preset AA:2xMS | |
| AMD Radeon RX 5700 XT | |
| AMD Radeon RX 5700 XT | |
| AMD Radeon RX 5700 | |
| Nvidia GeForce RTX 2060 Super | |
| KFA 2 GeForce GTX 1660 Super | |
| PNY GeForce GTX 1660 | |
| Zotac GeForce GTX 1660 Ti 6 GB | |
| XFX AMD Radeon RX 590 OC+ 8 GB | |
| Sapphire NITRO+ RX 570 8 GB | |
| Gainward GeForce GTX 1650 4 GB | |
| Far Cry 5 - 1920x1080 Ultra Preset AA:T | |
| AMD Radeon RX 5700 XT | |
| Nvidia GeForce RTX 2060 Super | |
| AMD Radeon RX 5700 XT | |
| KFA 2 GeForce GTX 1660 Super | |
| Zotac GeForce GTX 1660 Ti 6 GB | |
| AMD Radeon RX 5700 | |
| PNY GeForce GTX 1660 | |
| XFX AMD Radeon RX 590 OC+ 8 GB | |
| Sapphire NITRO+ RX 570 8 GB | |
| Gainward GeForce GTX 1650 4 GB | |
| The Witcher 3 - 1920x1080 Ultra Graphics & Postprocessing (HBAO+) | |
| AMD Radeon RX 5700 XT | |
| AMD Radeon RX 5700 XT | |
| AMD Radeon RX 5700 | |
| Nvidia GeForce RTX 2060 Super | |
| Zotac GeForce GTX 1660 Ti 6 GB | |
| KFA 2 GeForce GTX 1660 Super | |
| PNY GeForce GTX 1660 | |
| XFX AMD Radeon RX 590 OC+ 8 GB | |
| Gainward GeForce GTX 1650 4 GB | |
| Sapphire NITRO+ RX 570 8 GB | |
| Farming Simulator 19 - 1920x1080 Very High Preset | |
| KFA 2 GeForce GTX 1660 Super | |
| Zotac GeForce GTX 1660 Ti 6 GB | |
| Nvidia GeForce RTX 2060 Super | |
| AMD Radeon RX 5700 XT | |
| PNY GeForce GTX 1660 | |
| AMD Radeon RX 5700 | |
| Gainward GeForce GTX 1650 4 GB | |
| XFX AMD Radeon RX 590 OC+ 8 GB | |
| Sapphire NITRO+ RX 570 8 GB | |
| Darksiders III - 1920x1080 Epic | |
| AMD Radeon RX 5700 XT | |
| Nvidia GeForce RTX 2060 Super | |
| AMD Radeon RX 5700 | |
| Zotac GeForce GTX 1660 Ti 6 GB | |
| KFA 2 GeForce GTX 1660 Super | |
| Sapphire NITRO+ RX 570 8 GB | |
| PNY GeForce GTX 1660 | |
| XFX AMD Radeon RX 590 OC+ 8 GB | |
| Gainward GeForce GTX 1650 4 GB | |
| Apex Legends - 1920x1080 Maximum Settings AA:TS AF:16x | |
| Nvidia GeForce RTX 2060 Super | |
| AMD Radeon RX 5700 XT | |
| AMD Radeon RX 5700 | |
| KFA 2 GeForce GTX 1660 Super | |
| Zotac GeForce GTX 1660 Ti 6 GB | |
| PNY GeForce GTX 1660 | |
| XFX AMD Radeon RX 590 OC+ 8 GB | |
| Sapphire NITRO+ RX 570 8 GB | |
| Gainward GeForce GTX 1650 4 GB | |
| Far Cry New Dawn - 1920x1080 Ultra Preset | |
| AMD Radeon RX 5700 XT | |
| KFA 2 GeForce GTX 1660 Super | |
| Nvidia GeForce RTX 2060 Super | |
| Zotac GeForce GTX 1660 Ti 6 GB | |
| AMD Radeon RX 5700 | |
| PNY GeForce GTX 1660 | |
| AMD Radeon RX 5700 XT | |
| XFX AMD Radeon RX 590 OC+ 8 GB | |
| Sapphire NITRO+ RX 570 8 GB | |
| Gainward GeForce GTX 1650 4 GB | |
| Metro Exodus - 1920x1080 Ultra Quality AF:16x | |
| AMD Radeon RX 5700 XT | |
| Nvidia GeForce RTX 2060 Super | |
| AMD Radeon RX 5700 | |
| Zotac GeForce GTX 1660 Ti 6 GB | |
| KFA 2 GeForce GTX 1660 Super | |
| PNY GeForce GTX 1660 | |
| XFX AMD Radeon RX 590 OC+ 8 GB | |
| Sapphire NITRO+ RX 570 8 GB | |
| Gainward GeForce GTX 1650 4 GB | |
| The Division 2 - 1920x1080 Ultra Preset | |
| AMD Radeon RX 5700 XT | |
| Nvidia GeForce RTX 2060 Super | |
| AMD Radeon RX 5700 | |
| Zotac GeForce GTX 1660 Ti 6 GB | |
| KFA 2 GeForce GTX 1660 Super | |
| XFX AMD Radeon RX 590 OC+ 8 GB | |
| PNY GeForce GTX 1660 | |
| Sapphire NITRO+ RX 570 8 GB | |
| Gainward GeForce GTX 1650 4 GB | |
| Anno 1800 - 1920x1080 Ultra Graphics Quality (DX11) | |
| AMD Radeon RX 5700 XT | |
| AMD Radeon RX 5700 XT | |
| KFA 2 GeForce GTX 1660 Super | |
| Nvidia GeForce RTX 2060 Super | |
| AMD Radeon RX 5700 | |
| Zotac GeForce GTX 1660 Ti 6 GB | |
| PNY GeForce GTX 1660 | |
| Gainward GeForce GTX 1650 4 GB | |
| Sapphire NITRO+ RX 570 8 GB | |
| XFX AMD Radeon RX 590 OC+ 8 GB | |
| Rage 2 - 1920x1080 Ultra Preset (Resolution Scale Off) | |
| Nvidia GeForce RTX 2060 Super | |
| AMD Radeon RX 5700 XT | |
| KFA 2 GeForce GTX 1660 Super | |
| XFX AMD Radeon RX 590 OC+ 8 GB | |
| PNY GeForce GTX 1660 | |
| Sapphire NITRO+ RX 570 8 GB | |
| Gainward GeForce GTX 1650 4 GB | |
| F1 2019 - 1920x1080 Ultra High Preset AA:T AF:16x | |
| AMD Radeon RX 5700 XT | |
| AMD Radeon RX 5700 XT | |
| AMD Radeon RX 5700 | |
| Nvidia GeForce RTX 2060 Super | |
| KFA 2 GeForce GTX 1660 Super | |
| XFX AMD Radeon RX 590 OC+ 8 GB | |
| PNY GeForce GTX 1660 | |
| Sapphire NITRO+ RX 570 8 GB | |
| Gainward GeForce GTX 1650 4 GB | |
| Rocket League - 1920x1080 High Quality AA:High FX | |
| Nvidia GeForce RTX 2060 Super | |
| AMD Radeon RX 5700 XT | |
| XFX AMD Radeon RX 590 OC+ 8 GB | |
| KFA 2 GeForce GTX 1660 Super | |
| AMD Radeon RX 5700 | |
| PNY GeForce GTX 1660 | |
| X-Plane 11.11 - 1920x1080 high (fps_test=3) | |
| KFA 2 GeForce GTX 1660 Super | |
| PNY GeForce GTX 1660 | |
| Nvidia GeForce RTX 2060 Super | |
| AMD Radeon RX 5700 XT | |
| AMD Radeon RX 5700 XT | |
| AMD Radeon RX 5700 | |
| Shadow of the Tomb Raider - 1920x1080 Highest Preset AA:T | |
| AMD Radeon RX 5700 XT | |
| AMD Radeon RX 5700 XT | |
| Nvidia GeForce RTX 2060 Super | |
| AMD Radeon RX 5700 | |
| KFA 2 GeForce GTX 1660 Super | |
| Zotac GeForce GTX 1660 Ti 6 GB | |
| PNY GeForce GTX 1660 | |
| XFX AMD Radeon RX 590 OC+ 8 GB | |
| Sapphire NITRO+ RX 570 8 GB | |
| Gainward GeForce GTX 1650 4 GB | |
| FIFA 20 - 1920x1080 Ultra Preset AA:4xMS | |
| AMD Radeon RX 5700 | |
| AMD Radeon RX 5700 XT | |
| XFX AMD Radeon RX 590 OC+ 8 GB | |
| Nvidia GeForce RTX 2060 Super | |
| PNY GeForce GTX 1660 | |
| KFA 2 GeForce GTX 1660 Super | |
| Sapphire NITRO+ RX 570 8 GB | |
| Gainward GeForce GTX 1650 4 GB | |
| Control - 1920x1080 High Quality Preset | |
| AMD Radeon RX 5700 XT | |
| Nvidia GeForce RTX 2060 Super | |
| AMD Radeon RX 5700 | |
| KFA 2 GeForce GTX 1660 Super | |
| PNY GeForce GTX 1660 | |
| XFX AMD Radeon RX 590 OC+ 8 GB | |
| Sapphire NITRO+ RX 570 8 GB | |
| Gainward GeForce GTX 1650 4 GB | |
| Borderlands 3 - 1920x1080 Badass Overall Quality (DX11) | |
| AMD Radeon RX 5700 XT | |
| Nvidia GeForce RTX 2060 Super | |
| AMD Radeon RX 5700 | |
| KFA 2 GeForce GTX 1660 Super | |
| PNY GeForce GTX 1660 | |
| XFX AMD Radeon RX 590 OC+ 8 GB | |
| Sapphire NITRO+ RX 570 8 GB | |
| Gainward GeForce GTX 1650 4 GB | |
| Ghost Recon Breakpoint - 1920x1080 Ultra Preset AA:T | |
| AMD Radeon RX 5700 XT | |
| Nvidia GeForce RTX 2060 Super | |
| AMD Radeon RX 5700 | |
| KFA 2 GeForce GTX 1660 Super | |
| PNY GeForce GTX 1660 | |
| XFX AMD Radeon RX 590 OC+ 8 GB | |
| Sapphire NITRO+ RX 570 8 GB | |
| Gainward GeForce GTX 1650 4 GB | |
| GRID 2019 - 1920x1080 Ultra High Preset | |
| AMD Radeon RX 5700 XT | |
| AMD Radeon RX 5700 | |
| Nvidia GeForce RTX 2060 Super | |
| KFA 2 GeForce GTX 1660 Super | |
| PNY GeForce GTX 1660 | |
| XFX AMD Radeon RX 590 OC+ 8 GB | |
| Sapphire NITRO+ RX 570 8 GB | |
| Gainward GeForce GTX 1650 4 GB | |
| Call of Duty Modern Warfare 2019 - 1920x1080 Maximum Settings AA:T2X Filmic SM | |
| AMD Radeon RX 5700 XT | |
| Nvidia GeForce RTX 2060 Super | |
| AMD Radeon RX 5700 | |
| KFA 2 GeForce GTX 1660 Super | |
| PNY GeForce GTX 1660 | |
| XFX AMD Radeon RX 590 OC+ 8 GB | |
| Sapphire NITRO+ RX 570 8 GB | |
| Gainward GeForce GTX 1650 4 GB | |
| Need for Speed Heat - 1920x1080 Ultra Preset | |
| Nvidia GeForce RTX 2060 Super | |
| AMD Radeon RX 5700 XT | |
| AMD Radeon RX 5700 | |
| KFA 2 GeForce GTX 1660 Super | |
| PNY GeForce GTX 1660 | |
| XFX AMD Radeon RX 590 OC+ 8 GB | |
| Gainward GeForce GTX 1650 4 GB | |
| Star Wars Jedi Fallen Order - 1920x1080 Epic Preset | |
| Nvidia GeForce RTX 2060 Super | |
| AMD Radeon RX 5700 XT | |
| AMD Radeon RX 5700 | |
| PNY GeForce GTX 1660 | |
| XFX AMD Radeon RX 590 OC+ 8 GB | |
| KFA 2 GeForce GTX 1660 Super | |
| Gainward GeForce GTX 1650 4 GB | |
| låg | med. | hög | ultra | QHD | 4K | |
|---|---|---|---|---|---|---|
| BioShock Infinite (2013) | 440 | 362 | 329 | 151 | ||
| GTA V (2015) | 183 | 176 | 156 | 80 | 63 | |
| The Witcher 3 (2015) | 294 | 193 | 109 | 59.5 | 40 | |
| Dota 2 Reborn (2015) | 161.3 | 147 | 146.6 | 140 | 91.7 | |
| Rise of the Tomb Raider (2016) | 295 | 199 | 111 | 86 | 37 | |
| Far Cry Primal (2016) | 129 | 115 | 106 | 86 | 40 | |
| For Honor (2017) | 317 | 139 | 133 | 102 | 42 | |
| Ghost Recon Wildlands (2017) | 170 | 91 | 85 | 49 | 32 | |
| Rocket League (2017) | 250 | 249 | 217 | 162 | 101 | |
| Playerunknown's Battlegrounds (PUBG) (2017) | 244 | 139 | 104 | 35.8 | ||
| Assassin´s Creed Origins (2017) | 136 | 90 | 83 | 69 | 54 | 33 |
| X-Plane 11.11 (2018) | 130 | 116 | 94 | 80 | ||
| Far Cry 5 (2018) | 149 | 105 | 98 | 92 | 64 | 33 |
| Monster Hunter World (2018) | 172 | 99 | 90 | 66 | 41.4 | 20.1 |
| Strange Brigade (2018) | 375 | 157 | 123 | 104 | 75.7 | 43.1 |
| Shadow of the Tomb Raider (2018) | 149 | 100 | 89 | 80 | 53 | 26 |
| Forza Horizon 4 (2018) | 211 | 144 | 135 | 107 | 84 | 54 |
| Assassin´s Creed Odyssey (2018) | 120 | 88 | 73 | 51 | 40 | 24 |
| Hitman 2 (2018) | 99 | 92 | 84 | 79 | 56.4 | 28.8 |
| Battlefield V (2018) | 154 | 97 | 83 | 77 | 60 | 36.4 |
| Farming Simulator 19 (2018) | 237 | 176 | 154 | 123 | 88 | 47.5 |
| Darksiders III (2018) | 232 | 128 | 104 | 93 | 60 | 21.8 |
| Just Cause 4 (2018) | 164 | 121 | 88 | 84 | 57 | 30.6 |
| Apex Legends (2019) | 144 | 144 | 116 | 120 | 82 | 43.5 |
| Far Cry New Dawn (2019) | 135 | 102 | 96 | 87 | 65 | 35 |
| Metro Exodus (2019) | 128 | 68 | 50 | 41 | 32 | 21 |
| Anthem (2019) | 131 | 97 | 84 | 79 | 55.5 | 27 |
| Dirt Rally 2.0 (2019) | 311 | 158 | 132 | 73 | 54.5 | 31.4 |
| The Division 2 (2019) | 193 | 113 | 88 | 63 | 43 | 23 |
| Anno 1800 (2019) | 103 | 106 | 78 | 40.6 | 28.6 | 16.9 |
| Rage 2 (2019) | 212 | 103 | 86 | 83 | 50.1 | 23.9 |
| Total War: Three Kingdoms (2019) | 236 | 108.5 | 68.1 | 47.2 | 29.3 | 13.5 |
| F1 2019 (2019) | 263 | 152 | 132 | 87 | 68 | 41 |
| Control (2019) | 213 | 77 | 56.3 | 35.3 | 17 | |
| Borderlands 3 (2019) | 149 | 99 | 66 | 50 | 33 | 12 |
| FIFA 20 (2019) | 257 | 251 | 235 | 236 | 220 | 145 |
| Ghost Recon Breakpoint (2019) | 118 | 80 | 72 | 55 | 38 | 19 |
| GRID 2019 (2019) | 202 | 124 | 100 | 69 | 52.5 | 35 |
| Call of Duty Modern Warfare 2019 (2019) | 163 | 117 | 96 | 84 | 59.3 | 32.4 |
| Need for Speed Heat (2019) | 116 | 98 | 89 | 77 | 55.6 | 26.6 |
| Star Wars Jedi Fallen Order (2019) | 80 | 64 | 56.9 | 55.5 | 27.7 | |
| Red Dead Redemption 2 (2019) | 136 | 77 | 53.6 | 33.2 | 26.7 | |
| Escape from Tarkov (2020) | 121 | 114 | 121 | 92.7 | 54.6 | 27.7 |
| Hunt Showdown (2020) | 224 | 95.6 | 77 | 48.9 | 21.6 | |
| Doom Eternal (2020) | 265 | 143 | 126 | 122 | 73.4 | 34.4 |
| Gears Tactics (2020) | 324.4 | 162.1 | 104.8 | 72.2 | 46 | 24.1 |
| Valorant (2020) | 327.3 | 320.7 | 289.8 | 262.4 | 131.9 | |
| F1 2020 (2020) | 298 | 171 | 137 | 94.3 | 69.3 | 39 |
| Death Stranding (2020) | 147 | 93.8 | 86 | 84.3 | 58.5 | 31.5 |
| Horizon Zero Dawn (2020) | 138 | 88 | 73 | 57 | 44 | 24 |
| Flight Simulator 2020 (2020) | 85.5 | 55.1 | 40.2 | 27.3 | 19.7 | 11.9 |
| Serious Sam 4 (2020) | 144.1 | 88.1 | 71.3 | 53.6 | 41.9 | 25.6 |
| Mafia Definitive Edition (2020) | 142.2 | 78.8 | 72.5 | 48.2 | 24.5 | |
| Star Wars Squadrons (2020) | 400 | 220 | 193 | 176 | 116 | 64 |
| FIFA 21 (2020) | 220 | 217 | 208 | 206 | 196 | 139 |
| Watch Dogs Legion (2020) | 115 | 82.5 | 70.8 | 31.4 | 23.5 | 12.3 |
| Power Consumption | |
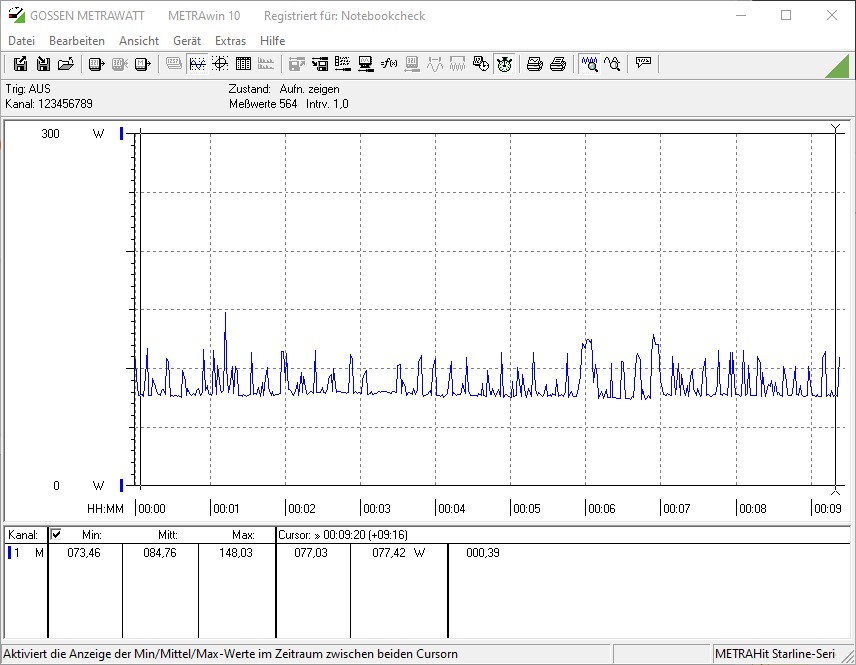
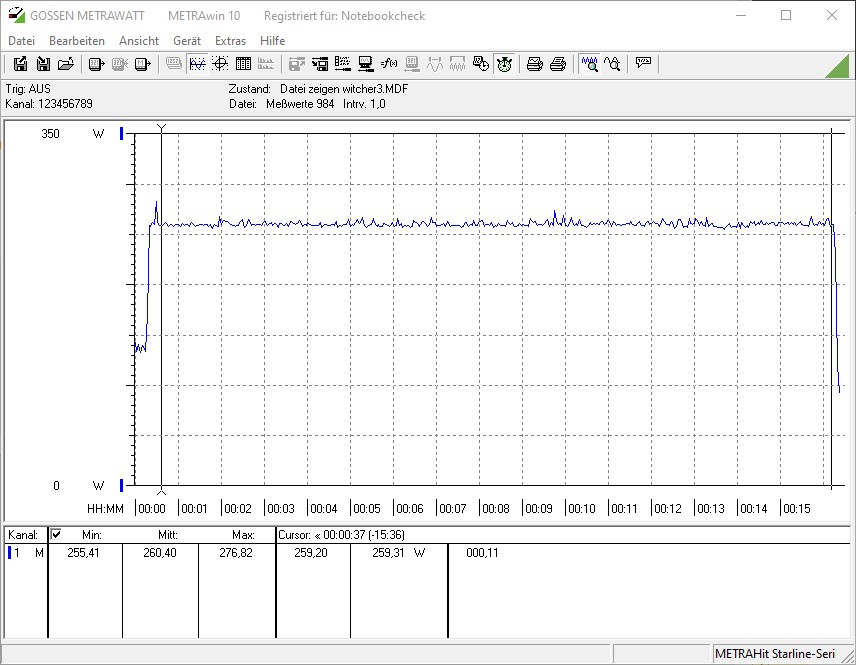
| 1920x1080 The Witcher 3 ultra (external Monitor) | |
| AMD Radeon RX 5700 XT (Idle: 83.2 W) | |
| XFX AMD Radeon RX 590 OC+ 8 GB (Idle: 85.9 W) | |
| AMD Radeon RX 5700 XT (Idle: 69.8 W) | |
| XFX AMD Radeon RX 590 OC+ 8 GB | |
| Nvidia GeForce RTX 2060 Super (Idle: 86.7 W) | |
| AMD Radeon RX 5700 (Idle: 77.9 W) | |
| Sapphire NITRO+ RX 570 8 GB (Idle: 85.5 W) | |
| Nvidia GeForce RTX 2060 Super (82.7 fps, Idle: 77.12 W) | |
| AMD Radeon RX 5700 (84.2 fps, Idle: 64.5 W) | |
| MSI RTX 2060 Gaming Z 6G (Idle: 74.66 W) | |
| Sapphire NITRO+ RX 570 8 GB (Idle: 72.61 W) | |
| KFA 2 GeForce GTX 1660 Super (Idle: 84.76 W) | |
| PNY GeForce GTX 1660 (Idle: 79.88 W) | |
| Zotac GeForce GTX 1660 Ti 6 GB (Idle: 68.3 W) | |
| Gainward GeForce GTX 1650 4 GB (Idle: 82.4 W) | |
| Gainward GeForce GTX 1650 4 GB (Idle: 64.63 W) | |
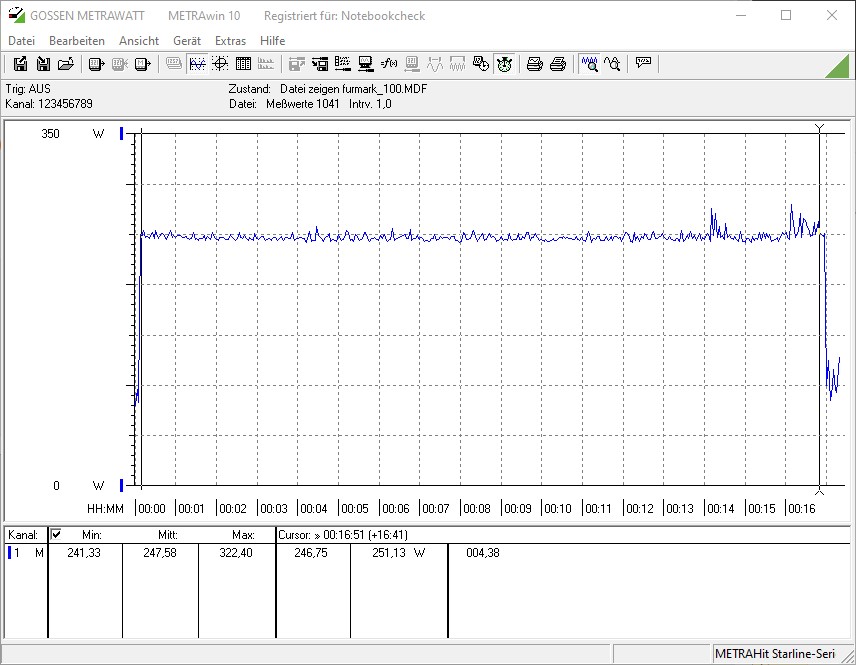
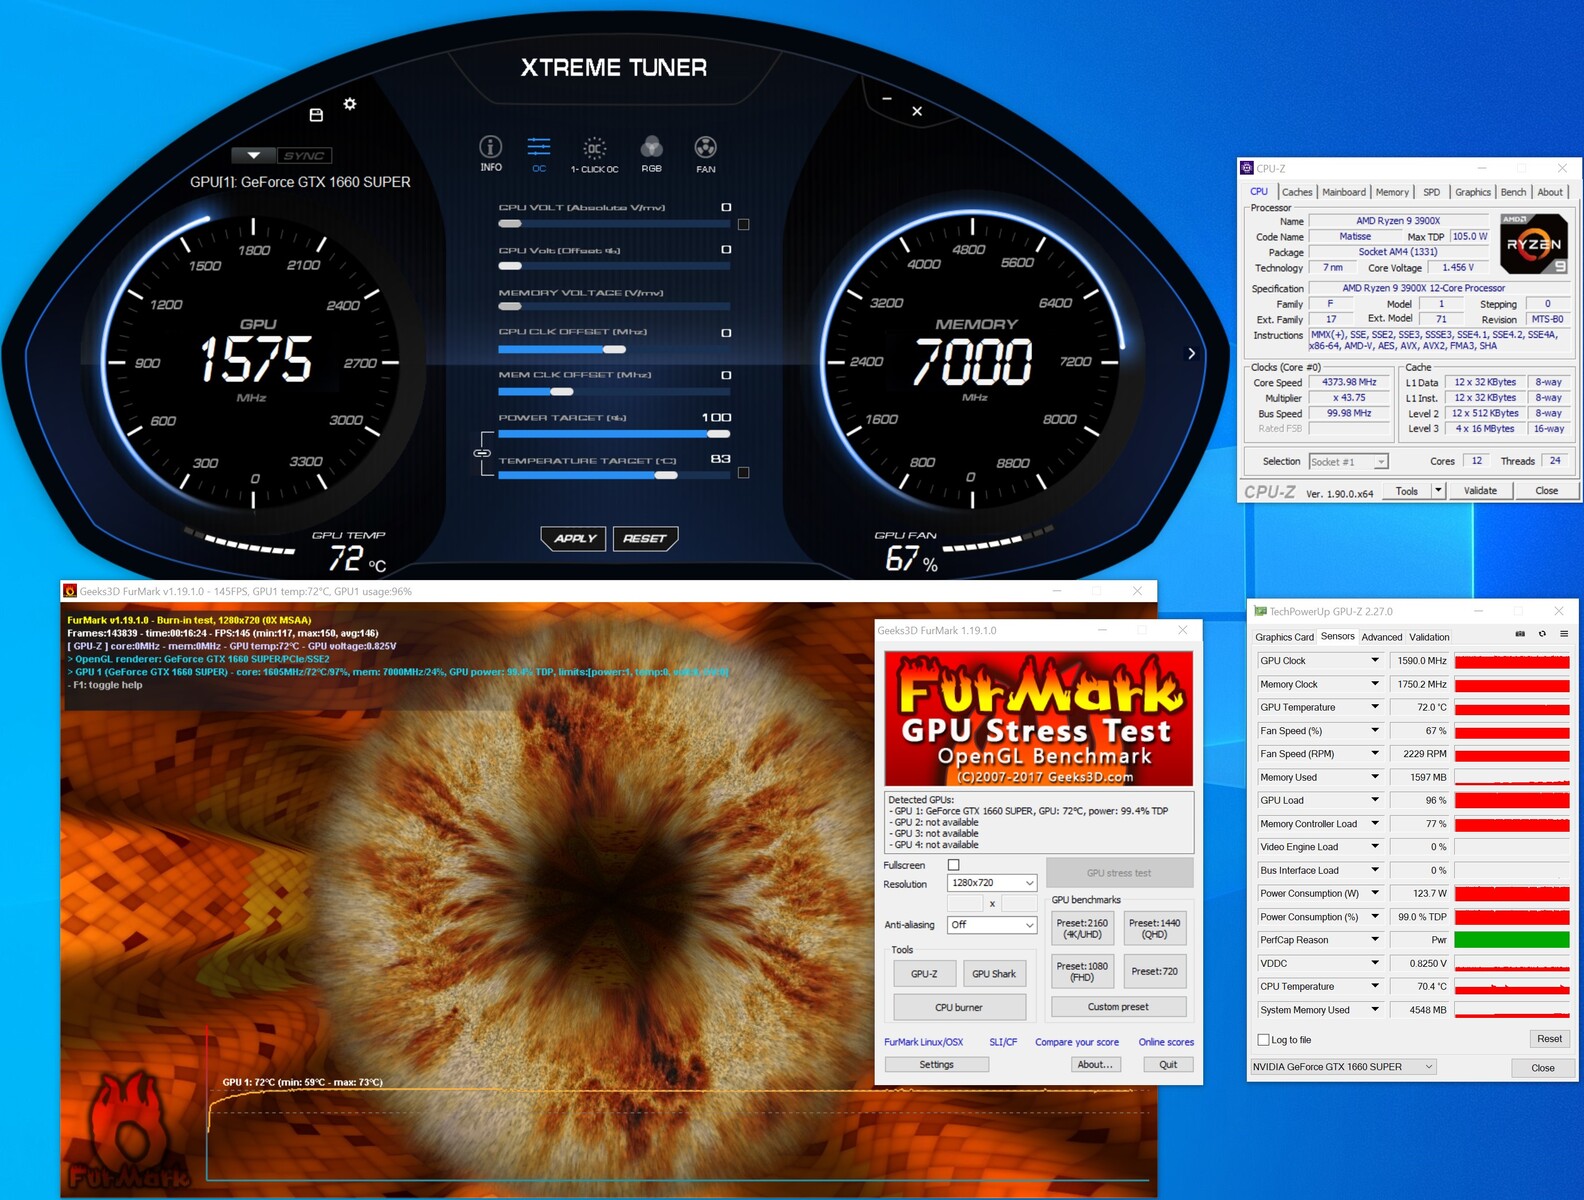
| 1280x720 FurMark 1.19 GPU Stress Test (external Monitor) | |
| XFX AMD Radeon RX 590 OC+ 8 GB (Idle: 85.9 W) | |
| XFX AMD Radeon RX 590 OC+ 8 GB | |
| AMD Radeon RX 5700 XT (Idle: 83.2 W) | |
| AMD Radeon RX 5700 XT (239 fps, Idle: 69.8 W) | |
| Sapphire NITRO+ RX 570 8 GB (Idle: 85.5 W) | |
| Nvidia GeForce RTX 2060 Super (Idle: 86.7 W) | |
| Sapphire NITRO+ RX 570 8 GB (Idle: 72.61 W) | |
| AMD Radeon RX 5700 (Idle: 77.9 W) | |
| MSI RTX 2060 Gaming Z 6G (Idle: 74.66 W) | |
| Nvidia GeForce RTX 2060 Super (237 fps, Idle: 77.12 W) | |
| AMD Radeon RX 5700 (207 fps, Idle: 64.5 W) | |
| PNY GeForce GTX 1660 (Idle: 79.88 W) | |
| KFA 2 GeForce GTX 1660 Super (Idle: 84.76 W) | |
| Zotac GeForce GTX 1660 Ti 6 GB (Idle: 68.3 W) | |
| Gainward GeForce GTX 1650 4 GB (Idle: 82.4 W) | |
| Gainward GeForce GTX 1650 4 GB (Idle: 64.63 W, Idle: 64.63 W) | |
* ... mindre är bättre
För
Emot
Läs den fullständiga versionen av den här recensionen på engelska här.
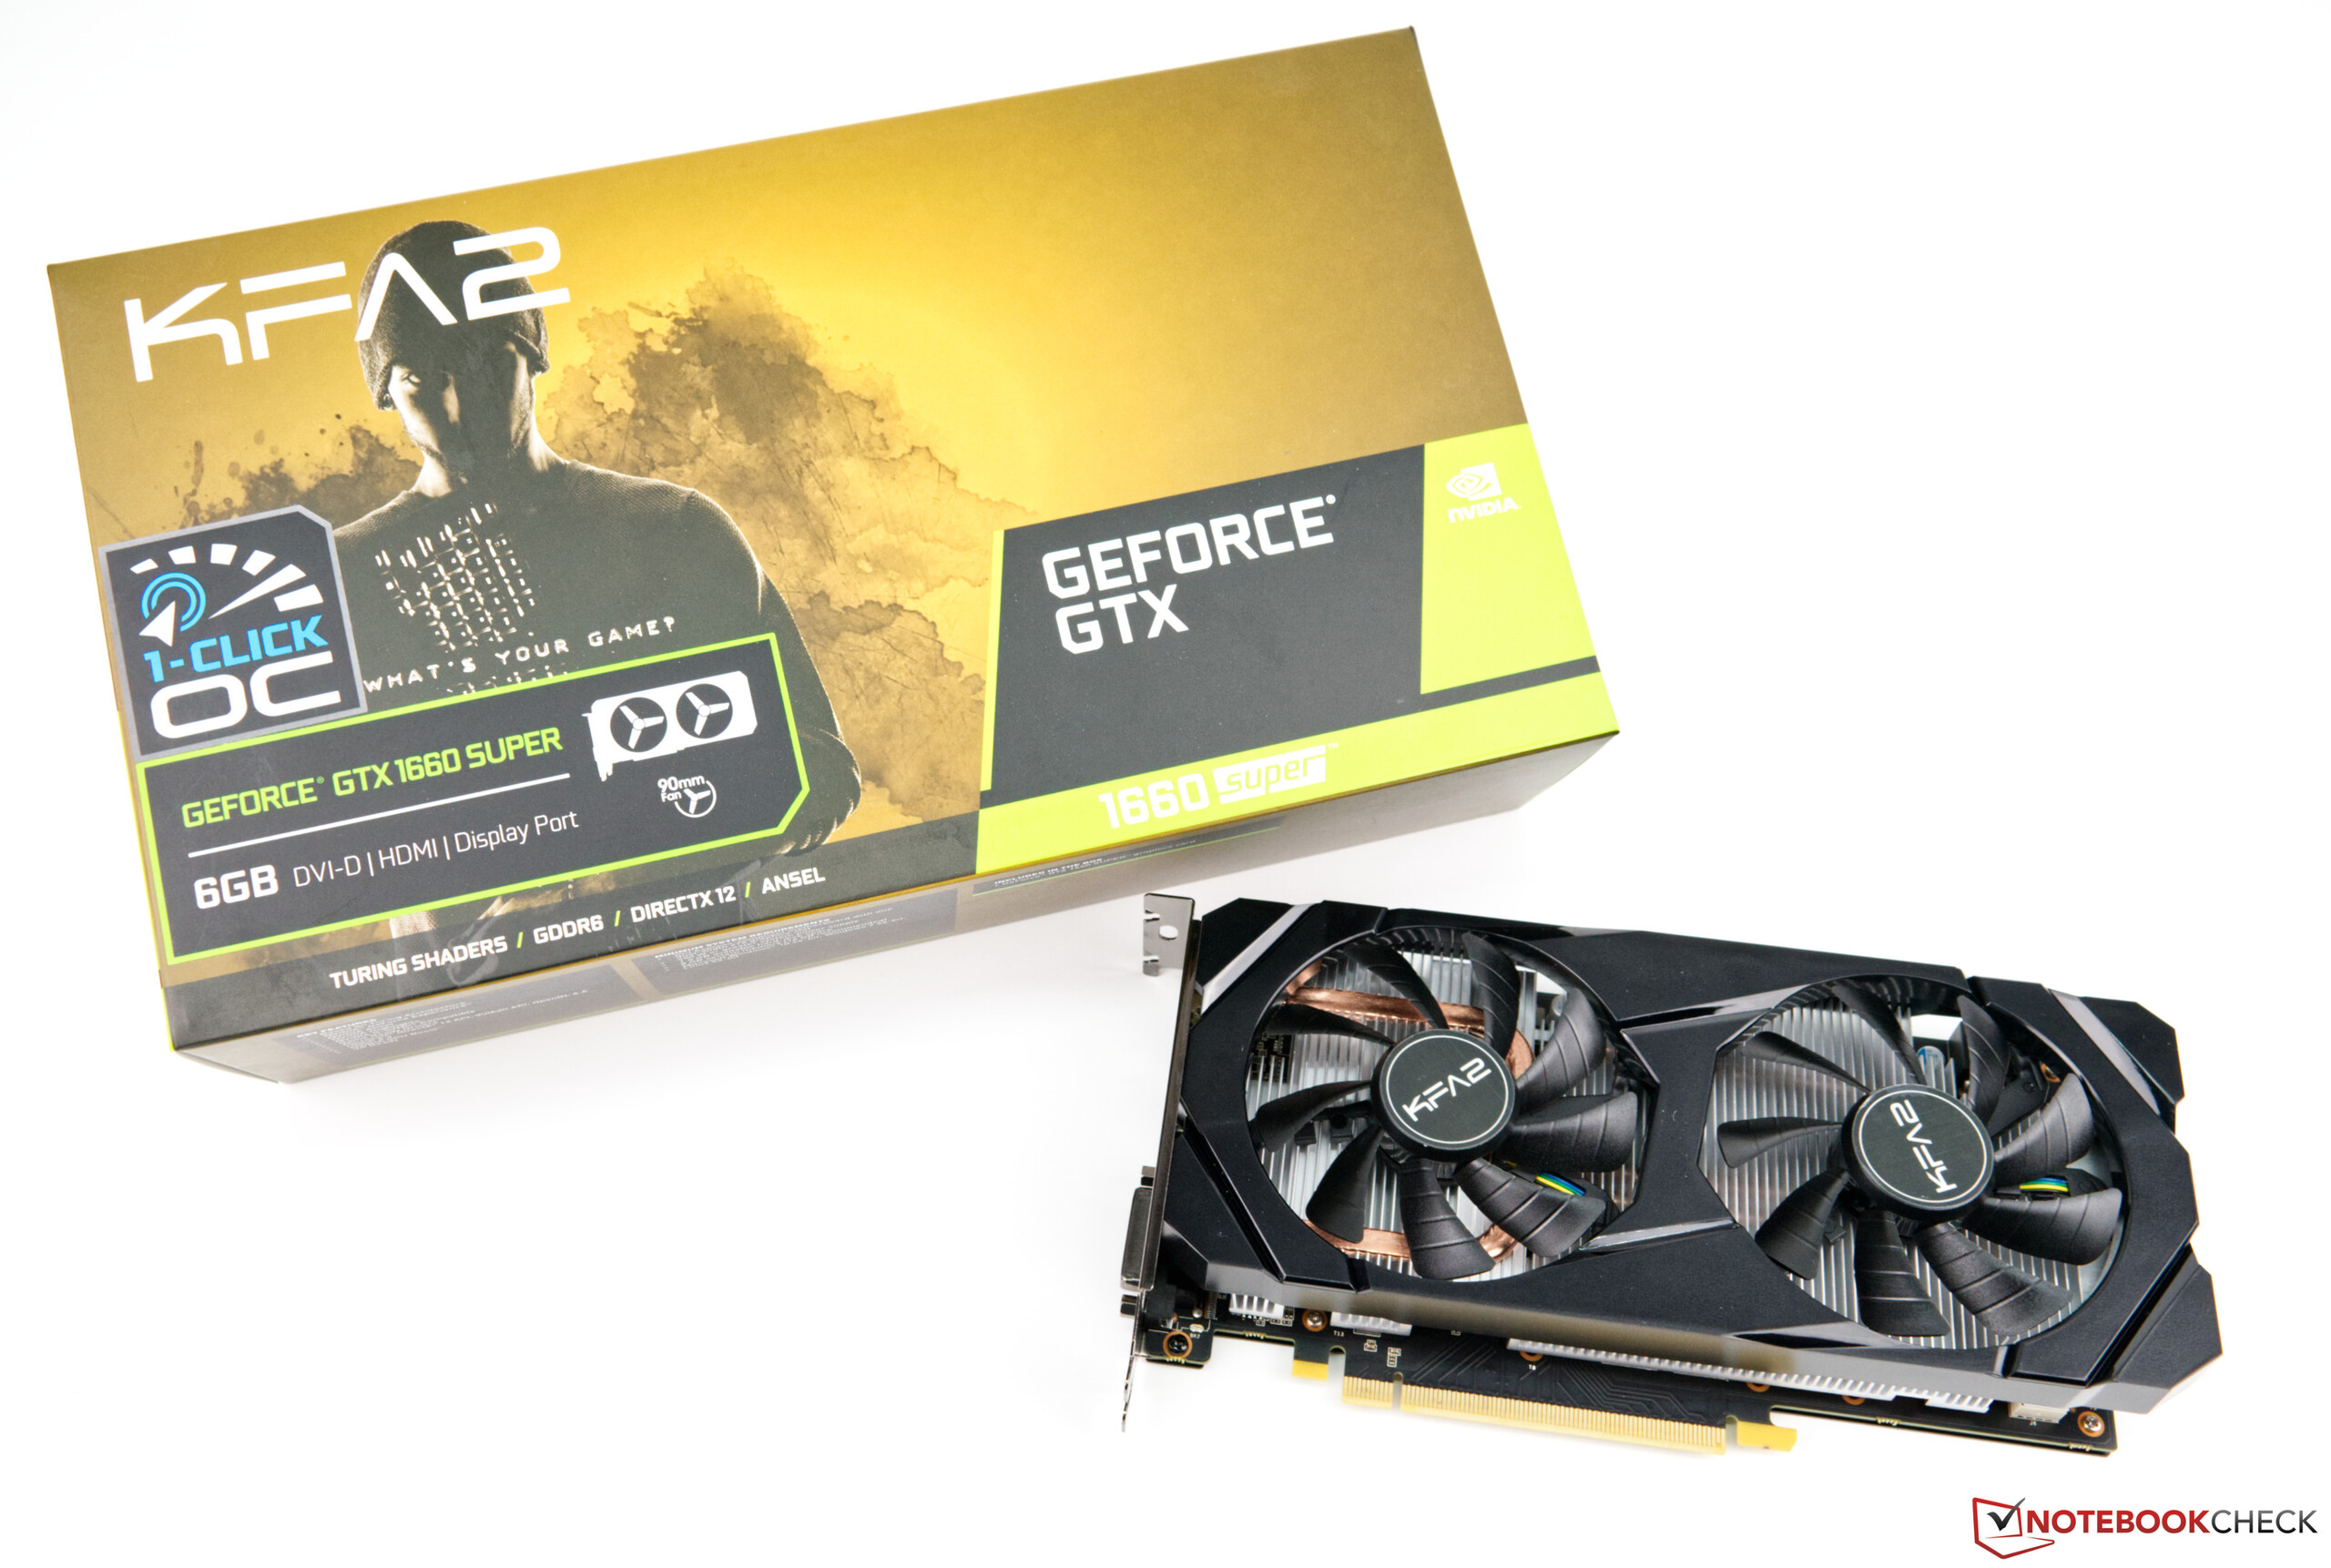
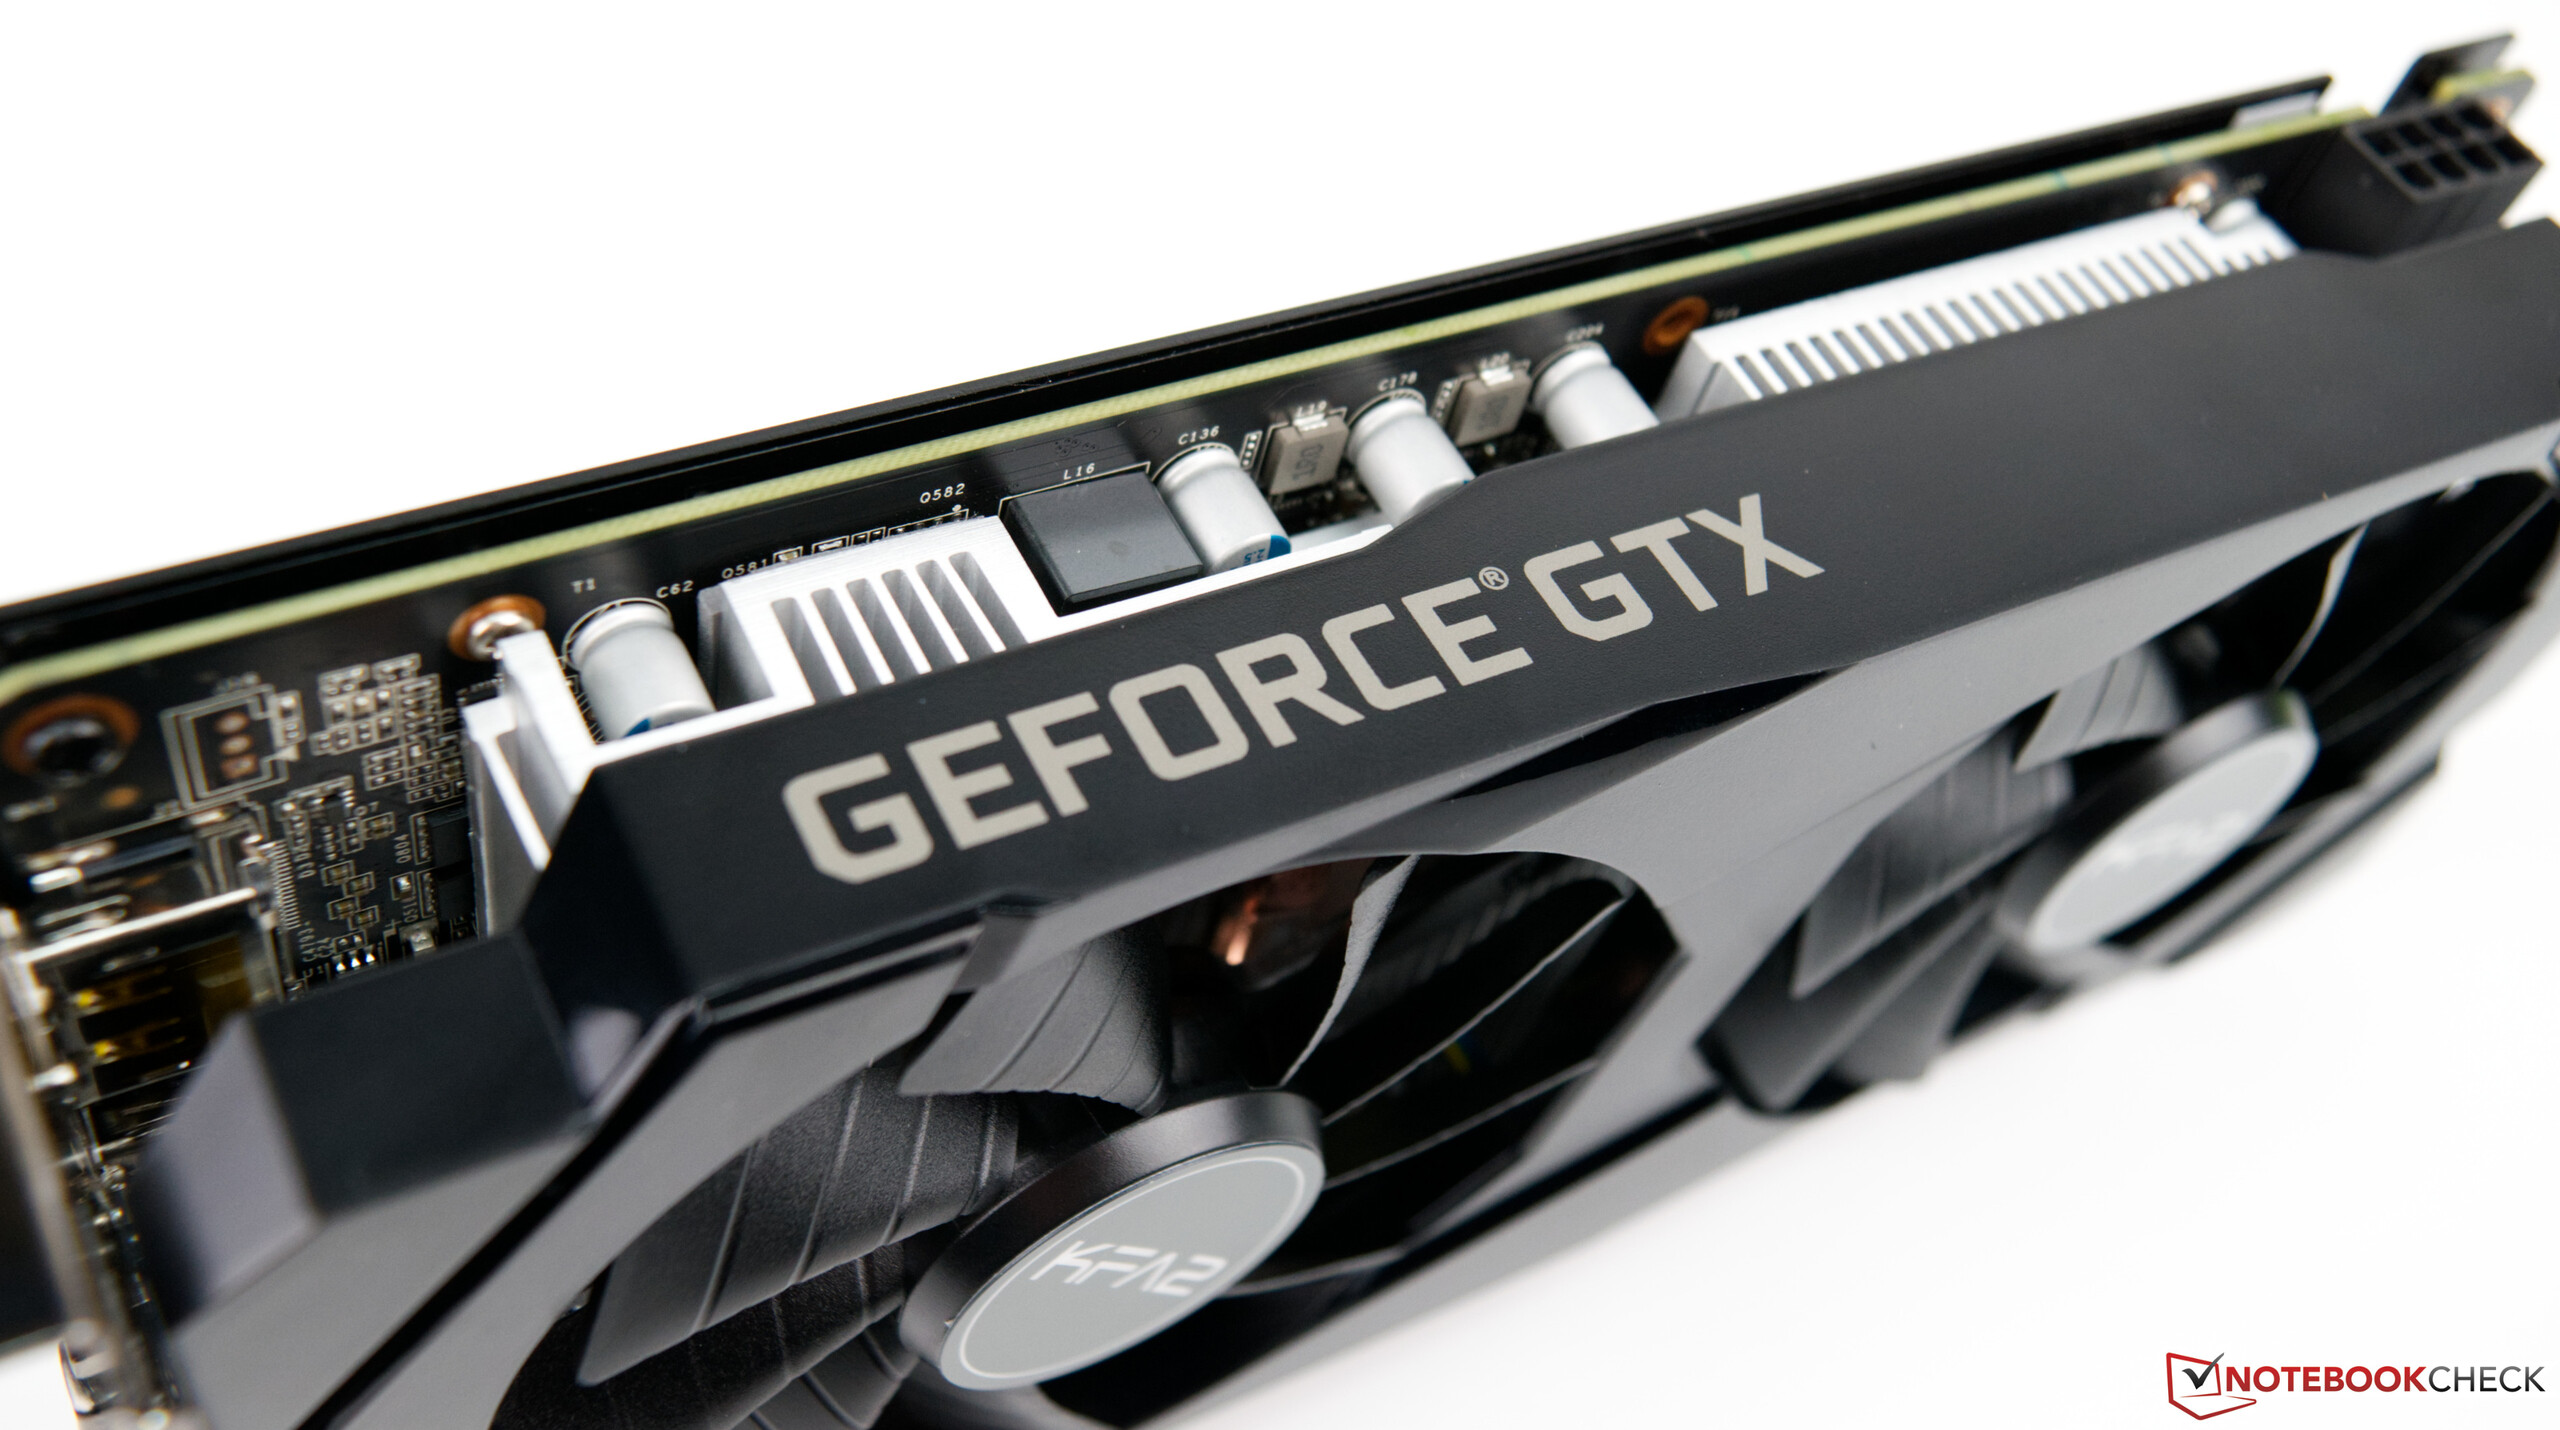
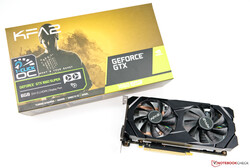
KFA2 GeForce GTX 1660 SUPER överbryggar gapet mellan 2.000 kronor och 2.500 kronor då det kostar 2.350 kronor. GTX 1660 SUPER är ett bra grafikkort som är tillräckligt kraftfullt för att kunna hantera moderna AAA-spel i minst 1080p. En del enklare titlar går till och med att spela i 4K.
Innan du köper är det bra att fundera på vilka spel du vill spela och huruvida du behöver något kraftigare. GTX 1660 SUPER saknar till exempel hästkrafterna GeForce GTX 1660 Ti har trots att det förstnämnda har ett 5W högre TDP-värde. I slutändan får du byta upp dig till RTX 20- eller RX 5700-serierna om du vill spela i högre upplösning.
KFA2 GeForce GTX 1660 SUPER imponerar och är en gedigen mittenskikts-GPU för desktop. Om du klarar dig utan överdåd kommer GTX 1660 SUPER passa dig väl.
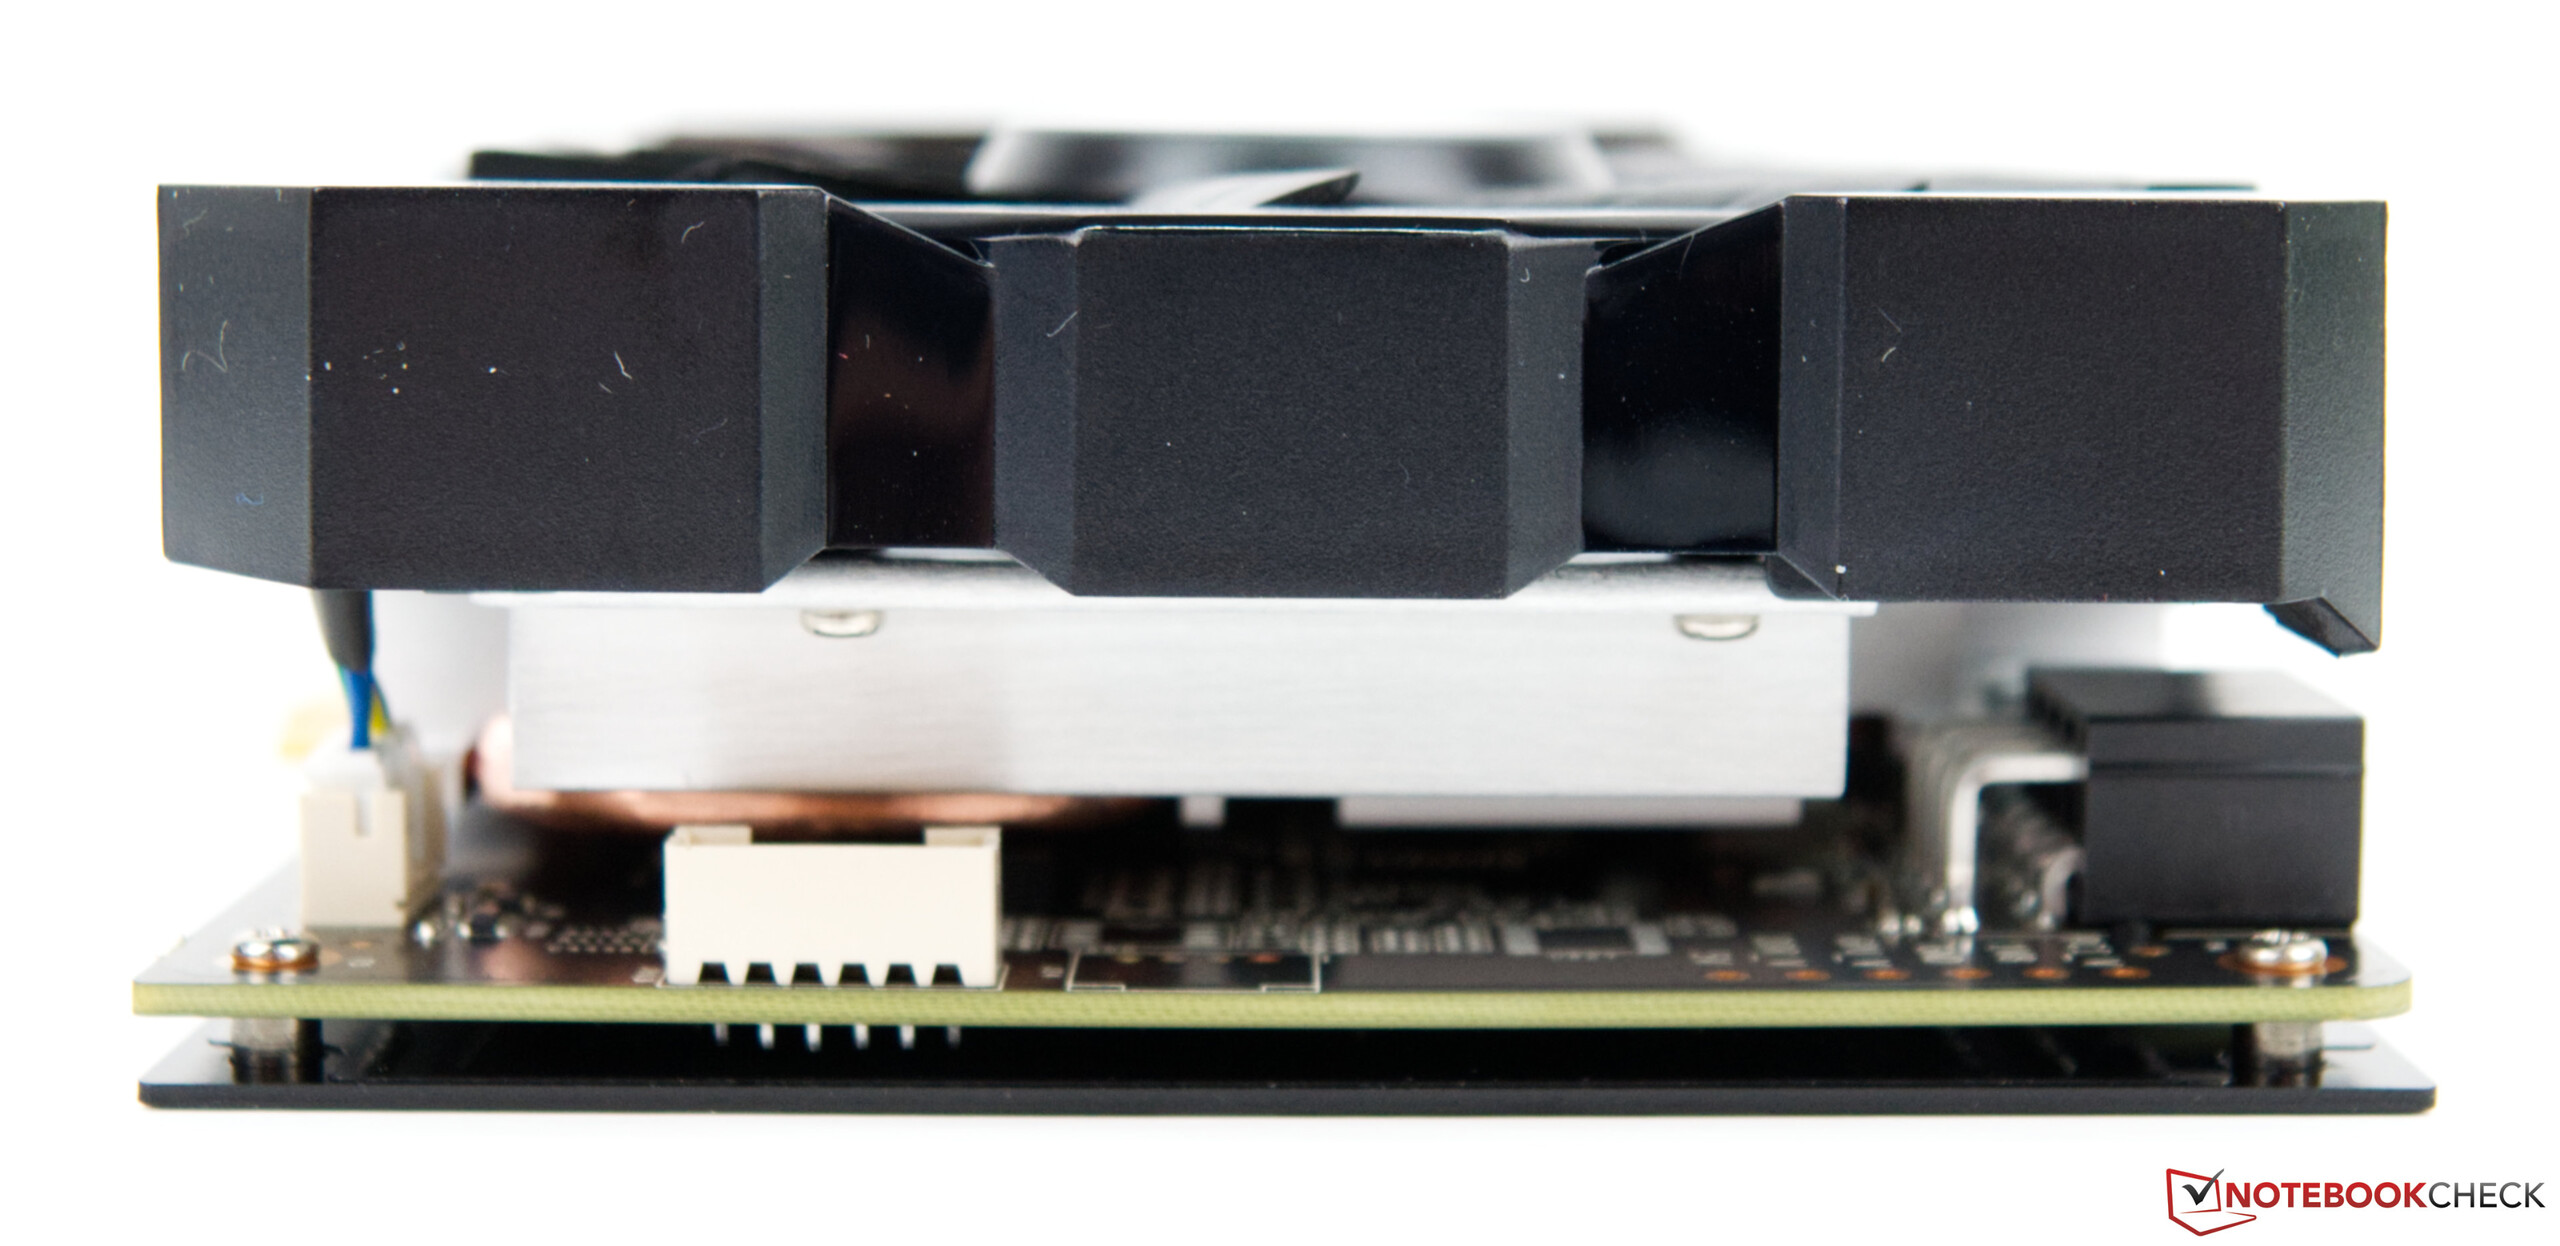
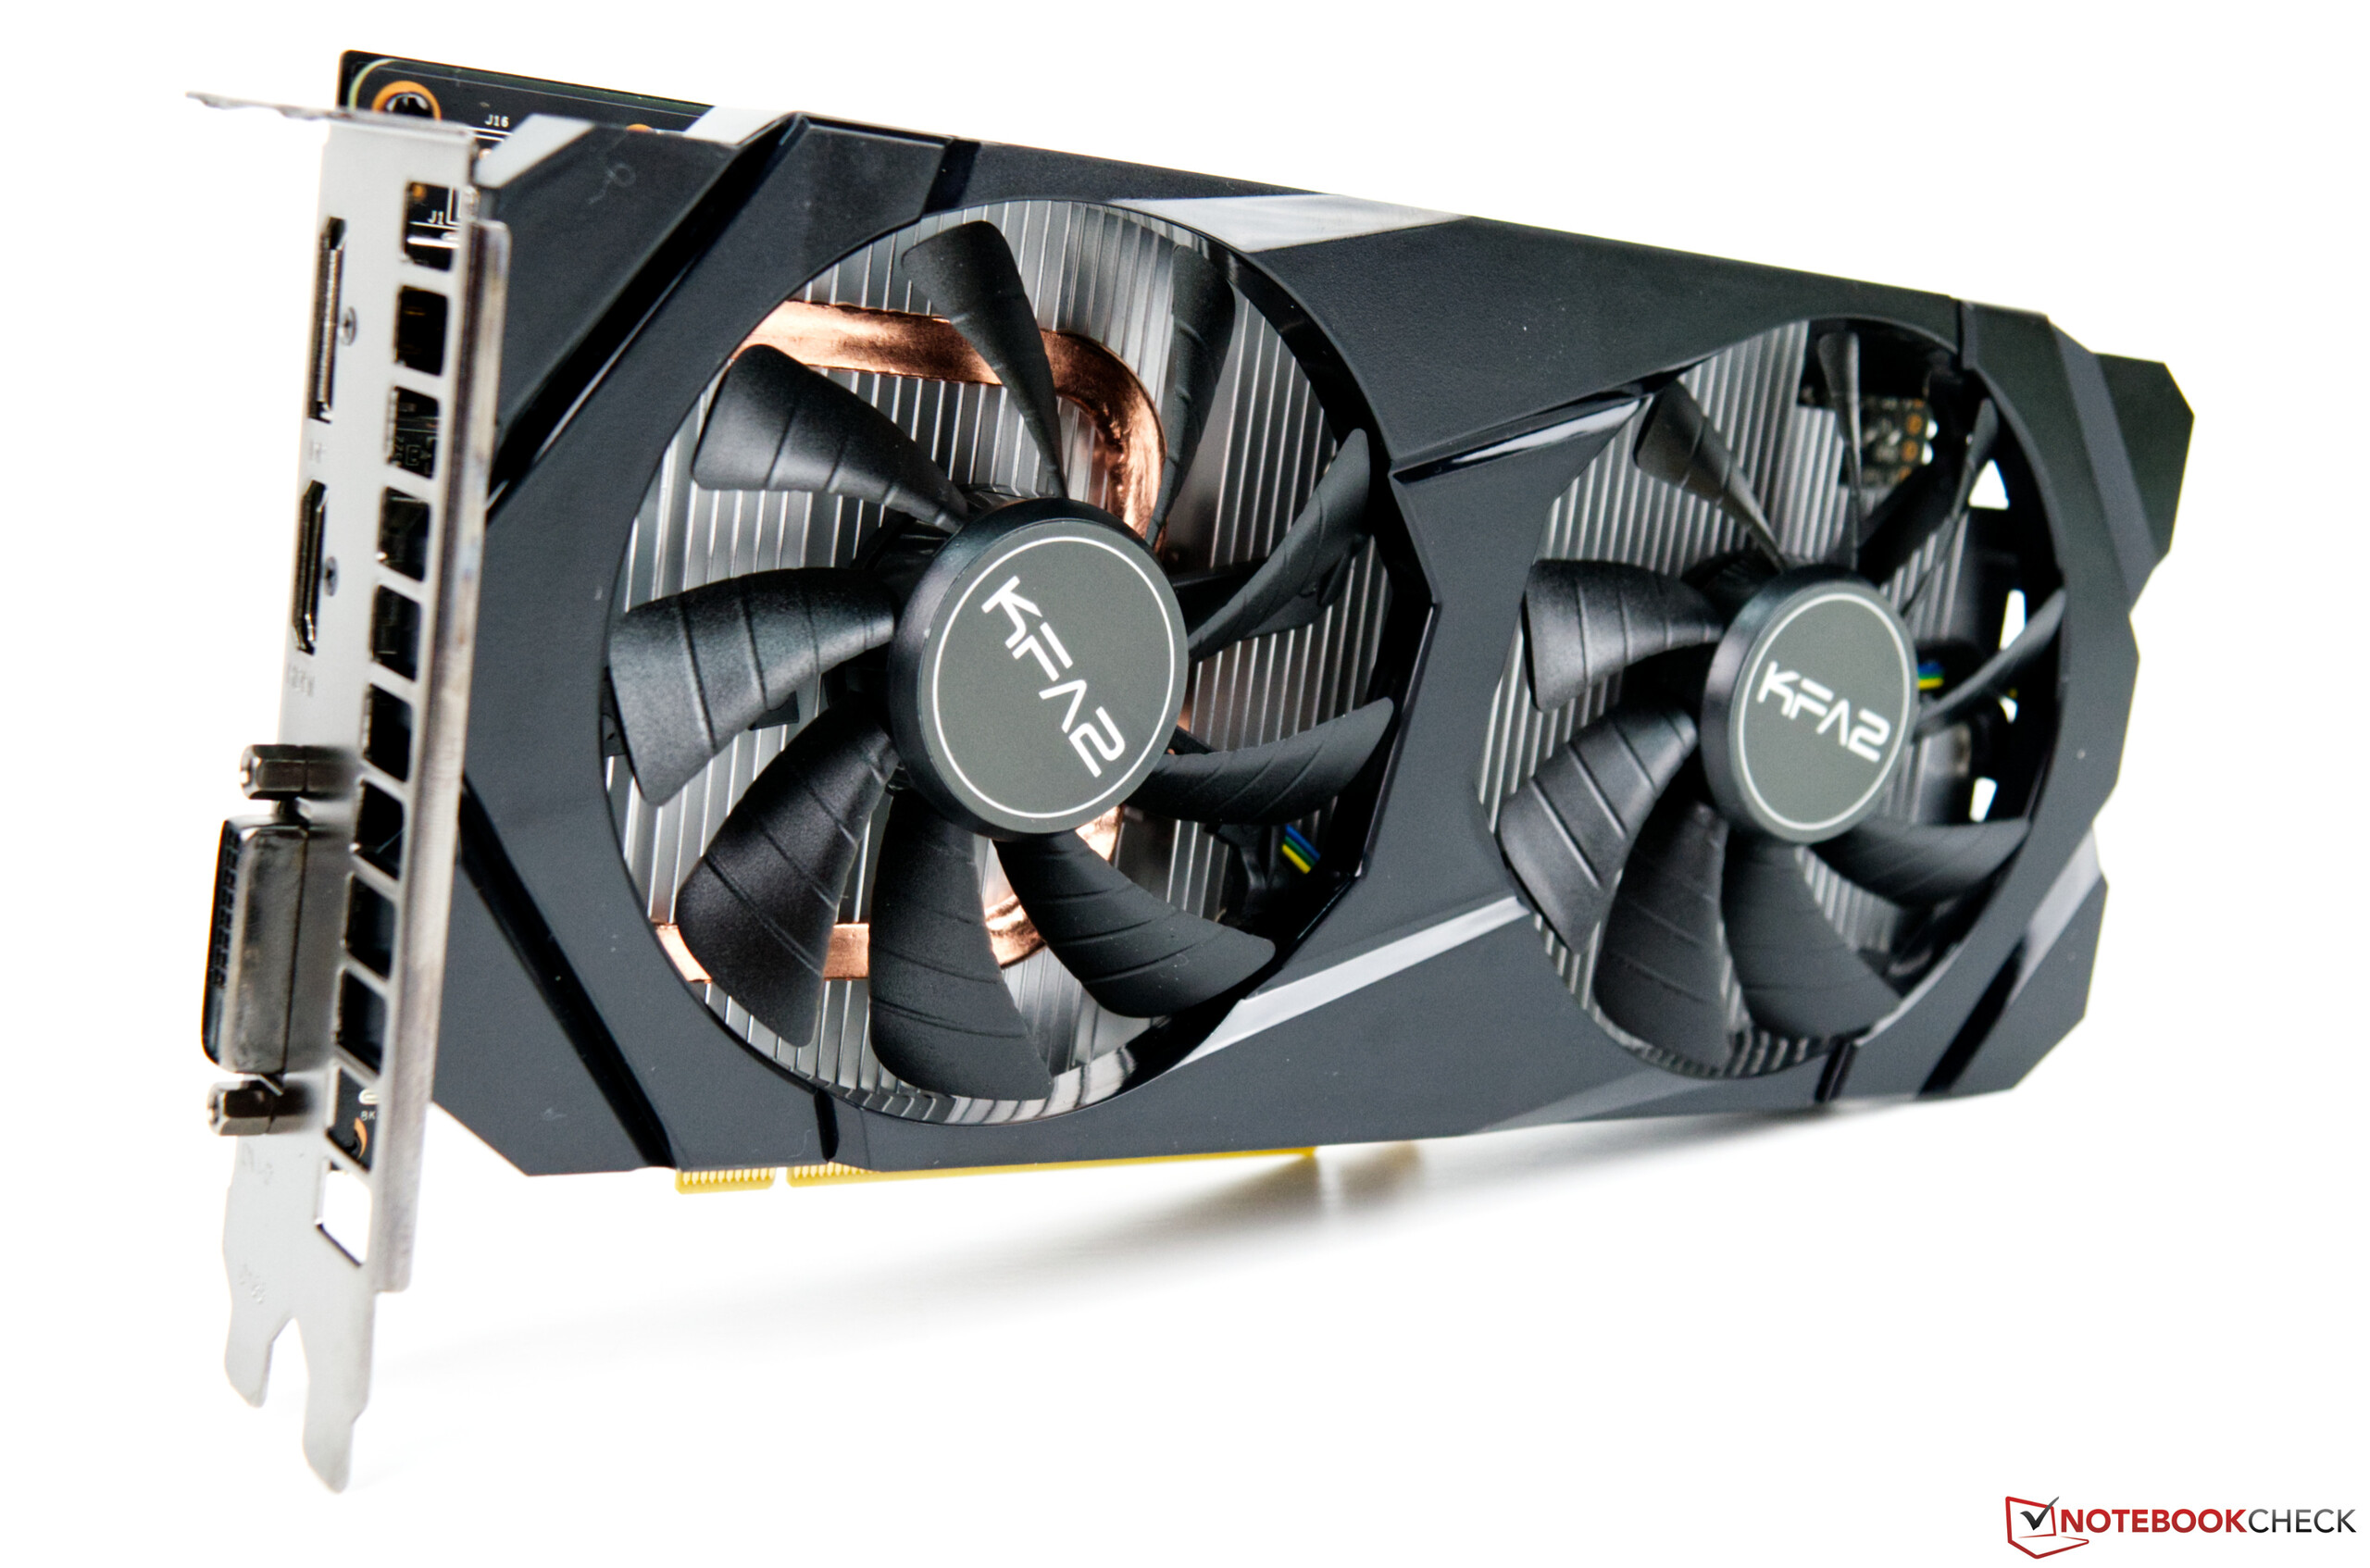
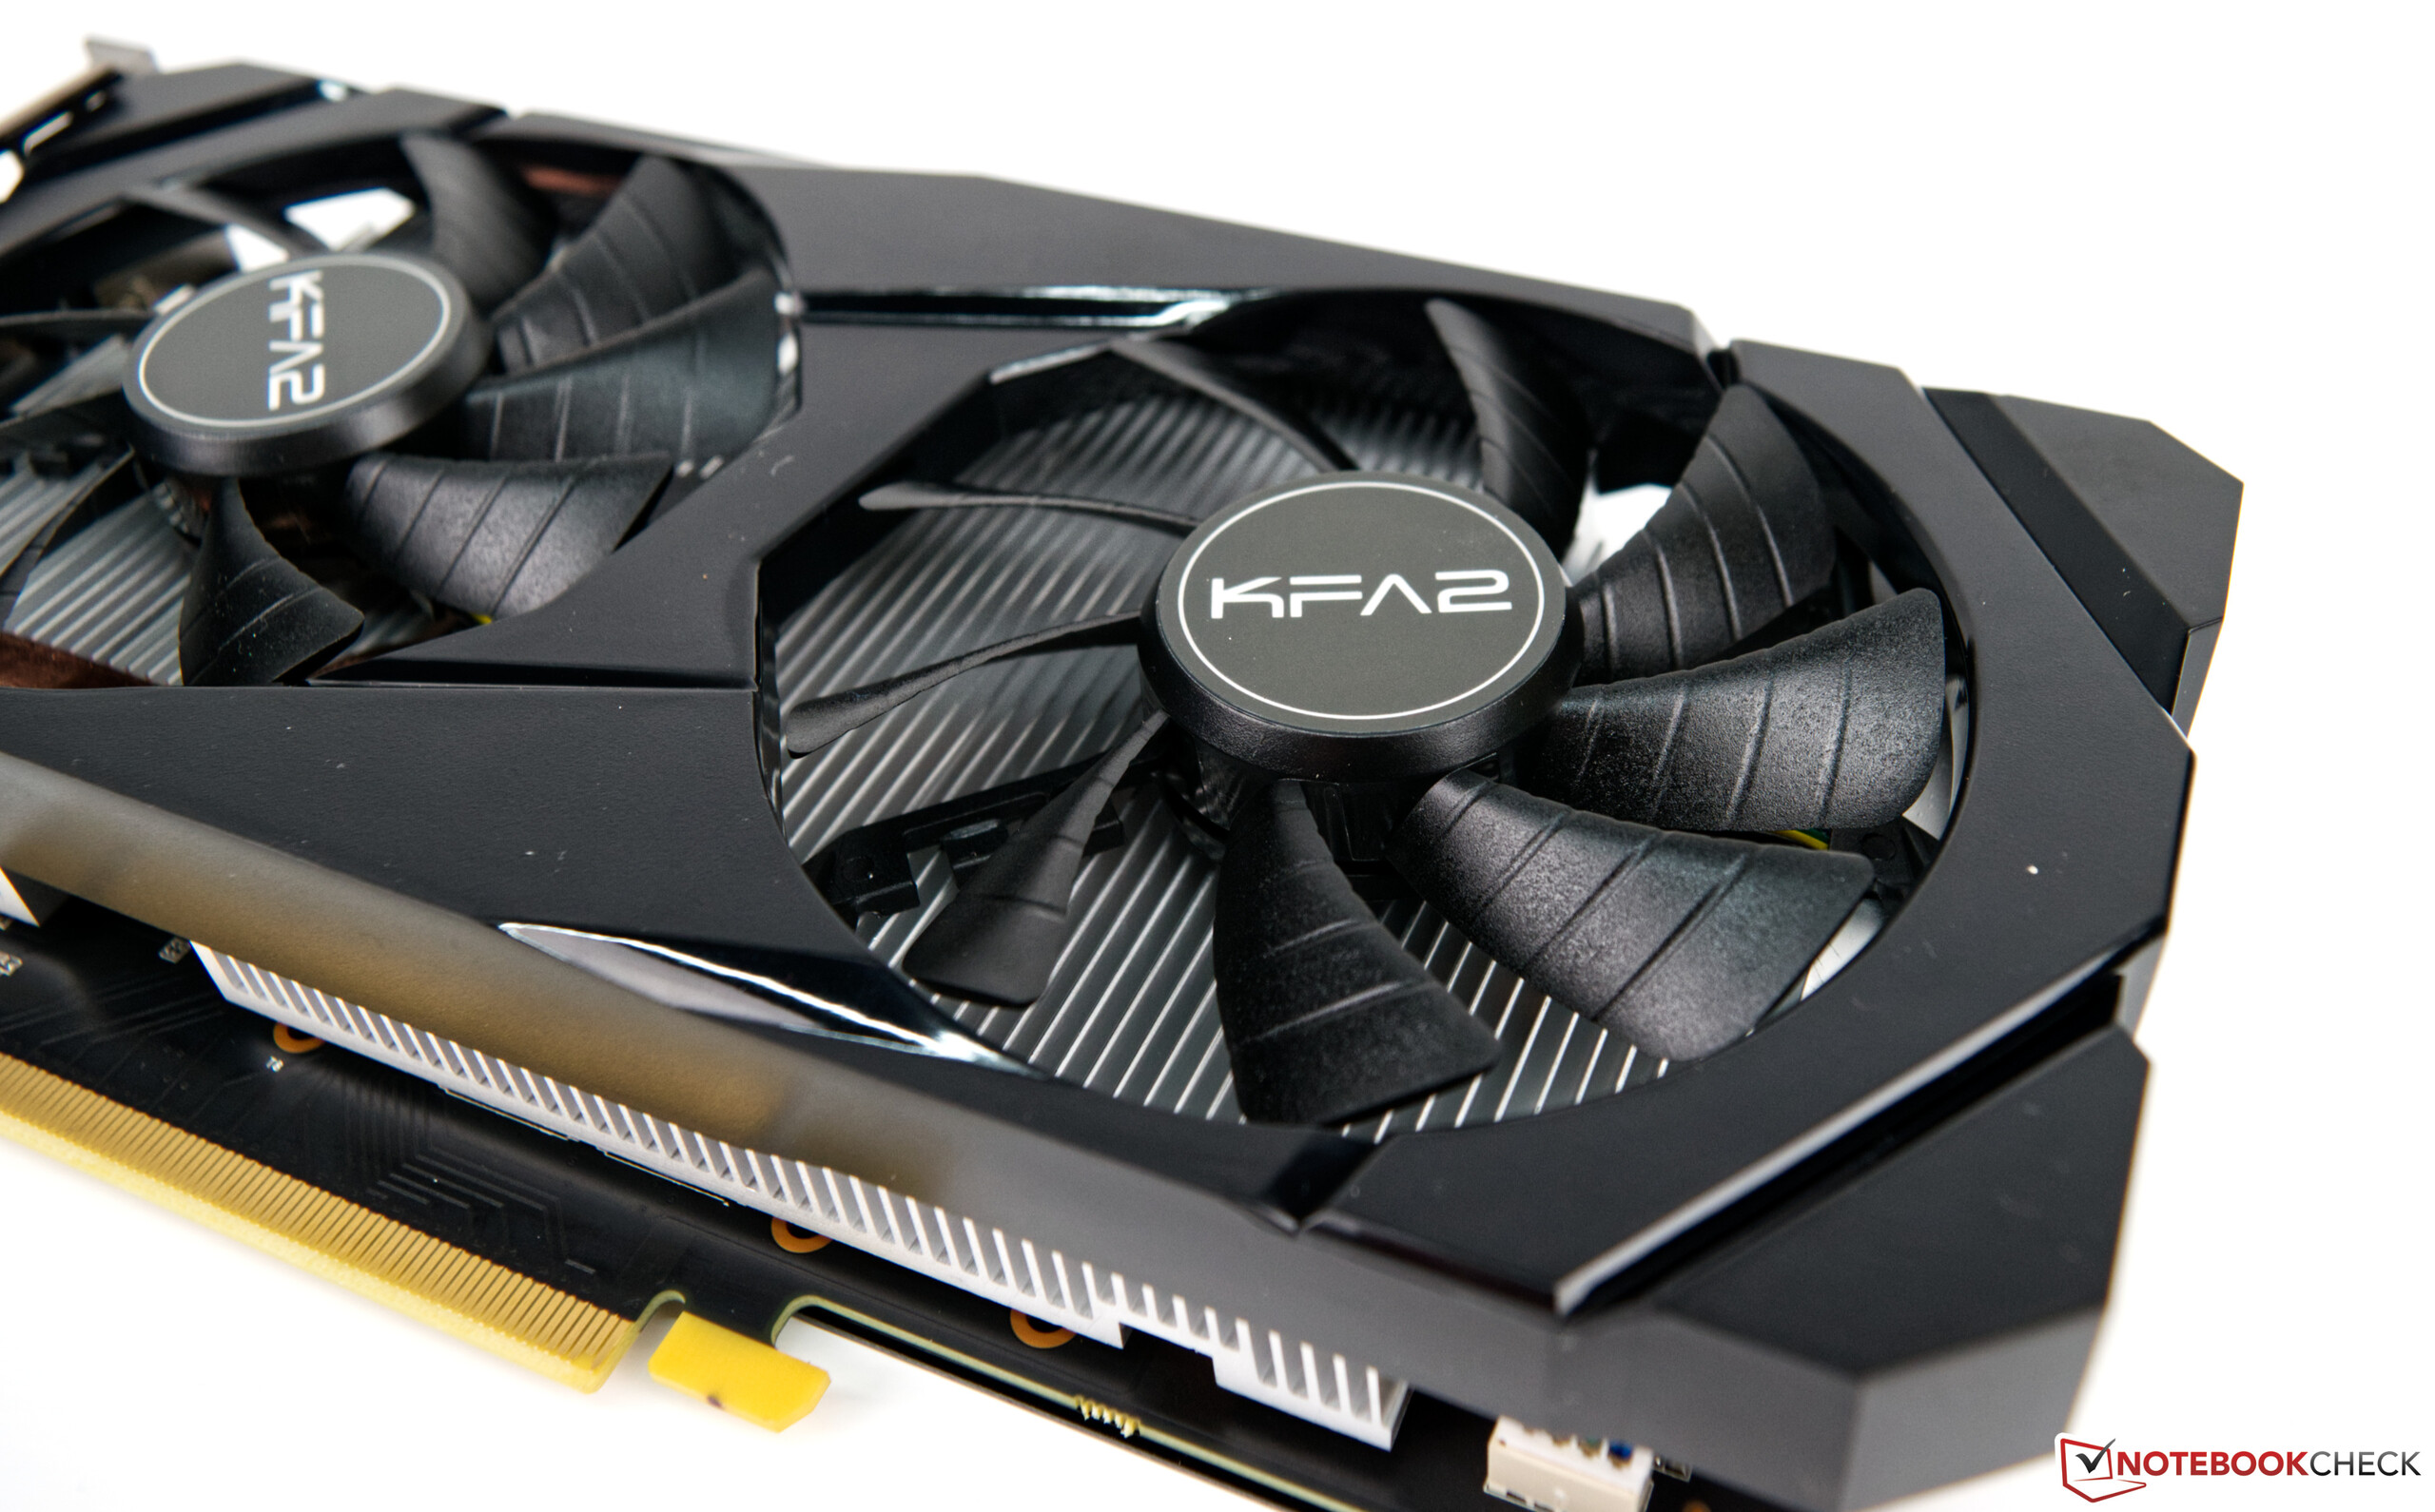
I stort lyckades KFA2 GeForce GTX 1660 SUPER övertyga oss som en skaplig mittenskikts-GPU för desktop. Vi uppskattar också att fläktarna slås av vid tomgång, vilket inte bara minskar energiförbrukningen utan också gör kortet helt tyst. De två fläktarna håller sig relativt tysta även vid belastning, vilket är precis lika imponerande. Kortet borde dessutom kunna köras ännu tystare då det finns värmemässigt utrymme för det. Totalt sett är KFA2 GeForce GTX 1660 SUPER en utmärkt mittenskikts-GPU som är värd vår utmärkelse Redaktörens Val.
Prestandatester
3DM Vant. Perf. total +
specvp12 sw-03 +
* Mindre antal betyder högre prestanda
Speltester
Följande tester/benchmarks kommer från våra laptoprecensioner. Prestandan beror på typen av grafikminne, klockfrekvens, processor, systeminställningar och operativsystem. Resultaten är därför inte nödvändigtvis representativa för alla bärbara datorer med denna GPU. För detaljerad information om resultaten, klicka på fps-värdet.

007 First Light
2026
Pragmata
2026
Death Stranding 2
2026
Crimson Desert
2026


Anno 117: Pax Romana
2025
ARC Raiders
2025
The Outer Worlds 2
2025
Battlefield 6
2025
Borderlands 4
2025
F1 25
2025

Civilization 7
2025Monster Hunter Wilds
2025

Stalker 2
2024

Until Dawn
2024
God of War Ragnarök
2024
Final Fantasy XVI
2024
Space Marine 2
2024
Star Wars Outlaws
2024
Black Myth: Wukong
2024
Once Human
2024
The First Descendant
2024
F1 24
2024

Ghost of Tsushima
2024

Alone in the Dark
2024
Dragon's Dogma 2
2024
Last Epoch
2024
Skull & Bones
2024
Helldivers 2
2024
Enshrouded
2024
Palworld
2024

Ready or Not
2023
The Finals
2023


EA Sports WRC
2023
Alan Wake 2
2023
Lords of the Fallen
2023
Total War Pharaoh
2023

EA Sports FC 24
2023
Counter-Strike 2
2023
Cyberpunk 2077
2023
Baldur's Gate 3
2023
Lies of P
2023
Starfield
2023
Armored Core 6
2023
Immortals of Aveum
2023
Atlas Fallen
2023

F1 23
2023
Diablo 4
2023

Dead Island 2
2023
The Last of Us
2023

Company of Heroes 3
2023
Sons of the Forest
2023
Atomic Heart
2023
Returnal
2023
Hogwarts Legacy
2023
Dead Space Remake
2023
The Witcher 3 v4
2023
High On Life
2023


FIFA 23
2022
The Quarry
2022
F1 22
2022
Vampire Bloodhunt
2022
Ghostwire Tokyo
2022

Cyberpunk 2077 1.6
2022
Elex 2
2022
GRID Legends
2022
Elden Ring
2022
Dying Light 2
2022

God of War
2022
Halo Infinite
2021
Farming Simulator 22
2021
Battlefield 2042
2021
Forza Horizon 5
2021

Riders Republic
2021

Back 4 Blood
2021
Far Cry 6
2021
Alan Wake Remastered
2021
New World
2021
Deathloop
2021
F1 2021
2021

Days Gone
2021


Outriders
2021
Hitman 3
2021
Cyberpunk 2077 1.0
2020

Yakuza Like a Dragon
2020


Watch Dogs Legion
2020
FIFA 21
2020
Star Wars Squadrons
2020

Serious Sam 4
2020
Crysis Remastered
2020

Horizon Zero Dawn
2020
Death Stranding
2020
F1 2020
2020
Valorant
2020
Gears Tactics
2020
Doom Eternal
2020
Hunt Showdown
2020
Escape from Tarkov
2020


Need for Speed Heat
2019

GRID 2019
2019

FIFA 20
2019
Borderlands 3
2019
Control
2019
F1 2019
2019

Rage 2
2019
Anno 1800
2019
The Division 2
2019
Dirt Rally 2.0
2019
Anthem
2019
Far Cry New Dawn
2019
Metro Exodus
2019
Apex Legends
2019
Just Cause 4
2018
Darksiders III
2018
Battlefield V
2018
Farming Simulator 19
2018
Hitman 2
2018

Forza Horizon 4
2018

Strange Brigade
2018
Monster Hunter World
2018
Far Cry 5
2018
X-Plane 11.11
2018


Rocket League
2017For Honor
2017
Far Cry Primal
2016
Dota 2 Reborn
2015
The Witcher 3
2015
GTA V
2015BioShock Infinite
2013| låg | med. | hög | ultra | QHD | 4K | |
|---|---|---|---|---|---|---|
| 007 First Light | 36.1 | 27.9 | 24.4 | 2.83 | ||
| Pragmata | 70.9 | 50.8 | ||||
| Death Stranding 2 | 39.9 | 34.3 | 31.6 | 19.4 | ||
| Crimson Desert | 59.1 | 36 | 34.4 | 28.8 | ||
| Resident Evil Requiem | 66 | 46.5 | 40.3 | |||
| Call of Duty Black Ops 7 | 96 | 85 | 61 | |||
| Anno 117: Pax Romana | 57.4 | 45.7 | 33.2 | 20.9 | ||
| ARC Raiders | 124.5 | 81.7 | 66.1 | |||
| The Outer Worlds 2 | 41.5 | 34.8 | 28.4 | 15.7 | ||
| Battlefield 6 | 72.4 | 59.9 | 42.2 | 30.7 | ||
| Borderlands 4 | 41.1 | 31.4 | 24.4 | 11.1 | ||
| F1 25 | 163.4 | 131.4 | 96.2 | |||
| The Elder Scrolls IV Oblivion Remastered | 76.2 | 35.7 | 31.2 | |||
| Civilization 7 | 236 | 143.4 | 73.7 | 45.8 | 21.7 | |
| Monster Hunter Wilds | 40.8 | 34.1 | ||||
| Kingdom Come Deliverance 2 | 74.3 | 56.2 | 45.5 | 30.7 | 21.5 | 7.4 |
| Stalker 2 | 41.9 | 15.8 | 9.7 | |||
| Call of Duty Black Ops 6 | 57 | 53 | 33 | 31 | 19 | |
| Until Dawn | 100.7 | 60.1 | 40.9 | 29.4 | ||
| God of War Ragnarök | 72.6 | 59.1 | 49.4 | 44.9 | 31.8 | |
| Final Fantasy XVI | 42.8 | 42.5 | 36.1 | 32.5 | ||
| Space Marine 2 | 62 | 52.1 | 49.8 | 43.3 | 13.4 | |
| Star Wars Outlaws | 25.5 | 22.1 | 18.5 | 13.9 | ||
| Black Myth: Wukong | 47 | 34 | 25 | 13 | 12 | |
| Once Human | 123.7 | 85.7 | 71.2 | 61.3 | 38.8 | 19 |
| The First Descendant | 106.5 | 64.3 | 51 | 40.3 | 24.9 | 12.4 |
| F1 24 | 179.8 | 151.4 | 109.9 | |||
| Senua's Saga Hellblade 2 | 37.1 | 29.1 | 8.99 | |||
| Ghost of Tsushima | 64.4 | 55.9 | 48.4 | 34.3 | ||
| Horizon Forbidden West | 70 | 62.2 | 41.7 | 38.5 | 26.7 | 11.8 |
| Alone in the Dark | 168.4 | 132.4 | 109.4 | 38 | 15.9 | |
| Dragon's Dogma 2 | 45.5 | 41.1 | 29.9 | 15.9 | ||
| Last Epoch | 175.5 | 135.5 | 115.7 | 84.6 | 53.4 | 23.1 |
| Skull & Bones | 79 | 72 | 57 | 48 | 35 | 19 |
| Helldivers 2 | 93.1 | 68.8 | 58.7 | 57.3 | 39.3 | 19.3 |
| Enshrouded | 48.1 | 42.7 | 32.9 | 24.1 | 17.8 | 8.2 |
| Palworld | 90.3 | 73.6 | 56.9 | 52.6 | 34.4 | 17.5 |
| Prince of Persia The Lost Crown | 358 | 356 | 350 | 216 | 106.2 | |
| Ready or Not | 144.2 | 128.2 | 112.5 | 69.6 | 39.2 | 9.5 |
| The Finals | 165.4 | 116.3 | 101.7 | 75.3 | 44.1 | 18.1 |
| Avatar Frontiers of Pandora | 53 | 47 | 38 | 28 | 21 | 17 |
| Call of Duty Modern Warfare 3 2023 | 75 | 68 | 47 | 40 | 28 | 16 |
| EA Sports WRC | 82 | 59.6 | 55.4 | 50.6 | 35.7 | 11.1 |
| Alan Wake 2 | 38.8 | 32.2 | 29.9 | 19.6 | 9.2 | |
| Lords of the Fallen | 55.4 | 44.8 | 21.3 | 13.1 | 5.3 | |
| Total War Pharaoh | 252.3 | 165 | 92.6 | 72.7 | 48 | 23.5 |
| Assassin's Creed Mirage | 82 | 75 | 70 | 52 | 39 | 22 |
| EA Sports FC 24 | 180.8 | 164 | 141.7 | 120.8 | 89.2 | 18.8 |
| Counter-Strike 2 | 285 | 243 | 136.1 | 102.5 | 67.2 | 32.8 |
| Cyberpunk 2077 | 90 | 61.9 | 52.4 | 47.5 | 28.8 | 12.5 |
| Baldur's Gate 3 | 76 | 60.5 | 50.7 | 50.3 | 33 | 16.9 |
| Lies of P | 112.6 | 97.9 | 84.3 | 74.1 | 48 | 21.7 |
| Starfield | 42.2 | 35.5 | 26 | 25.8 | 20.3 | 12.6 |
| Armored Core 6 | 115.3 | 97.2 | 85.5 | 68.5 | 49.5 | 20.4 |
| Immortals of Aveum | 36.4 | 30.5 | 22.1 | 14.1 | 6.83 | |
| Atlas Fallen | 89.3 | 84.1 | 78.7 | 65.5 | 46.8 | 22 |
| Ratchet & Clank Rift Apart | 63.4 | 52.4 | 44.7 | 33.4 | 26.6 | 14.3 |
| F1 23 | 196.8 | 171 | 116.6 | 82.9 | 59.9 | 30.7 |
| Diablo 4 | 167.1 | 142.4 | 124.8 | 101.7 | 65.4 | 33.1 |
| Star Wars Jedi Survivor | 51.9 | 43.7 | 41.4 | 38.8 | 23.6 | 10.5 |
| Dead Island 2 | 168.1 | 143.2 | 98.8 | 74.6 | 43.7 | 21.4 |
| The Last of Us | 66.8 | 52.3 | 43.2 | 32.8 | 19.9 | 3.72 |
| Resident Evil 4 Remake | 85.8 | 58 | 53.5 | 43.2 | 32.2 | 15.1 |
| Company of Heroes 3 | 121.9 | 103.8 | 78.5 | 78.1 | 56.2 | 31 |
| Sons of the Forest | 71.6 | 55 | 52.9 | 51.4 | 37.2 | 20.4 |
| Atomic Heart | 124.2 | 90.7 | 52 | 41.5 | 30.7 | 17 |
| Returnal | 66 | 63 | 57 | 48 | 35 | 18 |
| Hogwarts Legacy | 88.2 | 65.3 | 51.1 | 27.4 | 39.2 | 14.6 |
| Dead Space Remake | 57.5 | 53.7 | 46.9 | 46.3 | 30.3 | 14.3 |
| The Witcher 3 v4 | 141 | 105.8 | 87.6 | 71.4 | 49.8 | 27.5 |
| High On Life | 172.8 | 99 | 79.4 | 63.6 | 37.1 | 15.8 |
| The Callisto Protocol | 99.7 | 69.8 | 45.3 | 45.1 | 30.3 | 12.4 |
| Need for Speed Unbound | 105.8 | 92.7 | 72.7 | 57.7 | 34.2 | 20.3 |
| Spider-Man Miles Morales | 92.8 | 82.9 | 81.7 | 69 | 37.9 | 17.9 |
| Call of Duty Modern Warfare 2 2022 | 89 | 80 | 56 | 54 | 38 | 22 |
| Uncharted Legacy of Thieves Collection | 62.8 | 60 | 43.6 | 40.8 | 26.2 | 10.7 |
| A Plague Tale Requiem | 73.3 | 54.1 | 39.8 | 29.8 | 20.8 | 11.1 |
| FIFA 23 | 201 | 186.6 | 124.4 | 119.8 | 88.4 | 50.9 |
| The Quarry | 97 | 73 | 60 | 45 | 26 | 8 |
| F1 22 | 198 | 177 | 126 | 91 | 66 | 36 |
| Vampire Bloodhunt | 238 | 123.9 | 120.3 | 116.9 | 74.6 | 36.7 |
| Ghostwire Tokyo | 93.6 | 92.2 | 89.7 | 91.3 | 57.3 | 26.7 |
| Tiny Tina's Wonderlands | 123 | 99 | 67 | 52 | 35 | 13 |
| Cyberpunk 2077 1.6 | 76 | 63 | 52 | 49 | 26 | 11 |
| Elex 2 | 71.8 | 65 | 57.5 | 53.1 | 35.2 | 18.4 |
| GRID Legends | 204 | 148 | 112 | 80 | 62 | 38 |
| Elden Ring | 59.9 | 59.9 | 59.8 | 57.1 | 47 | 27.7 |
| Dying Light 2 | 87.5 | 44.6 | 36.3 | 24.7 | 12.6 | |
| Rainbow Six Extraction | 131 | 109 | 105 | 74 | 56 | 27 |
| God of War | 90 | 74 | 58 | 39 | 31 | 21 |
| Halo Infinite | 80.3 | 71.7 | 68.3 | 68.6 | 54.5 | |
| Farming Simulator 22 | 296 | 164 | 123 | 101 | 75.7 | 44.9 |
| Battlefield 2042 | 147 | 88.6 | 74.5 | 64 | 46.3 | 25.4 |
| Forza Horizon 5 | 210 | 107 | 93 | 37 | 34 | 24 |
| Call of Duty Vanguard | 92.2 | 85.7 | 67.4 | 53.5 | 38.7 | 21.9 |
| Riders Republic | 163 | 96 | 77 | 67 | 45 | 23 |
| Guardians of the Galaxy | 137 | 95 | 84 | 84 | 60 | 32 |
| Back 4 Blood | 154 | 140 | 126 | 80.3 | 39 | |
| Far Cry 6 | 167 | 97 | 84 | 71 | 45 | 6 |
| Alan Wake Remastered | 97.4 | 93.3 | 89.7 | 69.9 | ||
| New World | 157 | 82.6 | 75.1 | 46 | 41.8 | |
| Deathloop | 131 | 81.5 | 66.5 | 50.9 | 35 | 18.1 |
| F1 2021 | 402 | 197 | 160 | 108 | 80 | 45 |
| Monster Hunter Stories 2 | 144 | 143 | 144 | 138 | 84.6 | |
| Days Gone | 168 | 101 | 88.6 | 64.3 | 46.2 | 25.7 |
| Mass Effect Legendary Edition | 116 | 112 | 105 | 58.5 | ||
| Resident Evil Village | 273 | 119 | 108 | 93.7 | 59.4 | 29.8 |
| Outriders | 189 | 112 | 86.8 | 76.4 | 49.1 | 31.3 |
| Hitman 3 | 248 | 117 | 102 | 92 | 61 | 32 |
| Cyberpunk 2077 1.0 | 104 | 56.1 | 46.2 | 39.2 | 24.5 | 10.9 |
| Immortals Fenyx Rising | 99 | 67 | 54 | 51 | 41 | 25 |
| Yakuza Like a Dragon | 111 | 77.2 | 74.9 | 64.7 | 43.1 | 21.5 |
| Call of Duty Black Ops Cold War | 162 | 93.7 | 75.3 | 57.2 | 39.5 | 18.2 |
| Assassin´s Creed Valhalla | 99 | 66 | 48 | 44 | 34 | 18 |
| Watch Dogs Legion | 115 | 82.5 | 70.8 | 31.4 | 23.5 | 12.3 |
| FIFA 21 | 220 | 217 | 208 | 206 | 196 | 139 |
| Star Wars Squadrons | 400 | 220 | 193 | 176 | 116 | 64 |
| Mafia Definitive Edition | 142.2 | 78.8 | 72.5 | 48.2 | 24.5 | |
| Serious Sam 4 | 144.1 | 88.1 | 71.3 | 53.6 | 41.9 | 25.6 |
| Crysis Remastered | 237 | 108 | 58 | 45.6 | 32.6 | 19.1 |
| Flight Simulator 2020 | 85.5 | 55.1 | 40.2 | 27.3 | 19.7 | 11.9 |
| Horizon Zero Dawn | 138 | 88 | 73 | 57 | 44 | 24 |
| Death Stranding | 147 | 93.8 | 86 | 84.3 | 58.5 | 31.5 |
| F1 2020 | 346 | 184 | 144 | 98 | 71 | 40 |
| Valorant | 327.3 | 320.7 | 289.8 | 262.4 | 131.9 | |
| Gears Tactics | 324.4 | 162.1 | 104.8 | 72.2 | 46 | 24.1 |
| Doom Eternal | 265 | 143 | 126 | 122 | 73.4 | 34.4 |
| Hunt Showdown | 224 | 95.6 | 77 | 48.9 | 21.6 | |
| Escape from Tarkov | 121 | 114 | 121 | 92.7 | 54.6 | 27.7 |
| Red Dead Redemption 2 | 136 | 77 | 53.6 | 33.2 | 26.7 | |
| Star Wars Jedi Fallen Order | 80 | 64 | 56.9 | 55.5 | 27.7 | |
| Need for Speed Heat | 116 | 98 | 89 | 77 | 55.6 | 26.6 |
| Call of Duty Modern Warfare 2019 | 163 | 117 | 96 | 84 | 59.3 | 32.4 |
| GRID 2019 | 202 | 124 | 100 | 69 | 52.5 | 35 |
| Ghost Recon Breakpoint | 118 | 80 | 72 | 55 | 38 | 19 |
| FIFA 20 | 257 | 251 | 235 | 236 | 220 | 145 |
| Borderlands 3 | 201 | 106 | 69 | 52 | 35 | 15 |
| Control | 213 | 77 | 56.3 | 35.3 | 17 | |
| F1 2019 | 263 | 152 | 132 | 87 | 68 | 41 |
| Total War: Three Kingdoms | 236 | 108.5 | 68.1 | 47.2 | 29.3 | 13.5 |
| Rage 2 | 212 | 103 | 86 | 83 | 50.1 | 23.9 |
| Anno 1800 | 103 | 106 | 78 | 40.6 | 28.6 | 16.9 |
| The Division 2 | 193 | 113 | 88 | 63 | 43 | 23 |
| Dirt Rally 2.0 | 311 | 158 | 132 | 73 | 54.5 | 31.4 |
| Anthem | 131 | 97 | 84 | 79 | 55.5 | 27 |
| Far Cry New Dawn | 165 | 107 | 100 | 92 | 67 | 35 |
| Metro Exodus | 161 | 70 | 55 | 45 | 35 | 22 |
| Apex Legends | 144 | 144 | 116 | 120 | 82 | 43.5 |
| Just Cause 4 | 164 | 121 | 88 | 84 | 57 | 30.6 |
| Darksiders III | 232 | 128 | 104 | 93 | 60 | 21.8 |
| Battlefield V | 154 | 97 | 83 | 77 | 60 | 36.4 |
| Farming Simulator 19 | 237 | 176 | 154 | 123 | 88 | 47.5 |
| Hitman 2 | 99 | 92 | 84 | 79 | 56.4 | 28.8 |
| Assassin´s Creed Odyssey | 120 | 88 | 73 | 51 | 40 | 24 |
| Forza Horizon 4 | 211 | 144 | 135 | 107 | 84 | 54 |
| Shadow of the Tomb Raider | 220 | 102 | 90 | 82 | 54 | 27 |
| Strange Brigade | 396 | 162 | 128 | 110 | 79 | 44 |
| Monster Hunter World | 172 | 99 | 90 | 66 | 41.4 | 20.1 |
| Far Cry 5 | 189 | 110 | 102 | 95 | 65 | 33 |
| X-Plane 11.11 | 195 | 172 | 132 | 99 | ||
| Final Fantasy XV Benchmark | 101 | 90 | 77 | 69 | 58 | |
| Assassin´s Creed Origins | 136 | 90 | 83 | 69 | 54 | 33 |
| Playerunknown's Battlegrounds (PUBG) | 244 | 139 | 104 | 35.8 | ||
| Rocket League | 250 | 249 | 217 | 162 | 101 | |
| Ghost Recon Wildlands | 170 | 91 | 85 | 49 | 32 | |
| For Honor | 317 | 139 | 133 | 102 | 42 | |
| Far Cry Primal | 129 | 115 | 106 | 86 | 40 | |
| Rise of the Tomb Raider | 295 | 199 | 111 | 86 | 37 | |
| Dota 2 Reborn | 246 | 218 | 205 | 188 | 94 | |
| The Witcher 3 | 319 | 205 | 113 | 61 | 40 | |
| GTA V | 186 | 184 | 171 | 86 | 62 | 61 |
| BioShock Infinite | 440 | 362 | 329 | 151 | ||
| låg | med. | hög | ultra | QHD | 4K | < 30 fps < 60 fps < 120 fps ≥ 120 fps | 1 22 54 90 | 4 34 85 45 | 9 52 77 30 | 17 57 64 11 | 30 77 29 6 | 93 39 8 3 |
För att se fler spel som kan vara spelbara och se en lista med alla spel och grafikkort, besök vår spellista
