Test: KFA2 GeForce RTX 2060 Super (1-Click OC) - Specialbyggd supermodell av RTX 2060 (Sammanfattning)

| Performance rating - Percent | |
| Nvidia Titan RTX | |
| MSI RTX 2080 Gaming X Trio | |
| Nvidia GeForce RTX 2070 Super | |
| AMD Radeon VII | |
| MSI RTX 2070 Gaming Z 8G | |
| AMD Radeon RX 5700 XT | |
| Nvidia GeForce RTX 2060 Super | |
| KFA2 GeForce RTX 2060 Super | |
| AMD Radeon RX 5700 | |
| AMD Radeon RX Vega 64 -4! | |
| MSI RTX 2060 Gaming Z 6G | |
| 3DMark 11 - 1280x720 Performance GPU | |
| Nvidia Titan RTX | |
| MSI RTX 2080 Gaming X Trio | |
| AMD Radeon VII | |
| AMD Radeon RX 5700 XT | |
| Nvidia GeForce RTX 2070 Super | |
| AMD Radeon RX 5700 | |
| MSI RTX 2070 Gaming Z 8G | |
| Nvidia GeForce RTX 2060 Super | |
| AMD Radeon RX Vega 64 | |
| KFA2 GeForce RTX 2060 Super | |
| MSI RTX 2060 Gaming Z 6G | |
| Unigine Heaven 4.0 | |
| Extreme Preset OpenGL | |
| Nvidia Titan RTX | |
| MSI RTX 2080 Gaming X Trio | |
| Nvidia GeForce RTX 2070 Super | |
| MSI RTX 2070 Gaming Z 8G | |
| Nvidia GeForce RTX 2060 Super | |
| KFA2 GeForce RTX 2060 Super | |
| MSI RTX 2060 Gaming Z 6G | |
| AMD Radeon RX 5700 XT | |
| AMD Radeon VII | |
| AMD Radeon RX 5700 | |
| Extreme Preset DX11 | |
| Nvidia Titan RTX | |
| MSI RTX 2080 Gaming X Trio | |
| Nvidia GeForce RTX 2070 Super | |
| MSI RTX 2070 Gaming Z 8G | |
| Nvidia GeForce RTX 2060 Super | |
| KFA2 GeForce RTX 2060 Super | |
| AMD Radeon VII | |
| AMD Radeon RX 5700 XT | |
| MSI RTX 2060 Gaming Z 6G | |
| AMD Radeon RX 5700 | |
| Unigine Valley 1.0 | |
| 1920x1080 Extreme HD DirectX AA:x8 | |
| Nvidia Titan RTX | |
| MSI RTX 2080 Gaming X Trio | |
| Nvidia GeForce RTX 2070 Super | |
| MSI RTX 2070 Gaming Z 8G | |
| KFA2 GeForce RTX 2060 Super | |
| AMD Radeon VII | |
| Nvidia GeForce RTX 2060 Super | |
| AMD Radeon RX 5700 XT | |
| AMD Radeon RX 5700 | |
| MSI RTX 2060 Gaming Z 6G | |
| 1920x1080 Extreme HD Preset OpenGL AA:x8 | |
| Nvidia Titan RTX | |
| MSI RTX 2080 Gaming X Trio | |
| Nvidia GeForce RTX 2070 Super | |
| MSI RTX 2070 Gaming Z 8G | |
| Nvidia GeForce RTX 2060 Super | |
| KFA2 GeForce RTX 2060 Super | |
| AMD Radeon RX 5700 XT | |
| MSI RTX 2060 Gaming Z 6G | |
| AMD Radeon RX 5700 | |
| AMD Radeon VII | |
| 3DMark 05 Standard | 52832 poäng | |
| 3DMark 06 Standard Score | 44419 poäng | |
| 3DMark Vantage P Result | 70863 poäng | |
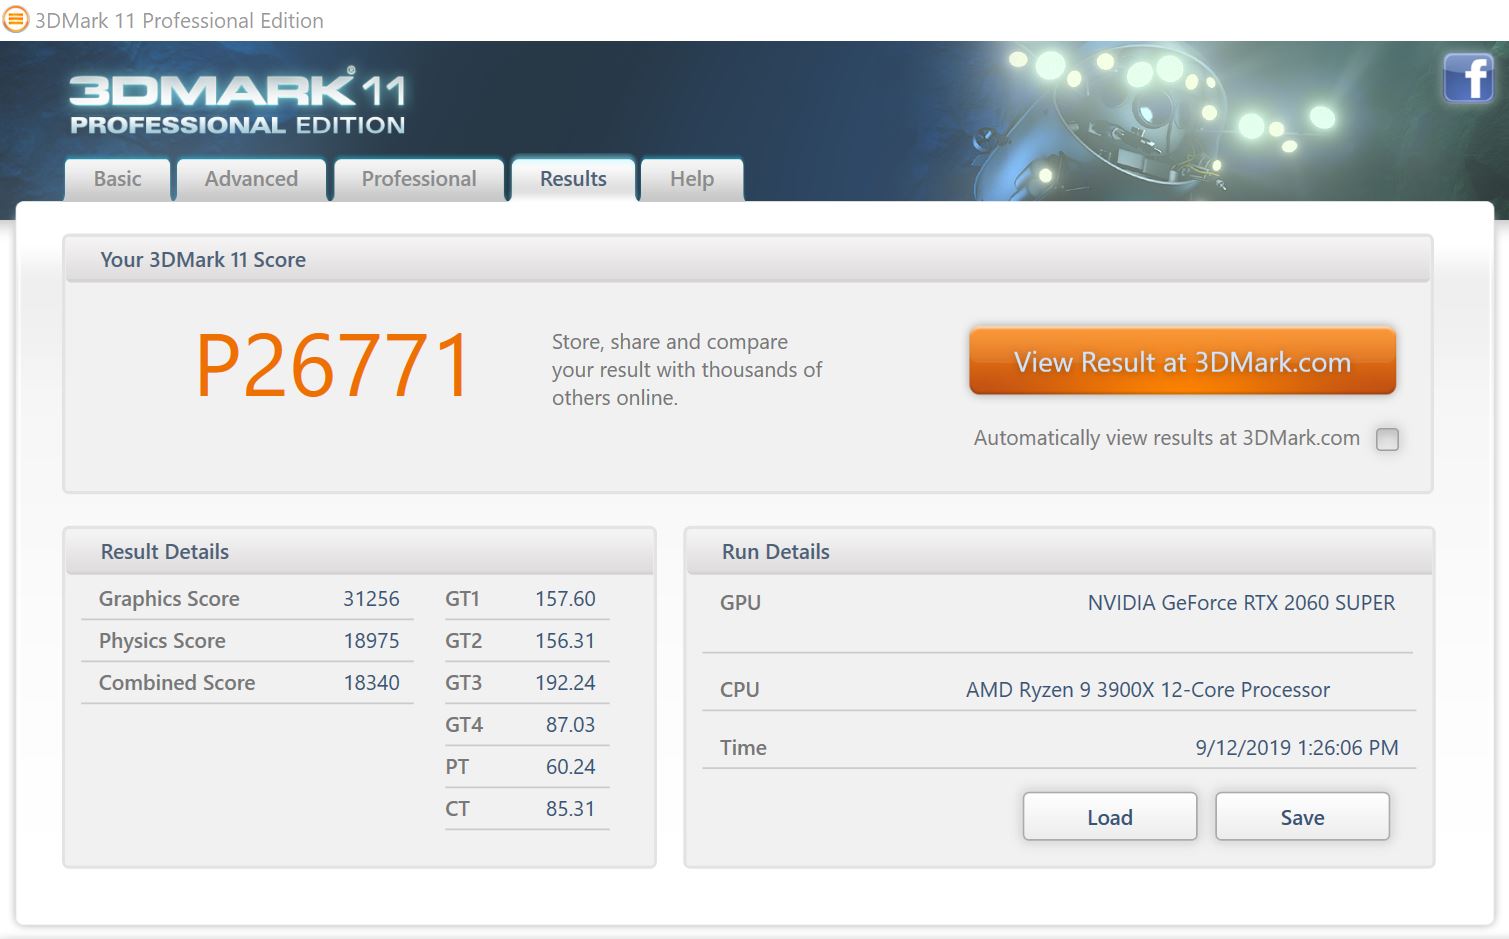
| 3DMark 11 Performance | 25443 poäng | |
| 3DMark Ice Storm Standard Score | 186278 poäng | |
| 3DMark Cloud Gate Standard Score | 52783 poäng | |
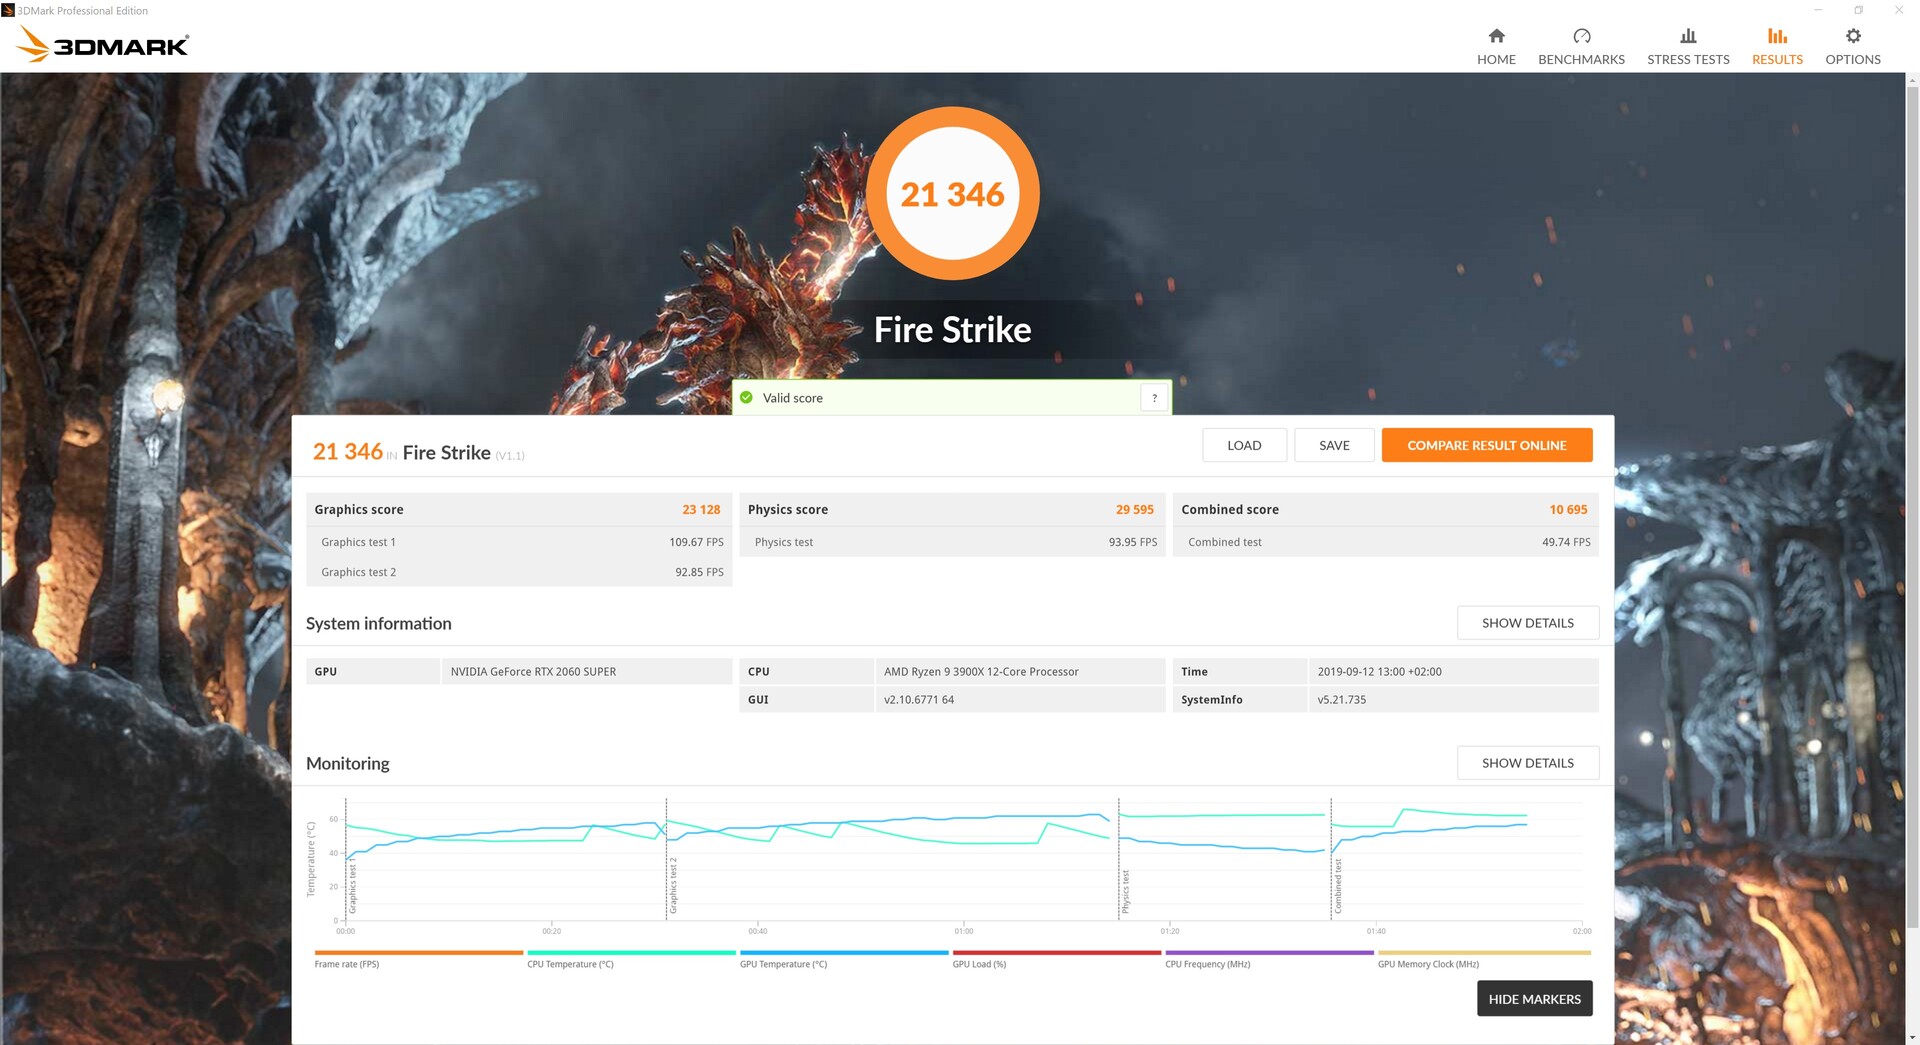
| 3DMark Fire Strike Score | 20086 poäng | |
| 3DMark Fire Strike Extreme Score | 10259 poäng | |
| 3DMark Time Spy Score | 9064 poäng | |
Hjälp | ||
The Witcher 3 - Bilduppdatering - Ultra Preset
| Performance rating - Percent | |
| Nvidia Titan RTX -42! | |
| MSI RTX 2080 Gaming X Trio -3! | |
| Nvidia GeForce RTX 2070 Super | |
| AMD Radeon RX 5700 XT -10! | |
| MSI RTX 2070 Gaming Z 8G -3! | |
| KFA2 GeForce RTX 2060 Super -2! | |
| AMD Radeon VII -36! | |
| Nvidia GeForce RTX 2060 Super | |
| AMD Radeon RX 5700 -11! | |
| AMD Radeon RX Vega 64 -27! | |
| MSI RTX 2060 Gaming Z 6G -20! | |
| Call of Duty Black Ops 4 | |
| 1920x1080 Very High / On | |
| Nvidia Titan RTX | |
| MSI RTX 2080 Gaming X Trio | |
| AMD Radeon RX Vega 64 | |
| Nvidia GeForce RTX 2070 Super | |
| MSI RTX 2070 Gaming Z 8G | |
| AMD Radeon VII | |
| Nvidia GeForce RTX 2060 Super | |
| KFA2 GeForce RTX 2060 Super | |
| AMD Radeon RX 5700 XT | |
| MSI RTX 2060 Gaming Z 6G | |
| AMD Radeon RX 5700 | |
| 3840x2160 Very High / On | |
| Nvidia Titan RTX | |
| MSI RTX 2080 Gaming X Trio | |
| AMD Radeon RX Vega 64 | |
| AMD Radeon VII | |
| AMD Radeon RX 5700 XT | |
| Nvidia GeForce RTX 2070 Super | |
| AMD Radeon RX 5700 | |
| Nvidia GeForce RTX 2060 Super | |
| MSI RTX 2070 Gaming Z 8G | |
| KFA2 GeForce RTX 2060 Super | |
| MSI RTX 2060 Gaming Z 6G | |
| 2560x1440 Very High / On | |
| AMD Radeon RX 5700 XT | |
| MSI RTX 2080 Gaming X Trio | |
| Nvidia GeForce RTX 2070 Super | |
| MSI RTX 2070 Gaming Z 8G | |
| AMD Radeon RX 5700 | |
| Nvidia GeForce RTX 2060 Super | |
| KFA2 GeForce RTX 2060 Super | |
| Assassin´s Creed Odyssey | |
| 1920x1080 Ultra High Preset | |
| Nvidia Titan RTX | |
| MSI RTX 2080 Gaming X Trio | |
| MSI RTX 2070 Gaming Z 8G | |
| Nvidia GeForce RTX 2070 Super | |
| AMD Radeon VII | |
| AMD Radeon RX 5700 XT | |
| Nvidia GeForce RTX 2060 Super | |
| KFA2 GeForce RTX 2060 Super | |
| AMD Radeon RX 5700 | |
| MSI RTX 2060 Gaming Z 6G | |
| AMD Radeon RX Vega 64 | |
| 3840x2160 Ultra High Preset | |
| Nvidia Titan RTX | |
| AMD Radeon VII | |
| MSI RTX 2080 Gaming X Trio | |
| Nvidia GeForce RTX 2070 Super | |
| MSI RTX 2070 Gaming Z 8G | |
| KFA2 GeForce RTX 2060 Super | |
| AMD Radeon RX 5700 XT | |
| Nvidia GeForce RTX 2060 Super | |
| AMD Radeon RX 5700 | |
| AMD Radeon RX Vega 64 | |
| MSI RTX 2060 Gaming Z 6G | |
| 2560x1440 Ultra High Preset | |
| MSI RTX 2080 Gaming X Trio | |
| Nvidia GeForce RTX 2070 Super | |
| MSI RTX 2070 Gaming Z 8G | |
| AMD Radeon RX 5700 XT | |
| Nvidia GeForce RTX 2060 Super | |
| KFA2 GeForce RTX 2060 Super | |
| AMD Radeon RX 5700 | |
| FIFA 19 | |
| 1920x1080 Ultra Preset AA:4x MS | |
| KFA2 GeForce RTX 2060 Super | |
| AMD Radeon RX Vega 64 | |
| AMD Radeon RX 5700 XT | |
| AMD Radeon RX 5700 | |
| Nvidia GeForce RTX 2070 Super | |
| Nvidia Titan RTX | |
| MSI RTX 2080 Gaming X Trio | |
| AMD Radeon VII | |
| MSI RTX 2070 Gaming Z 8G | |
| Nvidia GeForce RTX 2060 Super | |
| MSI RTX 2060 Gaming Z 6G | |
| 3840x2160 Ultra Preset AA:4x MS | |
| Nvidia Titan RTX | |
| AMD Radeon VII | |
| MSI RTX 2080 Gaming X Trio | |
| KFA2 GeForce RTX 2060 Super | |
| AMD Radeon RX 5700 XT | |
| Nvidia GeForce RTX 2060 Super | |
| MSI RTX 2070 Gaming Z 8G | |
| Nvidia GeForce RTX 2070 Super | |
| AMD Radeon RX 5700 | |
| AMD Radeon RX Vega 64 | |
| MSI RTX 2060 Gaming Z 6G | |
| 2560x1440 Ultra Preset AA:4x MS | |
| KFA2 GeForce RTX 2060 Super | |
| AMD Radeon RX 5700 XT | |
| AMD Radeon RX 5700 | |
| Nvidia GeForce RTX 2070 Super | |
| MSI RTX 2080 Gaming X Trio | |
| Nvidia GeForce RTX 2060 Super | |
| MSI RTX 2070 Gaming Z 8G | |
| Forza Horizon 4 | |
| 1920x1080 Ultra Preset AA:2xMS | |
| MSI RTX 2080 Gaming X Trio | |
| AMD Radeon RX 5700 XT | |
| Nvidia Titan RTX | |
| AMD Radeon VII | |
| Nvidia GeForce RTX 2070 Super | |
| KFA2 GeForce RTX 2060 Super | |
| AMD Radeon RX Vega 64 | |
| AMD Radeon RX 5700 | |
| MSI RTX 2070 Gaming Z 8G | |
| Nvidia GeForce RTX 2060 Super | |
| MSI RTX 2060 Gaming Z 6G | |
| 3840x2160 Ultra Preset AA:2xMS | |
| Nvidia Titan RTX | |
| MSI RTX 2080 Gaming X Trio | |
| AMD Radeon RX 5700 XT | |
| AMD Radeon VII | |
| Nvidia GeForce RTX 2070 Super | |
| KFA2 GeForce RTX 2060 Super | |
| AMD Radeon RX 5700 | |
| MSI RTX 2070 Gaming Z 8G | |
| AMD Radeon RX Vega 64 | |
| Nvidia GeForce RTX 2060 Super | |
| MSI RTX 2060 Gaming Z 6G | |
| 2560x1440 Ultra Preset AA:2xMS | |
| AMD Radeon RX 5700 XT | |
| MSI RTX 2080 Gaming X Trio | |
| Nvidia GeForce RTX 2070 Super | |
| KFA2 GeForce RTX 2060 Super | |
| AMD Radeon RX 5700 | |
| MSI RTX 2070 Gaming Z 8G | |
| Nvidia GeForce RTX 2060 Super | |
| F1 2018 | |
| 1920x1080 Ultra High Preset AA:T AF:16x | |
| Nvidia Titan RTX | |
| MSI RTX 2080 Gaming X Trio | |
| AMD Radeon VII | |
| Nvidia GeForce RTX 2070 Super | |
| MSI RTX 2070 Gaming Z 8G | |
| KFA2 GeForce RTX 2060 Super | |
| Nvidia GeForce RTX 2060 Super | |
| MSI RTX 2060 Gaming Z 6G | |
| AMD Radeon RX Vega 64 | |
| 3840x2160 Ultra High Preset AA:T AF:16x | |
| Nvidia Titan RTX | |
| MSI RTX 2080 Gaming X Trio | |
| AMD Radeon VII | |
| Nvidia GeForce RTX 2070 Super | |
| MSI RTX 2070 Gaming Z 8G | |
| KFA2 GeForce RTX 2060 Super | |
| Nvidia GeForce RTX 2060 Super | |
| MSI RTX 2060 Gaming Z 6G | |
| AMD Radeon RX Vega 64 | |
| 2560x1440 Ultra High Preset AA:T AF:16x | |
| MSI RTX 2080 Gaming X Trio | |
| Nvidia GeForce RTX 2070 Super | |
| MSI RTX 2070 Gaming Z 8G | |
| Nvidia GeForce RTX 2060 Super | |
| KFA2 GeForce RTX 2060 Super | |
| Monster Hunter World | |
| 1920x1080 Highest Preset (Image Quality High) | |
| Nvidia Titan RTX | |
| MSI RTX 2080 Gaming X Trio | |
| Nvidia GeForce RTX 2070 Super | |
| MSI RTX 2070 Gaming Z 8G | |
| AMD Radeon VII | |
| Nvidia GeForce RTX 2060 Super | |
| AMD Radeon RX 5700 XT | |
| KFA2 GeForce RTX 2060 Super | |
| MSI RTX 2060 Gaming Z 6G | |
| AMD Radeon RX Vega 64 | |
| AMD Radeon RX 5700 | |
| 3840x2160 Highest Preset (Image Quality High) | |
| Nvidia Titan RTX | |
| KFA2 GeForce RTX 2060 Super | |
| MSI RTX 2080 Gaming X Trio | |
| Nvidia GeForce RTX 2070 Super | |
| AMD Radeon VII | |
| MSI RTX 2070 Gaming Z 8G | |
| AMD Radeon RX 5700 XT | |
| AMD Radeon RX Vega 64 | |
| Nvidia GeForce RTX 2060 Super | |
| AMD Radeon RX 5700 | |
| MSI RTX 2060 Gaming Z 6G | |
| 2560x1440 Highest Preset (Image Quality High) | |
| KFA2 GeForce RTX 2060 Super | |
| MSI RTX 2080 Gaming X Trio | |
| Nvidia GeForce RTX 2070 Super | |
| MSI RTX 2070 Gaming Z 8G | |
| AMD Radeon RX 5700 XT | |
| Nvidia GeForce RTX 2060 Super | |
| AMD Radeon RX 5700 | |
| Far Cry 5 | |
| 1920x1080 Ultra Preset AA:T | |
| KFA2 GeForce RTX 2060 Super | |
| MSI RTX 2080 Gaming X Trio | |
| Nvidia Titan RTX | |
| MSI RTX 2070 Gaming Z 8G | |
| AMD Radeon RX Vega 64 | |
| Nvidia GeForce RTX 2060 Super | |
| Nvidia GeForce RTX 2070 Super | |
| AMD Radeon RX 5700 XT | |
| MSI RTX 2060 Gaming Z 6G | |
| AMD Radeon VII | |
| AMD Radeon RX 5700 | |
| 3840x2160 Ultra Preset AA:T | |
| Nvidia Titan RTX | |
| MSI RTX 2080 Gaming X Trio | |
| AMD Radeon VII | |
| Nvidia GeForce RTX 2070 Super | |
| AMD Radeon RX 5700 XT | |
| MSI RTX 2070 Gaming Z 8G | |
| Nvidia GeForce RTX 2060 Super | |
| AMD Radeon RX 5700 | |
| KFA2 GeForce RTX 2060 Super | |
| AMD Radeon RX Vega 64 | |
| MSI RTX 2060 Gaming Z 6G | |
| 2560x1440 Ultra Preset AA:T | |
| MSI RTX 2080 Gaming X Trio | |
| Nvidia GeForce RTX 2070 Super | |
| AMD Radeon RX 5700 XT | |
| MSI RTX 2070 Gaming Z 8G | |
| KFA2 GeForce RTX 2060 Super | |
| Nvidia GeForce RTX 2060 Super | |
| AMD Radeon RX 5700 | |
| The Crew 2 | |
| 1920x1080 Ultra Preset | |
| Nvidia Titan RTX | |
| MSI RTX 2060 Gaming Z 6G | |
| MSI RTX 2070 Gaming Z 8G | |
| MSI RTX 2080 Gaming X Trio | |
| AMD Radeon VII | |
| Nvidia GeForce RTX 2060 Super | |
| Nvidia GeForce RTX 2070 Super | |
| AMD Radeon RX 5700 | |
| AMD Radeon RX 5700 XT | |
| KFA2 GeForce RTX 2060 Super | |
| 3840x2160 Ultra Preset | |
| Nvidia Titan RTX | |
| MSI RTX 2080 Gaming X Trio | |
| Nvidia GeForce RTX 2070 Super | |
| AMD Radeon RX 5700 XT | |
| MSI RTX 2070 Gaming Z 8G | |
| AMD Radeon VII | |
| AMD Radeon RX 5700 | |
| Nvidia GeForce RTX 2060 Super | |
| KFA2 GeForce RTX 2060 Super | |
| MSI RTX 2060 Gaming Z 6G | |
| 2560x1440 Ultra Preset | |
| MSI RTX 2070 Gaming Z 8G | |
| MSI RTX 2080 Gaming X Trio | |
| Nvidia GeForce RTX 2070 Super | |
| AMD Radeon RX 5700 | |
| AMD Radeon RX 5700 XT | |
| KFA2 GeForce RTX 2060 Super | |
| Nvidia GeForce RTX 2060 Super | |
| Assassin´s Creed Origins | |
| 1920x1080 Ultra High Preset | |
| Nvidia Titan RTX | |
| KFA2 GeForce RTX 2060 Super | |
| MSI RTX 2080 Gaming X Trio | |
| MSI RTX 2070 Gaming Z 8G | |
| Nvidia GeForce RTX 2070 Super | |
| Nvidia GeForce RTX 2060 Super | |
| MSI RTX 2060 Gaming Z 6G | |
| AMD Radeon RX Vega 64 | |
| AMD Radeon VII | |
| AMD Radeon RX 5700 | |
| AMD Radeon RX 5700 XT | |
| 3840x2160 Ultra High Preset | |
| Nvidia Titan RTX | |
| MSI RTX 2080 Gaming X Trio | |
| AMD Radeon VII | |
| Nvidia GeForce RTX 2070 Super | |
| MSI RTX 2070 Gaming Z 8G | |
| KFA2 GeForce RTX 2060 Super | |
| Nvidia GeForce RTX 2060 Super | |
| MSI RTX 2060 Gaming Z 6G | |
| AMD Radeon RX 5700 XT | |
| AMD Radeon RX 5700 | |
| AMD Radeon RX Vega 64 | |
| 2560x1440 Ultra High Preset | |
| MSI RTX 2080 Gaming X Trio | |
| Nvidia GeForce RTX 2070 Super | |
| MSI RTX 2070 Gaming Z 8G | |
| KFA2 GeForce RTX 2060 Super | |
| Nvidia GeForce RTX 2060 Super | |
| AMD Radeon RX 5700 XT | |
| AMD Radeon RX 5700 | |
| Kingdom Come: Deliverance | |
| 1920x1080 Ultra High Preset | |
| Nvidia Titan RTX | |
| MSI RTX 2080 Gaming X Trio | |
| Nvidia GeForce RTX 2070 Super | |
| MSI RTX 2070 Gaming Z 8G | |
| Nvidia GeForce RTX 2060 Super | |
| AMD Radeon RX 5700 XT | |
| AMD Radeon RX Vega 64 | |
| AMD Radeon VII | |
| KFA2 GeForce RTX 2060 Super | |
| MSI RTX 2060 Gaming Z 6G | |
| AMD Radeon RX 5700 | |
| 3840x2160 Ultra High Preset | |
| Nvidia Titan RTX | |
| MSI RTX 2080 Gaming X Trio | |
| AMD Radeon RX Vega 64 | |
| Nvidia GeForce RTX 2070 Super | |
| AMD Radeon VII | |
| MSI RTX 2070 Gaming Z 8G | |
| Nvidia GeForce RTX 2060 Super | |
| KFA2 GeForce RTX 2060 Super | |
| AMD Radeon RX 5700 XT | |
| AMD Radeon RX 5700 | |
| MSI RTX 2060 Gaming Z 6G | |
| 2560x1440 Ultra High Preset | |
| MSI RTX 2080 Gaming X Trio | |
| Nvidia GeForce RTX 2070 Super | |
| AMD Radeon RX 5700 XT | |
| Nvidia GeForce RTX 2060 Super | |
| MSI RTX 2070 Gaming Z 8G | |
| KFA2 GeForce RTX 2060 Super | |
| AMD Radeon RX 5700 | |
| Fortnite | |
| 1920x1080 Epic Preset | |
| Nvidia GeForce RTX 2070 Super | |
| Nvidia GeForce RTX 2060 Super | |
| MSI RTX 2080 Gaming X Trio | |
| AMD Radeon RX 5700 XT | |
| MSI RTX 2060 Gaming Z 6G | |
| KFA2 GeForce RTX 2060 Super | |
| MSI RTX 2070 Gaming Z 8G | |
| Nvidia Titan RTX | |
| AMD Radeon RX 5700 | |
| AMD Radeon VII | |
| 3840x2160 Epic Preset | |
| Nvidia Titan RTX | |
| MSI RTX 2080 Gaming X Trio | |
| Nvidia GeForce RTX 2070 Super | |
| MSI RTX 2070 Gaming Z 8G | |
| Nvidia GeForce RTX 2060 Super | |
| KFA2 GeForce RTX 2060 Super | |
| AMD Radeon RX 5700 XT | |
| AMD Radeon VII | |
| AMD Radeon RX 5700 | |
| MSI RTX 2060 Gaming Z 6G | |
| 2560x1440 Epic Preset | |
| MSI RTX 2080 Gaming X Trio | |
| Nvidia GeForce RTX 2070 Super | |
| MSI RTX 2070 Gaming Z 8G | |
| Nvidia GeForce RTX 2060 Super | |
| KFA2 GeForce RTX 2060 Super | |
| AMD Radeon RX 5700 XT | |
| AMD Radeon RX 5700 | |
| Final Fantasy XV Benchmark | |
| 1920x1080 High Quality | |
| Nvidia Titan RTX | |
| MSI RTX 2080 Gaming X Trio | |
| Nvidia GeForce RTX 2070 Super | |
| MSI RTX 2070 Gaming Z 8G | |
| KFA2 GeForce RTX 2060 Super | |
| Nvidia GeForce RTX 2060 Super | |
| MSI RTX 2060 Gaming Z 6G | |
| AMD Radeon RX 5700 XT | |
| AMD Radeon RX 5700 | |
| AMD Radeon RX Vega 64 | |
| AMD Radeon RX Vega 64 | |
| 3840x2160 High Quality | |
| Nvidia Titan RTX | |
| MSI RTX 2080 Gaming X Trio | |
| Nvidia GeForce RTX 2070 Super | |
| MSI RTX 2070 Gaming Z 8G | |
| Nvidia GeForce RTX 2060 Super | |
| KFA2 GeForce RTX 2060 Super | |
| AMD Radeon RX 5700 XT | |
| MSI RTX 2060 Gaming Z 6G | |
| AMD Radeon RX 5700 | |
| AMD Radeon RX Vega 64 | |
| AMD Radeon RX Vega 64 | |
| Destiny 2 | |
| 1920x1080 Highest Preset AA:SM AF:16x | |
| Nvidia Titan RTX | |
| KFA2 GeForce RTX 2060 Super | |
| MSI RTX 2070 Gaming Z 8G | |
| MSI RTX 2080 Gaming X Trio | |
| Nvidia GeForce RTX 2060 Super | |
| Nvidia GeForce RTX 2070 Super | |
| AMD Radeon RX 5700 XT | |
| AMD Radeon RX 5700 | |
| AMD Radeon VII | |
| MSI RTX 2060 Gaming Z 6G | |
| 3840x2160 Highest Preset AA:SM AF:16x | |
| Nvidia Titan RTX | |
| MSI RTX 2080 Gaming X Trio | |
| Nvidia GeForce RTX 2070 Super | |
| MSI RTX 2070 Gaming Z 8G | |
| AMD Radeon RX 5700 XT | |
| KFA2 GeForce RTX 2060 Super | |
| Nvidia GeForce RTX 2060 Super | |
| AMD Radeon VII | |
| MSI RTX 2060 Gaming Z 6G | |
| AMD Radeon RX 5700 | |
| 2560x1440 Highest Preset AA:SM AF:16x | |
| MSI RTX 2080 Gaming X Trio | |
| Nvidia GeForce RTX 2070 Super | |
| MSI RTX 2070 Gaming Z 8G | |
| AMD Radeon RX 5700 XT | |
| KFA2 GeForce RTX 2060 Super | |
| Nvidia GeForce RTX 2060 Super | |
| AMD Radeon RX 5700 | |
| Far Cry Primal | |
| 1920x1080 Ultra Preset AA:SM | |
| AMD Radeon RX Vega 64 | |
| MSI RTX 2070 Gaming Z 8G | |
| AMD Radeon VII | |
| MSI RTX 2060 Gaming Z 6G | |
| AMD Radeon RX 5700 | |
| KFA2 GeForce RTX 2060 Super | |
| MSI RTX 2080 Gaming X Trio | |
| Nvidia GeForce RTX 2060 Super | |
| Nvidia GeForce RTX 2070 Super | |
| AMD Radeon RX 5700 XT | |
| Nvidia Titan RTX | |
| 3840x2160 High Preset AA:SM | |
| Nvidia Titan RTX | |
| MSI RTX 2080 Gaming X Trio | |
| AMD Radeon VII | |
| Nvidia GeForce RTX 2070 Super | |
| MSI RTX 2070 Gaming Z 8G | |
| AMD Radeon RX 5700 XT | |
| KFA2 GeForce RTX 2060 Super | |
| Nvidia GeForce RTX 2060 Super | |
| AMD Radeon RX 5700 | |
| MSI RTX 2060 Gaming Z 6G | |
| AMD Radeon RX Vega 64 | |
| The Witcher 3 | |
| 1920x1080 Ultra Graphics & Postprocessing (HBAO+) | |
| Nvidia Titan RTX | |
| MSI RTX 2080 Gaming X Trio | |
| Nvidia GeForce RTX 2070 Super | |
| AMD Radeon RX 5700 XT | |
| MSI RTX 2070 Gaming Z 8G | |
| KFA2 GeForce RTX 2060 Super | |
| AMD Radeon RX 5700 | |
| Nvidia GeForce RTX 2060 Super | |
| AMD Radeon RX Vega 64 | |
| AMD Radeon VII | |
| MSI RTX 2060 Gaming Z 6G | |
| 3840x2160 High Graphics & Postprocessing (Nvidia HairWorks Off) | |
| Nvidia Titan RTX | |
| MSI RTX 2080 Gaming X Trio | |
| Nvidia GeForce RTX 2070 Super | |
| MSI RTX 2070 Gaming Z 8G | |
| KFA2 GeForce RTX 2060 Super | |
| Nvidia GeForce RTX 2060 Super | |
| AMD Radeon VII | |
| AMD Radeon RX 5700 XT | |
| MSI RTX 2060 Gaming Z 6G | |
| AMD Radeon RX Vega 64 | |
| AMD Radeon RX 5700 | |
| Watch Dogs 2 | |
| 1920x1080 Ultra Preset | |
| Nvidia Titan RTX | |
| MSI RTX 2080 Gaming X Trio | |
| Nvidia GeForce RTX 2070 Super | |
| MSI RTX 2070 Gaming Z 8G | |
| Nvidia GeForce RTX 2060 Super | |
| KFA2 GeForce RTX 2060 Super | |
| AMD Radeon RX Vega 64 | |
| MSI RTX 2060 Gaming Z 6G | |
| AMD Radeon VII | |
| 3840x2160 High Preset | |
| Nvidia Titan RTX | |
| MSI RTX 2080 Gaming X Trio | |
| Nvidia GeForce RTX 2070 Super | |
| MSI RTX 2070 Gaming Z 8G | |
| Nvidia GeForce RTX 2060 Super | |
| KFA2 GeForce RTX 2060 Super | |
| AMD Radeon VII | |
| MSI RTX 2060 Gaming Z 6G | |
| AMD Radeon RX Vega 64 | |
| Battlefield 1 | |
| 1920x1080 Ultra Preset AA:T | |
| Nvidia Titan RTX | |
| Nvidia GeForce RTX 2070 Super | |
| MSI RTX 2080 Gaming X Trio | |
| AMD Radeon RX Vega 64 | |
| Nvidia GeForce RTX 2060 Super | |
| MSI RTX 2070 Gaming Z 8G | |
| AMD Radeon VII | |
| MSI RTX 2060 Gaming Z 6G | |
| 3840x2160 High Preset AA:T | |
| Nvidia Titan RTX | |
| MSI RTX 2080 Gaming X Trio | |
| AMD Radeon VII | |
| Nvidia GeForce RTX 2070 Super | |
| MSI RTX 2070 Gaming Z 8G | |
| Nvidia GeForce RTX 2060 Super | |
| AMD Radeon RX Vega 64 | |
| MSI RTX 2060 Gaming Z 6G | |
| The Division | |
| 1920x1080 Ultra Preset AF:16x | |
| Nvidia Titan RTX | |
| MSI RTX 2080 Gaming X Trio | |
| AMD Radeon RX 5700 XT | |
| AMD Radeon RX 5700 | |
| Nvidia GeForce RTX 2070 Super | |
| MSI RTX 2070 Gaming Z 8G | |
| Nvidia GeForce RTX 2060 Super | |
| AMD Radeon RX Vega 64 | |
| KFA2 GeForce RTX 2060 Super | |
| MSI RTX 2060 Gaming Z 6G | |
| AMD Radeon VII | |
| 3840x2160 High Preset AF:8x | |
| Nvidia Titan RTX | |
| MSI RTX 2080 Gaming X Trio | |
| AMD Radeon RX 5700 XT | |
| Nvidia GeForce RTX 2070 Super | |
| AMD Radeon VII | |
| MSI RTX 2070 Gaming Z 8G | |
| AMD Radeon RX 5700 | |
| Nvidia GeForce RTX 2060 Super | |
| KFA2 GeForce RTX 2060 Super | |
| AMD Radeon RX Vega 64 | |
| MSI RTX 2060 Gaming Z 6G | |
| For Honor | |
| 1920x1080 Extreme Preset AA:T AF:16x | |
| Nvidia Titan RTX | |
| MSI RTX 2080 Gaming X Trio | |
| AMD Radeon RX 5700 XT | |
| Nvidia GeForce RTX 2070 Super | |
| AMD Radeon RX 5700 | |
| MSI RTX 2070 Gaming Z 8G | |
| KFA2 GeForce RTX 2060 Super | |
| Nvidia GeForce RTX 2060 Super | |
| AMD Radeon RX Vega 64 | |
| MSI RTX 2060 Gaming Z 6G | |
| AMD Radeon VII | |
| 3840x2160 High Preset AA:T AF:8x | |
| Nvidia Titan RTX | |
| MSI RTX 2080 Gaming X Trio | |
| Nvidia GeForce RTX 2070 Super | |
| AMD Radeon VII | |
| AMD Radeon RX 5700 XT | |
| MSI RTX 2070 Gaming Z 8G | |
| KFA2 GeForce RTX 2060 Super | |
| Nvidia GeForce RTX 2060 Super | |
| AMD Radeon RX 5700 | |
| MSI RTX 2060 Gaming Z 6G | |
| AMD Radeon RX Vega 64 | |
| Ghost Recon Wildlands | |
| 1920x1080 Ultra Preset AA:T AF:16x | |
| Nvidia Titan RTX | |
| MSI RTX 2080 Gaming X Trio | |
| Nvidia GeForce RTX 2070 Super | |
| AMD Radeon RX 5700 XT | |
| MSI RTX 2070 Gaming Z 8G | |
| Nvidia GeForce RTX 2060 Super | |
| KFA2 GeForce RTX 2060 Super | |
| AMD Radeon RX 5700 | |
| MSI RTX 2060 Gaming Z 6G | |
| AMD Radeon RX Vega 64 | |
| AMD Radeon VII | |
| 3840x2160 Ultra Preset AA:T AF:16x | |
| Nvidia Titan RTX | |
| MSI RTX 2080 Gaming X Trio | |
| Nvidia GeForce RTX 2070 Super | |
| AMD Radeon RX 5700 XT | |
| MSI RTX 2070 Gaming Z 8G | |
| AMD Radeon RX 5700 | |
| Nvidia GeForce RTX 2060 Super | |
| KFA2 GeForce RTX 2060 Super | |
| Doom | |
| 1920x1080 Ultra Preset AA:SM | |
| KFA2 GeForce RTX 2060 Super | |
| Nvidia Titan RTX | |
| Nvidia GeForce RTX 2060 Super | |
| MSI RTX 2080 Gaming X Trio | |
| MSI RTX 2070 Gaming Z 8G | |
| MSI RTX 2060 Gaming Z 6G | |
| Nvidia GeForce RTX 2070 Super | |
| 3840x2160 High Preset AA:FX | |
| Nvidia Titan RTX | |
| MSI RTX 2080 Gaming X Trio | |
| Nvidia GeForce RTX 2070 Super | |
| MSI RTX 2070 Gaming Z 8G | |
| Nvidia GeForce RTX 2060 Super | |
| MSI RTX 2060 Gaming Z 6G | |
| KFA2 GeForce RTX 2060 Super | |
| GTA V | |
| 1920x1080 Highest AA:4xMSAA + FX AF:16x | |
| Nvidia Titan RTX | |
| MSI RTX 2080 Gaming X Trio | |
| AMD Radeon VII | |
| MSI RTX 2070 Gaming Z 8G | |
| MSI RTX 2060 Gaming Z 6G | |
| KFA2 GeForce RTX 2060 Super | |
| Nvidia GeForce RTX 2060 Super | |
| Nvidia GeForce RTX 2070 Super | |
| AMD Radeon RX 5700 | |
| AMD Radeon RX 5700 XT | |
| 3840x2160 High/On (Advanced Graphics Off) AA:FX AF:8x | |
| Nvidia Titan RTX | |
| Nvidia GeForce RTX 2070 Super | |
| AMD Radeon RX 5700 XT | |
| MSI RTX 2080 Gaming X Trio | |
| KFA2 GeForce RTX 2060 Super | |
| Nvidia GeForce RTX 2060 Super | |
| AMD Radeon RX 5700 | |
| AMD Radeon VII | |
| MSI RTX 2070 Gaming Z 8G | |
| MSI RTX 2060 Gaming Z 6G | |
| Battlefield 4 - 3840x2160 High Preset | |
| Nvidia Titan RTX | |
| MSI RTX 2080 Gaming X Trio | |
| Nvidia GeForce RTX 2070 Super | |
| MSI RTX 2070 Gaming Z 8G | |
| KFA2 GeForce RTX 2060 Super | |
| AMD Radeon RX Vega 64 | |
| AMD Radeon VII | |
| Nvidia GeForce RTX 2060 Super | |
| MSI RTX 2060 Gaming Z 6G | |
| Hitman 2 | |
| 1920x1080 Ultra AF:16x | |
| KFA2 GeForce RTX 2060 Super | |
| AMD Radeon VII | |
| AMD Radeon RX 5700 XT | |
| AMD Radeon RX 5700 | |
| MSI RTX 2060 Gaming Z 6G | |
| MSI RTX 2080 Gaming X Trio | |
| Nvidia GeForce RTX 2060 Super | |
| AMD Radeon RX Vega 64 | |
| MSI RTX 2070 Gaming Z 8G | |
| Nvidia GeForce RTX 2070 Super | |
| Nvidia Titan RTX | |
| 3840x2160 Ultra AF:16x | |
| Nvidia Titan RTX | |
| MSI RTX 2080 Gaming X Trio | |
| Nvidia GeForce RTX 2070 Super | |
| AMD Radeon VII | |
| AMD Radeon RX 5700 XT | |
| AMD Radeon RX Vega 64 | |
| MSI RTX 2070 Gaming Z 8G | |
| AMD Radeon RX 5700 | |
| Nvidia GeForce RTX 2060 Super | |
| MSI RTX 2060 Gaming Z 6G | |
| KFA2 GeForce RTX 2060 Super | |
| 2560x1440 Ultra AF:16x | |
| MSI RTX 2080 Gaming X Trio | |
| AMD Radeon RX 5700 XT | |
| AMD Radeon RX 5700 | |
| Nvidia GeForce RTX 2070 Super | |
| MSI RTX 2070 Gaming Z 8G | |
| Nvidia GeForce RTX 2060 Super | |
| KFA2 GeForce RTX 2060 Super | |
| Battlefield V | |
| 1920x1080 Ultra Preset | |
| Nvidia Titan RTX | |
| MSI RTX 2080 Gaming X Trio | |
| AMD Radeon RX Vega 64 | |
| KFA2 GeForce RTX 2060 Super | |
| AMD Radeon VII | |
| MSI RTX 2070 Gaming Z 8G | |
| MSI RTX 2060 Gaming Z 6G | |
| AMD Radeon RX 5700 XT | |
| AMD Radeon RX 5700 | |
| Nvidia GeForce RTX 2070 Super | |
| Nvidia GeForce RTX 2060 Super | |
| 3840x2160 Ultra Preset | |
| Nvidia Titan RTX | |
| MSI RTX 2080 Gaming X Trio | |
| AMD Radeon VII | |
| MSI RTX 2070 Gaming Z 8G | |
| KFA2 GeForce RTX 2060 Super | |
| AMD Radeon RX Vega 64 | |
| AMD Radeon RX 5700 XT | |
| AMD Radeon RX 5700 | |
| MSI RTX 2060 Gaming Z 6G | |
| Nvidia GeForce RTX 2070 Super | |
| Nvidia GeForce RTX 2060 Super | |
| 2560x1440 Ultra Preset | |
| MSI RTX 2080 Gaming X Trio | |
| KFA2 GeForce RTX 2060 Super | |
| MSI RTX 2070 Gaming Z 8G | |
| AMD Radeon RX 5700 XT | |
| AMD Radeon RX 5700 | |
| Nvidia GeForce RTX 2070 Super | |
| Nvidia GeForce RTX 2060 Super | |
| Farming Simulator 19 | |
| 1920x1080 Very High Preset | |
| KFA2 GeForce RTX 2060 Super | |
| Nvidia Titan RTX | |
| MSI RTX 2080 Gaming X Trio | |
| MSI RTX 2060 Gaming Z 6G | |
| Nvidia GeForce RTX 2070 Super | |
| MSI RTX 2070 Gaming Z 8G | |
| Nvidia GeForce RTX 2060 Super | |
| AMD Radeon RX 5700 XT | |
| AMD Radeon VII | |
| AMD Radeon RX Vega 64 | |
| AMD Radeon RX 5700 | |
| 3840x2160 Very High Preset | |
| Nvidia Titan RTX | |
| MSI RTX 2080 Gaming X Trio | |
| Nvidia GeForce RTX 2070 Super | |
| MSI RTX 2070 Gaming Z 8G | |
| KFA2 GeForce RTX 2060 Super | |
| Nvidia GeForce RTX 2060 Super | |
| MSI RTX 2060 Gaming Z 6G | |
| AMD Radeon RX 5700 XT | |
| AMD Radeon VII | |
| AMD Radeon RX 5700 | |
| AMD Radeon RX Vega 64 | |
| 2560x1440 Very High Preset | |
| MSI RTX 2080 Gaming X Trio | |
| MSI RTX 2070 Gaming Z 8G | |
| Nvidia GeForce RTX 2070 Super | |
| KFA2 GeForce RTX 2060 Super | |
| Nvidia GeForce RTX 2060 Super | |
| AMD Radeon RX 5700 XT | |
| AMD Radeon RX 5700 | |
| Darksiders III | |
| 1920x1080 Epic | |
| Nvidia Titan RTX | |
| MSI RTX 2080 Gaming X Trio | |
| Nvidia GeForce RTX 2070 Super | |
| MSI RTX 2070 Gaming Z 8G | |
| AMD Radeon RX 5700 XT | |
| KFA2 GeForce RTX 2060 Super | |
| AMD Radeon VII | |
| MSI RTX 2060 Gaming Z 6G | |
| Nvidia GeForce RTX 2060 Super | |
| AMD Radeon RX 5700 | |
| AMD Radeon RX Vega 64 | |
| 3840x2160 Epic | |
| Nvidia Titan RTX | |
| MSI RTX 2080 Gaming X Trio | |
| Nvidia GeForce RTX 2070 Super | |
| MSI RTX 2070 Gaming Z 8G | |
| AMD Radeon VII | |
| KFA2 GeForce RTX 2060 Super | |
| AMD Radeon RX 5700 XT | |
| Nvidia GeForce RTX 2060 Super | |
| AMD Radeon RX 5700 | |
| AMD Radeon RX Vega 64 | |
| MSI RTX 2060 Gaming Z 6G | |
| Just Cause 4 | |
| 1920x1080 Very High / On AA:SM AF:16x | |
| Nvidia Titan RTX | |
| MSI RTX 2080 Gaming X Trio | |
| Nvidia GeForce RTX 2070 Super | |
| AMD Radeon RX 5700 XT | |
| MSI RTX 2070 Gaming Z 8G | |
| KFA2 GeForce RTX 2060 Super | |
| Nvidia GeForce RTX 2060 Super | |
| AMD Radeon VII | |
| MSI RTX 2060 Gaming Z 6G | |
| AMD Radeon RX Vega 64 | |
| AMD Radeon RX 5700 | |
| 3840x2160 Very High / On AA:SM AF:16x | |
| Nvidia Titan RTX | |
| MSI RTX 2080 Gaming X Trio | |
| Nvidia GeForce RTX 2070 Super | |
| AMD Radeon VII | |
| AMD Radeon RX 5700 XT | |
| MSI RTX 2070 Gaming Z 8G | |
| Nvidia GeForce RTX 2060 Super | |
| KFA2 GeForce RTX 2060 Super | |
| AMD Radeon RX 5700 | |
| MSI RTX 2060 Gaming Z 6G | |
| AMD Radeon RX Vega 64 | |
| 2560x1440 Very High / On AA:SM AF:16x | |
| MSI RTX 2080 Gaming X Trio | |
| Nvidia GeForce RTX 2070 Super | |
| AMD Radeon RX 5700 XT | |
| MSI RTX 2070 Gaming Z 8G | |
| Nvidia GeForce RTX 2060 Super | |
| AMD Radeon RX 5700 | |
| KFA2 GeForce RTX 2060 Super | |
| Apex Legends | |
| 1920x1080 Maximum Settings AA:TS AF:16x | |
| MSI RTX 2070 Gaming Z 8G | |
| MSI RTX 2080 Gaming X Trio | |
| Nvidia GeForce RTX 2060 Super | |
| Nvidia GeForce RTX 2070 Super | |
| AMD Radeon RX 5700 XT | |
| KFA2 GeForce RTX 2060 Super | |
| AMD Radeon RX 5700 | |
| MSI RTX 2060 Gaming Z 6G | |
| AMD Radeon RX Vega 64 | |
| 3840x2160 Maximum Settings AA:TS AF:16x | |
| MSI RTX 2080 Gaming X Trio | |
| MSI RTX 2070 Gaming Z 8G | |
| Nvidia GeForce RTX 2070 Super | |
| AMD Radeon RX 5700 XT | |
| KFA2 GeForce RTX 2060 Super | |
| Nvidia GeForce RTX 2060 Super | |
| AMD Radeon RX 5700 | |
| AMD Radeon RX Vega 64 | |
| MSI RTX 2060 Gaming Z 6G | |
| 2560x1440 Maximum Settings AA:TS AF:16x | |
| MSI RTX 2070 Gaming Z 8G | |
| MSI RTX 2080 Gaming X Trio | |
| Nvidia GeForce RTX 2070 Super | |
| AMD Radeon RX 5700 XT | |
| KFA2 GeForce RTX 2060 Super | |
| Nvidia GeForce RTX 2060 Super | |
| AMD Radeon RX 5700 | |
| MSI RTX 2060 Gaming Z 6G | |
| AMD Radeon RX Vega 64 | |
| Far Cry New Dawn | |
| 1920x1080 Ultra Preset | |
| KFA2 GeForce RTX 2060 Super | |
| MSI RTX 2080 Gaming X Trio | |
| MSI RTX 2070 Gaming Z 8G | |
| MSI RTX 2060 Gaming Z 6G | |
| Nvidia GeForce RTX 2070 Super | |
| AMD Radeon RX Vega 64 | |
| Nvidia GeForce RTX 2060 Super | |
| AMD Radeon VII | |
| AMD Radeon RX 5700 | |
| AMD Radeon RX 5700 XT | |
| 3840x2160 Ultra Preset | |
| MSI RTX 2080 Gaming X Trio | |
| AMD Radeon VII | |
| Nvidia GeForce RTX 2070 Super | |
| AMD Radeon RX 5700 XT | |
| MSI RTX 2070 Gaming Z 8G | |
| AMD Radeon RX 5700 | |
| Nvidia GeForce RTX 2060 Super | |
| KFA2 GeForce RTX 2060 Super | |
| AMD Radeon RX Vega 64 | |
| MSI RTX 2060 Gaming Z 6G | |
| 2560x1440 Ultra Preset | |
| MSI RTX 2080 Gaming X Trio | |
| Nvidia GeForce RTX 2070 Super | |
| AMD Radeon VII | |
| KFA2 GeForce RTX 2060 Super | |
| MSI RTX 2070 Gaming Z 8G | |
| AMD Radeon RX 5700 XT | |
| AMD Radeon RX Vega 64 | |
| Nvidia GeForce RTX 2060 Super | |
| AMD Radeon RX 5700 | |
| MSI RTX 2060 Gaming Z 6G | |
| Metro Exodus | |
| 1920x1080 Ultra Quality AF:16x | |
| MSI RTX 2080 Gaming X Trio | |
| Nvidia GeForce RTX 2070 Super | |
| AMD Radeon VII | |
| AMD Radeon RX 5700 XT | |
| MSI RTX 2070 Gaming Z 8G | |
| Nvidia GeForce RTX 2060 Super | |
| AMD Radeon RX 5700 | |
| KFA2 GeForce RTX 2060 Super | |
| AMD Radeon RX Vega 64 | |
| MSI RTX 2060 Gaming Z 6G | |
| 3840x2160 Ultra Quality AF:16x | |
| AMD Radeon RX Vega 64 | |
| MSI RTX 2080 Gaming X Trio | |
| AMD Radeon VII | |
| Nvidia GeForce RTX 2070 Super | |
| MSI RTX 2070 Gaming Z 8G | |
| KFA2 GeForce RTX 2060 Super | |
| Nvidia GeForce RTX 2060 Super | |
| AMD Radeon RX 5700 XT | |
| AMD Radeon RX 5700 | |
| MSI RTX 2060 Gaming Z 6G | |
| 2560x1440 Ultra Quality AF:16x | |
| MSI RTX 2080 Gaming X Trio | |
| AMD Radeon VII | |
| AMD Radeon RX 5700 XT | |
| Nvidia GeForce RTX 2070 Super | |
| MSI RTX 2070 Gaming Z 8G | |
| AMD Radeon RX 5700 | |
| Nvidia GeForce RTX 2060 Super | |
| KFA2 GeForce RTX 2060 Super | |
| AMD Radeon RX Vega 64 | |
| MSI RTX 2060 Gaming Z 6G | |
| Anthem | |
| 1920x1080 Ultra Preset | |
| KFA2 GeForce RTX 2060 Super | |
| MSI RTX 2080 Gaming X Trio | |
| AMD Radeon RX Vega 64 | |
| Nvidia GeForce RTX 2070 Super | |
| MSI RTX 2070 Gaming Z 8G | |
| AMD Radeon VII | |
| Nvidia GeForce RTX 2060 Super | |
| MSI RTX 2060 Gaming Z 6G | |
| AMD Radeon RX 5700 XT | |
| AMD Radeon RX 5700 | |
| 2560x1440 Ultra Preset | |
| MSI RTX 2080 Gaming X Trio | |
| AMD Radeon RX 5700 XT | |
| AMD Radeon VII | |
| Nvidia GeForce RTX 2070 Super | |
| KFA2 GeForce RTX 2060 Super | |
| MSI RTX 2070 Gaming Z 8G | |
| AMD Radeon RX 5700 | |
| AMD Radeon RX Vega 64 | |
| Nvidia GeForce RTX 2060 Super | |
| MSI RTX 2060 Gaming Z 6G | |
| Dirt Rally 2.0 | |
| 1920x1080 Ultra Preset AA:T AF:16x | |
| KFA2 GeForce RTX 2060 Super | |
| AMD Radeon RX 5700 XT | |
| Nvidia GeForce RTX 2070 Super | |
| MSI RTX 2080 Gaming X Trio | |
| AMD Radeon VII | |
| AMD Radeon RX 5700 | |
| MSI RTX 2070 Gaming Z 8G | |
| Nvidia GeForce RTX 2060 Super | |
| AMD Radeon RX Vega 64 | |
| MSI RTX 2060 Gaming Z 6G | |
| 3840x2160 Ultra Preset AA:T AF:16x | |
| MSI RTX 2080 Gaming X Trio | |
| KFA2 GeForce RTX 2060 Super | |
| Nvidia GeForce RTX 2070 Super | |
| AMD Radeon VII | |
| AMD Radeon RX 5700 XT | |
| MSI RTX 2070 Gaming Z 8G | |
| AMD Radeon RX 5700 | |
| Nvidia GeForce RTX 2060 Super | |
| AMD Radeon RX Vega 64 | |
| MSI RTX 2060 Gaming Z 6G | |
| 2560x1440 Ultra Preset AA:T AF:16x | |
| KFA2 GeForce RTX 2060 Super | |
| Nvidia GeForce RTX 2070 Super | |
| AMD Radeon RX 5700 XT | |
| MSI RTX 2080 Gaming X Trio | |
| AMD Radeon VII | |
| AMD Radeon RX 5700 | |
| MSI RTX 2070 Gaming Z 8G | |
| Nvidia GeForce RTX 2060 Super | |
| AMD Radeon RX Vega 64 | |
| MSI RTX 2060 Gaming Z 6G | |
| The Division 2 | |
| 1920x1080 Ultra Preset | |
| MSI RTX 2080 Gaming X Trio | |
| MSI RTX 2070 Gaming Z 8G | |
| Nvidia GeForce RTX 2070 Super | |
| AMD Radeon RX 5700 XT | |
| MSI RTX 2060 Gaming Z 6G | |
| Nvidia GeForce RTX 2060 Super | |
| KFA2 GeForce RTX 2060 Super | |
| AMD Radeon RX Vega 64 | |
| AMD Radeon RX 5700 | |
| 3840x2160 Ultra Preset | |
| MSI RTX 2080 Gaming X Trio | |
| MSI RTX 2070 Gaming Z 8G | |
| Nvidia GeForce RTX 2070 Super | |
| AMD Radeon RX 5700 XT | |
| MSI RTX 2060 Gaming Z 6G | |
| AMD Radeon RX Vega 64 | |
| Nvidia GeForce RTX 2060 Super | |
| KFA2 GeForce RTX 2060 Super | |
| AMD Radeon RX 5700 | |
| 2560x1440 Ultra Preset | |
| MSI RTX 2080 Gaming X Trio | |
| MSI RTX 2070 Gaming Z 8G | |
| Nvidia GeForce RTX 2070 Super | |
| AMD Radeon RX 5700 XT | |
| MSI RTX 2060 Gaming Z 6G | |
| Nvidia GeForce RTX 2060 Super | |
| KFA2 GeForce RTX 2060 Super | |
| AMD Radeon RX Vega 64 | |
| AMD Radeon RX 5700 | |
| Anno 1800 | |
| 3840x2160 Ultra Graphics Quality (DX11) | |
| MSI RTX 2080 Gaming X Trio | |
| Nvidia GeForce RTX 2070 Super | |
| KFA2 GeForce RTX 2060 Super | |
| MSI RTX 2070 Gaming Z 8G | |
| AMD Radeon RX 5700 XT | |
| Nvidia GeForce RTX 2060 Super | |
| AMD Radeon RX 5700 | |
| MSI RTX 2060 Gaming Z 6G | |
| AMD Radeon RX Vega 64 | |
| 1920x1080 Ultra Graphics Quality (DX11) | |
| MSI RTX 2080 Gaming X Trio | |
| Nvidia GeForce RTX 2070 Super | |
| AMD Radeon RX 5700 XT | |
| MSI RTX 2070 Gaming Z 8G | |
| MSI RTX 2060 Gaming Z 6G | |
| Nvidia GeForce RTX 2060 Super | |
| AMD Radeon RX 5700 | |
| KFA2 GeForce RTX 2060 Super | |
| AMD Radeon RX Vega 64 | |
| 2560x1440 Ultra Graphics Quality (DX11) | |
| MSI RTX 2080 Gaming X Trio | |
| Nvidia GeForce RTX 2070 Super | |
| AMD Radeon RX 5700 XT | |
| MSI RTX 2070 Gaming Z 8G | |
| Nvidia GeForce RTX 2060 Super | |
| AMD Radeon RX 5700 | |
| MSI RTX 2060 Gaming Z 6G | |
| KFA2 GeForce RTX 2060 Super | |
| AMD Radeon RX Vega 64 | |
| Rage 2 | |
| 3840x2160 Ultra Preset (Resolution Scale Off) | |
| MSI RTX 2080 Gaming X Trio | |
| Nvidia GeForce RTX 2070 Super | |
| KFA2 GeForce RTX 2060 Super | |
| MSI RTX 2070 Gaming Z 8G | |
| AMD Radeon RX 5700 XT | |
| Nvidia GeForce RTX 2060 Super | |
| AMD Radeon RX Vega 64 | |
| AMD Radeon RX 5700 | |
| MSI RTX 2060 Gaming Z 6G | |
| 1920x1080 Ultra Preset (Resolution Scale Off) | |
| MSI RTX 2080 Gaming X Trio | |
| Nvidia GeForce RTX 2070 Super | |
| KFA2 GeForce RTX 2060 Super | |
| MSI RTX 2070 Gaming Z 8G | |
| AMD Radeon RX Vega 64 | |
| Nvidia GeForce RTX 2060 Super | |
| AMD Radeon RX 5700 XT | |
| MSI RTX 2060 Gaming Z 6G | |
| 2560x1440 Ultra Preset (Resolution Scale Off) | |
| MSI RTX 2080 Gaming X Trio | |
| Nvidia GeForce RTX 2070 Super | |
| KFA2 GeForce RTX 2060 Super | |
| MSI RTX 2070 Gaming Z 8G | |
| AMD Radeon RX Vega 64 | |
| Nvidia GeForce RTX 2060 Super | |
| AMD Radeon RX 5700 XT | |
| AMD Radeon RX 5700 | |
| MSI RTX 2060 Gaming Z 6G | |
| F1 2019 | |
| 3840x2160 Ultra High Preset AA:T AF:16x | |
| Nvidia GeForce RTX 2070 Super | |
| AMD Radeon RX 5700 XT | |
| AMD Radeon RX 5700 | |
| Nvidia GeForce RTX 2060 Super | |
| KFA2 GeForce RTX 2060 Super | |
| AMD Radeon RX Vega 64 | |
| 1920x1080 Ultra High Preset AA:T AF:16x | |
| AMD Radeon RX 5700 XT | |
| Nvidia GeForce RTX 2070 Super | |
| AMD Radeon RX Vega 64 | |
| AMD Radeon RX 5700 | |
| KFA2 GeForce RTX 2060 Super | |
| Nvidia GeForce RTX 2060 Super | |
| 2560x1440 Ultra High Preset AA:T AF:16x | |
| Nvidia GeForce RTX 2070 Super | |
| AMD Radeon RX 5700 XT | |
| AMD Radeon RX 5700 | |
| KFA2 GeForce RTX 2060 Super | |
| Nvidia GeForce RTX 2060 Super | |
| AMD Radeon RX Vega 64 | |
| låg | med. | hög | ultra | QHD | 4K | |
|---|---|---|---|---|---|---|
| BioShock Infinite (2013) | 391.6 | 340.4 | 318.3 | 184 | ||
| Battlefield 4 (2013) | 200 | 199 | 199 | 180 | 94 | |
| GTA V (2015) | 178 | 172 | 160 | 90 | 89 | |
| The Witcher 3 (2015) | 373 | 258 | 160 | 83 | 58.1 | |
| Dota 2 Reborn (2015) | 166.2 | 151.9 | 146.2 | 136.6 | 116.3 | |
| Rainbow Six Siege (2015) | 448 | 351 | 278 | 245 | 113 | |
| Rise of the Tomb Raider (2016) | 316 | 216 | 156 | 129 | 53.5 | |
| Far Cry Primal (2016) | 116 | 107 | 98 | 91 | 56 | |
| The Division (2016) | 294.2 | 225.2 | 116.6 | 95.7 | 54 | |
| Doom (2016) | 190 | 183 | 174 | 169 | 78 | |
| Overwatch (2016) | 300 | 300 | 298 | 212 | 117 | |
| Deus Ex Mankind Divided (2016) | 128.5 | 119.9 | 101.8 | 65.4 | 40.7 | |
| Dishonored 2 (2016) | 119 | 119 | 119 | 113 | 60 | |
| Watch Dogs 2 (2016) | 154 | 136 | 103 | 73 | 43 | |
| For Honor (2017) | 341.5 | 183.2 | 175.2 | 135.2 | 58.6 | |
| Ghost Recon Wildlands (2017) | 166 | 115 | 106 | 62 | 44 | |
| Rocket League (2017) | 238 | 237 | 235 | 138 | ||
| Dirt 4 (2017) | 281 | 218 | 188 | 129 | 75 | |
| Playerunknown's Battlegrounds (PUBG) (2017) | 165 | 130 | 130 | 118 | 50.4 | |
| Destiny 2 (2017) | 179 | 179 | 171 | 151 | 105 | 55.5 |
| Assassin´s Creed Origins (2017) | 143 | 112 | 103 | 87 | 69 | 44 |
| Call of Duty WWII (2017) | 226 | 221 | 143 | 125 | 104 | 66 |
| Fortnite (2018) | 424 | 316 | 171 | 137 | 95 | 46.6 |
| Final Fantasy XV Benchmark (2018) | 178 | 112 | 80 | 34.9 | ||
| Kingdom Come: Deliverance (2018) | 136 | 124 | 104 | 71 | 56.6 | 29.9 |
| X-Plane 11.11 (2018) | 127 | 114 | 92 | 79 | ||
| Far Cry 5 (2018) | 142 | 119 | 115 | 108 | 85 | 45 |
| The Crew 2 (2018) | 60 | 60 | 60 | 60 | 60 | 37 |
| Monster Hunter World (2018) | 123 | 114 | 111 | 87 | 79 | 41.8 |
| F1 2018 (2018) | 265 | 213 | 173 | 124 | 96 | 61 |
| Shadow of the Tomb Raider (2018) | 147 | 121 | 114 | 104 | 70 | 37 |
| FIFA 19 (2018) | 364 | 361 | 318 | 320 | 306 | 192 |
| Forza Horizon 4 (2018) | 193 | 167 | 159 | 129 | 105 | 71 |
| Assassin´s Creed Odyssey (2018) | 132 | 105 | 88 | 61 | 52 | 36 |
| Call of Duty Black Ops 4 (2018) | 284 | 163 | 154 | 143 | 95 | 46.2 |
| Hitman 2 (2018) | 98 | 93 | 86 | 84 | 72 | 38.9 |
| Battlefield V (2018) | 183 | 160 | 145 | 134 | 104 | 61 |
| Farming Simulator 19 (2018) | 248 | 181 | 156 | 143 | 118 | 67 |
| Darksiders III (2018) | 248 | 151 | 132 | 120 | 83 | 42.5 |
| Just Cause 4 (2018) | 193 | 144 | 110 | 103 | 72 | 41 |
| Apex Legends (2019) | 144 | 144 | 144 | 144 | 116 | 65 |
| Far Cry New Dawn (2019) | 129 | 111 | 107 | 96 | 83 | 48 |
| Metro Exodus (2019) | 139 | 93 | 70 | 58 | 46 | 30 |
| Anthem (2019) | 120 | 118 | 111 | 109 | 79 | 43.7 |
| Dirt Rally 2.0 (2019) | 268 | 211 | 192 | 124 | 95 | 56 |
| The Division 2 (2019) | 201 | 143 | 116 | 85 | 59 | 32 |
| Anno 1800 (2019) | 103 | 102 | 74 | 36.5 | 32 | 28.2 |
| Rage 2 (2019) | 248 | 135 | 114 | 112 | 73 | 35.8 |
| F1 2019 (2019) | 221 | 196 | 170 | 123 | 97 | 58 |
| LuxMark v2.0 64Bit | |
| Room GPUs-only | |
| Nvidia Titan RTX | |
| AMD Radeon VII | |
| MSI RTX 2080 Gaming X Trio | |
| Nvidia GeForce RTX 2070 Super | |
| MSI RTX 2070 Gaming Z 8G | |
| KFA2 GeForce RTX 2060 Super | |
| Nvidia GeForce RTX 2060 Super | |
| MSI RTX 2060 Gaming Z 6G | |
| AMD Radeon RX 5700 XT | |
| AMD Radeon RX 5700 | |
| Sala GPUs-only | |
| Nvidia Titan RTX | |
| MSI RTX 2080 Gaming X Trio | |
| Nvidia GeForce RTX 2070 Super | |
| MSI RTX 2070 Gaming Z 8G | |
| KFA2 GeForce RTX 2060 Super | |
| Nvidia GeForce RTX 2060 Super | |
| AMD Radeon VII | |
| AMD Radeon RX 5700 XT | |
| MSI RTX 2060 Gaming Z 6G | |
| AMD Radeon RX 5700 | |
| SiSoft Sandra 2016 | |
| Image Processing | |
| AMD Radeon VII | |
| MSI RTX 2080 Gaming X Trio | |
| Nvidia GeForce RTX 2070 Super | |
| MSI RTX 2070 Gaming Z 8G | |
| KFA2 GeForce RTX 2060 Super | |
| Nvidia GeForce RTX 2060 Super | |
| AMD Radeon RX 5700 XT | |
| MSI RTX 2060 Gaming Z 6G | |
| AMD Radeon RX 5700 | |
| GP Cryptography (Higher Security AES256+SHA2-512) | |
| MSI RTX 2080 Gaming X Trio | |
| AMD Radeon VII | |
| Nvidia GeForce RTX 2070 Super | |
| MSI RTX 2070 Gaming Z 8G | |
| Nvidia GeForce RTX 2060 Super | |
| KFA2 GeForce RTX 2060 Super | |
| MSI RTX 2060 Gaming Z 6G | |
| GP Financial Analysis (FP High/Double Precision) | |
| AMD Radeon VII | |
| MSI RTX 2080 Gaming X Trio | |
| Nvidia GeForce RTX 2070 Super | |
| MSI RTX 2070 Gaming Z 8G | |
| KFA2 GeForce RTX 2060 Super | |
| Nvidia GeForce RTX 2060 Super | |
| MSI RTX 2060 Gaming Z 6G | |
| AMD Radeon RX 5700 XT | |
| AMD Radeon RX 5700 | |
| Power Consumption | |
| 1920x1080 The Witcher 3 ultra (external Monitor) | |
| Nvidia Titan RTX | |
| AMD Radeon RX Vega 64 (Idle: 74.3 W) | |
| MSI RTX 2080 Gaming X Trio (Idle: 87.78 W) | |
| AMD Radeon RX 5700 XT (Idle: 69.8 W) | |
| Nvidia GeForce RTX 2070 Super (96.8 fps, Idle: 80.5 W) | |
| MSI RTX 2070 Gaming Z 8G (Idle: 73.3 W) | |
| AMD Radeon VII (Idle: 81.39 W) | |
| KFA2 GeForce RTX 2060 Super (81.7 fps, Idle: 93.8 W) | |
| Nvidia GeForce RTX 2060 Super (82.7 fps, Idle: 77.12 W) | |
| AMD Radeon RX 5700 (84.2 fps, Idle: 64.5 W) | |
| MSI RTX 2060 Gaming Z 6G (Idle: 74.66 W) | |
| 1280x720 FurMark 1.19 GPU Stress Test (external Monitor) | |
| AMD Radeon VII (Idle: 81.39 W) | |
| MSI RTX 2080 Gaming X Trio | |
| MSI RTX 2070 Gaming Z 8G (Idle: 73.3 W) | |
| AMD Radeon RX 5700 XT (239 fps, Idle: 69.8 W) | |
| Nvidia GeForce RTX 2070 Super (283 fps, Idle: 80.5 W) | |
| KFA2 GeForce RTX 2060 Super (234 fps, Idle: 93.8 W) | |
| MSI RTX 2060 Gaming Z 6G (Idle: 74.66 W) | |
| Nvidia GeForce RTX 2060 Super (237 fps, Idle: 77.12 W) | |
| AMD Radeon RX 5700 (207 fps, Idle: 64.5 W) | |
* ... mindre är bättre
För
Emot
Läs den fullständiga versionen av den här recensionen på engelska här.
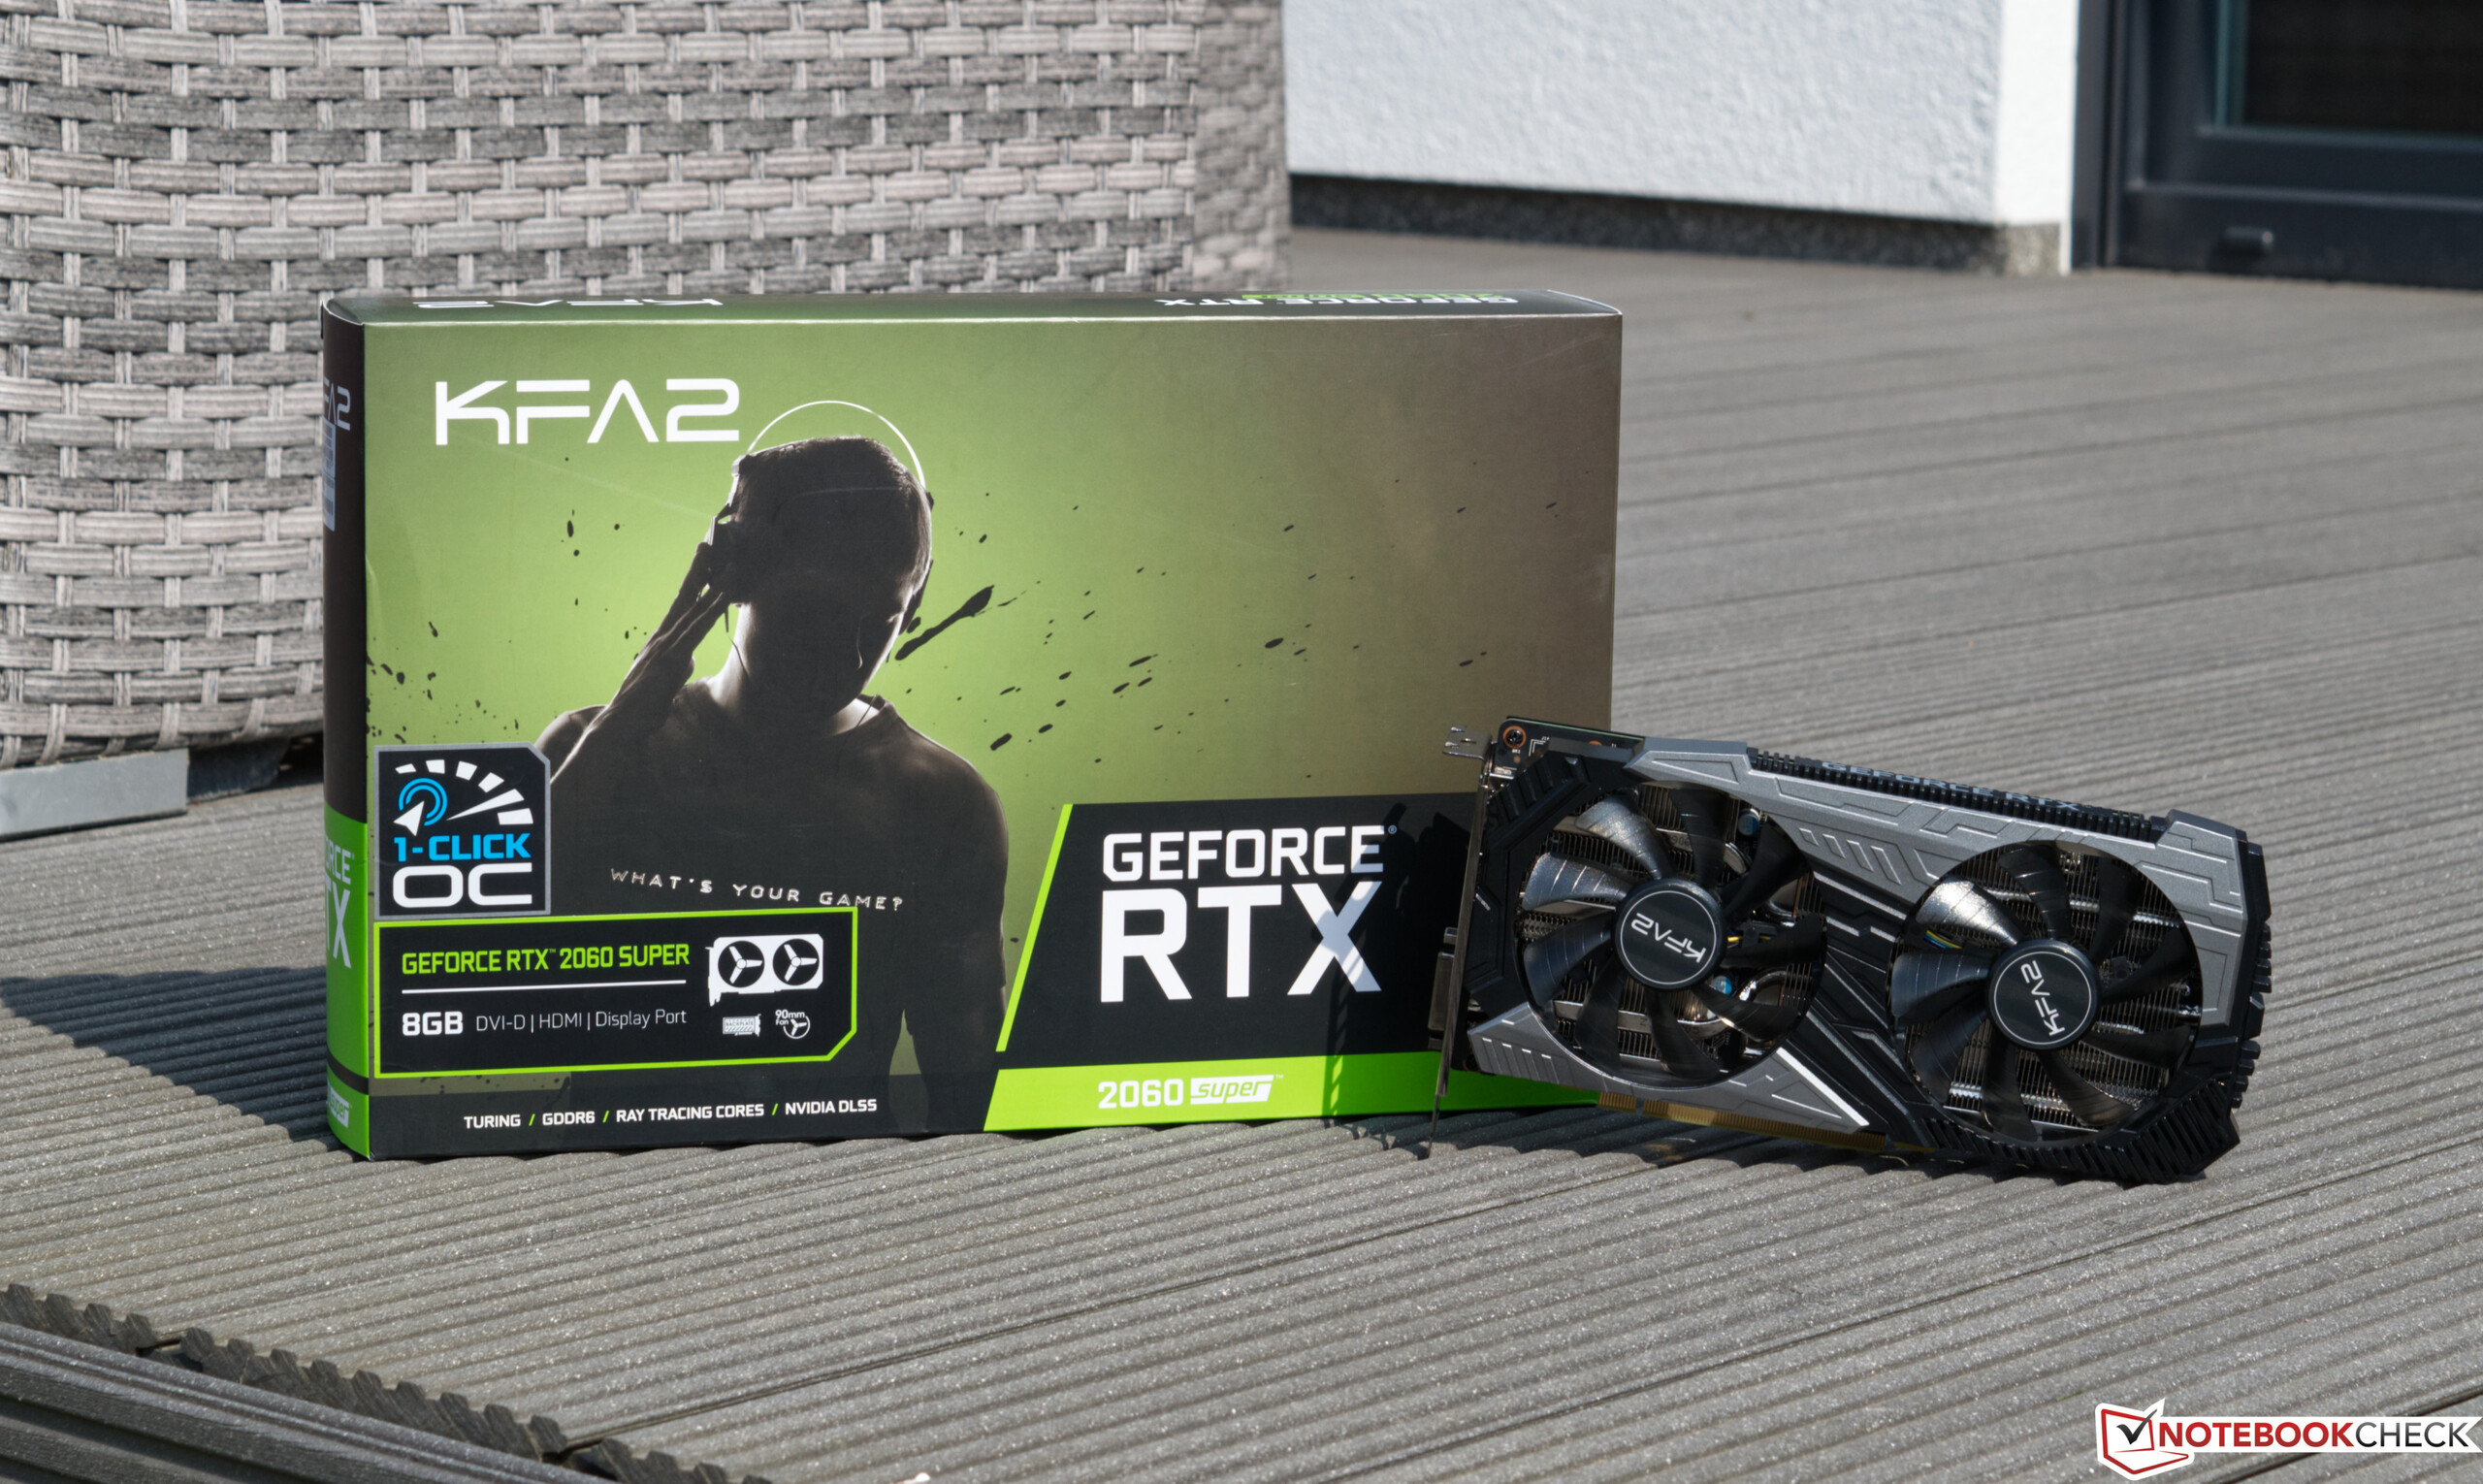
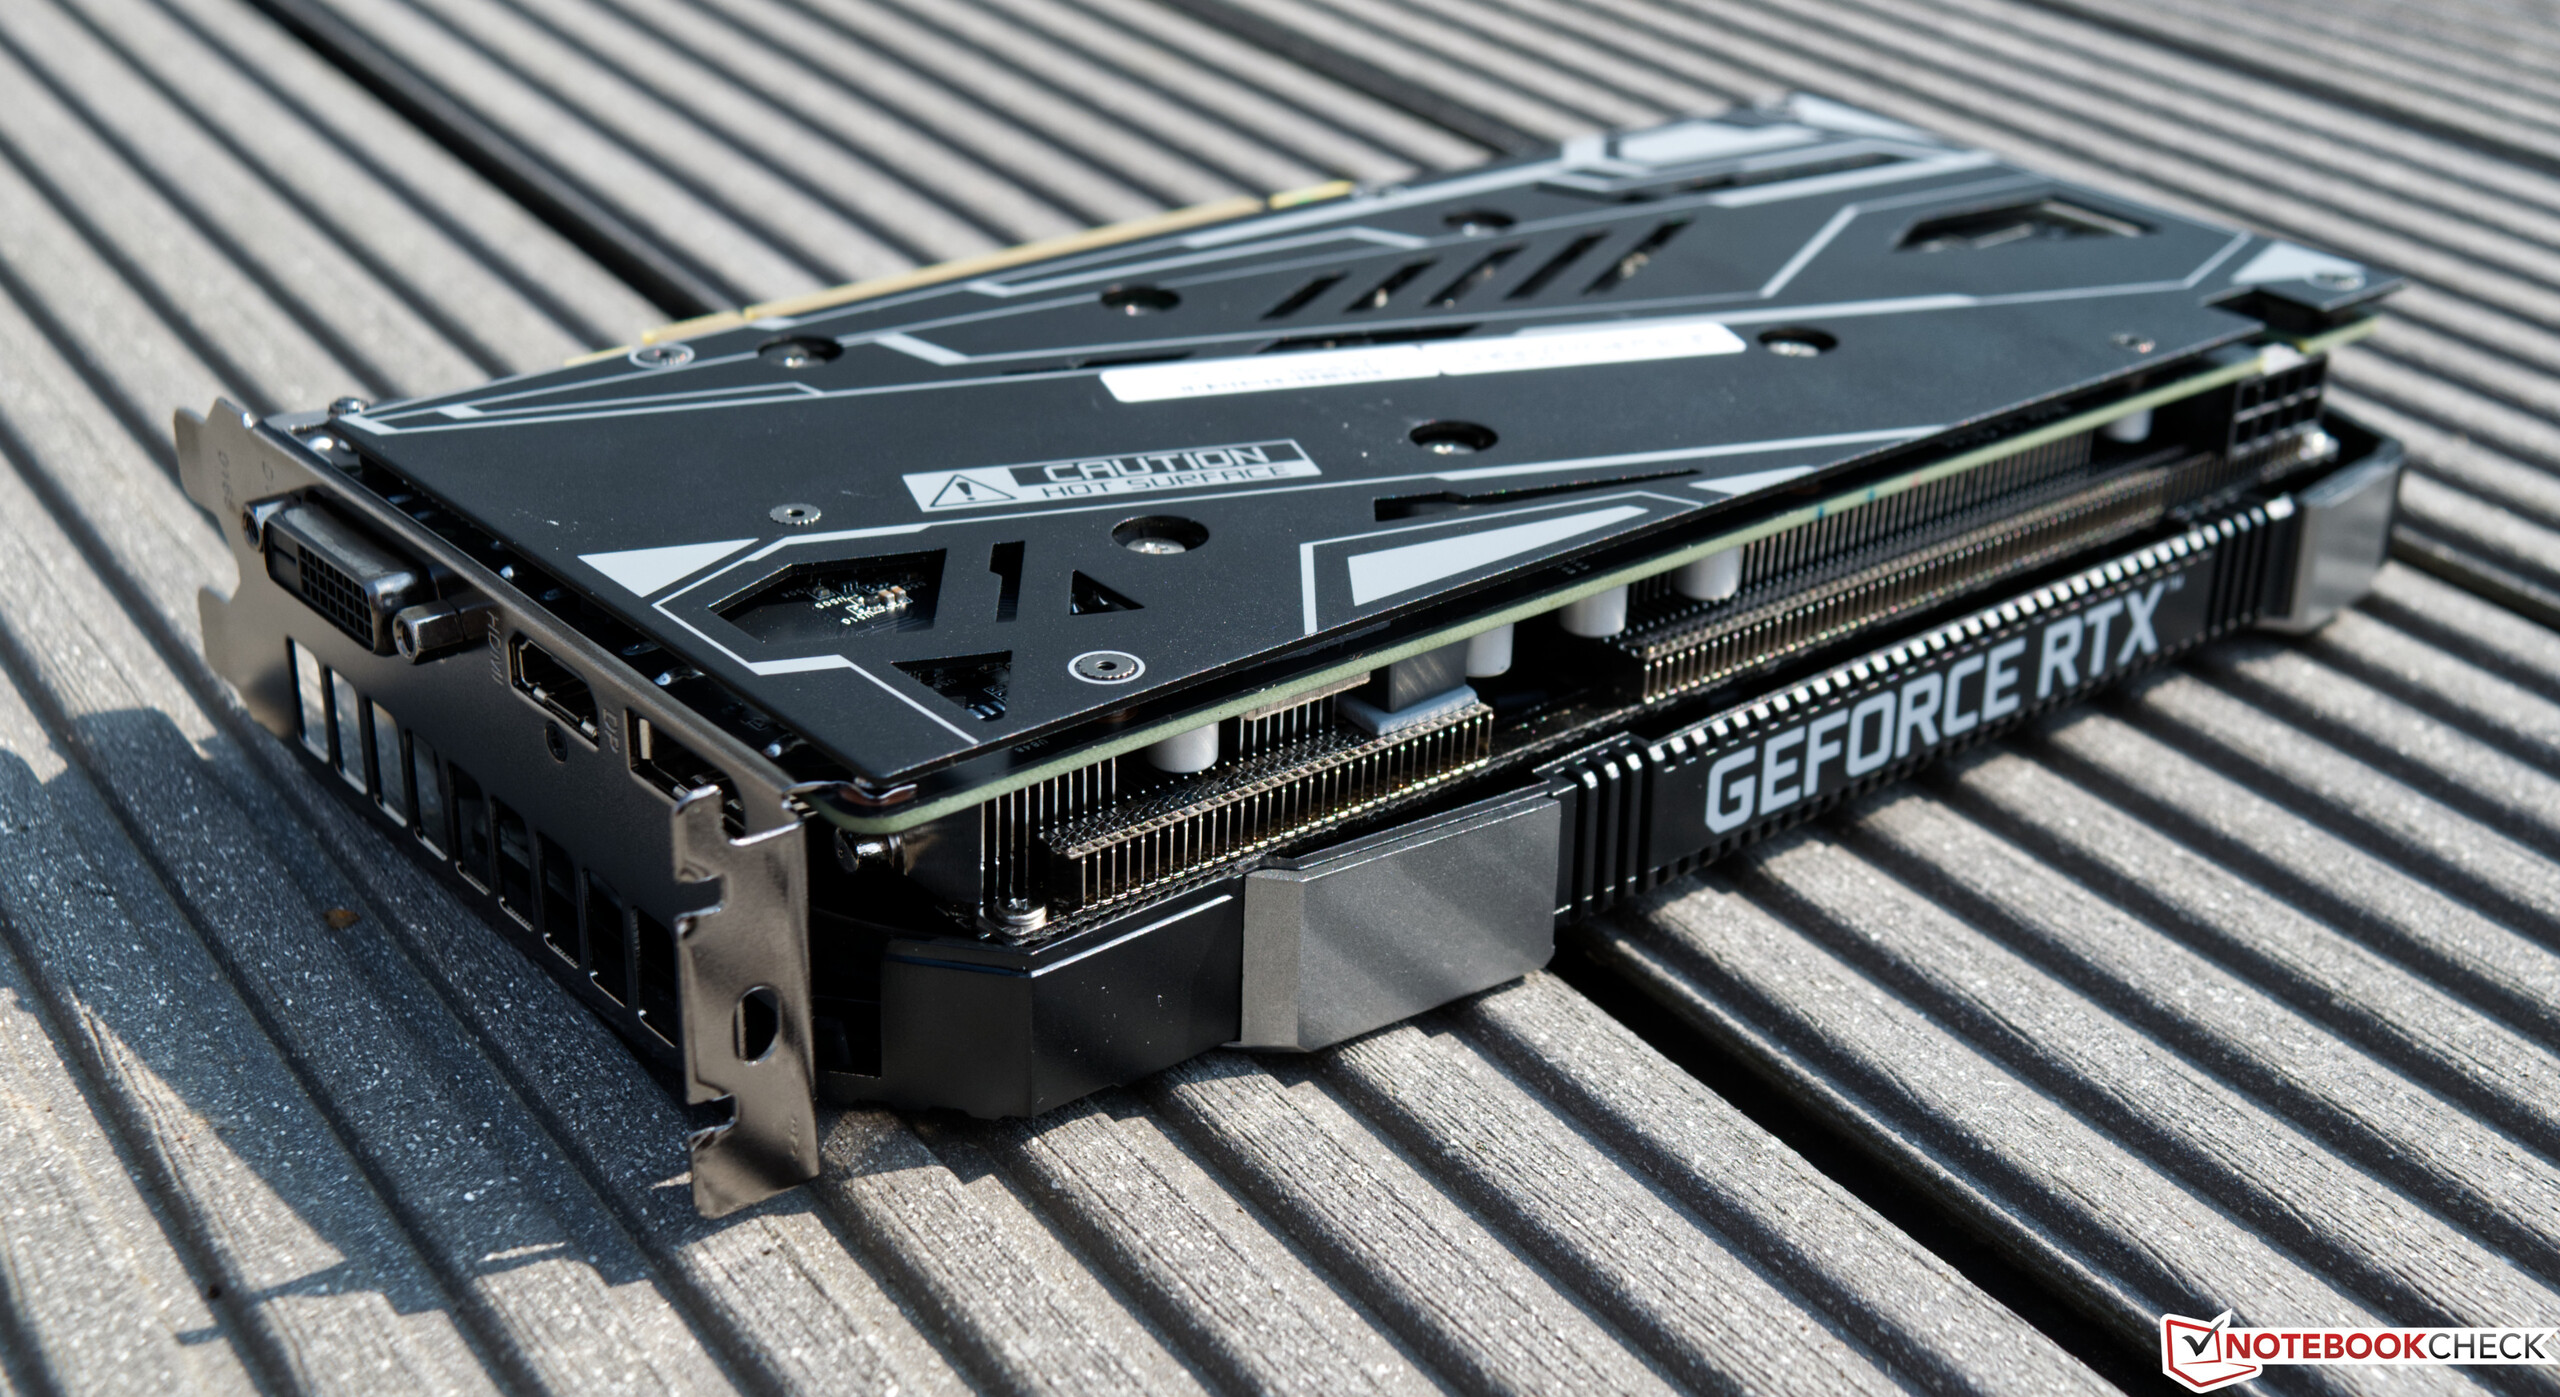
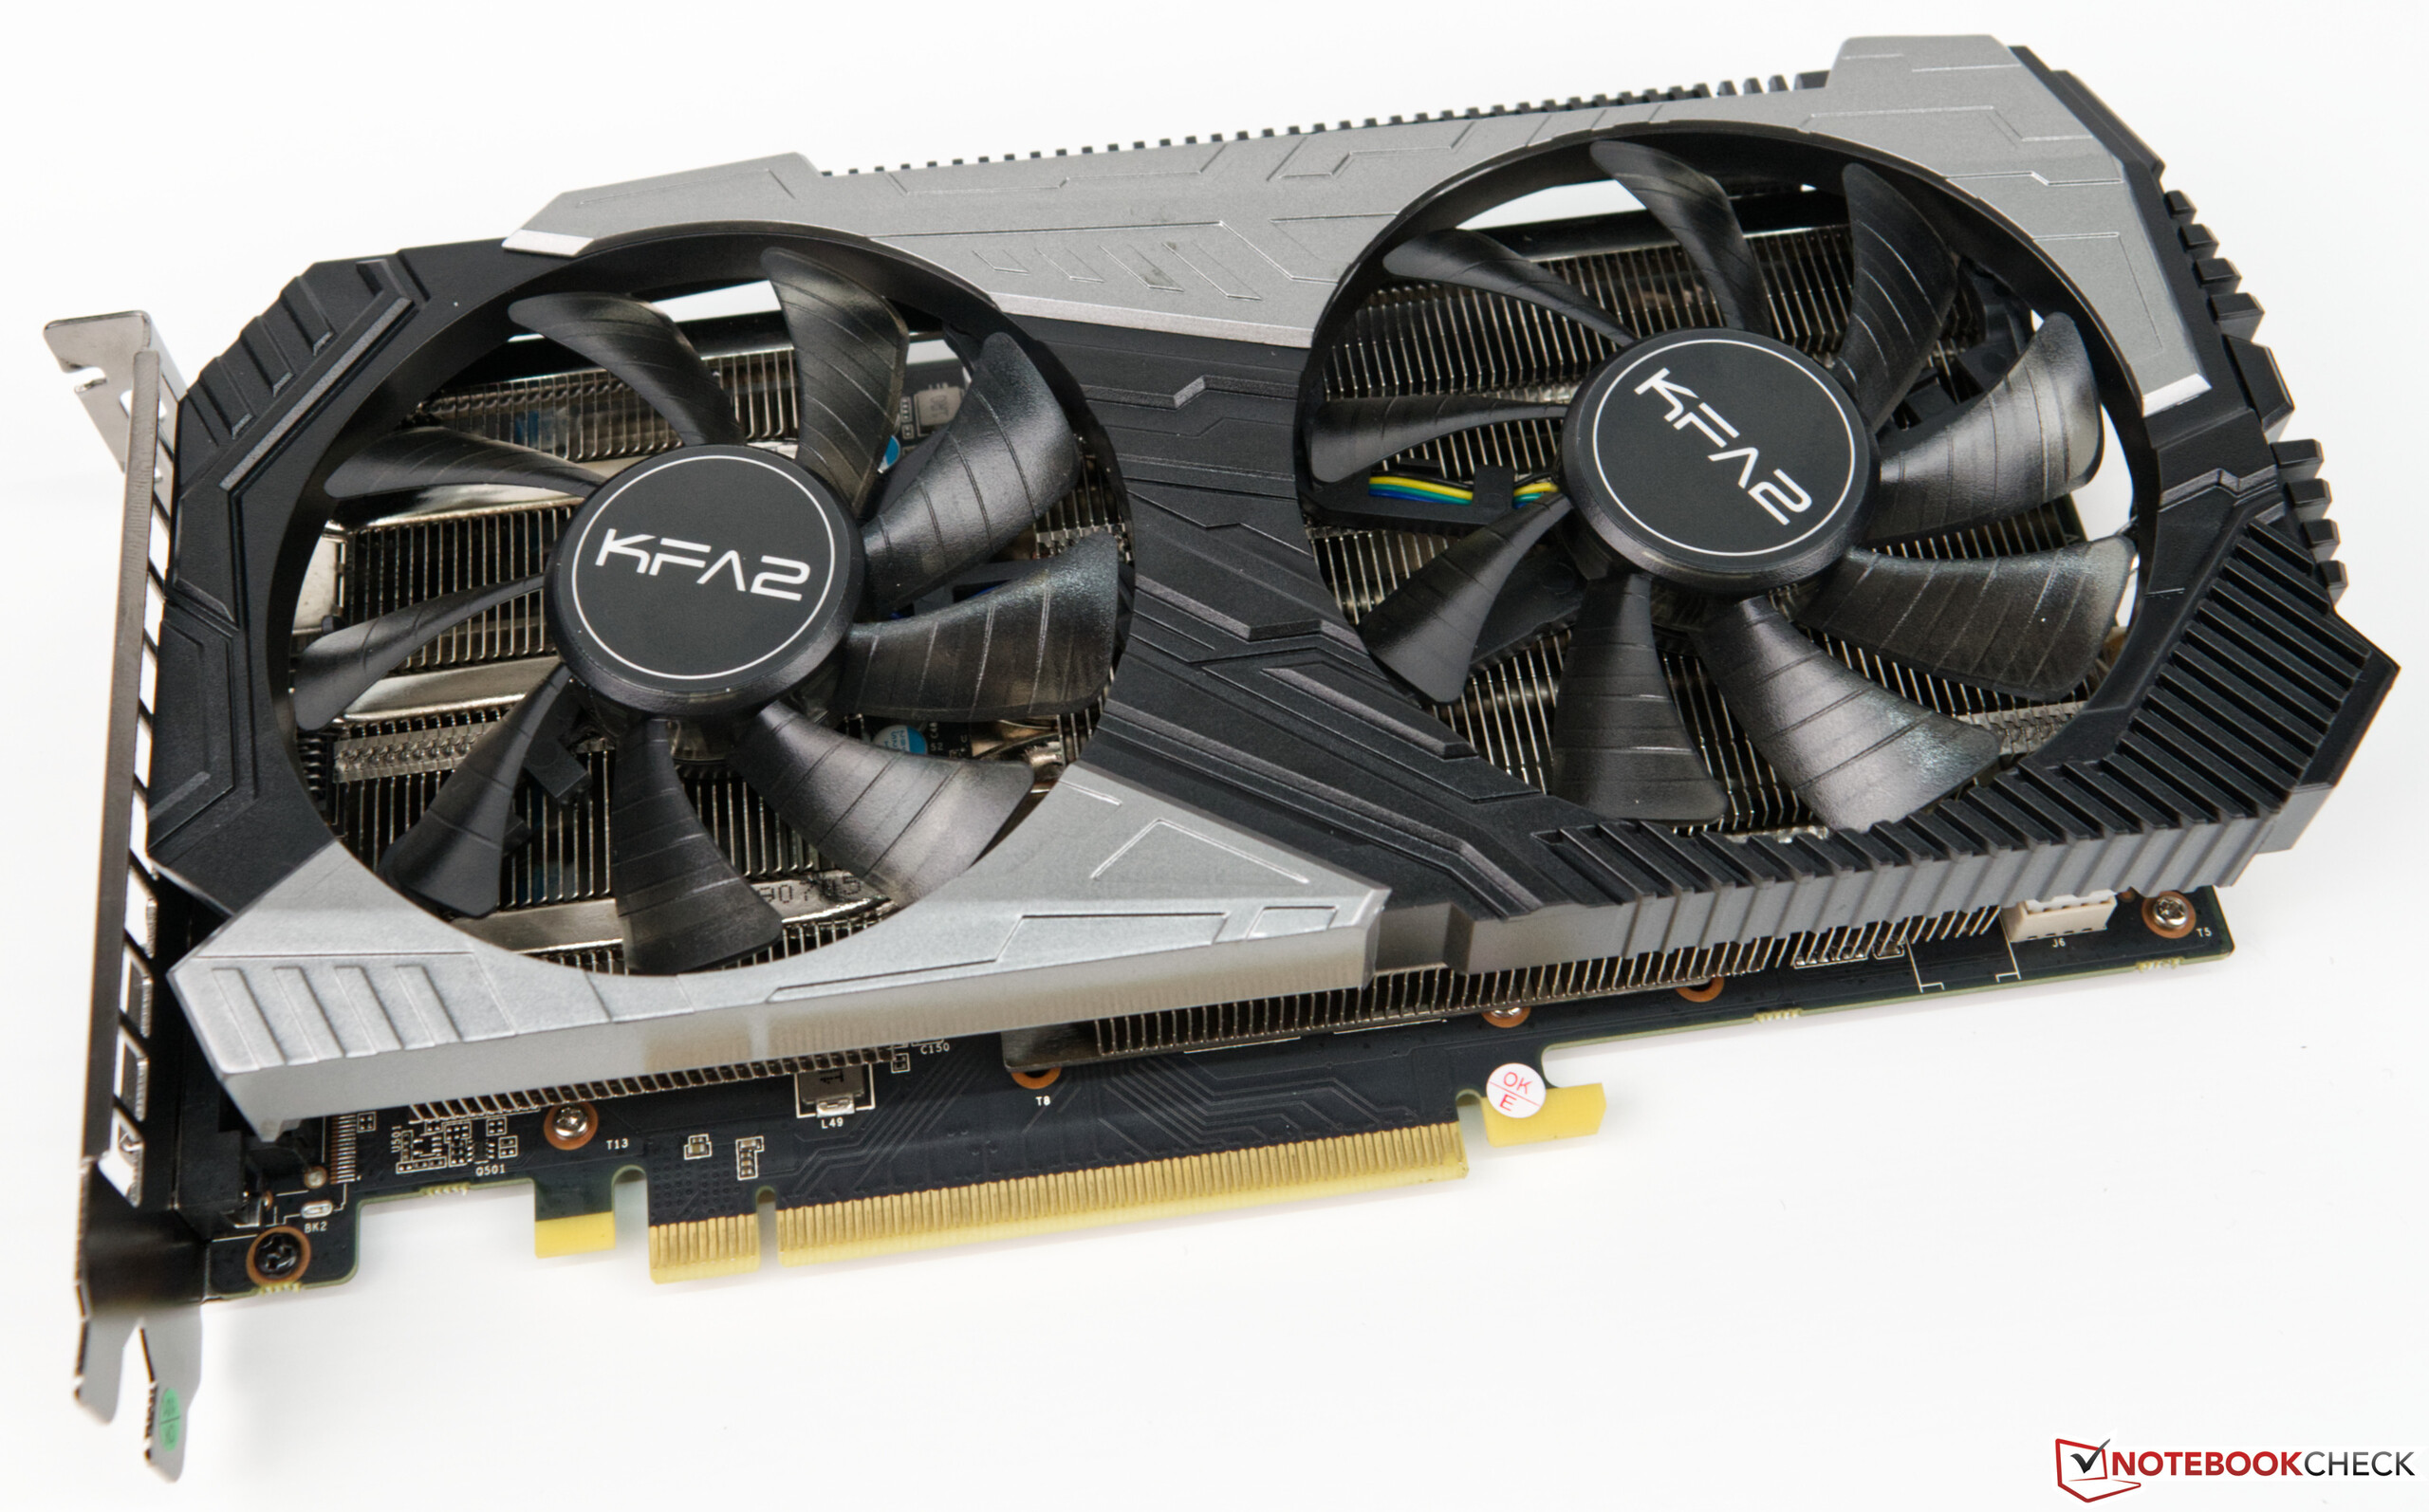
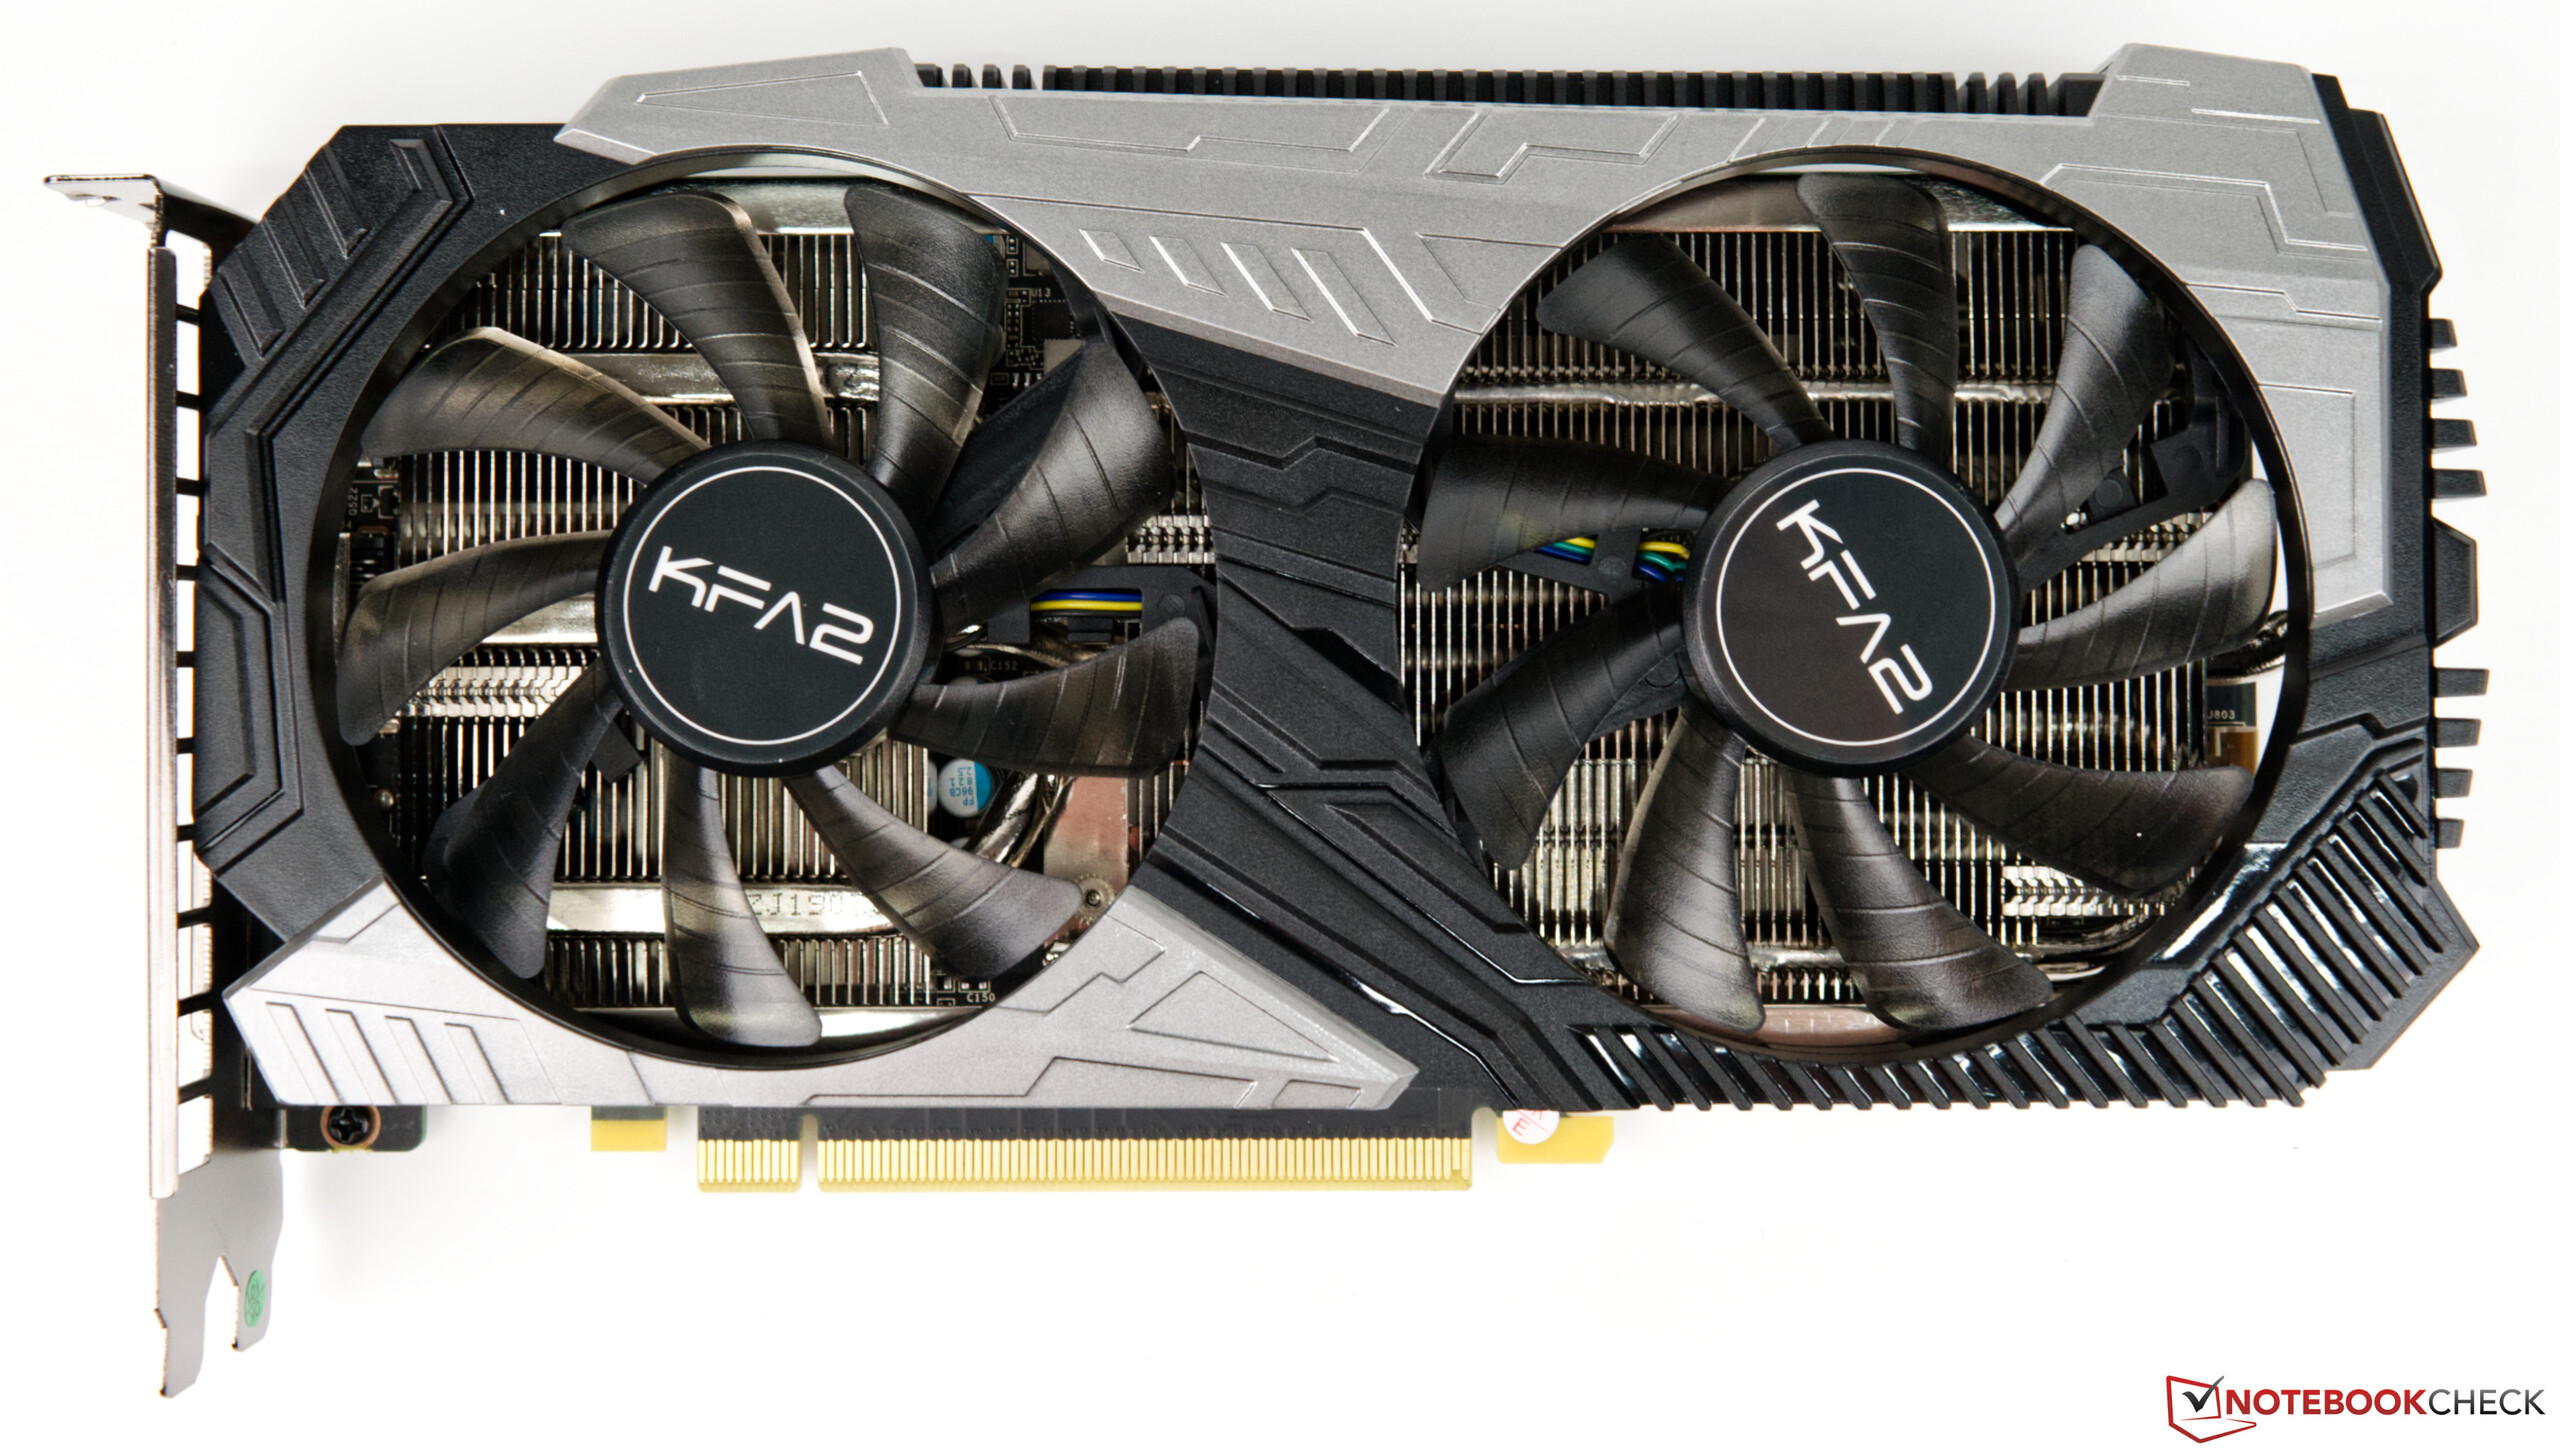
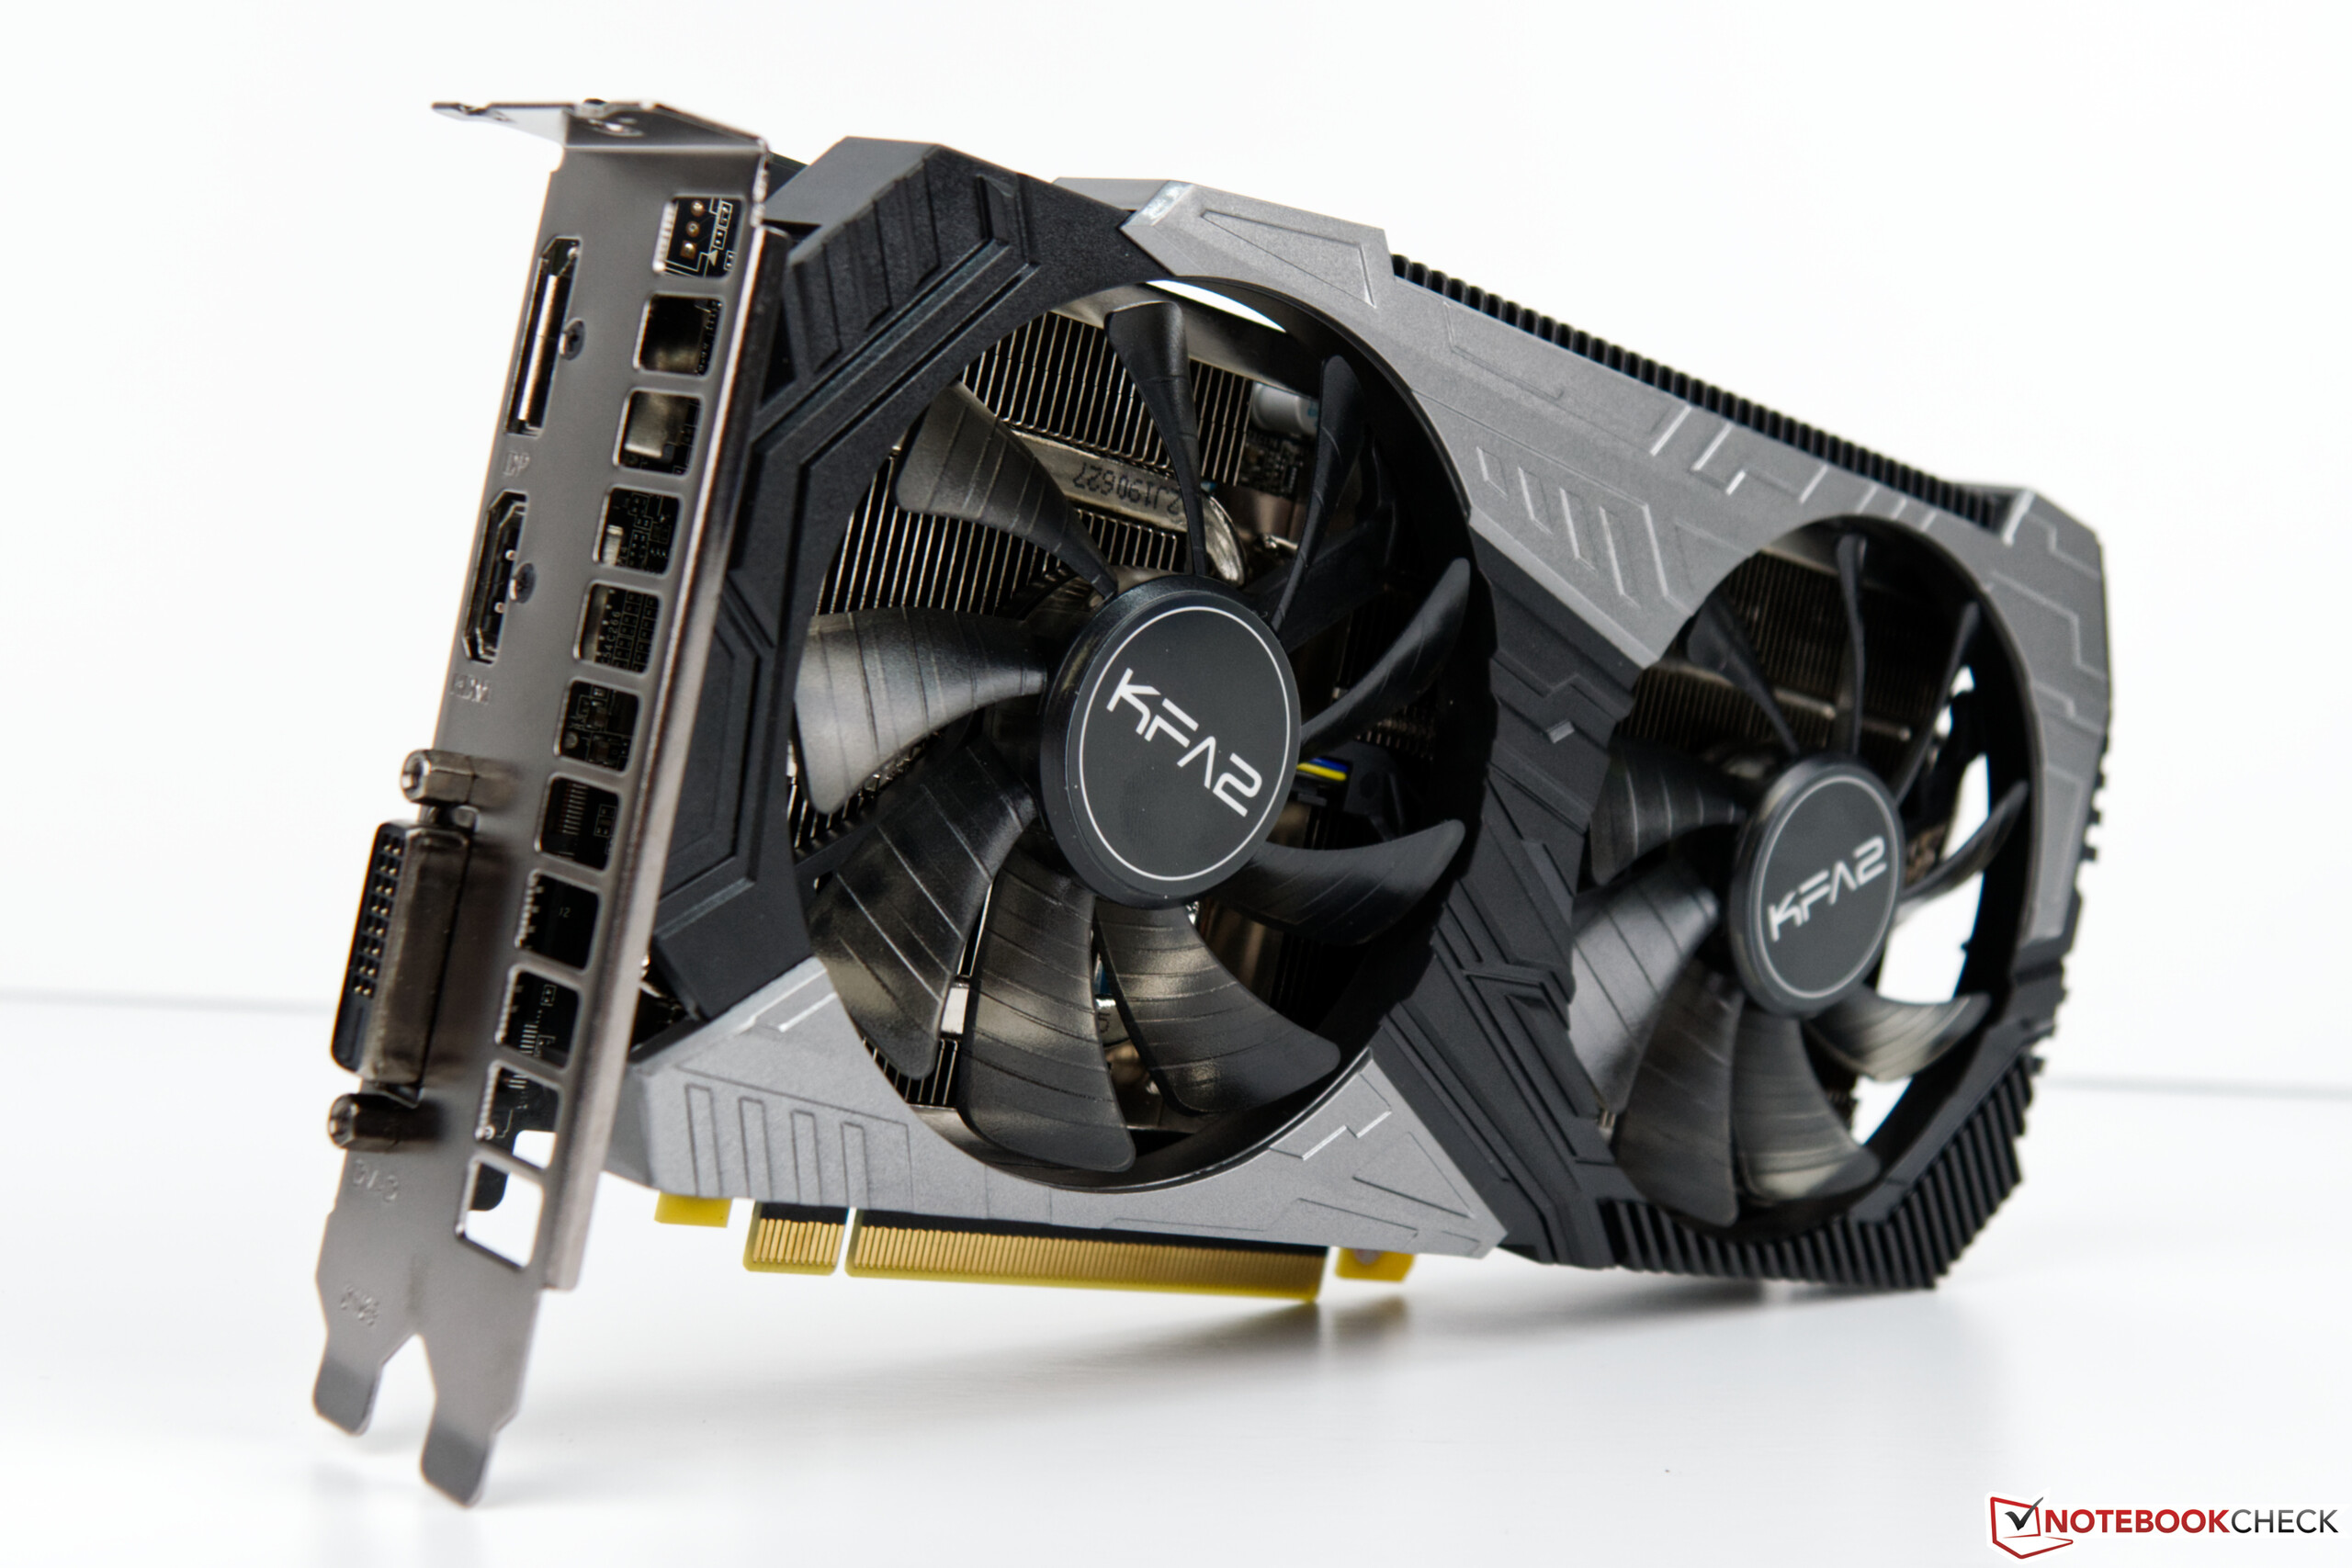
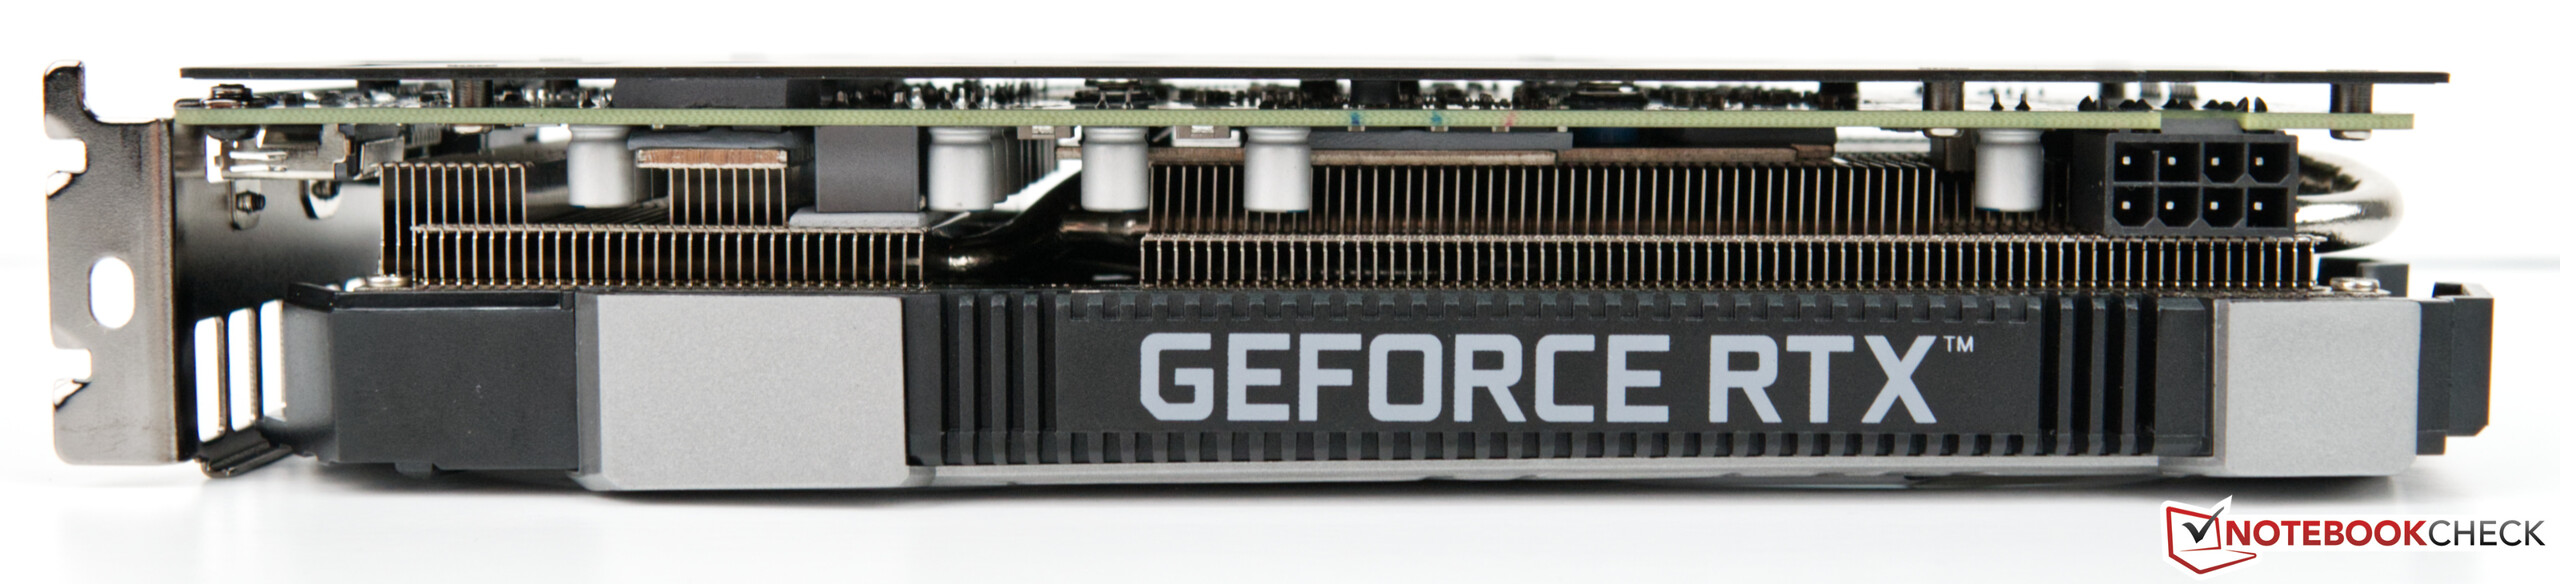
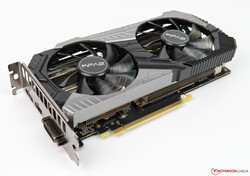
KFA2 GeForce RTX 2060 Super är ett av de billigaste grafikkorten på marknaden. Vid skrivande stund kan kortet köpas för runt 3.900 kronor, vilket är 400 kronor mindre än Nvidias Founders Edition. Eftersom båda pixelacceleratorerna körs i samma hastighet behöver man inte kompromissa med prestandan. Men med det sagt kan man heller inte förvänta sig att få mer prestanda ur KFA2-modellen eftersom även den är begränsad av en 175 watt BIOS. 1-click OC-versionen levereras utan någon LED-belysning och riktar sig antagligen åt köpare som föredrar sin PC utan julbelysning. Avsaknaden av LED-belysning kan till och med vara en fördel eftersom grafikkortet har mer kraft att tillgå även efter att man räknat in vad de två fläktarna förbrukar.
Med 8 GB GDDR6 VRAM passar grafikkortet bra till alla moderna spel. Prestandan är tillräckligt hög för Full HD och WQHD även om 32 FPS i Anno 1800 är mindre än vi hade önskat oss. Men genom att sänka grafikinställningarna en aning från max-nivån når bilduppdateringen i det spelet en mer spelbar nivå. Detta gäller också högre upplösningar, som i huvudsak är reserverade för snabbare kort och inte är tänkta för den målgrupp RTX 2060S riktar sig åt.
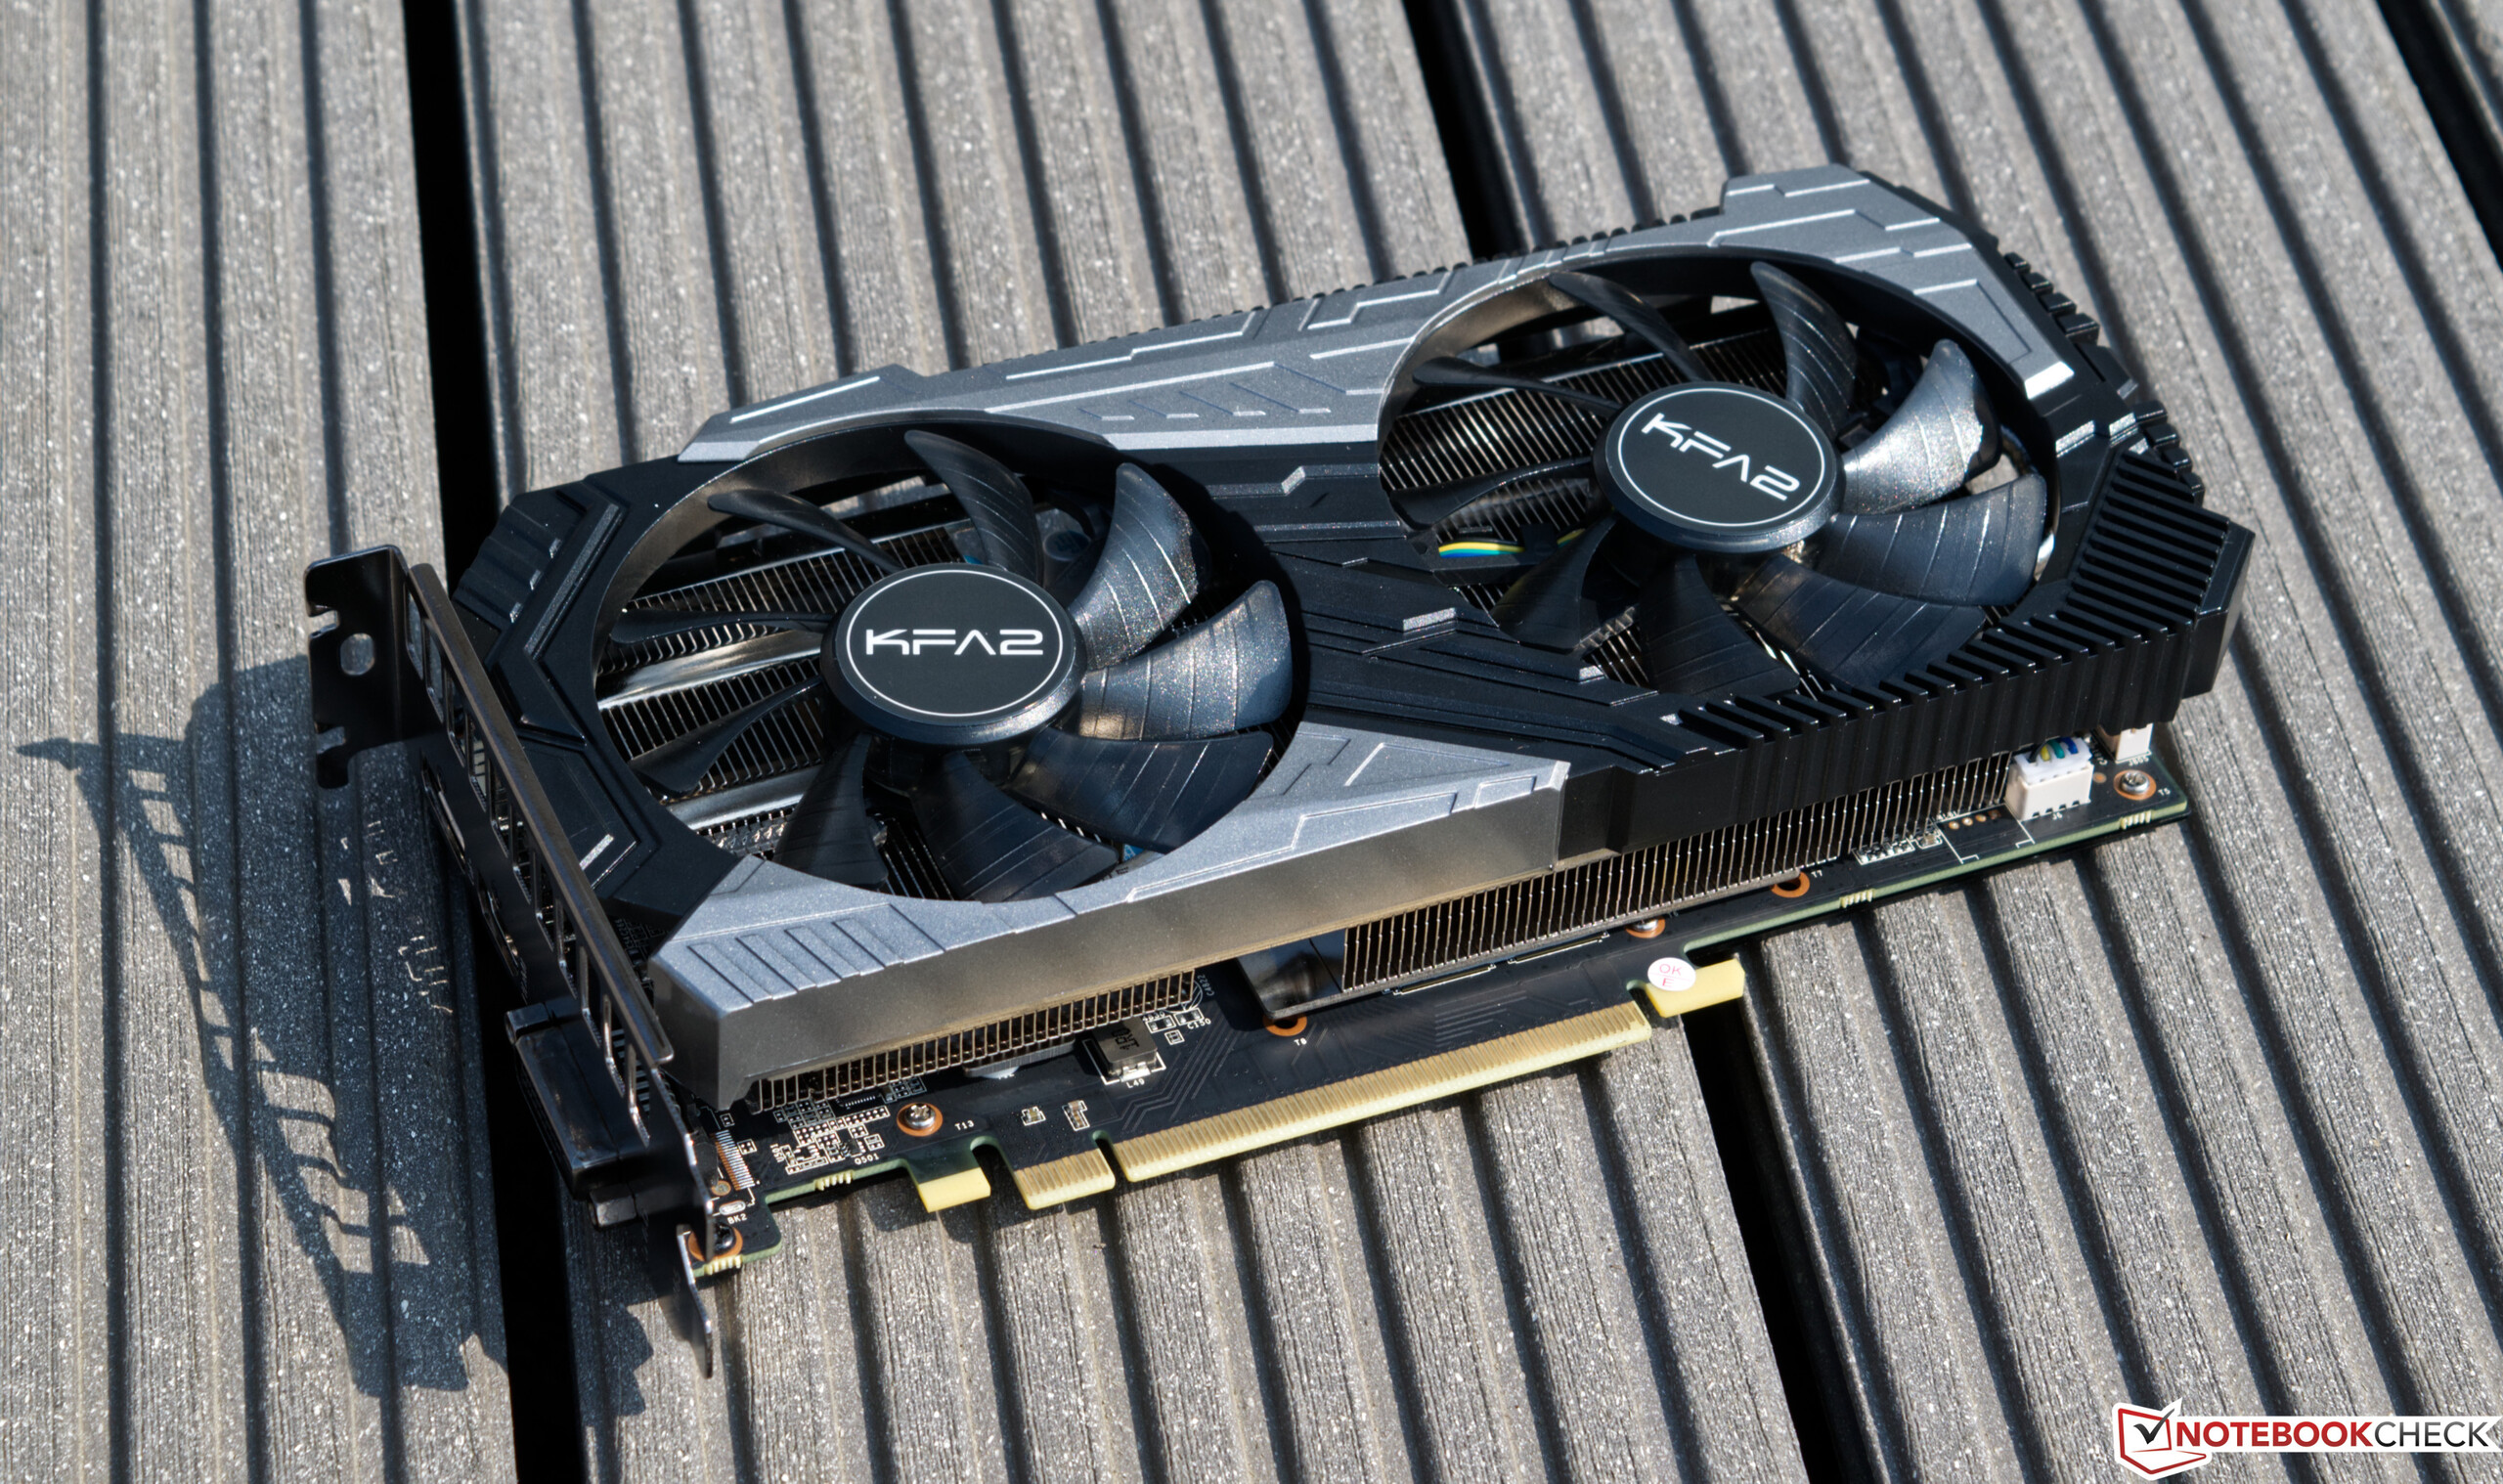
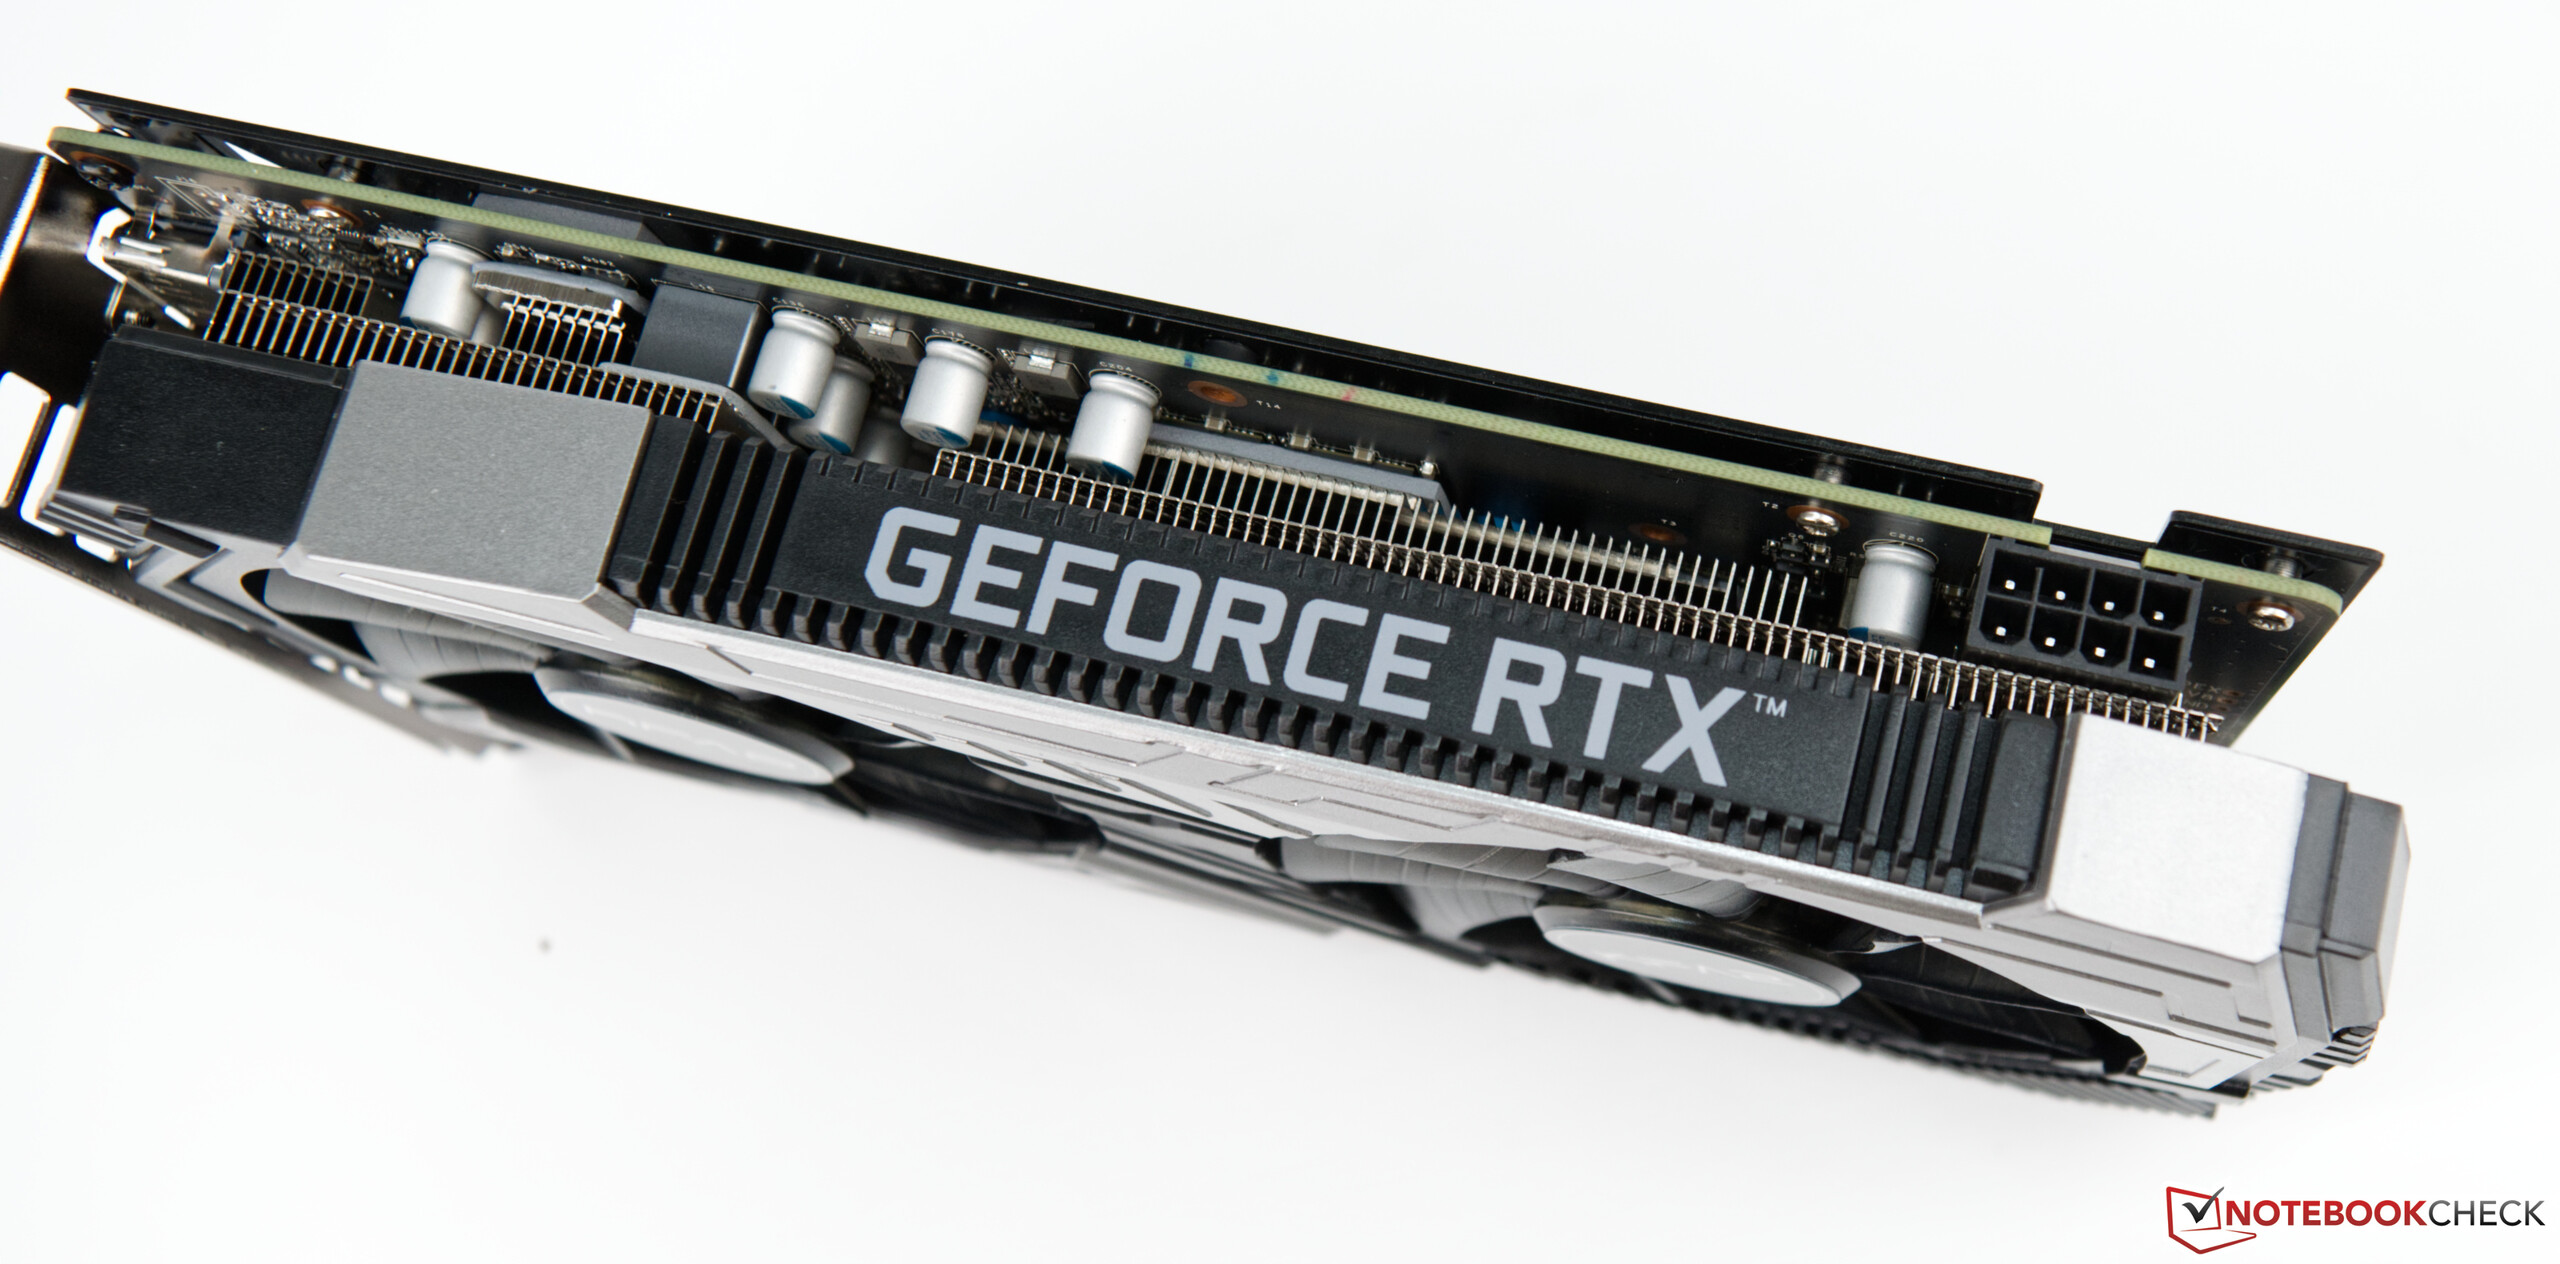
KFA2 GeForce RTX 2060 Super klarade sig totalt sett bra i vår recension och fick bättre resultat än referensdesign-modellen trots blygsammare kylning. Det fläktfria läget för 2D-bruk är ett plus, det möjliggör inte bara energibesparing utan också tyst drift.
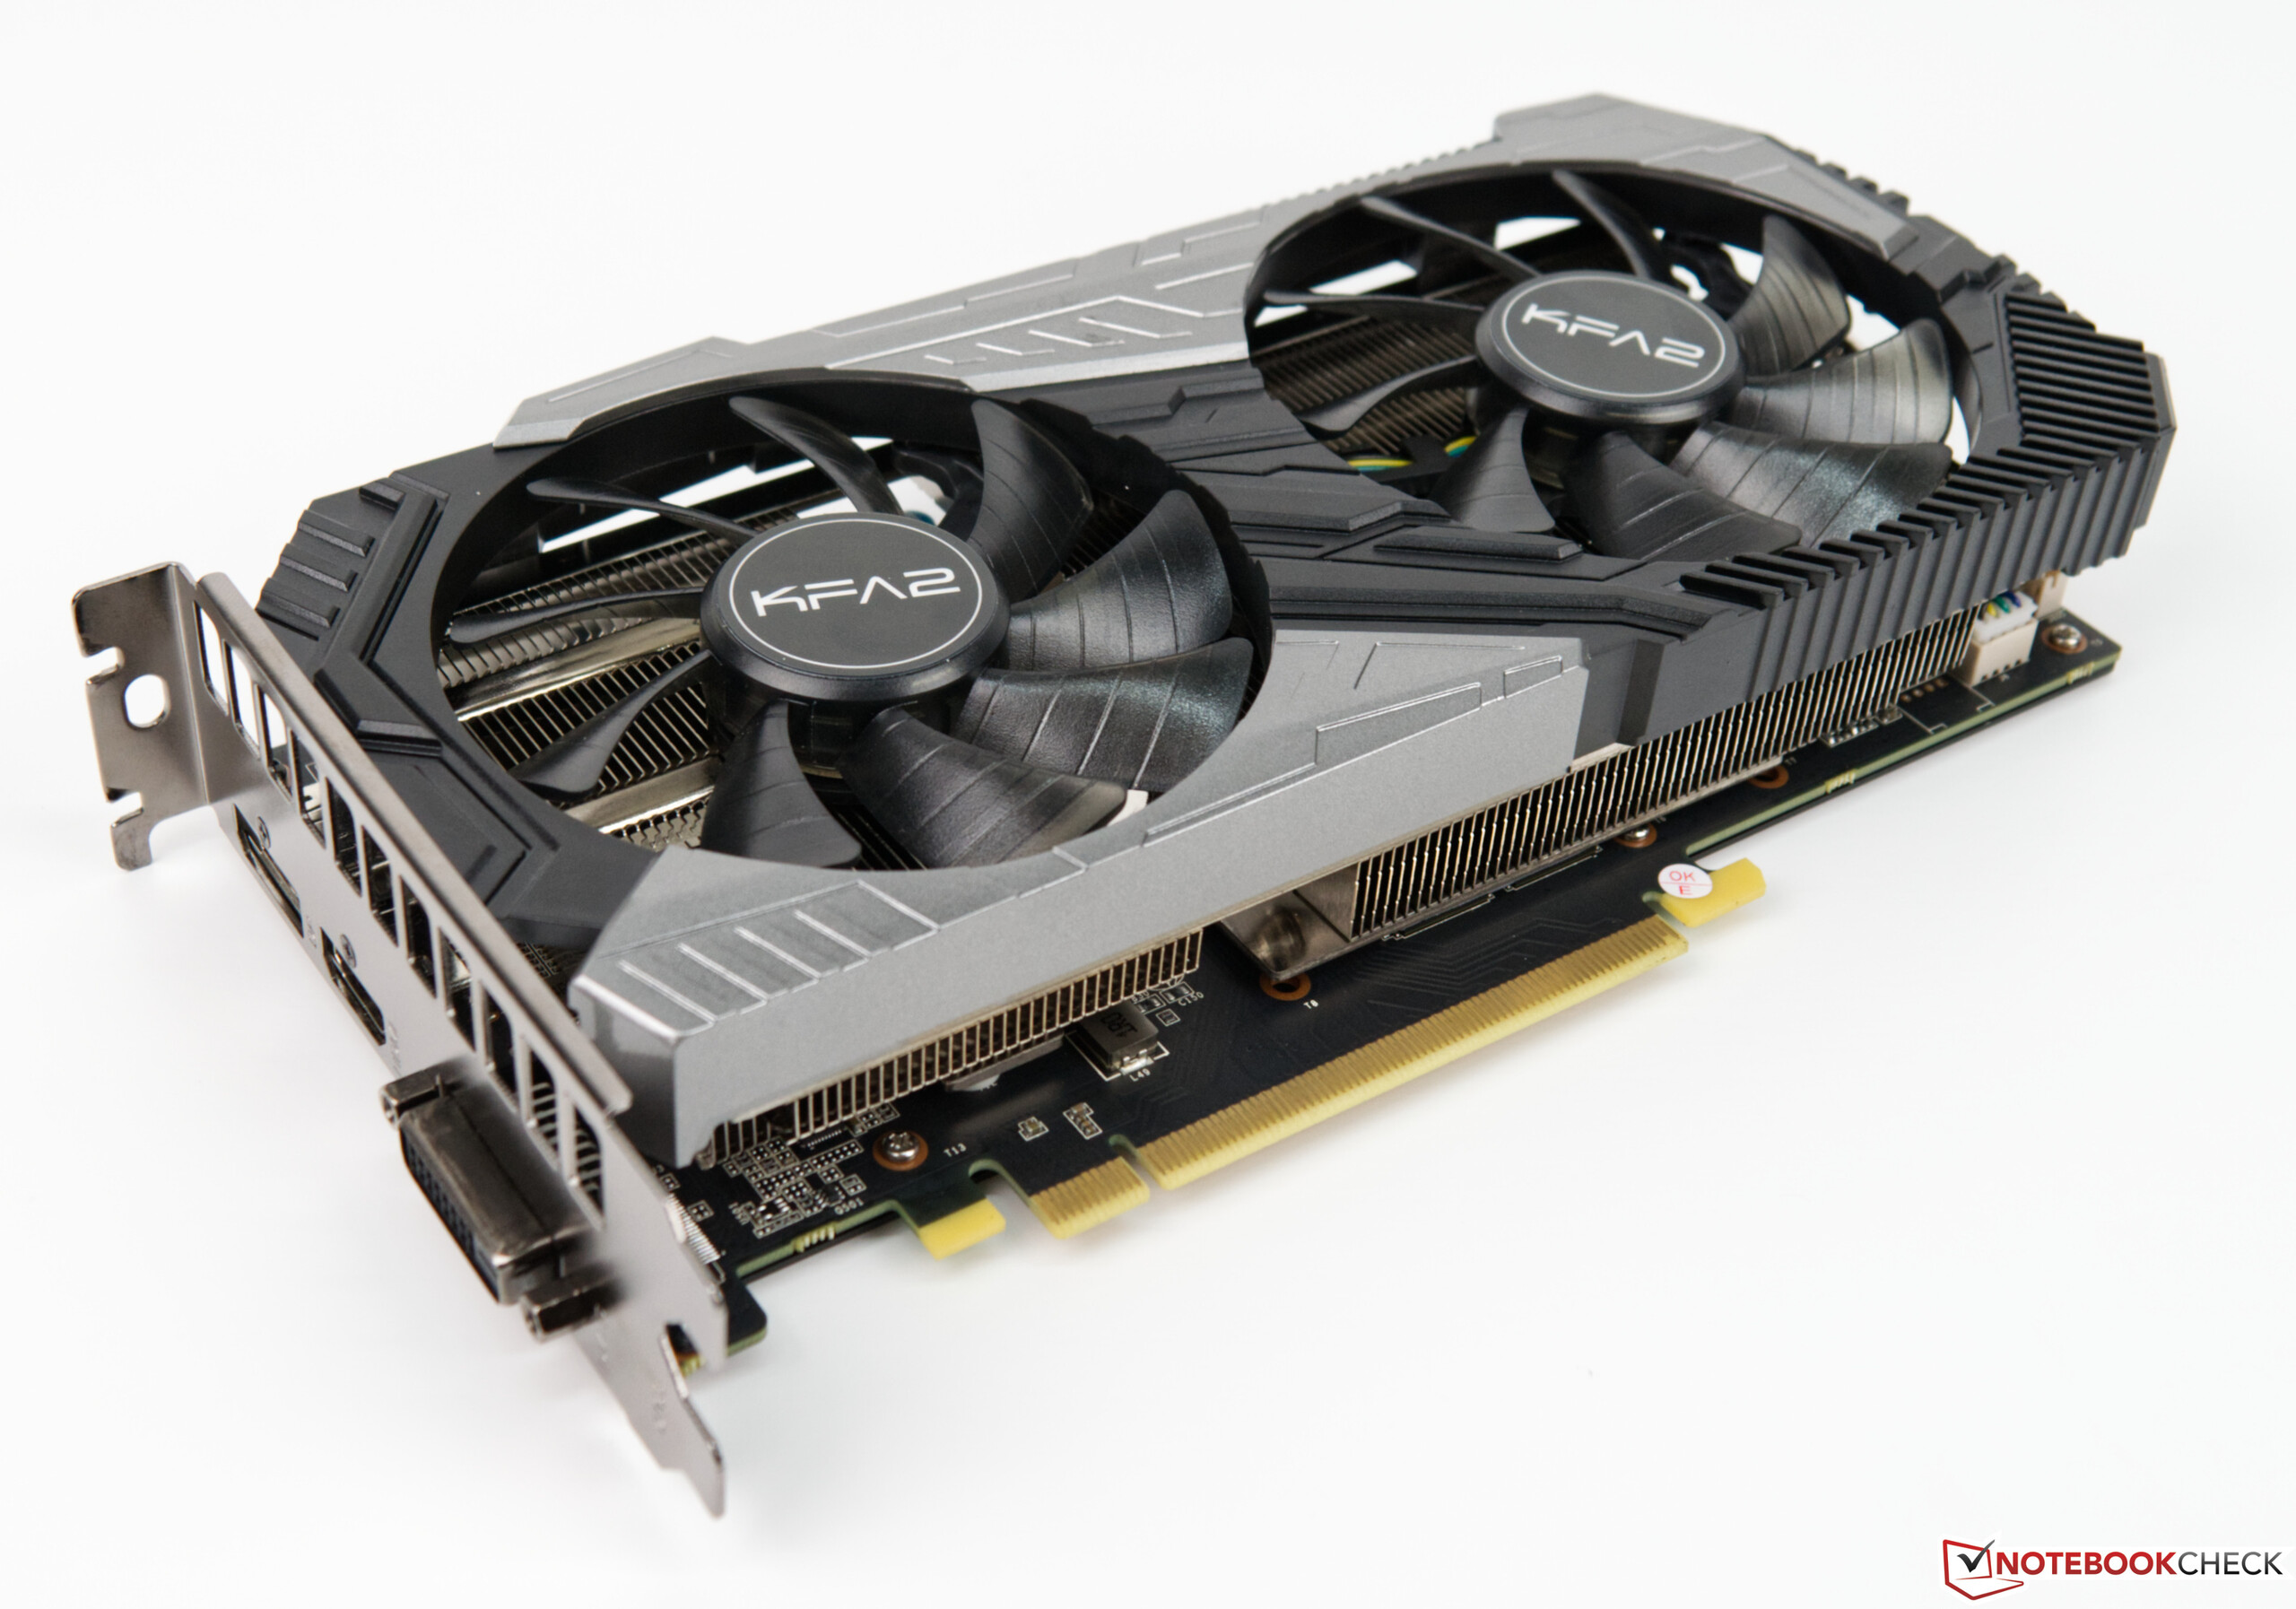
KFA2 GeForce RTX 2060 Super visar upp gedigen prestanda och aningen lägre temperaturer vid belastning än Nvidias referenskort. Om du kan leva utan RGB-ögongodiset är detta grafikkort ett bra val.
Jämfört med Founders Edition kan detta kort vara ett mer tilltalande alternativ och med ett pris på under 4.000 kronor lär det locka fler intresserade köpare. Vill man inte betala så mycket får man offra RTX-funktionerna eftersom RTX 2060S är instegsmodellen. Även om GeForce GTX 1660 Ti är lite billigare är det också en aning långsammare och har bara 6 GB VRAM.
Prestandatester
3DM Vant. Perf. total +
specvp12 sw-03 +
* Mindre antal betyder högre prestanda
Speltester
Följande tester/benchmarks kommer från våra laptoprecensioner. Prestandan beror på typen av grafikminne, klockfrekvens, processor, systeminställningar och operativsystem. Resultaten är därför inte nödvändigtvis representativa för alla bärbara datorer med denna GPU. För detaljerad information om resultaten, klicka på fps-värdet.

007 First Light
2026
Forza Horizon 6
2026
Pragmata
2026
Death Stranding 2
2026
Crimson Desert
2026


Anno 117: Pax Romana
2025
ARC Raiders
2025
The Outer Worlds 2
2025
Battlefield 6
2025
Borderlands 4
2025
F1 25
2025
Doom: The Dark Ages
2025


Civilization 7
2025Monster Hunter Wilds
2025

Stalker 2
2024

Until Dawn
2024
God of War Ragnarök
2024
Final Fantasy XVI
2024
Space Marine 2
2024
Star Wars Outlaws
2024
Black Myth: Wukong
2024
Once Human
2024
The First Descendant
2024
F1 24
2024

Ghost of Tsushima
2024

Alone in the Dark
2024
Dragon's Dogma 2
2024
Last Epoch
2024
Skull & Bones
2024
Helldivers 2
2024
Enshrouded
2024
Palworld
2024

Ready or Not
2023
The Finals
2023


EA Sports WRC
2023
Alan Wake 2
2023
Lords of the Fallen
2023
Total War Pharaoh
2023

EA Sports FC 24
2023
Counter-Strike 2
2023
Cyberpunk 2077
2023
Baldur's Gate 3
2023
Lies of P
2023
Starfield
2023
Armored Core 6
2023
Immortals of Aveum
2023
Atlas Fallen
2023

F1 23
2023
Diablo 4
2023

Dead Island 2
2023
The Last of Us
2023

Company of Heroes 3
2023
Sons of the Forest
2023
Atomic Heart
2023
Returnal
2023
Hogwarts Legacy
2023
Dead Space Remake
2023
The Witcher 3 v4
2023
High On Life
2023


FIFA 23
2022
The Quarry
2022
F1 22
2022
Vampire Bloodhunt
2022
Ghostwire Tokyo
2022

Cyberpunk 2077 1.6
2022
Elex 2
2022
GRID Legends
2022
Elden Ring
2022
Dying Light 2
2022

God of War
2022
Halo Infinite
2021
Farming Simulator 22
2021
Battlefield 2042
2021
Forza Horizon 5
2021

Riders Republic
2021

Back 4 Blood
2021
Far Cry 6
2021
Alan Wake Remastered
2021
New World
2021
Deathloop
2021
F1 2021
2021

Days Gone
2021


Outriders
2021
Hitman 3
2021
Cyberpunk 2077 1.0
2020

Yakuza Like a Dragon
2020


Dirt 5
2020
Watch Dogs Legion
2020
FIFA 21
2020
Star Wars Squadrons
2020

Serious Sam 4
2020
Crysis Remastered
2020

Horizon Zero Dawn
2020
Death Stranding
2020
F1 2020
2020
Valorant
2020
Gears Tactics
2020
Doom Eternal
2020
Hunt Showdown
2020
Escape from Tarkov
2020
Fall Guys
2020


Need for Speed Heat
2019

GRID 2019
2019

FIFA 20
2019
Borderlands 3
2019
Control
2019
F1 2019
2019

Rage 2
2019
Anno 1800
2019
The Division 2
2019
Dirt Rally 2.0
2019
Anthem
2019
Far Cry New Dawn
2019
Metro Exodus
2019
Apex Legends
2019
Just Cause 4
2018
Darksiders III
2018
Battlefield V
2018
Farming Simulator 19
2018
Hitman 2
2018


Forza Horizon 4
2018
FIFA 19
2018

Strange Brigade
2018
F1 2018
2018
Monster Hunter World
2018
The Crew 2
2018
Far Cry 5
2018
X-Plane 11.11
2018


Fortnite
2018
Call of Duty WWII
2017

Destiny 2
2017
Dirt 4
2017Rocket League
2017For Honor
2017Watch Dogs 2
2016
Dishonored 2
2016
Battlefield 1
2016
Overwatch
2016
Doom
2016
The Division
2016
Far Cry Primal
2016

Rainbow Six Siege
2015Dota 2 Reborn
2015
The Witcher 3
2015
GTA V
2015
Battlefield 4
2013BioShock Infinite
2013| låg | med. | hög | ultra | QHD | 4K | |
|---|---|---|---|---|---|---|
| 007 First Light | 51.2 | 46.8 | 39.8 | 38.2 | 5.08 | |
| Forza Horizon 6 | 117 | 69 | 34 | 13 | ||
| Pragmata | 90.9 | 67.2 | 52.1 | 37.8 | ||
| Death Stranding 2 | 53.4 | 47.1 | 43 | 34 | 26.8 | 16.4 |
| Crimson Desert | 80.9 | 47 | 43.8 | 37 | 28.7 | 17 |
| Resident Evil Requiem | 89.8 | 63.2 | 58.5 | 26.6 | 12.7 | |
| Call of Duty Black Ops 7 | 98 | 86 | 65 | 23 | ||
| Anno 117: Pax Romana | 79.4 | 58.6 | 42.9 | 21.2 | 14.9 | |
| ARC Raiders | 146.7 | 87.1 | 70.1 | 37.9 | 27.8 | |
| The Outer Worlds 2 | 45 | 39.1 | 33.2 | 21.8 | ||
| Battlefield 6 | 93.4 | 86.3 | 70.4 | 33.9 | 26.8 | |
| Borderlands 4 | 52.6 | 42.4 | 34 | 19.7 | ||
| F1 25 | 225 | 177.7 | 133.5 | |||
| Doom: The Dark Ages | 53.9 | 45.7 | 41.9 | 39.5 | 26 | |
| The Elder Scrolls IV Oblivion Remastered | 91.1 | 61.1 | 40.5 | 19.7 | ||
| Assassin's Creed Shadows | 29 | 25 | 20 | 13 | ||
| Civilization 7 | 281 | 189.1 | 113.4 | 71.6 | 32.9 | |
| Monster Hunter Wilds | 51.9 | 43.2 | 33.2 | 25.2 | ||
| Kingdom Come Deliverance 2 | 104.9 | 79.2 | 65.6 | 46.1 | 32.6 | 17.7 |
| Stalker 2 | 53.2 | 47.1 | 40.1 | 33.7 | 24.5 | |
| Call of Duty Black Ops 6 | 70 | 66 | 41 | 40 | 27 | |
| Until Dawn | 117.1 | 78 | 53.9 | 39.6 | 28.8 | 15.9 |
| God of War Ragnarök | 100.2 | 84.1 | 73.4 | 67.9 | 51.3 | 28.9 |
| Final Fantasy XVI | 58.9 | 58.3 | 48.3 | 44.3 | 30.7 | |
| Space Marine 2 | 78.1 | 65.4 | 62 | 56.7 | 39.5 | 21.1 |
| Star Wars Outlaws | 37.6 | 34.4 | 30.3 | 24.4 | 16.6 | |
| Black Myth: Wukong | 64 | 48 | 37 | 19 | 14 | 7 |
| Once Human | 171.7 | 119.5 | 98.6 | 86.6 | 55.9 | 28 |
| The First Descendant | 140.8 | 85.2 | 68.4 | 56.1 | 36.1 | 19.4 |
| F1 24 | 240 | 201 | 148.3 | 45.5 | 28.8 | 13.9 |
| Senua's Saga Hellblade 2 | 50.7 | 40.7 | 30.3 | 20.7 | 10 | |
| Ghost of Tsushima | 87 | 69.7 | 64.2 | 52.2 | 39.5 | 22.5 |
| Horizon Forbidden West | 93.1 | 82.5 | 56.6 | 55.2 | 41.4 | 24.3 |
| Alone in the Dark | 223 | 178.9 | 149.9 | 84.7 | 41.6 | 12.2 |
| Dragon's Dogma 2 | 61.5 | 55.8 | 42 | 25.8 | ||
| Last Epoch | 241 | 186.7 | 162.2 | 131.1 | 85.9 | 42.5 |
| Skull & Bones | 103 | 90 | 73 | 56 | 43 | 26 |
| Helldivers 2 | 124.5 | 92.5 | 79.5 | 77.8 | 54.1 | 26.6 |
| Enshrouded | 67.3 | 57.8 | 48.7 | 40.8 | 31.5 | 19 |
| Palworld | 124.7 | 105 | 82 | 75.1 | 51.5 | 25.9 |
| Prince of Persia The Lost Crown | 359 | 359 | 359 | 313 | 155.2 | |
| Ready or Not | 204 | 182 | 159.6 | 107.8 | 61.5 | 26.2 |
| The Finals | 220 | 158.3 | 139.7 | 106.9 | 65.4 | 30.1 |
| Avatar Frontiers of Pandora | 53 | 49 | 43 | 33 | 22 | 11 |
| Call of Duty Modern Warfare 3 2023 | 95 | 87 | 65 | 61 | 43 | 25 |
| EA Sports WRC | 122.3 | 89.6 | 81.4 | 73 | 53.6 | 29.7 |
| Alan Wake 2 | 55.6 | 49.2 | 47 | 29.3 | 14.8 | |
| Lords of the Fallen | 73.9 | 62.3 | 44.9 | 30.7 | 20.6 | 10.4 |
| Total War Pharaoh | 352 | 230.7 | 132.3 | 103.3 | 70.5 | 35.6 |
| Assassin's Creed Mirage | 102 | 94 | 89 | 71 | 54 | 32 |
| EA Sports FC 24 | 217 | 199.1 | 167.7 | 146.9 | 111.5 | 67.4 |
| Counter-Strike 2 | 320 | 285 | 202 | 148.8 | 99.2 | 46.2 |
| Cyberpunk 2077 | 90.7 | 73.2 | 64.1 | 59.2 | 38.9 | 19.3 |
| Baldur's Gate 3 | 159.6 | 103 | 84.7 | 70.7 | 48.5 | 25.7 |
| Lies of P | 153.5 | 137.6 | 118.7 | 105 | 69.2 | 34.9 |
| Starfield | 54.9 | 48.1 | 39.9 | 35.7 | 29 | 18.6 |
| Armored Core 6 | 119.5 | 115.7 | 107.3 | 88.6 | 65.6 | 37.9 |
| Immortals of Aveum | 49.6 | 41.7 | 32 | 21.4 | 12 | |
| Atlas Fallen | 122 | 114.4 | 105 | 89.3 | 63.8 | 33.8 |
| Ratchet & Clank Rift Apart | 78.4 | 68.6 | 55.7 | 49.2 | 39.9 | 25.6 |
| F1 23 | 269 | 237 | 162.2 | 46 | 28.9 | 13.7 |
| Diablo 4 | 231 | 196.1 | 172.9 | 141.6 | 94 | 47 |
| Star Wars Jedi Survivor | 72 | 62.2 | 57.1 | 54.2 | 33.7 | 16.8 |
| Dead Island 2 | 226 | 191.6 | 138 | 101.2 | 68.7 | 33.7 |
| The Last of Us | 86.8 | 70.1 | 61.6 | 45.2 | 29.1 | 12.7 |
| Resident Evil 4 Remake | 117.6 | 94.5 | 82.2 | |||
| Company of Heroes 3 | 154.2 | 131.7 | 100.7 | 101.4 | 73.5 | 41.1 |
| Sons of the Forest | 94.5 | 78.4 | 74.9 | 72.7 | 54.5 | 32.3 |
| Atomic Heart | 168.3 | 124.3 | 72.7 | 58.1 | 43.6 | 25.6 |
| Returnal | 93 | 89 | 79 | 68 | 49 | 28 |
| Hogwarts Legacy | 124.5 | 91.5 | 68.8 | 58.1 | 40.7 | 21.6 |
| Dead Space Remake | 79.4 | 75.3 | 66 | 64.8 | 42.6 | 22 |
| The Witcher 3 v4 | 191.8 | 153.3 | 125.8 | 100.2 | 71.3 | 40.3 |
| High On Life | 221 | 137.7 | 105.1 | 86.2 | 51.2 | 19.4 |
| The Callisto Protocol | 134.8 | 92.2 | 58.7 | 57.7 | 42.9 | 25.1 |
| Need for Speed Unbound | 138.1 | 121.4 | 99.3 | 83.9 | 59.9 | 32.4 |
| Spider-Man Miles Morales | 115.8 | 108.1 | 101.1 | 97.8 | 67.8 | 35.1 |
| Call of Duty Modern Warfare 2 2022 | 112 | 95 | 71 | 68 | 48 | 29 |
| Uncharted Legacy of Thieves Collection | 75.7 | 72.6 | 69.7 | 65.3 | 50.5 | 21.8 |
| A Plague Tale Requiem | 97.9 | 74.2 | 54.8 | 41.6 | 29.2 | 16.4 |
| FIFA 23 | 266 | 238 | 165.9 | 161 | 117.9 | 71.4 |
| The Quarry | 136 | 104 | 83 | 64 | 43 | 20 |
| F1 22 | 251 | 225 | 165 | 49 | 31 | 15 |
| Vampire Bloodhunt | 307 | 169.3 | 155.7 | 146.9 | 99.9 | 50.9 |
| Ghostwire Tokyo | 132 | 125 | 124 | 123 | 78 | 38 |
| Tiny Tina's Wonderlands | 159 | 129 | 89 | 71 | 49 | 26 |
| Cyberpunk 2077 1.6 | 88 | 79 | 71 | 62 | 40 | 19 |
| Elex 2 | 87.3 | 83.3 | 74.7 | 67.9 | 49.7 | 28 |
| GRID Legends | 233 | 180 | 148 | 109 | 86 | 54 |
| Elden Ring | 59.9 | 59.9 | 59.7 | 59.9 | 59.8 | 56.9 |
| Dying Light 2 | 109 | 64.4 | 57 | 40 | 21 | |
| Rainbow Six Extraction | 171 | 148 | 146 | 119 | 78 | 34 |
| God of War | 119 | 101 | 82 | 57 | 46 | 31 |
| Halo Infinite | 112 | 88.2 | 86 | 66 | 52 | |
| Farming Simulator 22 | 277 | 222 | 171 | 147 | 112 | 68.3 |
| Battlefield 2042 | 102 | 112 | 94.7 | 80.9 | 61.3 | 36.5 |
| Forza Horizon 5 | 225 | 124 | 108 | 66 | 55 | 38 |
| Call of Duty Vanguard | 102 | 109 | 90.3 | 82 | 59.2 | 33.3 |
| Riders Republic | 190 | 123 | 102 | 92 | 66 | 36 |
| Guardians of the Galaxy | 137 | 131 | 129 | 126 | 86 | 46 |
| Back 4 Blood | 190 | 173 | 156 | 103 | 52.9 | |
| Far Cry 6 | 188 | 125 | 108 | 93 | 67 | 18 |
| Alan Wake Remastered | 93.7 | 90.3 | 89.7 | 85.1 | ||
| New World | 173 | 110 | 102 | 89.8 | 60.1 | 31.4 |
| Deathloop | 119 | 102 | 86.9 | 69 | 46.8 | 27.4 |
| F1 2021 | 434 | 247 | 202 | 100 | 72 | 40 |
| Monster Hunter Stories 2 | 144 | 144 | 144 | 143 | 108 | |
| Days Gone | 195 | 132 | 117 | 87.1 | 63.7 | 36.2 |
| Mass Effect Legendary Edition | 104 | 101 | 99.6 | 76.7 | ||
| Resident Evil Village | 322 | 163 | 148 | 129 | 85.1 | 42.6 |
| Outriders | 118 | 142 | 114 | 97 | 67 | 36 |
| Hitman 3 | 247 | 135 | 128 | 122 | 85 | 46 |
| Cyberpunk 2077 1.0 | 110 | 74.7 | 62.6 | 53 | 36 | 17 |
| Immortals Fenyx Rising | 124 | 87 | 75 | 57 | 49 | 39 |
| Yakuza Like a Dragon | 99 | 94.1 | 97.7 | 84.3 | 58.1 | 30.4 |
| Call of Duty Black Ops Cold War | 181 | 118 | 91.3 | 73 | 53.2 | 17.3 |
| Assassin´s Creed Valhalla | 112 | 81 | 68 | 61 | 47 | 29 |
| Dirt 5 | 148 | 88.9 | 70.8 | 60 | 50.4 | 34.3 |
| Watch Dogs Legion | 118 | 104 | 90.4 | 59.1 | 43.7 | 24.7 |
| FIFA 21 | 228 | 229 | 216 | 215 | 212 | 181 |
| Star Wars Squadrons | 378 | 282 | 241 | 229 | 150 | 85 |
| Mafia Definitive Edition | 147 | 105 | 97 | 67 | 35 | |
| Serious Sam 4 | 144.5 | 104.2 | 89.4 | 82 | 74 | 43 |
| Crysis Remastered | 246 | 143 | 74.4 | 60.7 | 46 | 24.6 |
| Flight Simulator 2020 | 75.2 | 67 | 54 | 39 | 30 | 18 |
| Horizon Zero Dawn | 149 | 102 | 85 | 69 | 54 | 31 |
| Death Stranding | 190 | 127 | 118 | 114 | 80.6 | 45.1 |
| F1 2020 | 362 | 228 | 188 | 133 | 99 | 56 |
| Valorant | 345 | 298 | 293 | 268 | 214 | |
| Gears Tactics | 323.7 | 199.3 | 134.5 | 92 | 63.7 | 34 |
| Doom Eternal | 235 | 202 | 181 | 180 | 114 | 58.7 |
| Hunt Showdown | 252 | 137 | 105 | 71 | 33.1 | |
| Escape from Tarkov | 121 | 120 | 117 | 98 | 77.7 | 37.8 |
| Fall Guys | 59.6 | 59.6 | 59.6 | |||
| Red Dead Redemption 2 | 145 | 106 | 72 | 46.5 | 37.6 | 24.1 |
| Star Wars Jedi Fallen Order | 122 | 121 | 114 | 82 | 41.6 | |
| Need for Speed Heat | 108 | 103 | 95 | 87 | 70 | 41 |
| Call of Duty Modern Warfare 2019 | 187 | 141 | 125 | 109 | 80 | 46 |
| GRID 2019 | 170 | 165 | 133 | 88 | 70 | 44 |
| Ghost Recon Breakpoint | 147 | 102 | 95 | 71 | 53 | 30 |
| FIFA 20 | 279 | 264 | 260 | 257 | 249 | 184 |
| Borderlands 3 | 192 | 130 | 92 | 71 | 50 | 27 |
| Control | 239 | 108 | 80 | 52 | 25 | |
| F1 2019 | 213 | 191 | 160 | 122 | 96 | 58 |
| Total War: Three Kingdoms | 239.8 | 138.5 | 98.2 | 69 | 43.9 | 21.5 |
| Rage 2 | 237 | 131 | 111 | 108 | 71 | 35 |
| Anno 1800 | 114 | 109 | 85 | 38 | 35 | 27 |
| The Division 2 | 190 | 142 | 115 | 85 | 59 | 32 |
| Dirt Rally 2.0 | 242 | 194 | 175 | 109 | 83 | 49 |
| Anthem | 111 | 107 | 102 | 99 | 76 | 42 |
| Far Cry New Dawn | 159 | 124 | 117 | 106 | 86 | 49 |
| Metro Exodus | 183 | 105 | 78 | 62 | 49 | 31 |
| Apex Legends | 144 | 144 | 144 | 144 | 114 | 64 |
| Just Cause 4 | 193 | 144 | 110 | 103 | 74 | 41 |
| Darksiders III | 203 | 133 | 120 | 114 | 83 | 42 |
| Battlefield V | 166 | 128 | 113 | 105 | 83 | 52 |
| Farming Simulator 19 | 218 | 164 | 142 | 131 | 115 | 66 |
| Hitman 2 | 93 | 90 | 82 | 82 | 74 | 42 |
| Call of Duty Black Ops 4 | 253 | 163 | 156 | 145 | 96 | 47 |
| Assassin´s Creed Odyssey | 120 | 101 | 85 | 61 | 52 | 35 |
| Forza Horizon 4 | 179 | 152 | 147 | 120 | 98 | 67 |
| FIFA 19 | 305 | 299 | 271 | 268 | 259 | 184 |
| Shadow of the Tomb Raider | 212 | 125 | 115 | 105 | 72 | 38 |
| Strange Brigade | 486 | 226 | 180 | 152 | 112 | 63 |
| F1 2018 | 247 | 205 | 167 | 123 | 98 | 61 |
| Monster Hunter World | 131 | 119 | 115 | 90 | 68 | 35 |
| The Crew 2 | 60 | 60 | 60 | 60 | 60 | 38 |
| Far Cry 5 | 185 | 132 | 124 | 116 | 87 | 46 |
| X-Plane 11.11 | 170 | 152 | 120 | 102 | ||
| Kingdom Come: Deliverance | 146 | 130 | 108 | 74 | 57 | 30 |
| Final Fantasy XV Benchmark | 197 | 117 | 86 | 68 | 36 | |
| Fortnite | 352 | 266 | 175 | 148 | 98 | 48 |
| Call of Duty WWII | 235 | 227 | 149 | 130 | 106 | 67 |
| Assassin´s Creed Origins | 126 | 104 | 98 | 84 | 69 | 44 |
| Destiny 2 | 165 | 164 | 160 | 148 | 104 | 55 |
| Playerunknown's Battlegrounds (PUBG) | 182 | 147 | 143 | 123 | 49 | |
| Dirt 4 | 288 | 227 | 196 | 127 | 75 | |
| Rocket League | 244 | 242 | 240 | 138 | ||
| Ghost Recon Wildlands | 159 | 114 | 106 | 62 | 44 | |
| For Honor | 297 | 182 | 174 | 135 | 58 | |
| Watch Dogs 2 | 147 | 130 | 103 | 74 | 43 | |
| Dishonored 2 | 119 | 119 | 119 | 113 | 61 | |
| Battlefield 1 | 193 | 175 | 157 | 143 | 68 | |
| Deus Ex Mankind Divided | 137 | 128 | 107 | 66 | 41 | |
| Overwatch | 300 | 300 | 298 | 213 | 118 | |
| Doom | 169 | 168 | 160 | 156 | 82 | |
| The Division | 287 | 227 | 124 | 101 | 54 | |
| Far Cry Primal | 118 | 107 | 98 | 91 | 56 | |
| Rise of the Tomb Raider | 286 | 201 | 153 | 127 | 53 | |
| Rainbow Six Siege | 376 | 306 | 262 | 237 | 114 | |
| Dota 2 Reborn | 226 | 201 | 194 | 180 | 118 | |
| The Witcher 3 | 402 | 271 | 164 | 85 | 59 | |
| GTA V | 181 | 177 | 170 | 104 | 86 | 84 |
| Battlefield 4 | 200 | 200 | 200 | 185 | 80 | |
| BioShock Infinite | 353 | 312 | 290 | 178 | ||
| låg | med. | hög | ultra | QHD | 4K | < 30 fps < 60 fps < 120 fps ≥ 120 fps | 1 15 56 117 | 1 18 78 94 | 1 34 91 67 | 10 41 86 40 | 24 64 72 7 | 61 84 23 6 |
För att se fler spel som kan vara spelbara och se en lista med alla spel och grafikkort, besök vår spellista
