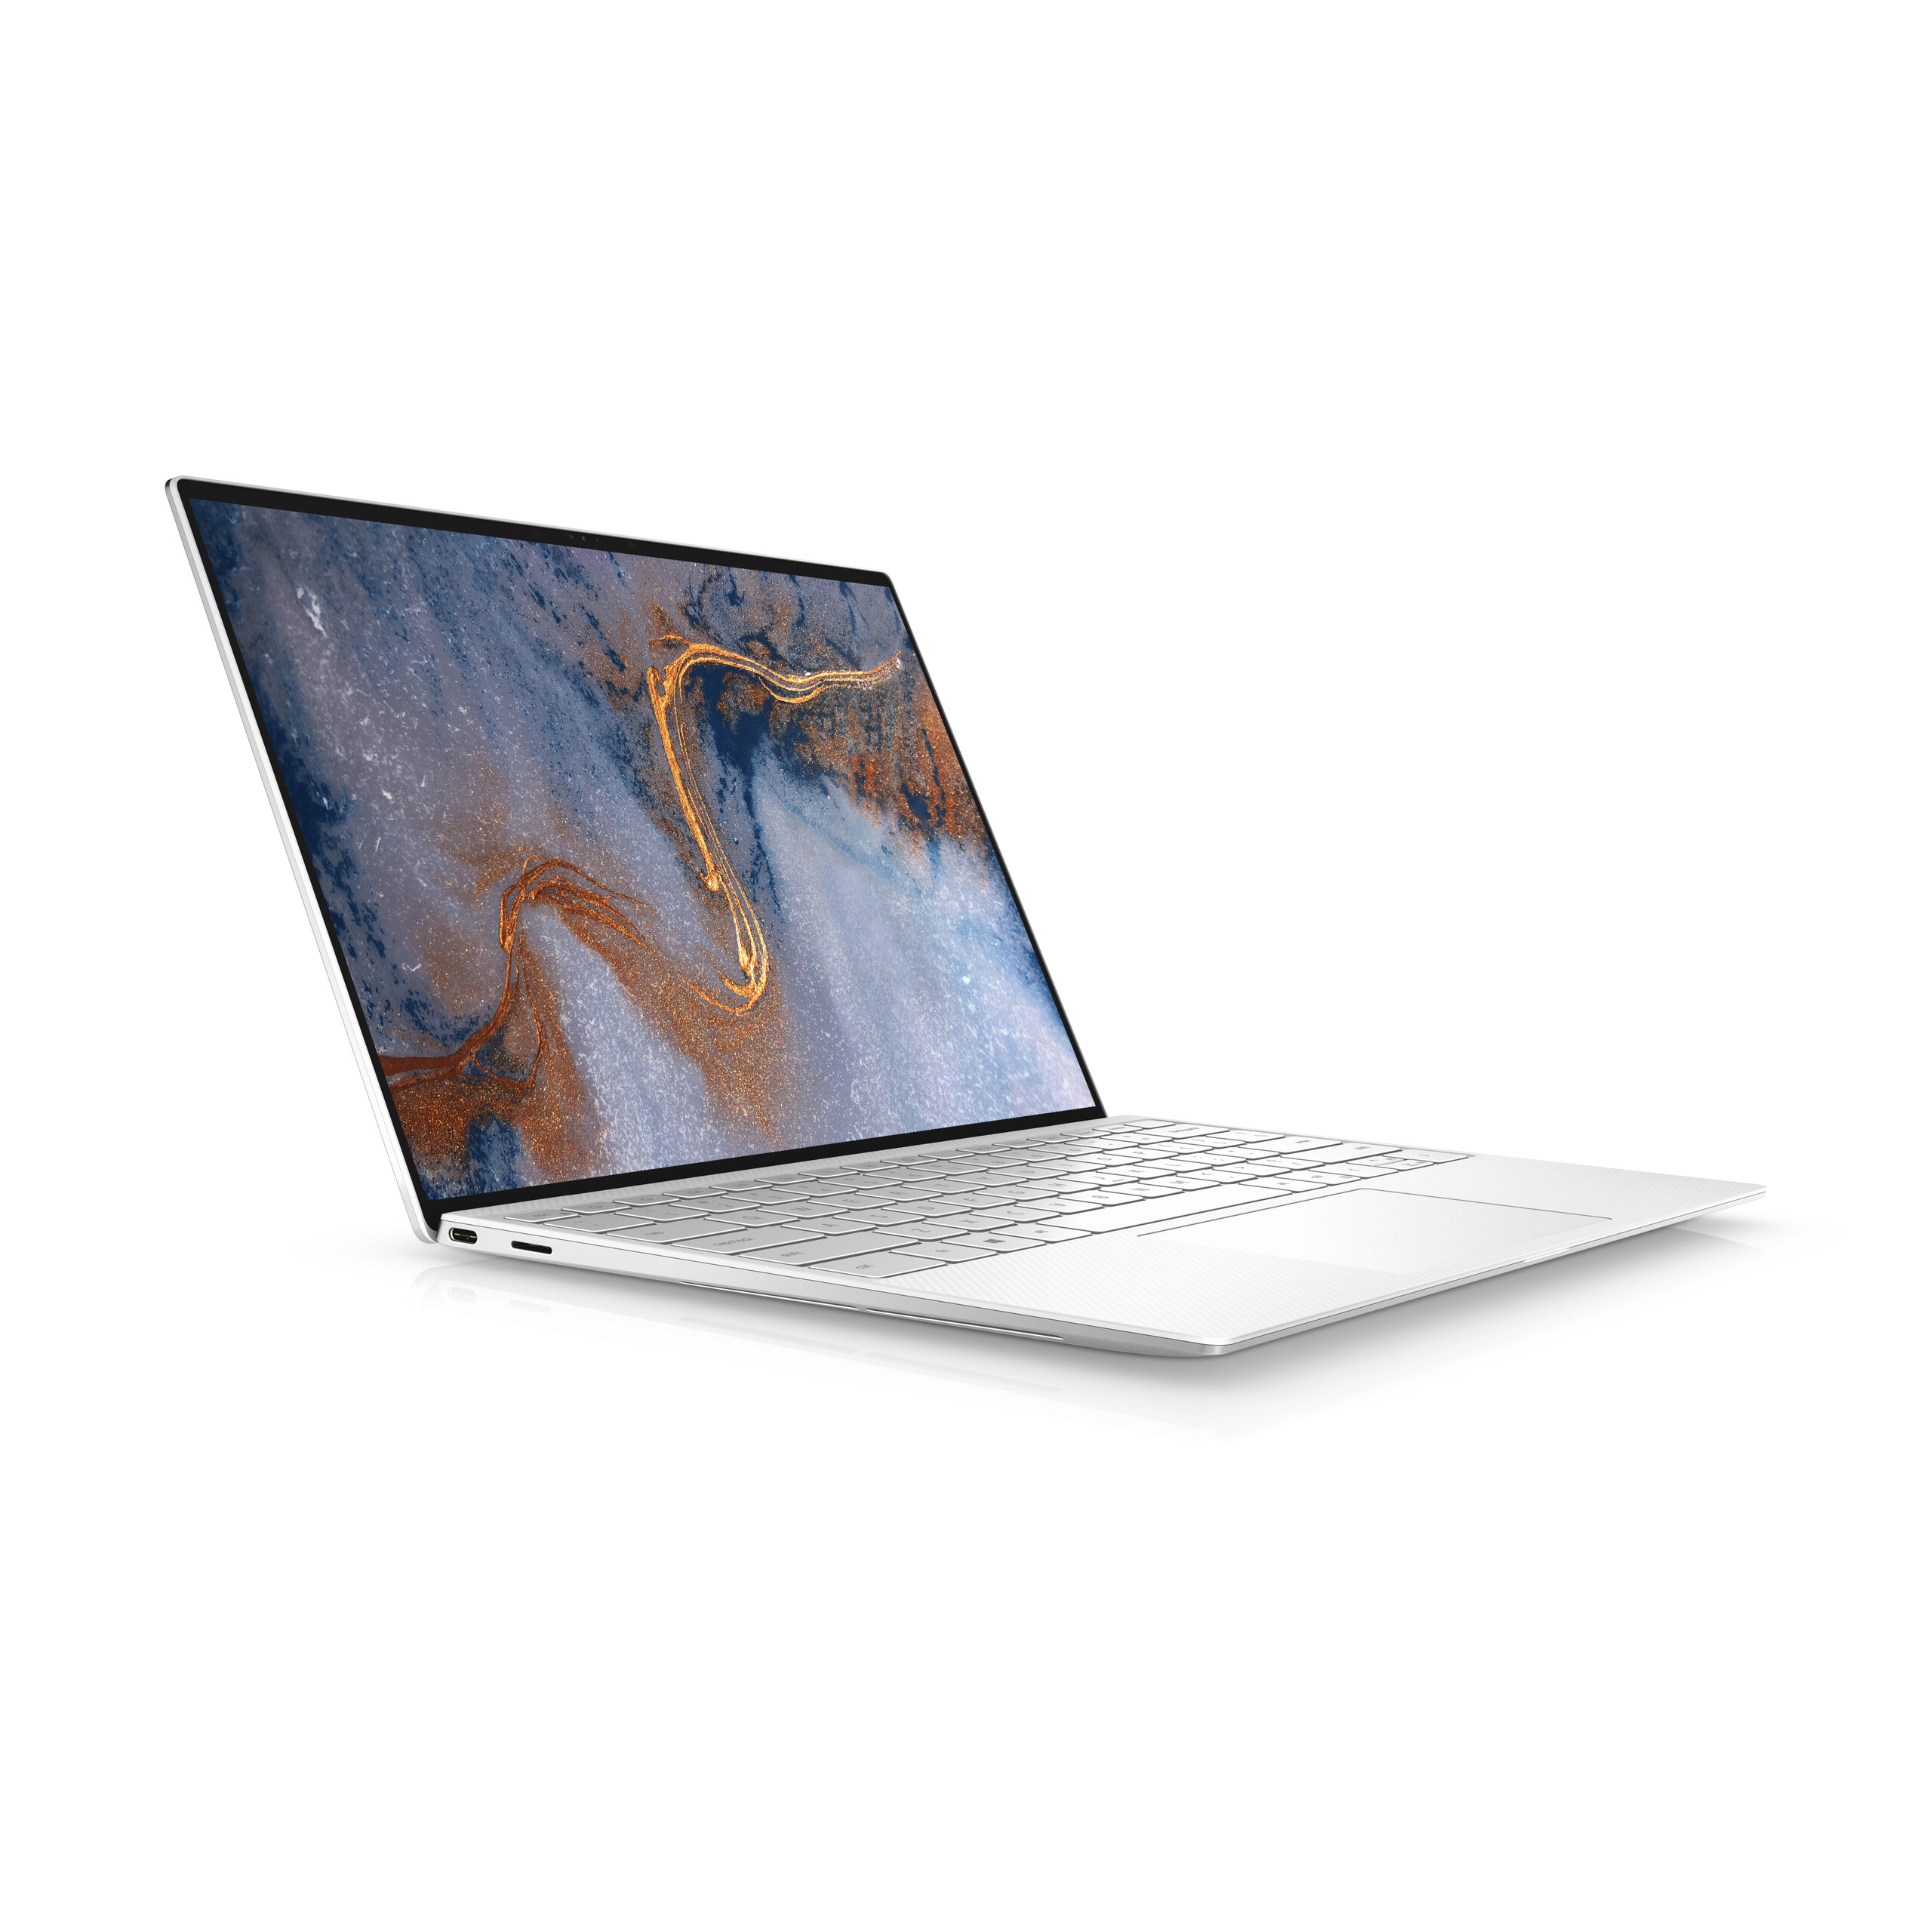
Test: Dell XPS 13 9300 Core i7 - Chassits nya design är mer spännande än den nya processorn (Sammanfattning)
Gradering | Datum | Modell | Vikt | Höjd | Storlek | Upplösning | Pris |
|---|---|---|---|---|---|---|---|
| 88.9 % v7 (old) | 03/2020 | Dell XPS 13 9300 Core i7-1065G7 i7-1065G7, Iris Plus Graphics G7 (Ice Lake 64 EU) | 1.2 kg | 14.8 mm | 13.40" | 1920x1200 | |
| 85.9 % v7 (old) | 11/2019 | Dell XPS 13 7390 Core i7-10710U i7-10710U, UHD Graphics 620 | 1.2 kg | 11.6 mm | 13.30" | 3840x2160 | |
| 86.3 % v7 (old) | 10/2019 | Dell XPS 13 7390 2-in-1 Core i7 i7-1065G7, Iris Plus Graphics G7 (Ice Lake 64 EU) | 1.3 kg | 13 mm | 13.40" | 1920x1200 | |
| 86.6 % v6 (old) | 05/2019 | Asus ZenBook S13 UX392FN i7-8565U, GeForce MX150 | 1.1 kg | 12.9 mm | 13.90" | 1920x1080 | |
| 84 % v7 (old) | 02/2020 | Microsoft Surface Laptop 3 13 Core i5-1035G7 i5-1035G7, Iris Plus Graphics G7 (Ice Lake 64 EU) | 1.3 kg | 14.5 mm | 13.50" | 2256x1504 |
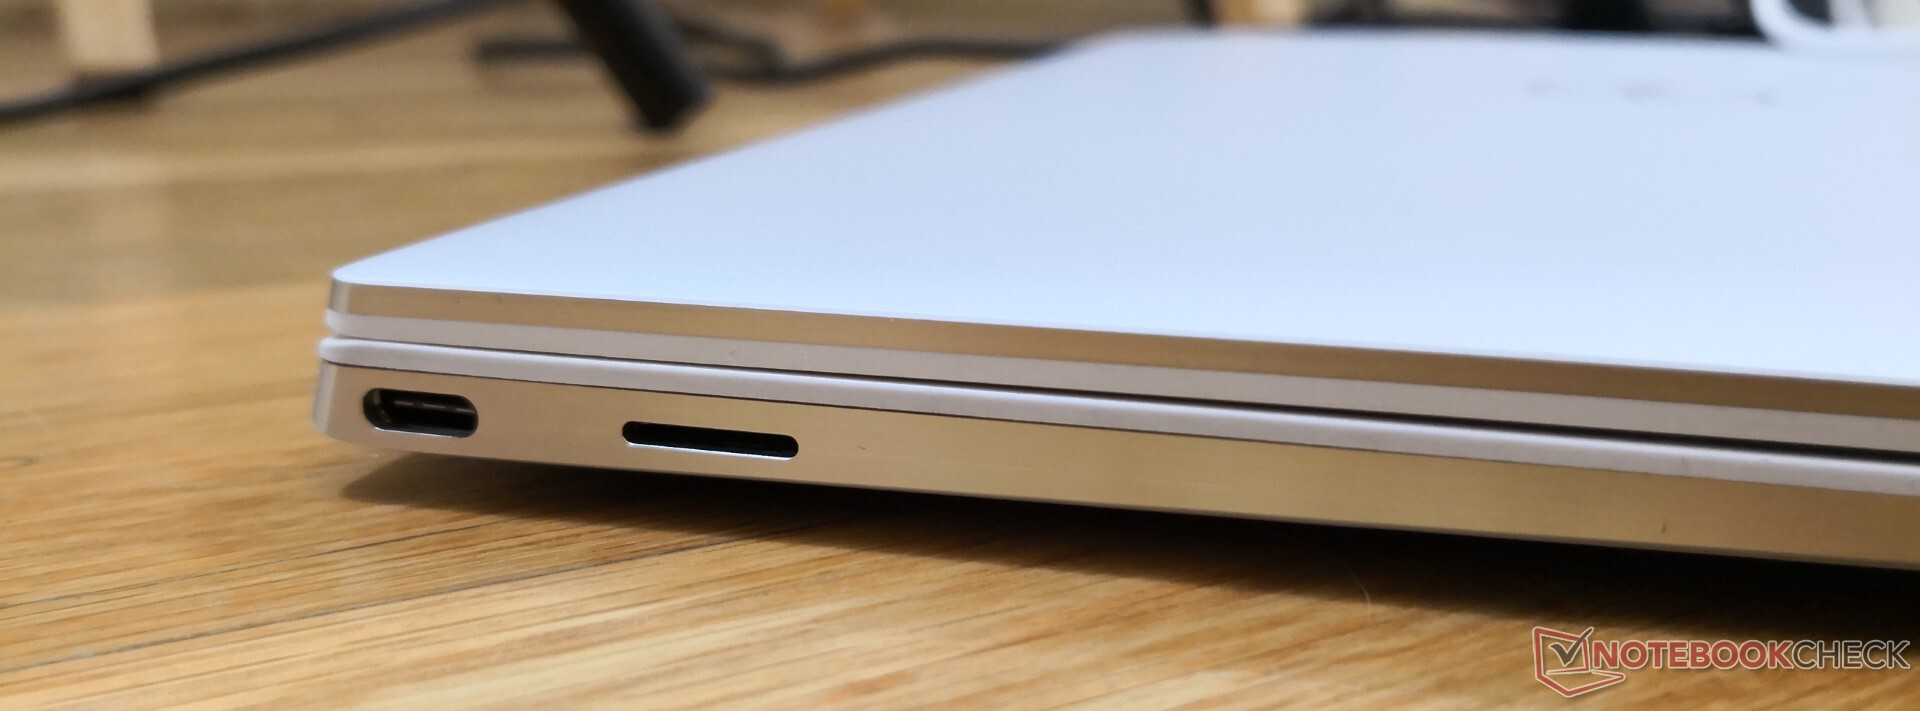
| SD Card Reader | |
| average JPG Copy Test (av. of 3 runs) | |
| Dell XPS 13 7390 Core i7-10710U (Toshiba Exceria Pro M501 64 GB UHS-II) | |
| Dell XPS 13 9300 Core i7-1065G7 (Toshiba Exceria Pro M501 64 GB UHS-II) | |
| Dell XPS 13 7390 2-in-1 Core i7 (Toshiba Exceria Pro M501 64 GB UHS-II) | |
| Asus ZenBook S13 UX392FN (Toshiba Exceria Pro M501 64 GB UHS-II) | |
| maximum AS SSD Seq Read Test (1GB) | |
| Dell XPS 13 7390 Core i7-10710U (Toshiba Exceria Pro M501 64 GB UHS-II) | |
| Dell XPS 13 7390 2-in-1 Core i7 (Toshiba Exceria Pro M501 64 GB UHS-II) | |
| Dell XPS 13 9300 Core i7-1065G7 (Toshiba Exceria Pro M501 64 GB UHS-II) | |
| Asus ZenBook S13 UX392FN (Toshiba Exceria Pro M501 64 GB UHS-II) | |

| |||||||||||||||||||||||||
Distribution av ljusstyrkan: 96 %
Mitt på batteriet: 607.6 cd/m²
Kontrast: 1519:1 (Svärta: 0.4 cd/m²)
ΔE ColorChecker Calman: 3.23 | ∀{0.5-29.43 Ø4.73}
calibrated: 1.01
ΔE Greyscale Calman: 5.5 | ∀{0.09-98 Ø4.97}
97.5% sRGB (Argyll 1.6.3 3D)
63% AdobeRGB 1998 (Argyll 1.6.3 3D)
68.5% AdobeRGB 1998 (Argyll 3D)
97.3% sRGB (Argyll 3D)
66.3% Display P3 (Argyll 3D)
Gamma: 2.12
CCT: 6413 K
| Dell XPS 13 9300 Core i7-1065G7 Sharp LQ134N1, IPS, 13.4", 1920x1200 | Dell XPS 13 7390 Core i7-10710U AU Optronics B133ZAN, Dell P/N: 90NTH, IPS, 13.3", 3840x2160 | Dell XPS 13 7390 2-in-1 Core i7 Sharp LQ134N1, IPS, 13.4", 1920x1200 | Huawei Matebook X Pro i5 Tianma XM, IPS, 13.9", 3000x2000 | Asus ZenBook S13 UX392FN Tianma XM, IPS, 13.9", 1920x1080 | Microsoft Surface Laptop 3 13 Core i5-1035G7 Sharp LQ135P1JX51, IPS, 13.5", 2256x1504 | |
|---|---|---|---|---|---|---|
| Display | -5% | 4% | -1% | 0% | -0% | |
| Display P3 Coverage (%) | 66.3 | 63.4 -4% | 69.9 5% | 65.9 -1% | 67.5 2% | 65.7 -1% |
| sRGB Coverage (%) | 97.3 | 93.7 -4% | 99.2 2% | 95.2 -2% | 95.8 -2% | 98.6 1% |
| AdobeRGB 1998 Coverage (%) | 68.5 | 64.3 -6% | 71.5 4% | 67.6 -1% | 69 1% | 67.8 -1% |
| Response Times | -2% | 9% | 21% | 16% | -22% | |
| Response Time Grey 50% / Grey 80% * (ms) | 50 ? | 51.6 ? -3% | 47.6 ? 5% | 40.4 ? 19% | 47.2 ? 6% | 59.2 ? -18% |
| Response Time Black / White * (ms) | 33.2 ? | 33.6 ? -1% | 29.2 ? 12% | 25.6 ? 23% | 24.8 ? 25% | 41.6 ? -25% |
| PWM Frequency (Hz) | 2500 ? | 2500 ? | 21740 ? | |||
| Screen | -30% | 7% | -8% | 2% | 13% | |
| Brightness middle (cd/m²) | 607.6 | 408.2 -33% | 549.8 -10% | 442.7 -27% | 466 -23% | 403.4 -34% |
| Brightness (cd/m²) | 595 | 399 -33% | 520 -13% | 428 -28% | 462 -22% | 397 -33% |
| Brightness Distribution (%) | 96 | 89 -7% | 86 -10% | 84 -12% | 90 -6% | 89 -7% |
| Black Level * (cd/m²) | 0.4 | 0.39 2% | 0.39 2% | 0.31 23% | 0.33 17% | 0.34 15% |
| Contrast (:1) | 1519 | 1047 -31% | 1410 -7% | 1428 -6% | 1412 -7% | 1186 -22% |
| Colorchecker dE 2000 * | 3.23 | 4.6 -42% | 2.12 34% | 2.24 31% | 1.93 40% | 0.94 71% |
| Colorchecker dE 2000 max. * | 8.67 | 11.84 -37% | 3.66 58% | 7.19 17% | 4.26 51% | 2.92 66% |
| Colorchecker dE 2000 calibrated * | 1.01 | 2.03 -101% | 1.37 -36% | 1.11 -10% | 1.99 -97% | 0.99 2% |
| Greyscale dE 2000 * | 5.5 | 7.5 -36% | 2.6 53% | 9.7 -76% | 1.7 69% | 0.9 84% |
| Gamma | 2.12 104% | 2.12 104% | 2.3 96% | 1.42 155% | 2.15 102% | 2.13 103% |
| CCT | 6413 101% | 7966 82% | 6884 94% | 6227 104% | 6382 102% | 6620 98% |
| Color Space (Percent of AdobeRGB 1998) (%) | 63 | 59.5 -6% | 65.4 4% | 61.6 -2% | 62.2 -1% | 62.3 -1% |
| Color Space (Percent of sRGB) (%) | 97.5 | 93.5 -4% | 99.7 2% | 95 -3% | 95.7 -2% | 98.7 1% |
| Totalt genomsnitt (program/inställningar) | -12% /
-22% | 7% /
7% | 4% /
-3% | 6% /
3% | -3% /
6% |
* ... mindre är bättre
Visa svarstider
| ↔ Svarstid svart till vitt | ||
|---|---|---|
| 33.2 ms ... stiga ↗ och falla ↘ kombinerat | ↗ 16 ms stiga | 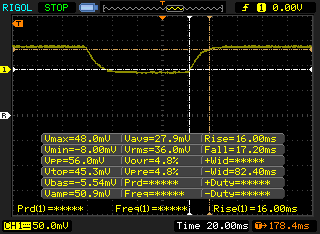 |
| ↘ 17.2 ms hösten | ||
| Skärmen visar långsamma svarsfrekvenser i våra tester och kommer att vara otillfredsställande för spelare. I jämförelse sträcker sig alla testade enheter från 0.1 (minst) till 240 (maximalt) ms. » 90 % av alla enheter är bättre. Detta innebär att den uppmätta svarstiden är sämre än genomsnittet av alla testade enheter (19.9 ms). | ||
| ↔ Svarstid 50 % grått till 80 % grått | ||
| 50 ms ... stiga ↗ och falla ↘ kombinerat | ↗ 22 ms stiga | 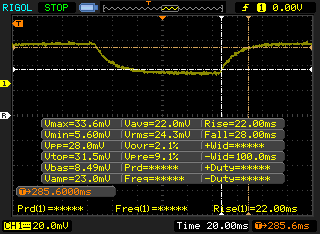 |
| ↘ 28 ms hösten | ||
| Skärmen visar långsamma svarsfrekvenser i våra tester och kommer att vara otillfredsställande för spelare. I jämförelse sträcker sig alla testade enheter från 0.165 (minst) till 636 (maximalt) ms. » 86 % av alla enheter är bättre. Detta innebär att den uppmätta svarstiden är sämre än genomsnittet av alla testade enheter (31.1 ms). | ||
Skärmflimmer / PWM (Puls-Width Modulation)
| Skärmflimmer / PWM upptäckt | 2500 Hz | ≤ 25 % ljusstyrka inställning | 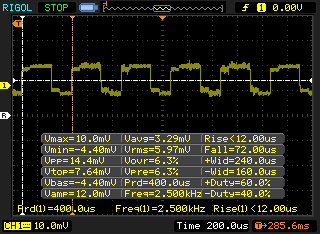 |
Displayens bakgrundsbelysning flimrar vid 2500 Hz (i värsta fall, t.ex. med PWM) Flimrande upptäckt vid en ljusstyrkeinställning på 25 % och lägre. Det ska inte finnas något flimmer eller PWM över denna ljusstyrkeinställning. Frekvensen för 2500 Hz är ganska hög, så de flesta användare som är känsliga för PWM bör inte märka något flimmer. Som jämförelse: 52 % av alla testade enheter använder inte PWM för att dämpa skärmen. Om PWM upptäcktes mättes ett medelvärde av 7784 (minst: 5 - maximum: 343500) Hz. | |||
| Cinebench R10 | |
| Rendering Multiple CPUs 32Bit | |
| Dell XPS 13 7390 Core i7-10710U | |
| Asus ZenBook 15 UX534FTC-A8190T | |
| Microsoft Surface Pro 7 Core i5-1035G4 | |
| Genomsnitt Intel Core i7-1065G7 (16551 - 26481, n=4) | |
| Dynabook Portege A30-E-174 | |
| Dell XPS 13 7390 2-in-1 Core i3 | |
| Rendering Single 32Bit | |
| Dell XPS 13 7390 Core i7-10710U | |
| Asus ZenBook 15 UX534FTC-A8190T | |
| Genomsnitt Intel Core i7-1065G7 (7083 - 7390, n=4) | |
| Microsoft Surface Pro 7 Core i5-1035G4 | |
| Dell XPS 13 7390 2-in-1 Core i3 | |
| Dynabook Portege A30-E-174 | |
| wPrime 2.10 - 1024m | |
| Dell XPS 13 7390 2-in-1 Core i3 | |
| Microsoft Surface Pro 7 Core i5-1035G4 | |
| Genomsnitt Intel Core i7-1065G7 (233 - 354, n=3) | |
| Dell XPS 13 7390 Core i7-10710U | |
* ... mindre är bättre
| PCMark 8 Home Score Accelerated v2 | 3825 poäng | |
| PCMark 8 Work Score Accelerated v2 | 5039 poäng | |
| PCMark 10 Score | 4154 poäng | |
Hjälp | ||
| Dell XPS 13 9300 Core i7-1065G7 Intel SSDPEMKF512G8 NVMe SSD | Dell XPS 13 7390 Core i7-10710U SK Hynix PC601 NVMe 512 GB | Dell XPS 13 7390 2-in-1 Core i7 Toshiba BG4 KBG40ZPZ512G | Microsoft Surface Laptop 3 13 Core i5-1035G7 SK hynix BC501 HFM256GDGTNG | Asus ZenBook S13 UX392FN WDC PC SN520 SDAPNUW-512G | |
|---|---|---|---|---|---|
| AS SSD | 30% | -20% | -23% | 39% | |
| Seq Read (MB/s) | 1956 | 1804 -8% | 1801 -8% | 1387 -29% | 1224 -37% |
| Seq Write (MB/s) | 1227 | 1000 -19% | 1125 -8% | 504 -59% | 907 -26% |
| 4K Read (MB/s) | 63 | 45.1 -28% | 39.7 -37% | 42.35 -33% | 41.46 -34% |
| 4K Write (MB/s) | 156.6 | 115 -27% | 67 -57% | 120 -23% | 126.2 -19% |
| 4K-64 Read (MB/s) | 475.6 | 893 88% | 1253 163% | 497.4 5% | 1021 115% |
| 4K-64 Write (MB/s) | 539 | 732 36% | 209 -61% | 354.9 -34% | 1251 132% |
| Access Time Read * (ms) | 0.042 | 0.044 -5% | 0.069 -64% | 0.055 -31% | 0.053 -26% |
| Access Time Write * (ms) | 0.105 | 0.095 10% | 0.625 -495% | 0.093 11% | 0.027 74% |
| Score Read (Points) | 734 | 1119 52% | 1472 101% | 678 -8% | 1185 61% |
| Score Write (Points) | 818 | 947 16% | 388 -53% | 525 -36% | 1468 79% |
| Score Total (Points) | 1915 | 2608 36% | 2583 35% | 1520 -21% | 3250 70% |
| Copy ISO MB/s (MB/s) | 1022 | 1515 48% | 1293 27% | 764 -25% | 1404 37% |
| Copy Program MB/s (MB/s) | 302.8 | 535 77% | 560 85% | 256.1 -15% | 402.4 33% |
| Copy Game MB/s (MB/s) | 491.4 | 1211 146% | 927 89% | 368.4 -25% | 902 84% |
| CrystalDiskMark 5.2 / 6 | 12% | -13% | -35% | -9% | |
| Write 4K (MB/s) | 186.8 | 134 -28% | 106.7 -43% | 112.3 -40% | 149.2 -20% |
| Read 4K (MB/s) | 71.4 | 42.91 -40% | 49.94 -30% | 42.13 -41% | 47.18 -34% |
| Write Seq (MB/s) | 1203 | 1841 53% | 1223 2% | 630 -48% | 750 -38% |
| Read Seq (MB/s) | 2600 | 1707 -34% | 1801 -31% | 1023 -61% | 1137 -56% |
| Write 4K Q32T1 (MB/s) | 514 | 394.7 -23% | 325.3 -37% | 336.6 -35% | 749 46% |
| Read 4K Q32T1 (MB/s) | 570 | 398.5 -30% | 551 -3% | 399.6 -30% | 478.7 -16% |
| Write Seq Q32T1 (MB/s) | 786 | 2250 186% | 1224 56% | 821 4% | 1453 85% |
| Read Seq Q32T1 (MB/s) | 2947 | 3265 11% | 2350 -20% | 2030 -31% | 1713 -42% |
| Totalt genomsnitt (program/inställningar) | 21% /
24% | -17% /
-18% | -29% /
-28% | 15% /
21% |
* ... mindre är bättre

| 3DMark 11 Performance | 4866 poäng | |
| 3DMark Ice Storm Standard Score | 67829 poäng | |
| 3DMark Cloud Gate Standard Score | 14272 poäng | |
| 3DMark Fire Strike Score | 2753 poäng | |
| 3DMark Time Spy Score | 937 poäng | |
Hjälp | ||
| Shadow of the Tomb Raider - 1280x720 Lowest Preset | |
| Desktop PC | |
| MSI Modern 15 A10RB | |
| Dell Inspiron 15 5000 5585 | |
| Dell XPS 13 9300 Core i7-1065G7 | |
| Genomsnitt Intel Iris Plus Graphics G7 (Ice Lake 64 EU) (15.6 - 33, n=13) | |
| Dell XPS 13 7390 Core i7-10710U | |
| The Witcher 3 | |
| 1024x768 Low Graphics & Postprocessing | |
| Huawei MateBook 13 i7 | |
| MSI Modern 15 A10RB | |
| Dell Inspiron 15 5000 5585 | |
| Dell XPS 13 9300 Core i7-1065G7 | |
| Genomsnitt Intel Iris Plus Graphics G7 (Ice Lake 64 EU) (28.2 - 58, n=20) | |
| Dell XPS 13 7390 Core i7-10710U | |
| HP Pavilion x360 15-dq0065cl | |
| 1366x768 Medium Graphics & Postprocessing | |
| MSI Modern 15 A10RB | |
| Huawei MateBook 13 i7 | |
| Dell XPS 13 9300 Core i7-1065G7 | |
| Genomsnitt Intel Iris Plus Graphics G7 (Ice Lake 64 EU) (20.8 - 36.8, n=18) | |
| HP Pavilion x360 15-dq0065cl | |
| 1920x1080 High Graphics & Postprocessing (Nvidia HairWorks Off) | |
| HP Pavilion Gaming 15t-cx0000 | |
| MSI Modern 15 A10RB | |
| Huawei MateBook 13 i7 | |
| Dell Inspiron 15 5000 5585 | |
| Dell XPS 13 9300 Core i7-1065G7 | |
| Genomsnitt Intel Iris Plus Graphics G7 (Ice Lake 64 EU) (10.9 - 20.1, n=18) | |
| låg | med. | hög | ultra | |
|---|---|---|---|---|
| BioShock Infinite (2013) | 104.2 | 66.8 | 56.7 | 21.1 |
| The Witcher 3 (2015) | 50.7 | 33.5 | 18.4 | 9.1 |
| Rocket League (2017) | 85.5 | 53.6 | 38.3 | |
| Shadow of the Tomb Raider (2018) | 28 |
| Dell XPS 13 9300 Core i7-1065G7 Iris Plus Graphics G7 (Ice Lake 64 EU), i7-1065G7, Intel SSDPEMKF512G8 NVMe SSD | Dell XPS 13 7390 Core i7-10710U UHD Graphics 620, i7-10710U, SK Hynix PC601 NVMe 512 GB | Dell XPS 13 7390 2-in-1 Core i7 Iris Plus Graphics G7 (Ice Lake 64 EU), i7-1065G7, Toshiba BG4 KBG40ZPZ512G | Huawei Matebook X Pro i5 GeForce MX150, i5-8250U, Samsung PM961 MZVLW256HEHP | Microsoft Surface Laptop 3 13 Core i5-1035G7 Iris Plus Graphics G7 (Ice Lake 64 EU), i5-1035G7, SK hynix BC501 HFM256GDGTNG | Dell XPS 13 9300 i5 FHD UHD Graphics G1 (Ice Lake 32 EU), i5-1035G1, Toshiba XG6 KXG60ZNV512G | |
|---|---|---|---|---|---|---|
| Noise | -3% | -2% | -5% | 0% | 2% | |
| av / miljö * (dB) | 28.3 | 28 1% | 28.1 1% | 27.9 1% | 28.5 -1% | 29.3 -4% |
| Idle Minimum * (dB) | 28.3 | 28 1% | 28.1 1% | 27.9 1% | 28.5 -1% | 29.3 -4% |
| Idle Average * (dB) | 28.3 | 28 1% | 28.1 1% | 27.9 1% | 28.5 -1% | 29.3 -4% |
| Idle Maximum * (dB) | 28.3 | 28 1% | 28.1 1% | 27.9 1% | 28.5 -1% | 29.3 -4% |
| Load Average * (dB) | 32.5 | 33.7 -4% | 31.7 2% | 36.2 -11% | 28.5 12% | 30 8% |
| Witcher 3 ultra * (dB) | 39.3 | 43.4 -10% | 45 -15% | 40.4 -3% | ||
| Load Maximum * (dB) | 39.3 | 46.5 -18% | 43.4 -10% | 45.2 -15% | 40.4 -3% | 32.4 18% |
* ... mindre är bättre
Ljudnivå
| Låg belastning |
| 28.3 / 28.3 / 28.3 dB(A) |
| Hög belastning |
| 32.5 / 39.3 dB(A) |
 | ||
30 dB tyst 40 dB(A) hörbar 50 dB(A) högt ljud |
||
min: | ||
(-) Den maximala temperaturen på ovansidan är 46.6 °C / 116 F, jämfört med genomsnittet av 35.9 °C / 97 F , allt från 21.4 till 59 °C för klassen Subnotebook.
(±) Botten värms upp till maximalt 44.8 °C / 113 F, jämfört med genomsnittet av 39.2 °C / 103 F
(+) Vid tomgångsbruk är medeltemperaturen för ovansidan 27.4 °C / 81 F, jämfört med enhetsgenomsnittet på 30.8 °C / ### class_avg_f### F.
(±) När du spelar The Witcher 3 är medeltemperaturen för ovansidan 33.9 °C / 93 F, jämfört med enhetsgenomsnittet på 30.8 °C / ## #class_avg_f### F.
(+) Handledsstöden och pekplattan är kallare än hudtemperaturen med maximalt 29.8 °C / 85.6 F och är därför svala att ta på.
(±) Medeltemperaturen för handledsstödsområdet på liknande enheter var 28.2 °C / 82.8 F (-1.6 °C / -2.8 F).
| Av/Standby | |
| Låg belastning | |
| Hög belastning |
|
Förklaring:
min: | |
| Dell XPS 13 9300 Core i7-1065G7 i7-1065G7, Iris Plus Graphics G7 (Ice Lake 64 EU), Intel SSDPEMKF512G8 NVMe SSD, IPS, 1920x1200, 13.4" | Dell XPS 13 7390 Core i7-10710U i7-10710U, UHD Graphics 620, SK Hynix PC601 NVMe 512 GB, IPS, 3840x2160, 13.3" | Dell XPS 13 7390 2-in-1 Core i7 i7-1065G7, Iris Plus Graphics G7 (Ice Lake 64 EU), Toshiba BG4 KBG40ZPZ512G, IPS, 1920x1200, 13.4" | Huawei Matebook X Pro i5 i5-8250U, GeForce MX150, Samsung PM961 MZVLW256HEHP, IPS, 3000x2000, 13.9" | Asus ZenBook S13 UX392FN i7-8565U, GeForce MX150, WDC PC SN520 SDAPNUW-512G, IPS, 1920x1080, 13.9" | Microsoft Surface Laptop 3 13 Core i5-1035G7 i5-1035G7, Iris Plus Graphics G7 (Ice Lake 64 EU), SK hynix BC501 HFM256GDGTNG, IPS, 2256x1504, 13.5" | Dell XPS 13 9300 i5 FHD i5-1035G1, UHD Graphics G1 (Ice Lake 32 EU), Toshiba XG6 KXG60ZNV512G, IPS, 1920x1200, 13.4" | |
|---|---|---|---|---|---|---|---|
| Power Consumption | -16% | 4% | -27% | -17% | -14% | -3% | |
| Idle Minimum * (Watt) | 4.2 | 4.7 -12% | 2.6 38% | 3.5 17% | 3.4 19% | 4.4 -5% | 3.4 19% |
| Idle Average * (Watt) | 6.9 | 8.3 -20% | 5.3 23% | 8.9 -29% | 6.3 9% | 7.5 -9% | 6 13% |
| Idle Maximum * (Watt) | 7.5 | 9 -20% | 7 7% | 12.3 -64% | 10.4 -39% | 7.8 -4% | 10.2 -36% |
| Load Average * (Watt) | 33.3 | 42 -26% | 43.1 -29% | 54.2 -63% | 51 -53% | 41.9 -26% | 36.6 -10% |
| Witcher 3 ultra * (Watt) | 37.1 | 43.1 -16% | 42.4 -14% | 39 -5% | 40.8 -10% | ||
| Load Maximum * (Watt) | 48.4 | 49 -1% | 49 -1% | 52.1 -8% | 62.7 -30% | 63.9 -32% | 49.3 -2% |
* ... mindre är bättre
| Dell XPS 13 9300 Core i7-1065G7 i7-1065G7, Iris Plus Graphics G7 (Ice Lake 64 EU), 52 Wh | Dell XPS 13 7390 Core i7-10710U i7-10710U, UHD Graphics 620, 52 Wh | Dell XPS 13 7390 2-in-1 Core i7 i7-1065G7, Iris Plus Graphics G7 (Ice Lake 64 EU), 51 Wh | Huawei Matebook X Pro i5 i5-8250U, GeForce MX150, 57.4 Wh | Asus ZenBook S13 UX392FN i7-8565U, GeForce MX150, 50 Wh | Microsoft Surface Laptop 3 13 Core i5-1035G7 i5-1035G7, Iris Plus Graphics G7 (Ice Lake 64 EU), 45 Wh | Dell XPS 13 9300 i5 FHD i5-1035G1, UHD Graphics G1 (Ice Lake 32 EU), 52 Wh | |
|---|---|---|---|---|---|---|---|
| Batteridrifttid | -34% | -29% | -27% | -34% | -35% | -8% | |
| WiFi v1.3 (h) | 12.7 | 8.4 -34% | 9 -29% | 9.3 -27% | 8.4 -34% | 8.3 -35% | 11.7 -8% |
| Reader / Idle (h) | 20.7 | 28.5 | 34.4 | ||||
| Load (h) | 2.2 | 1.7 | 1.9 | 3.4 |
För
Emot
Läs den fullständiga versionen av den här recensionen på engelska här.
Att gå från modellen med Core i5-1035G1 till den med Core i7-1065G7 innebär ungefär 23 procent högre CPU-prestanda och 70 procent högre GPU-prestanda utan någon ökad energikostnad. Den största anledningen att välja modellen med Core i7 framför den med Core i5 är därför fördelen när det kommer till grafikprestanda, exempelvis för lätt fotoredigering eller för en match Rocket League eller LoL då och då. Om du i huvudsak använder datorn till ordbehandling, surfande eller videoströmning räcker Core i5-konfigurationen mer än väl. Faktum är att du också kan överväga de äldre modellerna med Whiskey Lake-U Core i5-8265U eller Core i7-8565U då Core i5-1035G1 presterar väldigt nära dessa äldre processorer.
CPU-prestandan börjar gå på knäna vid extrem belastning i längre perioder. Detta kommer dock knappast vara ett problem för subnotebook-målgruppen. Den som vill ha mer prestanda borde istället överväga mer kraftfulla laptops som XPS 15 eller Asus ZenBook Pro.
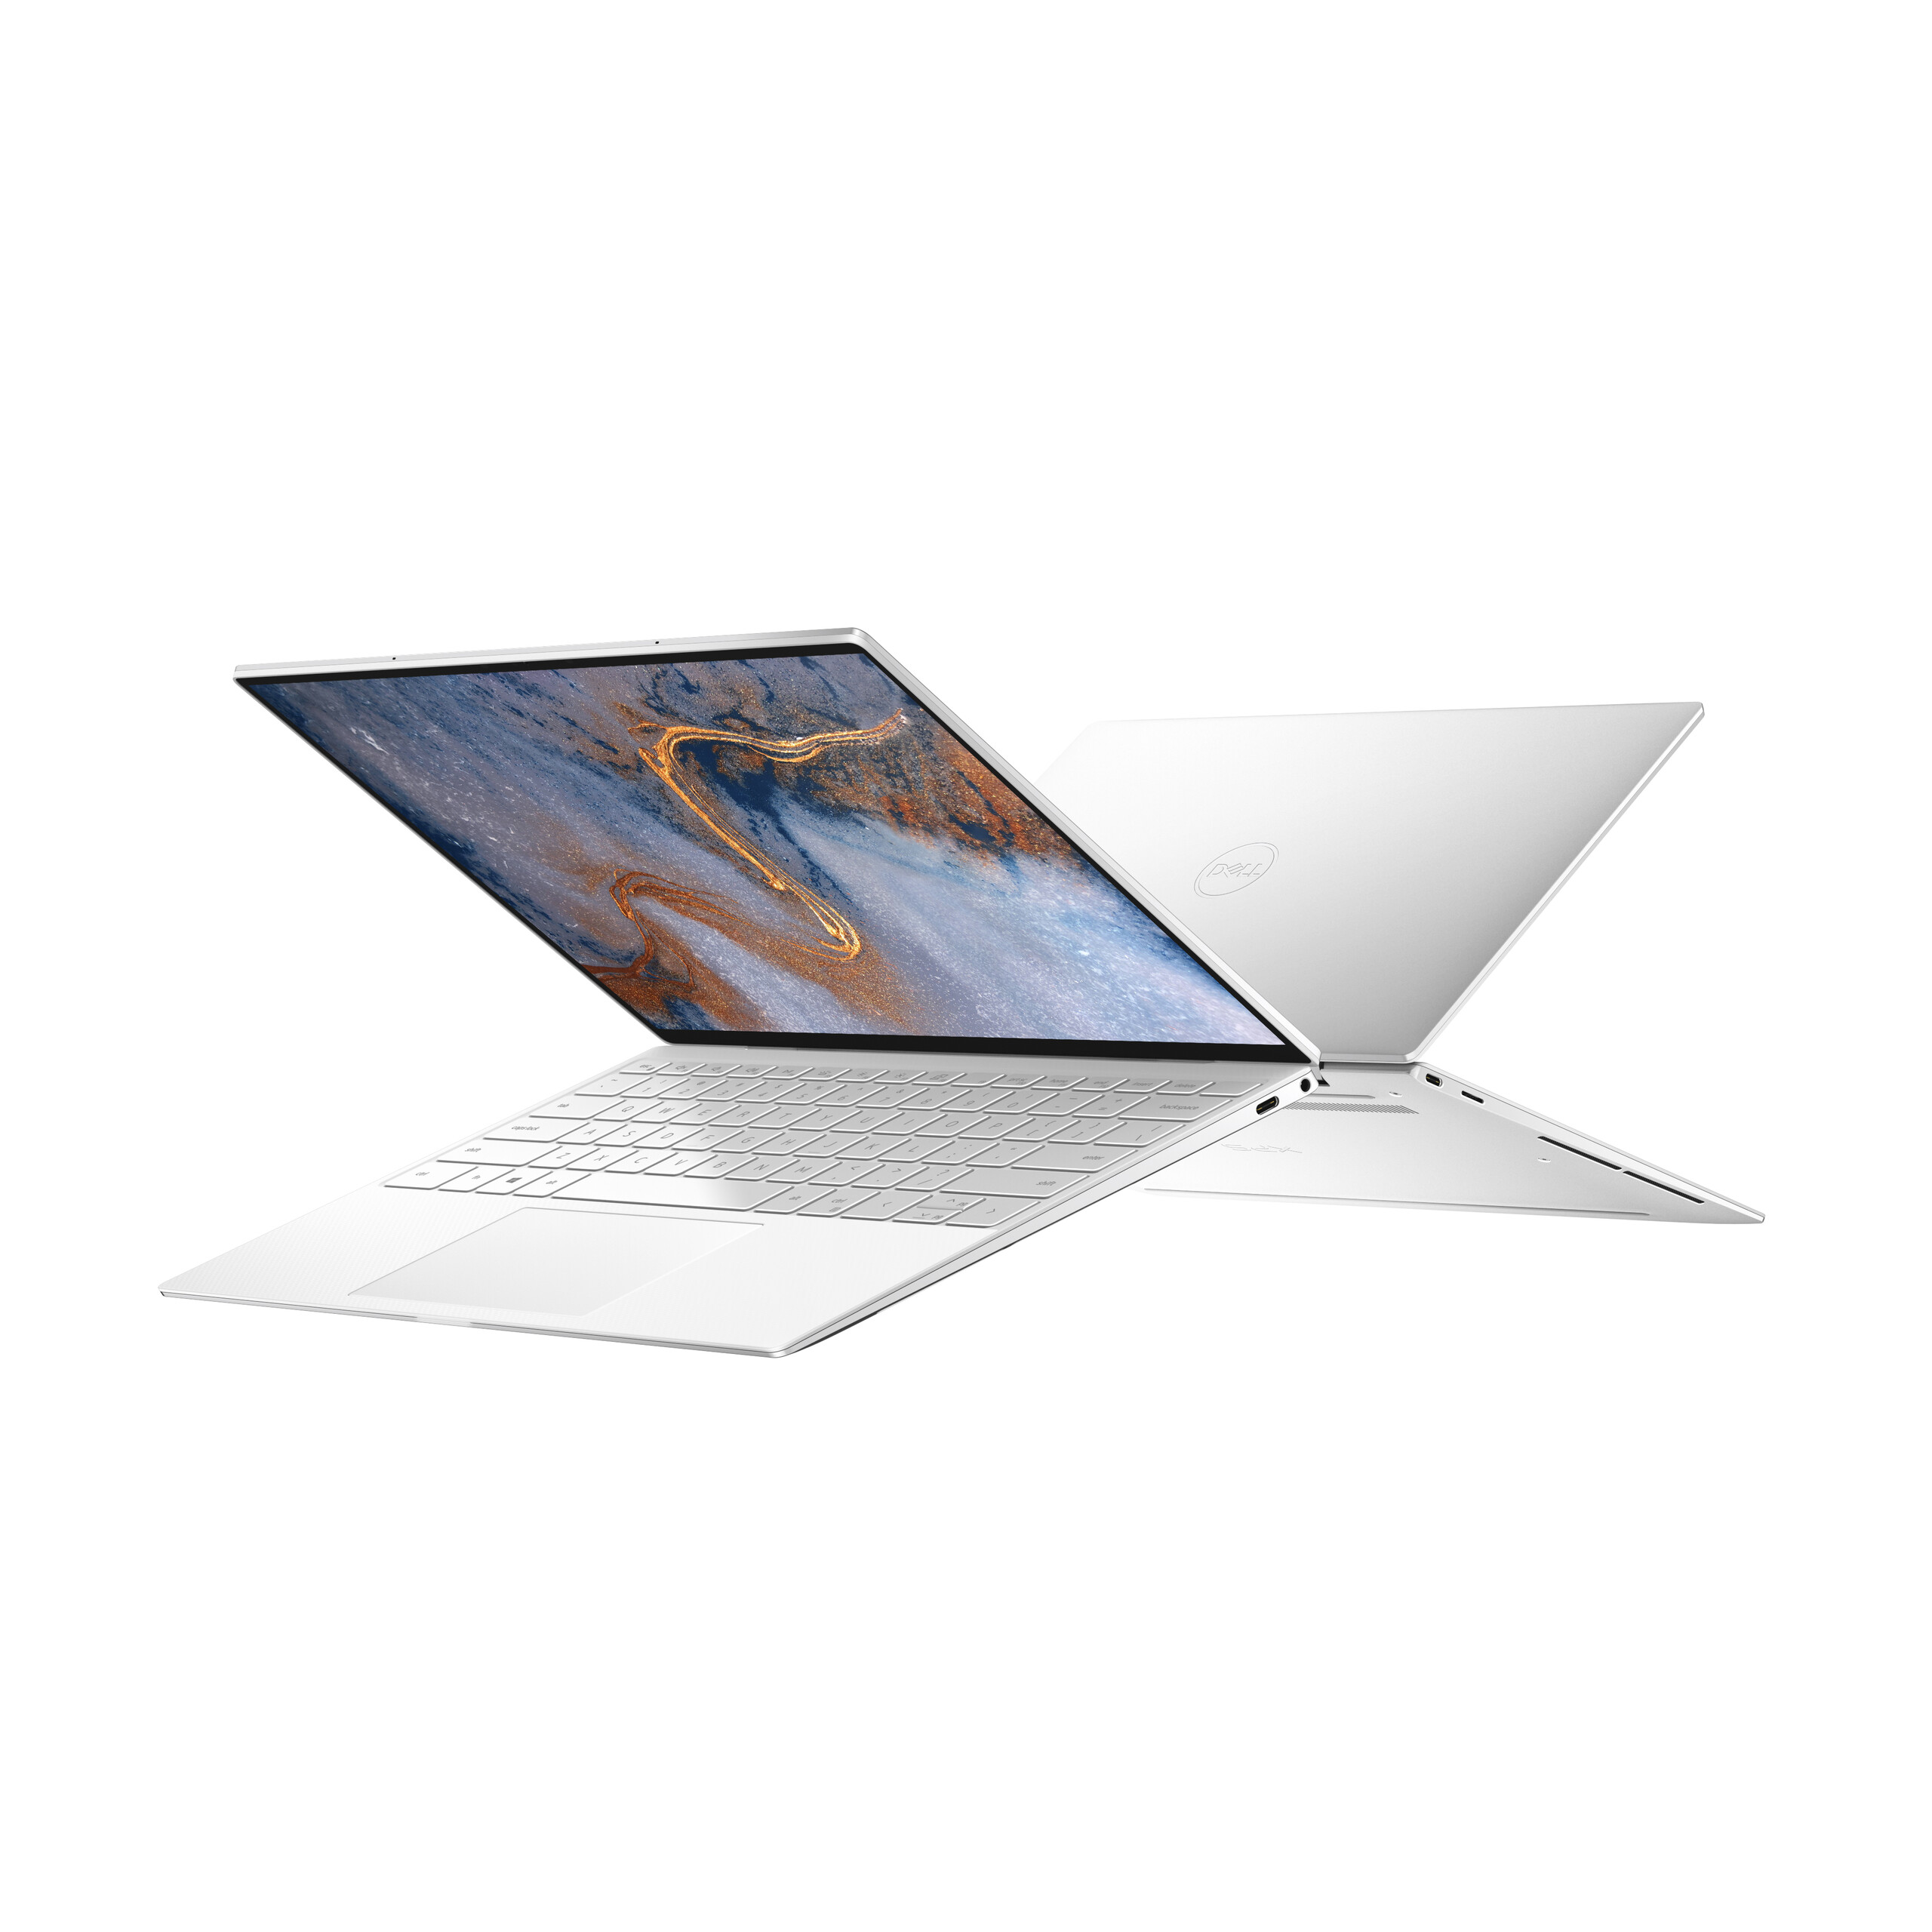
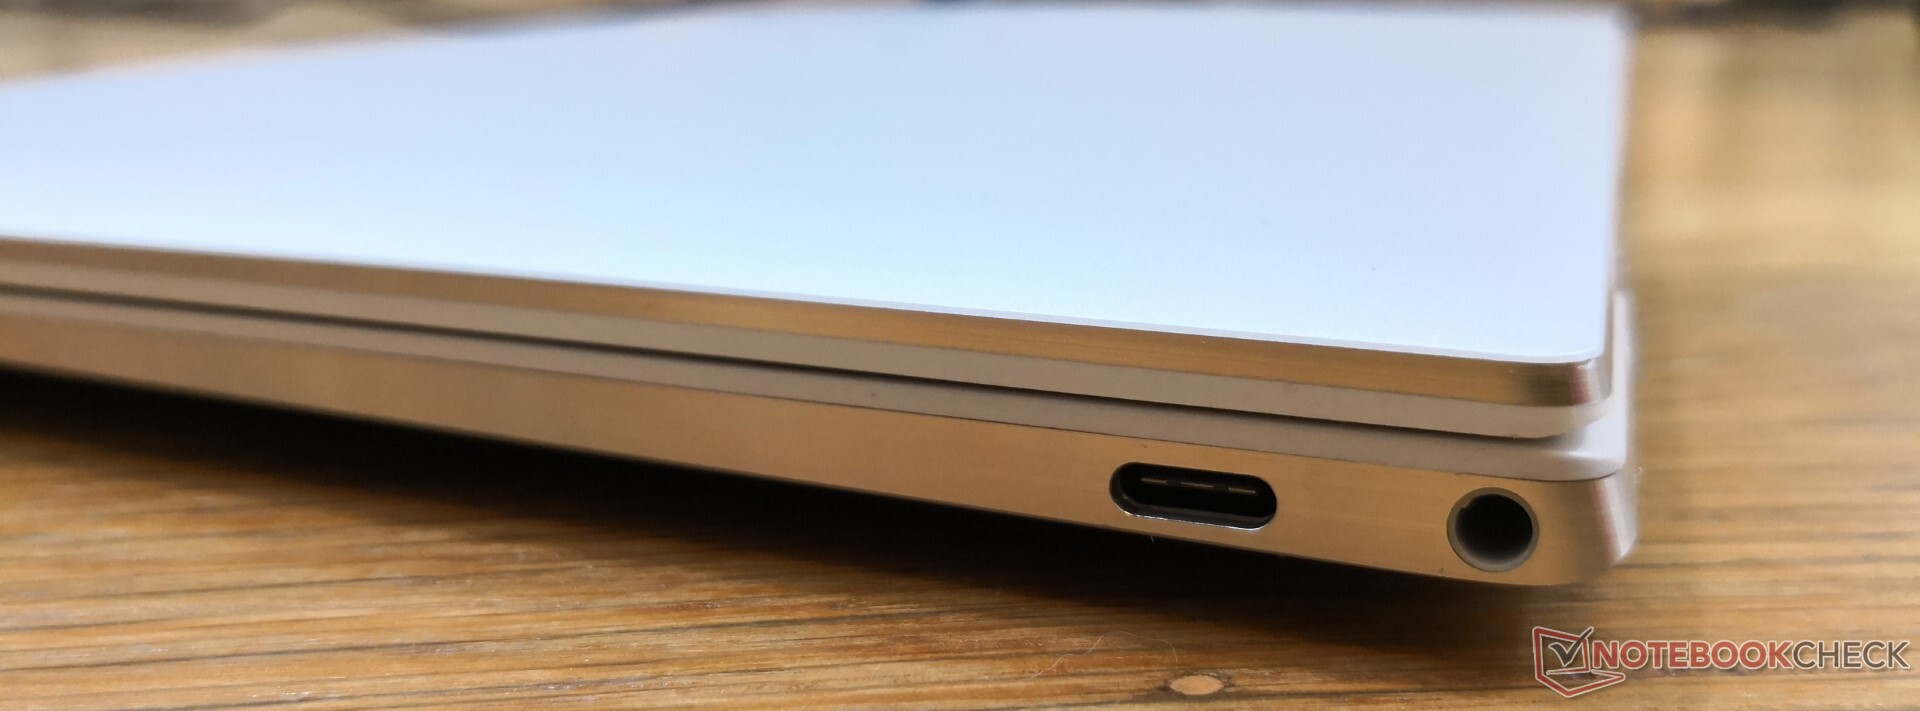
En mer lockande aspekt av XPS 13 9300 är att den har en större 16:10-skärm, vilket innebär en mer uppenbar fördel för användaren jämfört med de relativt små prestandauppdateringarna. Detta är troligen ett smart drag av Dell om de vill dra till sig fler av de MacBook Air- eller MacBook Pro 13-ägare som har dragit nytta av 16:10-skärmar i åratal. Vi tycker 16:10 är en bra kompromiss mellan traditionella 16:9-skärmar och fullständiga 3:2-skärmar som på Huawei MateBook X Pro eller på Microsofts Surface-serie.
XPS 13 blir ett bättre alternativ till MacBook för varje år som går. Den senaste designen lägger till en större 16:10-skärm och en clickpad utan att offra några större egenskaper jämfört med förra årets modell.
Dell XPS 13 9300 Core i7-1065G7
- 03/25/2020 v7 (old)
Allen Ngo
Price comparison
