Test: Lenovo IdeaPad S340-15 - Billig Core i7 Ice Lake vars pris märks på prestandan (Sammanfattning)
Gradering | Datum | Modell | Vikt | Höjd | Storlek | Upplösning | Pris |
|---|---|---|---|---|---|---|---|
| 79.4 % v7 (old) | 03/2020 | Lenovo Ideapad S340-15IIL i7-1065G7, Iris Plus Graphics G7 (Ice Lake 64 EU) | 1.8 kg | 17.9 mm | 15.60" | 1920x1080 | |
| 86.3 % v7 (old) | 10/2019 | Dell XPS 15 7590 i5 iGPU FHD i5-9300H, UHD Graphics 630 | 1.9 kg | 17 mm | 15.60" | 1920x1080 | |
| 83 % v6 (old) | 05/2019 | HP Pavilion 15-cs2019ng i5-8265U, GeForce MX250 | 1.9 kg | 18 mm | 15.60" | 1920x1080 | |
| 80.7 % v6 (old) | Asus VivoBook 15 X542UF-DM143T i5-8250U, GeForce MX130 | 2.3 kg | 23 mm | 15.60" | 1920x1080 | ||
| 84.1 % v6 (old) | 09/2023 | Lenovo Yoga 530-14ARR-81H9000VGE R7 2700U, Vega 10 | 1.7 kg | 17.6 mm | 14.00" | 1920x1080 |
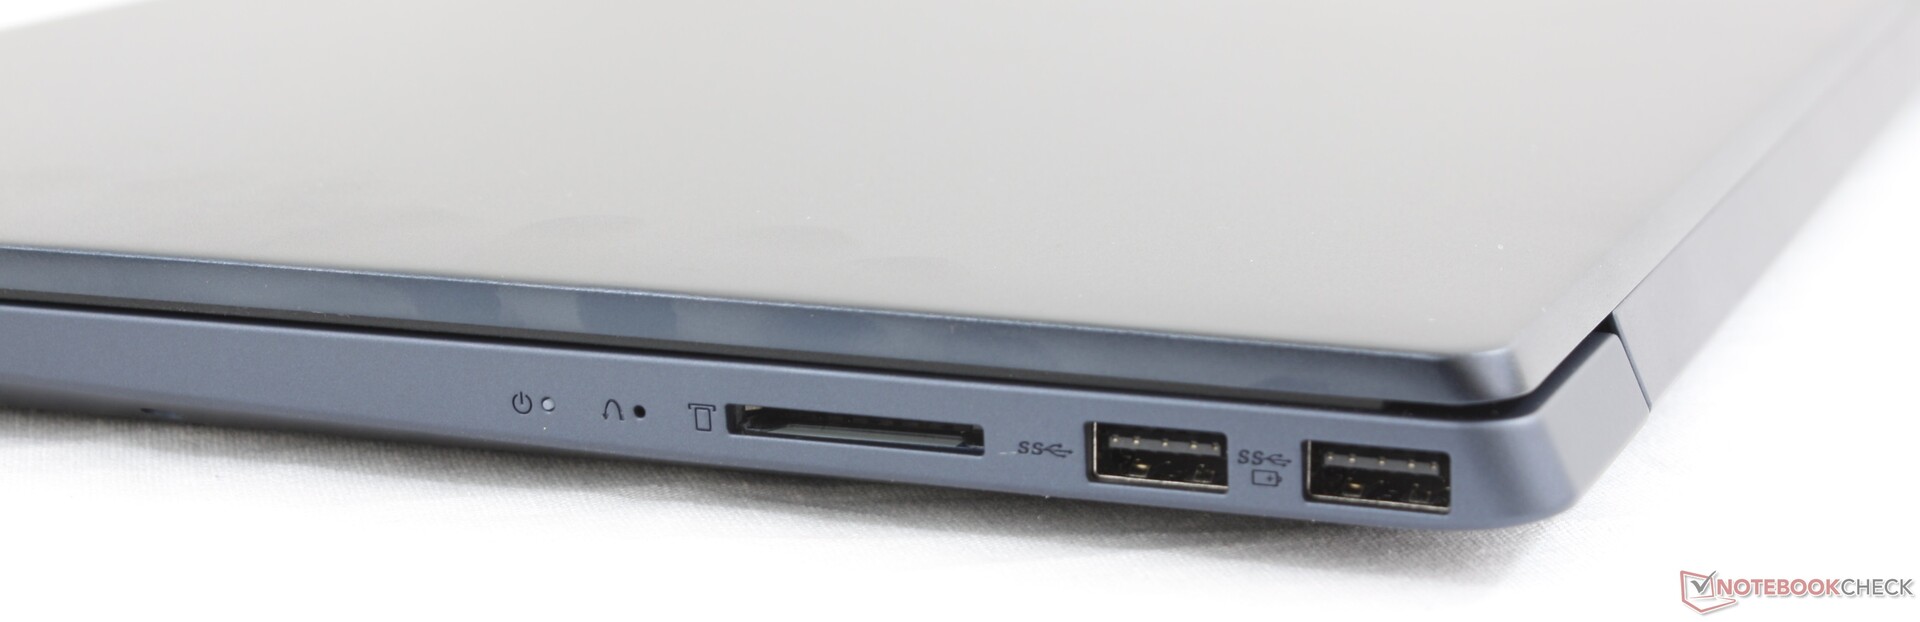
| SD Card Reader | |
| average JPG Copy Test (av. of 3 runs) | |
| Dell XPS 15 7590 i5 iGPU FHD (Toshiba Exceria Pro SDXC 64 GB UHS-II) | |
| Lenovo Ideapad S540-15IML (Toshiba Exceria Pro SDXC 64 GB UHS-II) | |
| Lenovo Ideapad S340-15IIL (Toshiba Exceria Pro SDXC 64 GB UHS-II) | |
| Dell Inspiron 15 5000 5585 (Toshiba Exceria Pro SDXC 64 GB UHS-II) | |
| maximum AS SSD Seq Read Test (1GB) | |
| Dell XPS 15 7590 i5 iGPU FHD (Toshiba Exceria Pro SDXC 64 GB UHS-II) | |
| Lenovo Ideapad S340-15IIL (Toshiba Exceria Pro SDXC 64 GB UHS-II) | |
| Lenovo Ideapad S540-15IML (Toshiba Exceria Pro SDXC 64 GB UHS-II) | |
| Dell Inspiron 15 5000 5585 (Toshiba Exceria Pro SDXC 64 GB UHS-II) | |
| Networking | |
| iperf3 transmit AX12 | |
| Lenovo ThinkPad T490 20RY0002US | |
| Lenovo Yoga C740-14IML | |
| Lenovo Ideapad S340-15IIL | |
| Alienware m17 R2 P41E | |
| iperf3 receive AX12 | |
| Lenovo ThinkPad T490 20RY0002US | |
| Lenovo Ideapad S340-15IIL | |
| Lenovo Yoga C740-14IML | |
| Alienware m17 R2 P41E | |

| |||||||||||||||||||||||||
Distribution av ljusstyrkan: 87 %
Mitt på batteriet: 320.8 cd/m²
Kontrast: 1188:1 (Svärta: 0.27 cd/m²)
ΔE ColorChecker Calman: 7.68 | ∀{0.5-29.43 Ø4.71}
calibrated: 4.65
ΔE Greyscale Calman: 7.3 | ∀{0.09-98 Ø4.96}
58.3% sRGB (Argyll 1.6.3 3D)
37.8% AdobeRGB 1998 (Argyll 1.6.3 3D)
41.77% AdobeRGB 1998 (Argyll 3D)
58.8% sRGB (Argyll 3D)
40.43% Display P3 (Argyll 3D)
Gamma: 2.12
CCT: 6213 K
| Lenovo Ideapad S340-15IIL BOE CQ NV156FHM-T03, IPS, 15.6", 1920x1080 | Dell XPS 15 7590 i5 iGPU FHD LQ156M1, IPS, 15.6", 1920x1080 | Dell Inspiron 15 5000 5585 LG Philips 156WFC, IPS, 15.6", 1920x1080 | Lenovo Ideapad S540-15IML BOEhydis NV156FHM-N61 (BOE06FB), IPS, 15.6", 1920x1080 | HP Pavilion 15-cs2019ng BOE080D, IPS, 15.6", 1920x1080 | Asus VivoBook 15 X542UF-DM143T BOE CQ NT156FHM-N41, TN LED, 15.6", 1920x1080 | |
|---|---|---|---|---|---|---|
| Display | 65% | -7% | 54% | 57% | -6% | |
| Display P3 Coverage (%) | 40.43 | 66.5 64% | 37.31 -8% | 66.8 65% | 67.2 66% | 37.47 -7% |
| sRGB Coverage (%) | 58.8 | 98 67% | 56.2 -4% | 86.5 47% | 88.1 50% | 56.4 -4% |
| AdobeRGB 1998 Coverage (%) | 41.77 | 68.4 64% | 38.55 -8% | 63.2 51% | 64.4 54% | 38.71 -7% |
| Response Times | -3% | 31% | -3% | 13% | 29% | |
| Response Time Grey 50% / Grey 80% * (ms) | 46.4 ? | 52.8 ? -14% | 28.4 ? 39% | 49.6 ? -7% | 43 ? 7% | 41 ? 12% |
| Response Time Black / White * (ms) | 35.2 ? | 32 ? 9% | 27.2 ? 23% | 34.8 ? 1% | 29 ? 18% | 19 ? 46% |
| PWM Frequency (Hz) | 1020 ? | 202 ? | 208 ? | 7000 ? | ||
| Screen | 49% | 2% | 25% | 24% | 0% | |
| Brightness middle (cd/m²) | 320.8 | 588 83% | 253.6 -21% | 299 -7% | 320 0% | 230 -28% |
| Brightness (cd/m²) | 309 | 555 80% | 227 -27% | 278 -10% | 293 -5% | 221 -28% |
| Brightness Distribution (%) | 87 | 89 2% | 84 -3% | 87 0% | 86 -1% | 91 5% |
| Black Level * (cd/m²) | 0.27 | 0.4 -48% | 0.27 -0% | 0.25 7% | 0.26 4% | 0.45 -67% |
| Contrast (:1) | 1188 | 1470 24% | 939 -21% | 1196 1% | 1231 4% | 511 -57% |
| Colorchecker dE 2000 * | 7.68 | 2.5 67% | 6.05 21% | 4.32 44% | 4.5 41% | 3.6 53% |
| Colorchecker dE 2000 max. * | 21.97 | 6.3 71% | 14.03 36% | 9.3 58% | 8.81 60% | 5.59 75% |
| Colorchecker dE 2000 calibrated * | 4.65 | 0.6 87% | 4.97 -7% | 2.58 45% | ||
| Greyscale dE 2000 * | 7.3 | 4.5 38% | 3.2 56% | 4.21 42% | 4.71 35% | 3.13 57% |
| Gamma | 2.12 104% | 2.2 100% | 2 110% | 2.39 92% | 2.45 90% | 2.45 90% |
| CCT | 6213 105% | 6836 95% | 6820 95% | 6799 96% | 7085 92% | 7244 90% |
| Color Space (Percent of AdobeRGB 1998) (%) | 37.8 | 63.2 67% | 35.5 -6% | 57 51% | 58 53% | 36 -5% |
| Color Space (Percent of sRGB) (%) | 58.3 | 98 68% | 55.6 -5% | 86 48% | 88 51% | 56 -4% |
| Totalt genomsnitt (program/inställningar) | 37% /
46% | 9% /
4% | 25% /
27% | 31% /
29% | 8% /
3% |
* ... mindre är bättre
Visa svarstider
| ↔ Svarstid svart till vitt | ||
|---|---|---|
| 35.2 ms ... stiga ↗ och falla ↘ kombinerat | ↗ 20.4 ms stiga | 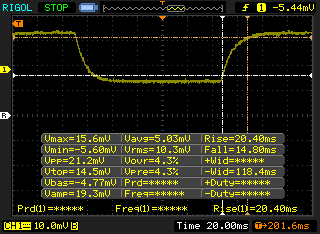 |
| ↘ 14.8 ms hösten | ||
| Skärmen visar långsamma svarsfrekvenser i våra tester och kommer att vara otillfredsställande för spelare. I jämförelse sträcker sig alla testade enheter från 0.1 (minst) till 240 (maximalt) ms. » 93 % av alla enheter är bättre. Detta innebär att den uppmätta svarstiden är sämre än genomsnittet av alla testade enheter (19.8 ms). | ||
| ↔ Svarstid 50 % grått till 80 % grått | ||
| 46.4 ms ... stiga ↗ och falla ↘ kombinerat | ↗ 26 ms stiga | 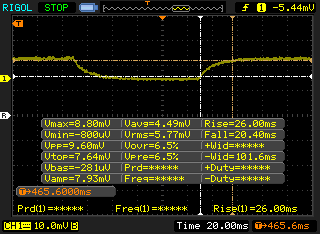 |
| ↘ 20.4 ms hösten | ||
| Skärmen visar långsamma svarsfrekvenser i våra tester och kommer att vara otillfredsställande för spelare. I jämförelse sträcker sig alla testade enheter från 0.165 (minst) till 636 (maximalt) ms. » 80 % av alla enheter är bättre. Detta innebär att den uppmätta svarstiden är sämre än genomsnittet av alla testade enheter (31 ms). | ||
Skärmflimmer / PWM (Puls-Width Modulation)
| Skärmflimmer / PWM upptäcktes inte | 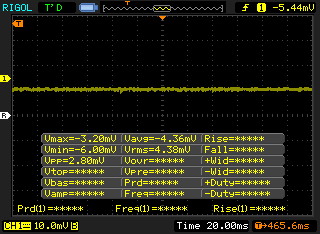 | ||
Som jämförelse: 52 % av alla testade enheter använder inte PWM för att dämpa skärmen. Om PWM upptäcktes mättes ett medelvärde av 7754 (minst: 5 - maximum: 343500) Hz. | |||
| Cinebench R10 | |
| Rendering Multiple CPUs 32Bit | |
| Microsoft Surface Laptop 3 13 Core i5-1035G7 | |
| Genomsnitt Intel Core i7-1065G7 (16551 - 26481, n=4) | |
| Lenovo Yoga 530-14ARR-81H9000VGE | |
| Dynabook Portege A30-E-174 | |
| Rendering Single 32Bit | |
| Genomsnitt Intel Core i7-1065G7 (7083 - 7390, n=4) | |
| Microsoft Surface Laptop 3 13 Core i5-1035G7 | |
| Dynabook Portege A30-E-174 | |
| Lenovo Yoga 530-14ARR-81H9000VGE | |
| wPrime 2.10 - 1024m | |
| Genomsnitt Intel Core i7-1065G7 (233 - 354, n=3) | |
| Microsoft Surface Laptop 3 13 Core i5-1035G7 | |
* ... mindre är bättre
| PCMark 8 | |
| Home Score Accelerated v2 | |
| Dell XPS 15 7590 i5 iGPU FHD | |
| Asus VivoBook 15 X512FL-EJ205T | |
| Lenovo Ideapad S340-15IIL | |
| Genomsnitt Intel Core i7-1065G7, Intel Iris Plus Graphics G7 (Ice Lake 64 EU) (3305 - 4275, n=17) | |
| Dell Inspiron 15 5000 5585 | |
| HP Pavilion 15-cw1212ng | |
| Work Score Accelerated v2 | |
| Lenovo Ideapad S340-15IIL | |
| Dell XPS 15 7590 i5 iGPU FHD | |
| Asus VivoBook 15 X512FL-EJ205T | |
| HP Pavilion 15-cw1212ng | |
| Dell Inspiron 15 5000 5585 | |
| Genomsnitt Intel Core i7-1065G7, Intel Iris Plus Graphics G7 (Ice Lake 64 EU) (2460 - 5291, n=17) | |
| PCMark 8 Home Score Accelerated v2 | 3791 poäng | |
| PCMark 8 Work Score Accelerated v2 | 5291 poäng | |
| PCMark 10 Score | 4679 poäng | |
Hjälp | ||
| Lenovo Ideapad S340-15IIL Intel SSD 660p SSDPEKNW512G8 | Dell XPS 15 7590 i5 iGPU FHD Toshiba XG6 KXG60ZNV512G | Dell Inspiron 15 5000 5585 WDC PC SN520 SDAPNUW-512G | Asus VivoBook 15 X512FL-EJ205T Kingston RBUSNS8154P3512GJ | Lenovo Ideapad S540-15IML Samsung SSD PM981a MZVLB512HBJQ | |
|---|---|---|---|---|---|
| AS SSD | 71% | 9% | -31% | 128% | |
| Seq Read (MB/s) | 1447 | 2357 63% | 398.9 -72% | 1348 -7% | 2642 83% |
| Seq Write (MB/s) | 926 | 1235 33% | 884 -5% | 685 -26% | 2433 163% |
| 4K Read (MB/s) | 40.06 | 43.29 8% | 34.54 -14% | 29.15 -27% | 58 45% |
| 4K Write (MB/s) | 97.9 | 99.7 2% | 82.1 -16% | 90.3 -8% | 145.3 48% |
| 4K-64 Read (MB/s) | 323.7 | 1020 215% | 647 100% | 650 101% | 1431 342% |
| 4K-64 Write (MB/s) | 791 | 1502 90% | 985 25% | 514 -35% | 1753 122% |
| Access Time Read * (ms) | 0.06 | 0.07 -17% | 0.072 -20% | 0.31 -417% | 0.072 -20% |
| Access Time Write * (ms) | 0.144 | 0.039 73% | 0.047 67% | 0.044 69% | 0.027 81% |
| Score Read (Points) | 508 | 1299 156% | 721 42% | 814 60% | 1753 245% |
| Score Write (Points) | 982 | 1726 76% | 1155 18% | 673 -31% | 2142 118% |
| Score Total (Points) | 1738 | 3640 109% | 2279 31% | 1876 8% | 4790 176% |
| Copy ISO MB/s (MB/s) | 943 | 2145 127% | 862 -9% | 763 -19% | |
| Copy Program MB/s (MB/s) | 612 | 565 -8% | 457 -25% | 350.3 -43% | |
| Copy Game MB/s (MB/s) | 826 | 1320 60% | 902 9% | 310 -62% | |
| CrystalDiskMark 5.2 / 6 | 35% | -24% | -34% | 44% | |
| Write 4K (MB/s) | 130.8 | 93.6 -28% | 105.9 -19% | 63.6 -51% | 170.7 31% |
| Read 4K (MB/s) | 54.8 | 41.87 -24% | 36.56 -33% | 28.58 -48% | 49.51 -10% |
| Write Seq (MB/s) | 978 | 1698 74% | 1165 19% | 688 -30% | 1156 18% |
| Read Seq (MB/s) | 1627 | 1978 22% | 423.2 -74% | 1032 -37% | 1136 -30% |
| Write 4K Q32T1 (MB/s) | 450.1 | 383.1 -15% | 332.1 -26% | 266.7 -41% | 420.5 -7% |
| Read 4K Q32T1 (MB/s) | 345.9 | 326.9 -5% | 229.3 -34% | 321.5 -7% | 527 52% |
| Write Seq Q32T1 (MB/s) | 982 | 2778 183% | 1460 49% | 606 -38% | 2984 204% |
| Read Seq Q32T1 (MB/s) | 1842 | 3119 69% | 472.5 -74% | 1508 -18% | 3550 93% |
| Write 4K Q8T8 (MB/s) | 410.8 | ||||
| Read 4K Q8T8 (MB/s) | 331.4 | ||||
| Totalt genomsnitt (program/inställningar) | 53% /
57% | -8% /
-3% | -33% /
-32% | 86% /
92% |
* ... mindre är bättre

| 3DMark 11 Performance | 3762 poäng | |
| 3DMark Ice Storm Standard Score | 65852 poäng | |
| 3DMark Cloud Gate Standard Score | 9962 poäng | |
| 3DMark Fire Strike Score | 2171 poäng | |
| 3DMark Time Spy Score | 701 poäng | |
Hjälp | ||
| The Witcher 3 - 1024x768 Low Graphics & Postprocessing | |
| Huawei MateBook 13 i7 | |
| MSI Modern 15 A10RB | |
| Dell Inspiron 15 5000 5585 | |
| Microsoft Surface Laptop 3 13 Core i5-1035G7 | |
| Genomsnitt Intel Iris Plus Graphics G7 (Ice Lake 64 EU) (28.2 - 58, n=20) | |
| Lenovo Ideapad S340-15IIL | |
| låg | med. | hög | ultra | |
|---|---|---|---|---|
| BioShock Infinite (2013) | 81.9 | 48.9 | 39.9 | 13.5 |
| The Witcher 3 (2015) | 29.9 | 20.8 | 10.9 | 5.9 |
| Rocket League (2017) | 45.5 | 30 | 21.1 | |
| Shadow of the Tomb Raider (2018) | 19 |
| Lenovo Ideapad S340-15IIL Iris Plus Graphics G7 (Ice Lake 64 EU), i7-1065G7, Intel SSD 660p SSDPEKNW512G8 | Dell XPS 15 7590 i5 iGPU FHD UHD Graphics 630, i5-9300H, Toshiba XG6 KXG60ZNV512G | Dell Inspiron 15 5000 5585 Vega 10, R7 3700U, WDC PC SN520 SDAPNUW-512G | Lenovo Ideapad S540-15IML GeForce MX250, i5-10210U, Samsung SSD PM981a MZVLB512HBJQ | HP Pavilion 15-cs2019ng GeForce MX250, i5-8265U, Toshiba KBG30ZMV256G | Asus VivoBook 15 X542UF-DM143T GeForce MX130, i5-8250U, Micron 1100 MTFDDAV256TBN | |
|---|---|---|---|---|---|---|
| Noise | -4% | -3% | -18% | -17% | -11% | |
| av / miljö * (dB) | 28.5 | 29.3 -3% | 28.3 1% | 30 -5% | 30.5 -7% | 30 -5% |
| Idle Minimum * (dB) | 28.5 | 29.3 -3% | 28.3 1% | 30 -5% | 31.5 -11% | 30.9 -8% |
| Idle Average * (dB) | 28.5 | 29.3 -3% | 28.3 1% | 32 -12% | 31.5 -11% | 30.9 -8% |
| Idle Maximum * (dB) | 28.5 | 29.8 -5% | 28.3 1% | 37 -30% | 31.5 -11% | 30.9 -8% |
| Load Average * (dB) | 30.3 | 32.4 -7% | 31.4 -4% | 41 -35% | 42.5 -40% | 39 -29% |
| Load Maximum * (dB) | 35.5 | 37.2 -5% | 41.4 -17% | 42 -18% | 42.5 -20% | 38 -7% |
| Witcher 3 ultra * (dB) | 41.4 | 39 |
* ... mindre är bättre
Ljudnivå
| Låg belastning |
| 28.5 / 28.5 / 28.5 dB(A) |
| Hög belastning |
| 30.3 / 35.5 dB(A) |
 | ||
30 dB tyst 40 dB(A) hörbar 50 dB(A) högt ljud |
||
min: | ||
(+) Den maximala temperaturen på ovansidan är 35 °C / 95 F, jämfört med genomsnittet av 36.8 °C / 98 F , allt från 21 till 71 °C för klassen Multimedia.
(±) Botten värms upp till maximalt 44 °C / 111 F, jämfört med genomsnittet av 39.1 °C / 102 F
(+) Vid tomgångsbruk är medeltemperaturen för ovansidan 24.3 °C / 76 F, jämfört med enhetsgenomsnittet på 31.3 °C / ### class_avg_f### F.
(+) Handledsstöden och pekplattan är kallare än hudtemperaturen med maximalt 25 °C / 77 F och är därför svala att ta på.
(+) Medeltemperaturen för handledsstödsområdet på liknande enheter var 28.7 °C / 83.7 F (+3.7 °C / 6.7 F).
Lenovo Ideapad S340-15IIL ljudanalys
(+) | högtalare kan spela relativt högt (83.4 dB)
Bas 100 - 315 Hz
(-) | nästan ingen bas - i genomsnitt 21.2% lägre än medianen
(±) | linjäriteten för basen är genomsnittlig (11.4% delta till föregående frekvens)
Mellan 400 - 2000 Hz
(+) | balanserad mellan - endast 4.8% från medianen
(±) | linjäriteten för mids är genomsnittlig (7% delta till föregående frekvens)
Högsta 2 - 16 kHz
(+) | balanserade toppar - endast 2.5% från medianen
(+) | toppar är linjära (4% delta till föregående frekvens)
Totalt 100 - 16 000 Hz
(±) | linjäriteten för det totala ljudet är genomsnittlig (22% skillnad mot median)
Jämfört med samma klass
» 78% av alla testade enheter i den här klassen var bättre, 4% liknande, 17% sämre
» Den bästa hade ett delta på 5%, genomsnittet var 17%, sämst var 45%
Jämfört med alla testade enheter
» 64% av alla testade enheter var bättre, 6% liknande, 30% sämre
» Den bästa hade ett delta på 4%, genomsnittet var 23%, sämst var 134%
Apple MacBook 12 (Early 2016) 1.1 GHz ljudanalys
(+) | högtalare kan spela relativt högt (83.6 dB)
Bas 100 - 315 Hz
(±) | reducerad bas - i genomsnitt 11.3% lägre än medianen
(±) | linjäriteten för basen är genomsnittlig (14.2% delta till föregående frekvens)
Mellan 400 - 2000 Hz
(+) | balanserad mellan - endast 2.4% från medianen
(+) | mids är linjära (5.5% delta till föregående frekvens)
Högsta 2 - 16 kHz
(+) | balanserade toppar - endast 2% från medianen
(+) | toppar är linjära (4.5% delta till föregående frekvens)
Totalt 100 - 16 000 Hz
(+) | det totala ljudet är linjärt (10.2% skillnad mot median)
Jämfört med samma klass
» 7% av alla testade enheter i den här klassen var bättre, 2% liknande, 90% sämre
» Den bästa hade ett delta på 5%, genomsnittet var 18%, sämst var 53%
Jämfört med alla testade enheter
» 5% av alla testade enheter var bättre, 1% liknande, 94% sämre
» Den bästa hade ett delta på 4%, genomsnittet var 23%, sämst var 134%
| Av/Standby | |
| Låg belastning | |
| Hög belastning |
|
Förklaring:
min: | |
| Lenovo Ideapad S340-15IIL i7-1065G7, Iris Plus Graphics G7 (Ice Lake 64 EU), Intel SSD 660p SSDPEKNW512G8, IPS, 1920x1080, 15.6" | Dell XPS 15 7590 i5 iGPU FHD i5-9300H, UHD Graphics 630, Toshiba XG6 KXG60ZNV512G, IPS, 1920x1080, 15.6" | Dell Inspiron 15 5000 5585 R7 3700U, Vega 10, WDC PC SN520 SDAPNUW-512G, IPS, 1920x1080, 15.6" | Lenovo Ideapad S540-15IML i5-10210U, GeForce MX250, Samsung SSD PM981a MZVLB512HBJQ, IPS, 1920x1080, 15.6" | HP Pavilion 15-cs2019ng i5-8265U, GeForce MX250, Toshiba KBG30ZMV256G, IPS, 1920x1080, 15.6" | Asus VivoBook 15 X542UF-DM143T i5-8250U, GeForce MX130, Micron 1100 MTFDDAV256TBN, TN LED, 1920x1080, 15.6" | |
|---|---|---|---|---|---|---|
| Power Consumption | -38% | 5% | -27% | -19% | -15% | |
| Idle Minimum * (Watt) | 3.8 | 3.79 -0% | 4.2 -11% | 5 -32% | 4.9 -29% | 4.75 -25% |
| Idle Average * (Watt) | 6.9 | 6.9 -0% | 6.8 1% | 7 -1% | 7.9 -14% | 6.9 -0% |
| Idle Maximum * (Watt) | 7.7 | 9.2 -19% | 7 9% | 10 -30% | 10.1 -31% | 7 9% |
| Load Average * (Watt) | 43.3 | 62 -43% | 36.5 16% | 64 -48% | 60 -39% | 53 -22% |
| Witcher 3 ultra * (Watt) | 40.4 | 37.9 6% | 44 -9% | |||
| Load Maximum * (Watt) | 47.5 | 108 -127% | 44 7% | 67 -41% | 38 20% | 65.3 -37% |
* ... mindre är bättre
| Lenovo Ideapad S340-15IIL i7-1065G7, Iris Plus Graphics G7 (Ice Lake 64 EU), 36 Wh | Dell XPS 15 7590 i5 iGPU FHD i5-9300H, UHD Graphics 630, 97 Wh | Dell Inspiron 15 5000 5585 R7 3700U, Vega 10, 42 Wh | Lenovo Ideapad S540-15IML i5-10210U, GeForce MX250, 70 Wh | HP Pavilion 15-cs2019ng i5-8265U, GeForce MX250, 41 Wh | Asus VivoBook 15 X542UF-DM143T i5-8250U, GeForce MX130, 38 Wh | |
|---|---|---|---|---|---|---|
| Batteridrifttid | 142% | 44% | 137% | 5% | 58% | |
| Reader / Idle (h) | 10 | 14.3 43% | 30.2 202% | 8 -20% | ||
| WiFi v1.3 (h) | 4.3 | 14.1 228% | 7 63% | 12.1 181% | 5 16% | 6.8 58% |
| Load (h) | 1.1 | 1.7 55% | 1.4 27% | 1.4 27% | 1.3 18% |
För
Emot
Läs den fullständiga versionen av den här recensionen på engelska här.
För några veckor sedan skrev vi att Lenovo IdeaPad S340-15 var en av de billigaste bärbara datorerna som gick att hitta med Intels senaste 10:e generations Core i7-1065G7 CPU. Det är samma processor som sitter i betydligt dyrare alternativ som Dell XPS 13 2-in-1 eller Razer Blade Stealth, som lätt kan kosta två gånger så mycket som vår Lenovo. Även om detta får Lenovos modell att se bra ut på papperet så visar IdeaPad S340-15 i realiteten upp CPU-prestanda som ligger under genomsnittet för tidigare nämnda alternativ, särskilt när man spelar spel eller utför annat krävande arbete. Om du vill ha Ice Lake i sin bästa form får du titta bortom IdeaPad-serien.
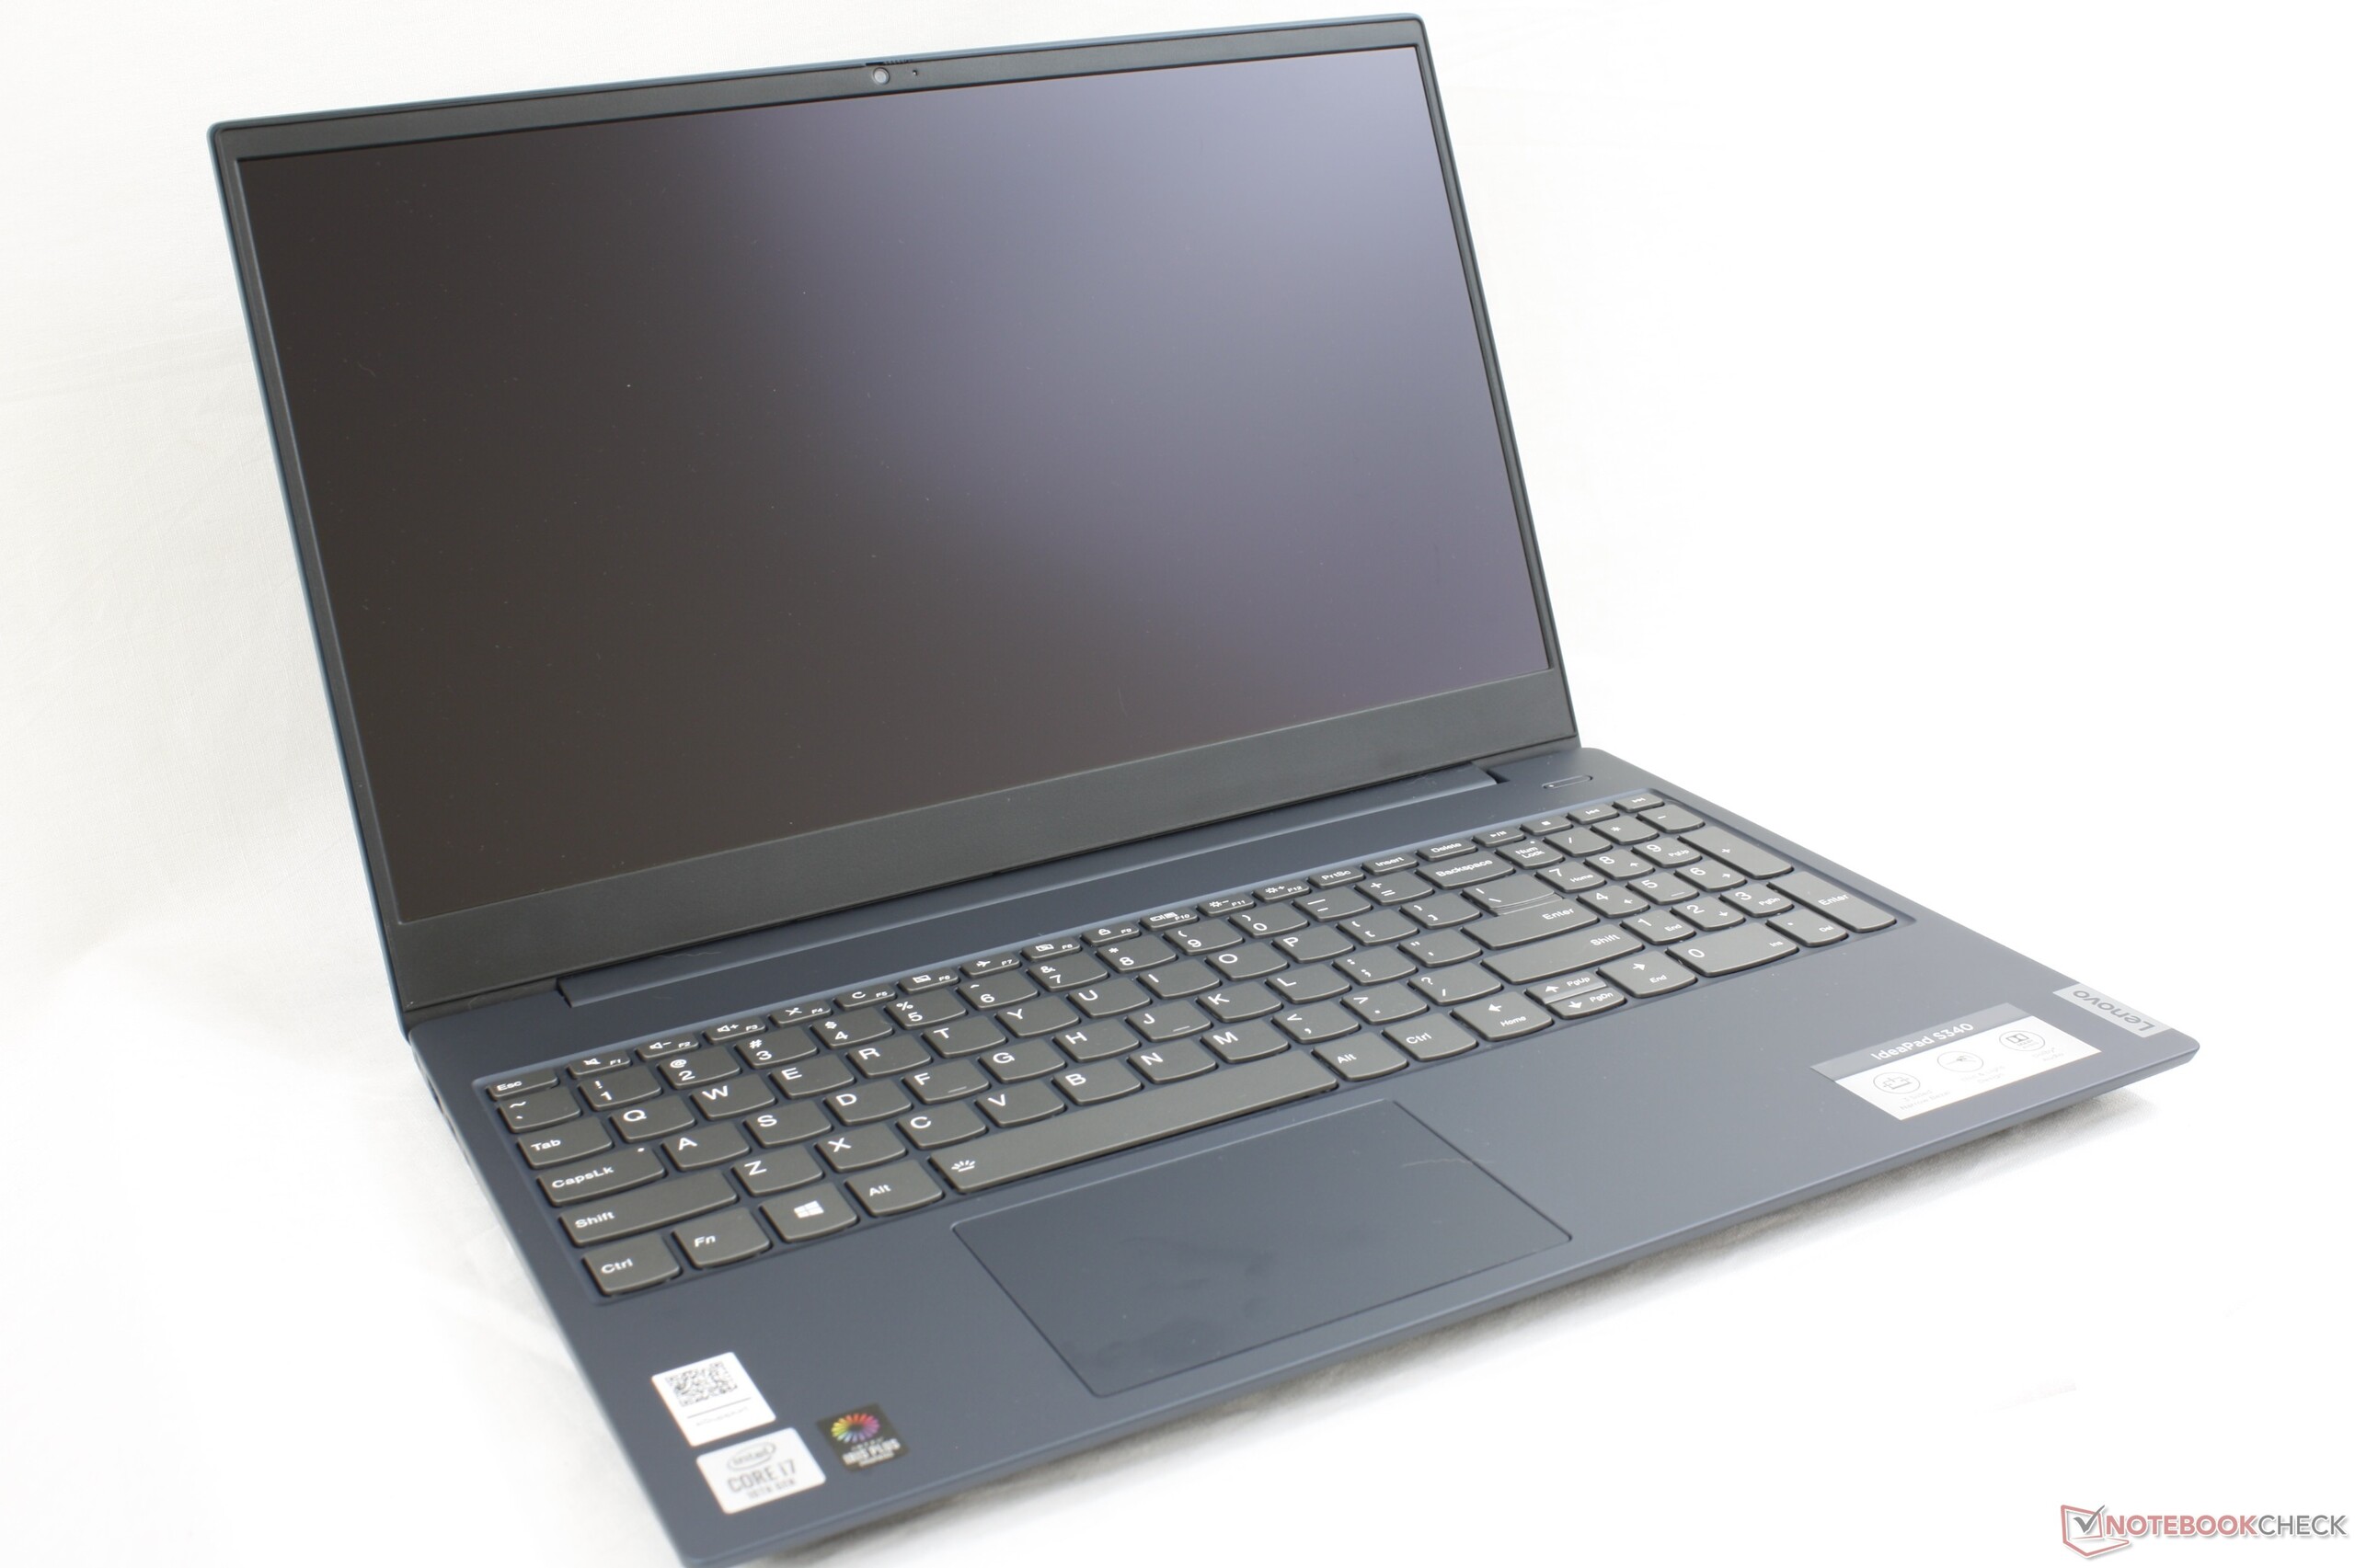
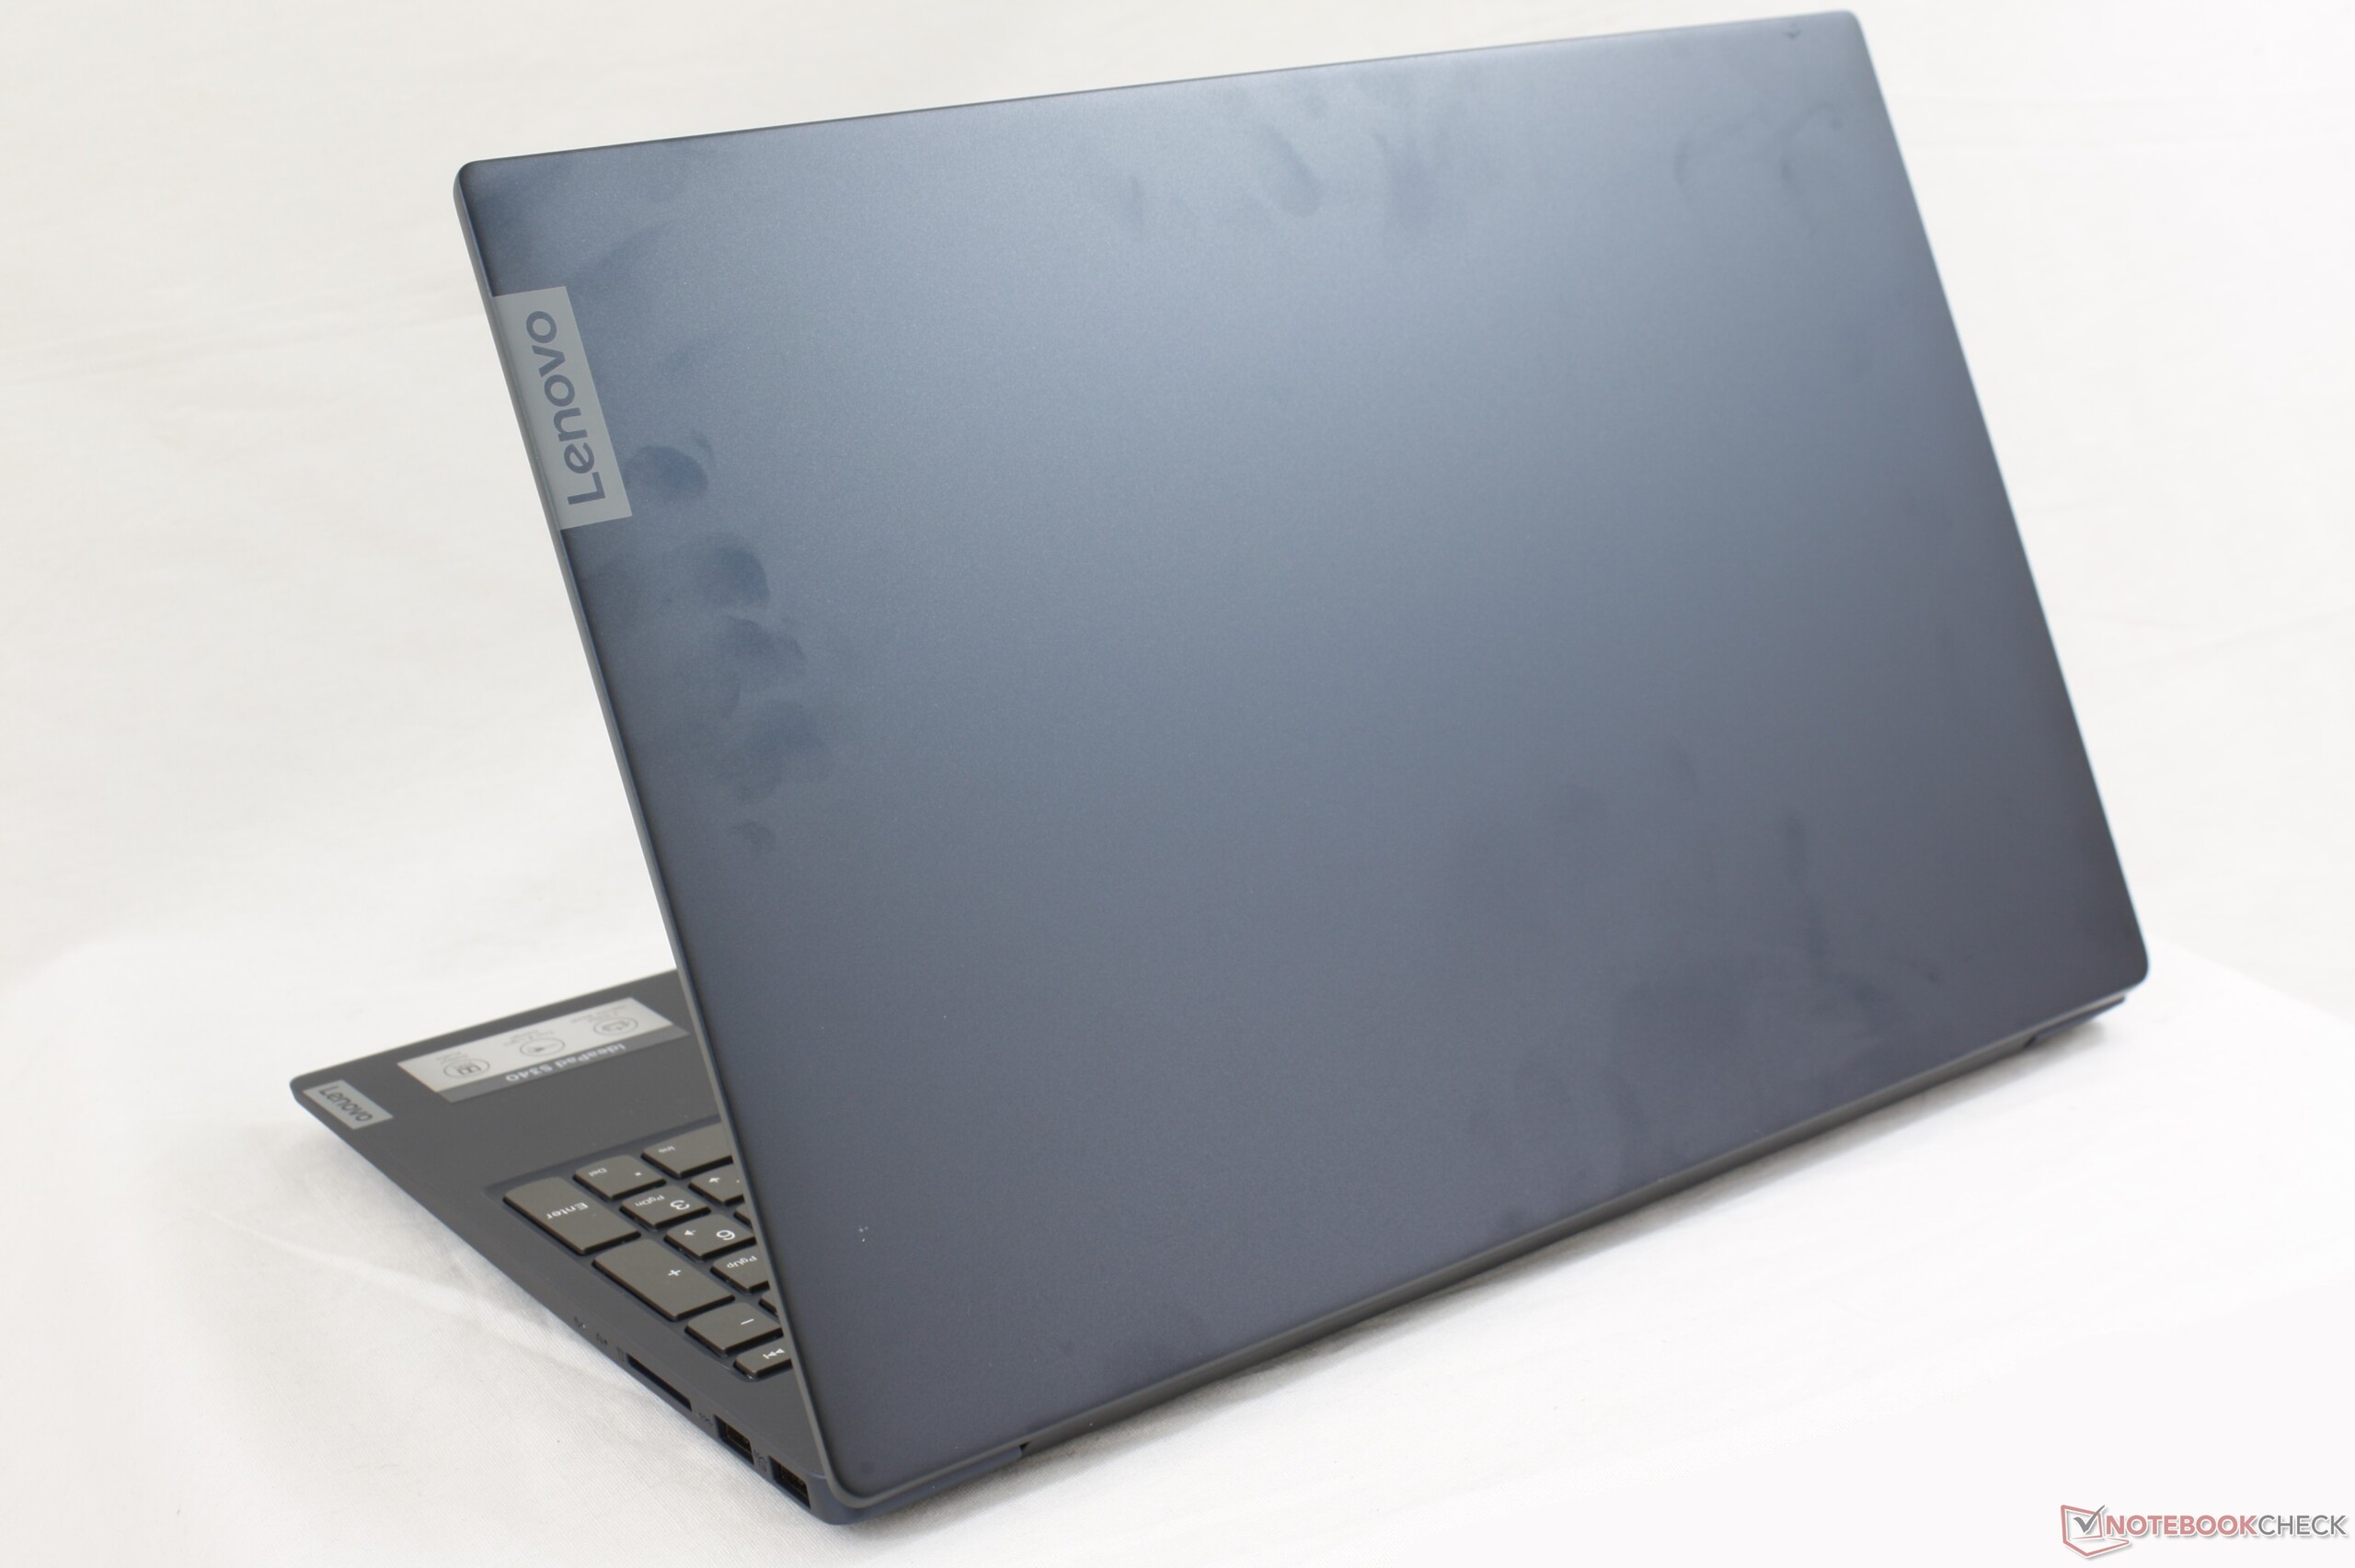
När det kommer till själva datorn är den modernare och mer visuellt tilltalande än konkurrenterna Dell Inspiron, Asus VivoBook och HP:s Pavilion-serie. Den matta tryckkänsliga skärmen och de två lättåtkomliga lagringsplatserna är dessutom trevliga överraskningar som är ovanliga att se på billiga laptops. I övrigt är nästan allt annat tillräckligt om inte medelmåttig. Det smala färgomfånget, de lätta knapparna och den mediokra batteritiden är typiskt för det här prisskiktet. Vi rekommenderar att välja de billigare varianterna med Core i5 eller Core i7 Whiskey Lake-U eftersom Ice Lake inte bidrar särskilt mycket till IdeaPad S340.
Lenovo IdeaPad S340-15 passar bäst som en multimediaenhet för hemmabruk eller för en resa då och då tack vare den låga vikten. Men förvänta dig inte bra Core i7 Ice Lake-prestanda till krävande uppgifter såsom spel.
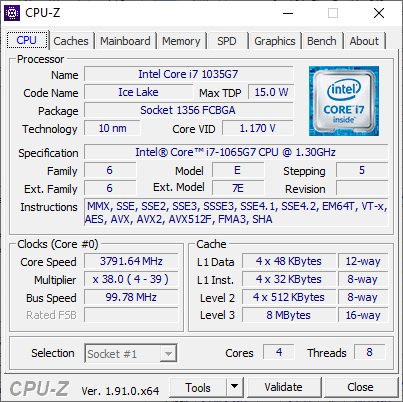
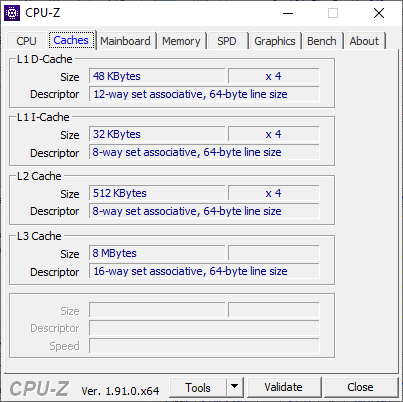
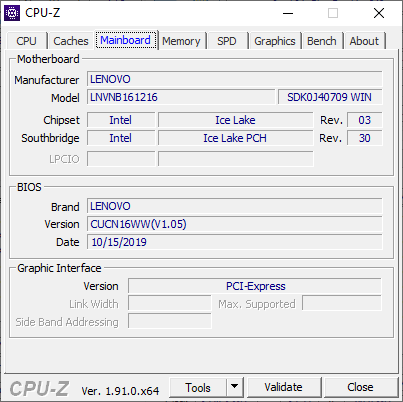
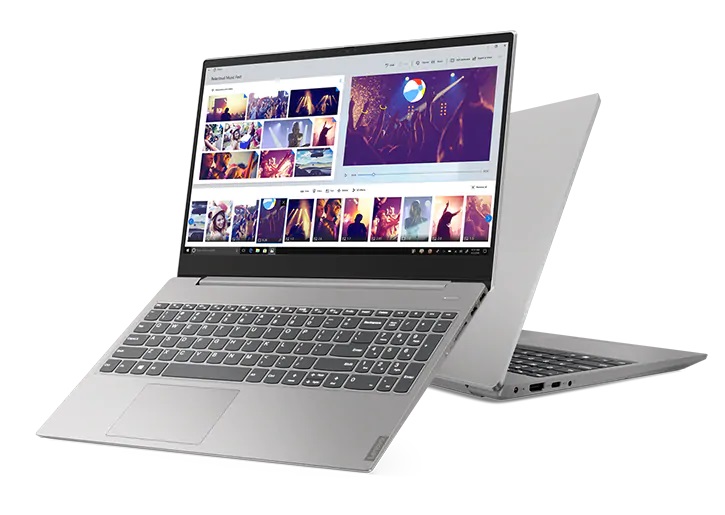
Lenovo Ideapad S340-15IIL
- 03/14/2020 v7 (old)
Allen Ngo
Price comparison
