Test: Asus ZenBook S13 UX392FN (i7-8565U, GeForce MX150) Laptop (Sammanfattning)
| SD Card Reader | |
| average JPG Copy Test (av. of 3 runs) | |
| Dell XPS 13 9380 2019 (Toshiba Exceria Pro SDXC 64 GB UHS-II) | |
| Asus ROG G703GX (Toshiba Exceria Pro SDXC 64 GB UHS-II) | |
| Asus ZenBook S13 UX392FN (Toshiba Exceria Pro M501 64 GB UHS-II) | |
| Chuwi HeroBook 14 (Toshiba Exceria Pro M501 64 GB UHS-II) | |
| maximum AS SSD Seq Read Test (1GB) | |
| Asus ROG G703GX (Toshiba Exceria Pro SDXC 64 GB UHS-II) | |
| Dell XPS 13 9380 2019 (Toshiba Exceria Pro SDXC 64 GB UHS-II) | |
| Asus ZenBook S13 UX392FN (Toshiba Exceria Pro M501 64 GB UHS-II) | |
| Chuwi HeroBook 14 (Toshiba Exceria Pro M501 64 GB UHS-II) | |
| Networking | |
| iperf3 transmit AX12 | |
| Dell XPS 13 9380 2019 | |
| Asus ZenBook S13 UX392FN | |
| Huawei Matebook X Pro i5 | |
| Asus ZenBook S UX391U | |
| iperf3 receive AX12 | |
| Asus ZenBook S13 UX392FN | |
| Huawei Matebook X Pro i5 | |
| Asus ZenBook S UX391U | |
| Dell XPS 13 9380 2019 | |
| |||||||||||||||||||||||||
Distribution av ljusstyrkan: 90 %
Mitt på batteriet: 466 cd/m²
Kontrast: 1412:1 (Svärta: 0.33 cd/m²)
ΔE ColorChecker Calman: 1.93 | ∀{0.5-29.43 Ø4.73}
calibrated: 1.99
ΔE Greyscale Calman: 1.7 | ∀{0.09-98 Ø4.97}
95.7% sRGB (Argyll 1.6.3 3D)
62.2% AdobeRGB 1998 (Argyll 1.6.3 3D)
69% AdobeRGB 1998 (Argyll 3D)
95.8% sRGB (Argyll 3D)
67.5% Display P3 (Argyll 3D)
Gamma: 2.15
CCT: 6382 K
| Asus ZenBook S13 UX392FN Tianma XM, IPS, 13.9", 1920x1080 | Dell XPS 13 9380 2019 ID: AUO 282B B133ZAN Dell: 90NTH, IPS, 13.3", 3840x2160 | Asus ZenBook S UX391U AUO B133HAN04.9, IPS, 13.3", 1920x1080 | Huawei Matebook X Pro i5 Tianma XM, IPS, 13.9", 3000x2000 | Lenovo Yoga C930-13IKB B139HAN03_0, IPS, 13.9", 1920x1080 | HP Spectre x360 13t-ae000 LGD0588, IPS, 13.3", 3840x2160 | Razer Blade Stealth i7-8565U Sharp LQ133M1JW41, IPS, 13.3", 1920x1080 | |
|---|---|---|---|---|---|---|---|
| Display | -4% | -6% | -2% | -3% | 5% | -2% | |
| Display P3 Coverage (%) | 67.5 | 64.7 -4% | 64.4 -5% | 65.9 -2% | 64.3 -5% | 71.9 7% | 65.5 -3% |
| sRGB Coverage (%) | 95.8 | 93.1 -3% | 90.5 -6% | 95.2 -1% | 94.6 -1% | 98.1 2% | 96.3 1% |
| AdobeRGB 1998 Coverage (%) | 69 | 65.3 -5% | 65.2 -6% | 67.6 -2% | 66.2 -4% | 73.1 6% | 66.3 -4% |
| Response Times | -34% | -7% | 6% | 2% | -20% | -30% | |
| Response Time Grey 50% / Grey 80% * (ms) | 47.2 ? | 58 ? -23% | 44.8 ? 5% | 40.4 ? 14% | 40.8 ? 14% | 51.6 ? -9% | 57.6 ? -22% |
| Response Time Black / White * (ms) | 24.8 ? | 36 ? -45% | 29.2 ? -18% | 25.6 ? -3% | 27.6 ? -11% | 32.4 ? -31% | 34 ? -37% |
| PWM Frequency (Hz) | 22730 ? | ||||||
| Screen | -37% | -58% | -48% | -82% | -14% | 8% | |
| Brightness middle (cd/m²) | 466 | 404 -13% | 299 -36% | 442.7 -5% | 316 -32% | 329.8 -29% | 429.8 -8% |
| Brightness (cd/m²) | 462 | 389 -16% | 300 -35% | 428 -7% | 291 -37% | 318 -31% | 403 -13% |
| Brightness Distribution (%) | 90 | 85 -6% | 92 2% | 84 -7% | 83 -8% | 74 -18% | 89 -1% |
| Black Level * (cd/m²) | 0.33 | 0.37 -12% | 0.26 21% | 0.31 6% | 0.36 -9% | 0.25 24% | 0.32 3% |
| Contrast (:1) | 1412 | 1092 -23% | 1150 -19% | 1428 1% | 878 -38% | 1319 -7% | 1343 -5% |
| Colorchecker dE 2000 * | 1.93 | 3.72 -93% | 5.6 -190% | 2.24 -16% | 5.9 -206% | 2.37 -23% | 1.08 44% |
| Colorchecker dE 2000 max. * | 4.26 | 7.38 -73% | 9.1 -114% | 7.19 -69% | 12.9 -203% | 4.08 4% | 3.96 7% |
| Colorchecker dE 2000 calibrated * | 1.99 | 2.06 -4% | 2.6 -31% | 1.11 44% | 1.3 35% | 1.21 39% | |
| Greyscale dE 2000 * | 1.7 | 4.44 -161% | 5.5 -224% | 9.7 -471% | 8.6 -406% | 2.8 -65% | 1.3 24% |
| Gamma | 2.15 102% | 2.34 94% | 2.47 89% | 1.42 155% | 2.1 105% | 2.145 103% | 2.23 99% |
| CCT | 6382 102% | 7095 92% | 7533 86% | 6227 104% | 6854 95% | 6441 101% | 6452 101% |
| Color Space (Percent of AdobeRGB 1998) (%) | 62.2 | 60 -4% | 58.9 -5% | 61.6 -1% | 60.7 -2% | 67 8% | 61.4 -1% |
| Color Space (Percent of sRGB) (%) | 95.7 | 93 -3% | 90.3 -6% | 95 -1% | 94.5 -1% | 98 2% | 96.3 1% |
| Totalt genomsnitt (program/inställningar) | -25% /
-31% | -24% /
-42% | -15% /
-33% | -28% /
-57% | -10% /
-11% | -8% /
2% |
* ... mindre är bättre
Visa svarstider
| ↔ Svarstid svart till vitt | ||
|---|---|---|
| 24.8 ms ... stiga ↗ och falla ↘ kombinerat | ↗ 14 ms stiga | 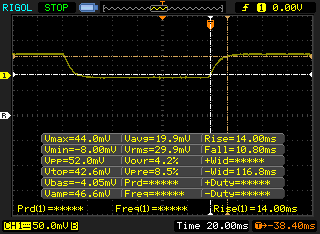 |
| ↘ 10.8 ms hösten | ||
| Skärmen visar bra svarsfrekvens i våra tester, men kan vara för långsam för konkurrenskraftiga spelare. I jämförelse sträcker sig alla testade enheter från 0.1 (minst) till 240 (maximalt) ms. » 58 % av alla enheter är bättre. Detta innebär att den uppmätta svarstiden är sämre än genomsnittet av alla testade enheter (19.9 ms). | ||
| ↔ Svarstid 50 % grått till 80 % grått | ||
| 47.2 ms ... stiga ↗ och falla ↘ kombinerat | ↗ 23.6 ms stiga | 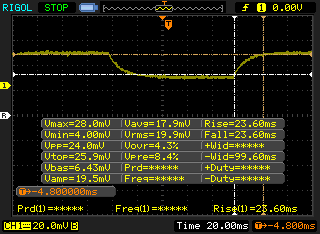 |
| ↘ 23.6 ms hösten | ||
| Skärmen visar långsamma svarsfrekvenser i våra tester och kommer att vara otillfredsställande för spelare. I jämförelse sträcker sig alla testade enheter från 0.165 (minst) till 636 (maximalt) ms. » 81 % av alla enheter är bättre. Detta innebär att den uppmätta svarstiden är sämre än genomsnittet av alla testade enheter (31.1 ms). | ||
Skärmflimmer / PWM (Puls-Width Modulation)
| Skärmflimmer / PWM upptäcktes inte | 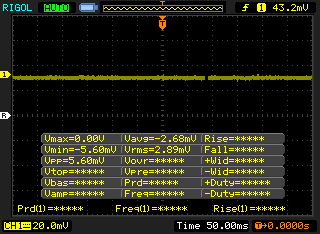 | ||
Som jämförelse: 52 % av alla testade enheter använder inte PWM för att dämpa skärmen. Om PWM upptäcktes mättes ett medelvärde av 7784 (minst: 5 - maximum: 343500) Hz. | |||
| Cinebench R15 | |
| CPU Single 64Bit | |
| Asus ZenBook S13 UX392FN | |
| Razer Blade Stealth i7-8565U | |
| Genomsnitt Intel Core i7-8565U (138.3 - 193, n=51) | |
| Asus Zephyrus S GX531GX | |
| Dell XPS 13 9370 i7 UHD | |
| VAIO SX14 | |
| Acer Nitro 5 AN515-42-R6V0 | |
| Lenovo ThinkPad 13 20J1005TPB | |
| Huawei Matebook X Pro i5 | |
| Xiaomi Mi Gaming Laptop 7300HQ 1050Ti | |
| HP x2 210 G2 | |
| CPU Multi 64Bit | |
| Asus Zephyrus S GX531GX | |
| Asus ZenBook S13 UX392FN | |
| Razer Blade Stealth i7-8565U | |
| Acer Nitro 5 AN515-42-R6V0 | |
| VAIO SX14 | |
| Dell XPS 13 9370 i7 UHD | |
| Genomsnitt Intel Core i7-8565U (452 - 815, n=52) | |
| Huawei Matebook X Pro i5 | |
| Xiaomi Mi Gaming Laptop 7300HQ 1050Ti | |
| Lenovo ThinkPad 13 20J1005TPB | |
| HP x2 210 G2 | |
| Cinebench R10 | |
| Rendering Multiple CPUs 32Bit | |
| Dell XPS 13 9370 i7 UHD | |
| Genomsnitt Intel Core i7-8565U (13806 - 23118, n=16) | |
| Huawei Matebook X Pro i5 | |
| HP x2 210 G2 | |
| Rendering Single 32Bit | |
| Genomsnitt Intel Core i7-8565U (2682 - 8906, n=16) | |
| Dell XPS 13 9370 i7 UHD | |
| Huawei Matebook X Pro i5 | |
| HP x2 210 G2 | |
| wPrime 2.10 - 1024m | |
| Lenovo ThinkPad 13 20J1005TPB | |
| Dell XPS 13 9370 i7 UHD | |
| Genomsnitt Intel Core i7-8565U (263 - 420, n=7) | |
| Huawei Matebook X Pro i5 | |
* ... mindre är bättre
| PCMark 8 Home Score Accelerated v2 | 3712 poäng | |
| PCMark 8 Work Score Accelerated v2 | 5159 poäng | |
| PCMark 10 Score | 3970 poäng | |
Hjälp | ||
| Asus ZenBook S13 UX392FN WDC PC SN520 SDAPNUW-512G | Dell XPS 13 9380 2019 SK hynix PC401 HFS256GD9TNG | Asus ZenBook S UX391U Samsung PM961 NVMe MZVLW512HMJP | Huawei Matebook X Pro i5 Samsung PM961 MZVLW256HEHP | Lenovo Yoga C930-13IKB SK hynix PC401 HFS256GD9TNG | |
|---|---|---|---|---|---|
| AS SSD | -34% | -3% | -12% | -45% | |
| Seq Read (MB/s) | 1224 | 2035 66% | 1907 56% | 2416 97% | 1850 51% |
| Seq Write (MB/s) | 907 | 658 -27% | 1031 14% | 1170 29% | 661 -27% |
| 4K Read (MB/s) | 41.46 | 39.74 -4% | 43.64 5% | 48.33 17% | 38.04 -8% |
| 4K Write (MB/s) | 126.2 | 105.7 -16% | 112.5 -11% | 103.1 -18% | 95 -25% |
| 4K-64 Read (MB/s) | 1021 | 461 -55% | 703 -31% | 1039 2% | 434.3 -57% |
| 4K-64 Write (MB/s) | 1251 | 300.1 -76% | 1037 -17% | 399.6 -68% | 266.3 -79% |
| Access Time Read * (ms) | 0.053 | 0.061 -15% | 0.036 32% | 0.058 -9% | 0.069 -30% |
| Access Time Write * (ms) | 0.027 | 0.051 -89% | 0.033 -22% | 0.036 -33% | 0.056 -107% |
| Score Read (Points) | 1185 | 704 -41% | 938 -21% | 1329 12% | 657 -45% |
| Score Write (Points) | 1468 | 471 -68% | 1252 -15% | 620 -58% | 427 -71% |
| Score Total (Points) | 3250 | 1479 -54% | 2637 -19% | 2575 -21% | 1373 -58% |
| Copy ISO MB/s (MB/s) | 1404 | 893 -36% | 739 -47% | 539 -62% | |
| Copy Program MB/s (MB/s) | 402.4 | 287.9 -28% | 312.3 -22% | 209.7 -48% | |
| Copy Game MB/s (MB/s) | 902 | 618 -31% | 486.3 -46% | 340 -62% |
* ... mindre är bättre

| 3DMark | |
| 1280x720 Cloud Gate Standard Graphics | |
| Asus FX504GD | |
| Asus Zenbook UX510UW-CN044T | |
| Razer Blade Stealth i7-8565U | |
| Acer Aspire 5 A515-52G-723L | |
| Genomsnitt NVIDIA GeForce MX150 (16227 - 22183, n=43) | |
| Asus ZenBook UX530UX-FY070T | |
| Asus ZenBook S13 UX392FN | |
| Acer Swift 3 SF315-41-R6J9 | |
| Asus VivoBook S410UQ-NH74 | |
| Dell XPS 13 9380 2019 | |
| Lenovo ThinkPad 13 20J1005TPB | |
| 1920x1080 Fire Strike Graphics | |
| Asus FX504GD | |
| Asus Zenbook UX510UW-CN044T | |
| Razer Blade Stealth i7-8565U | |
| Acer Aspire 5 A515-52G-723L | |
| Genomsnitt NVIDIA GeForce MX150 (2323 - 3739, n=44) | |
| Asus ZenBook UX530UX-FY070T | |
| Asus ZenBook S13 UX392FN | |
| Acer Swift 3 SF315-41-R6J9 | |
| Asus VivoBook S410UQ-NH74 | |
| Lenovo ThinkPad 13 20J1005TPB | |
| 3DMark 11 | |
| 1280x720 Performance GPU | |
| Asus FX504GD | |
| Razer Blade Stealth i7-8565U | |
| Asus Zenbook UX510UW-CN044T | |
| Acer Aspire 5 A515-52G-723L | |
| Genomsnitt NVIDIA GeForce MX150 (2796 - 4905, n=47) | |
| Asus ZenBook UX530UX-FY070T | |
| Acer Swift 3 SF315-41-R6J9 | |
| Asus ZenBook S13 UX392FN | |
| Asus VivoBook S410UQ-NH74 | |
| Dell XPS 13 9380 2019 | |
| Lenovo ThinkPad 13 20J1005TPB | |
| 1280x720 Performance Combined | |
| Asus FX504GD | |
| Asus Zenbook UX510UW-CN044T | |
| Razer Blade Stealth i7-8565U | |
| Acer Aspire 5 A515-52G-723L | |
| Genomsnitt NVIDIA GeForce MX150 (2820 - 4421, n=46) | |
| Asus ZenBook UX530UX-FY070T | |
| Asus ZenBook S13 UX392FN | |
| Acer Swift 3 SF315-41-R6J9 | |
| Asus VivoBook S410UQ-NH74 | |
| Dell XPS 13 9380 2019 | |
| Lenovo ThinkPad 13 20J1005TPB | |
| 3DMark 11 Performance | 3896 poäng | |
| 3DMark Cloud Gate Standard Score | 12643 poäng | |
| 3DMark Fire Strike Score | 2585 poäng | |
| 3DMark Time Spy Score | 964 poäng | |
Hjälp | ||
| The Witcher 3 | |
| 1366x768 Medium Graphics & Postprocessing | |
| Asus FX504GD | |
| Acer Nitro 5 AN515-42-R6V0 | |
| Asus GL552VW-DK725T | |
| Razer Blade Stealth i7-8565U | |
| Acer Aspire 5 A515-52G-723L | |
| Asus ZenBook UX530UX-FY070T | |
| Genomsnitt NVIDIA GeForce MX150 (24.4 - 43.2, n=26) | |
| Asus ZenBook S13 UX392FN | |
| Asus VivoBook S410UQ-NH74 | |
| 1920x1080 High Graphics & Postprocessing (Nvidia HairWorks Off) | |
| Asus FX504GD | |
| Acer Nitro 5 AN515-42-R6V0 | |
| Razer Blade Stealth i7-8565U | |
| Asus GL552VW-DK725T | |
| Acer Aspire 5 A515-52G-723L | |
| Asus ZenBook UX530UX-FY070T | |
| Genomsnitt NVIDIA GeForce MX150 (13.3 - 23.8, n=25) | |
| Asus ZenBook S13 UX392FN | |
| Dell Latitude 14 5495 | |
| låg | med. | hög | ultra | |
|---|---|---|---|---|
| BioShock Infinite (2013) | 147.1 | 95.7 | 81.6 | 30.5 |
| The Witcher 3 (2015) | 57.6 | 32.5 | 18 | 10 |
| Rise of the Tomb Raider (2016) | 63.2 | 36.9 | 19.2 | 16.7 |
| Asus ZenBook S13 UX392FN GeForce MX150, i7-8565U, WDC PC SN520 SDAPNUW-512G | Dell XPS 13 9380 2019 UHD Graphics 620, i5-8265U, SK hynix PC401 HFS256GD9TNG | Asus ZenBook S UX391U UHD Graphics 620, i5-8550U, Samsung PM961 NVMe MZVLW512HMJP | Huawei Matebook X Pro i5 GeForce MX150, i5-8250U, Samsung PM961 MZVLW256HEHP | Lenovo Yoga C930-13IKB UHD Graphics 620, i5-8250U, SK hynix PC401 HFS256GD9TNG | Razer Blade Stealth i7-8565U GeForce MX150, i7-8565U, Lite-On CA3-8D256-Q11 | |
|---|---|---|---|---|---|---|
| Noise | 0% | -0% | 0% | 5% | -2% | |
| av / miljö * (dB) | 28.1 | 30.4 -8% | 29.7 -6% | 27.9 1% | 29.3 -4% | 28.4 -1% |
| Idle Minimum * (dB) | 28.1 | 30.4 -8% | 29.7 -6% | 27.9 1% | 29.3 -4% | 28.5 -1% |
| Idle Average * (dB) | 28.1 | 30.4 -8% | 29.7 -6% | 27.9 1% | 29.3 -4% | 29 -3% |
| Idle Maximum * (dB) | 29 | 30.4 -5% | 30.1 -4% | 27.9 4% | 29.7 -2% | 29.1 -0% |
| Load Average * (dB) | 41.1 | 31.7 23% | 36.8 10% | 36.2 12% | 31.8 23% | 42.8 -4% |
| Witcher 3 ultra * (dB) | 41.1 | 45 -9% | 41.4 -1% | |||
| Load Maximum * (dB) | 41.1 | 38.1 7% | 36.8 10% | 45.2 -10% | 32.7 20% | 41.6 -1% |
* ... mindre är bättre
Ljudnivå
| Låg belastning |
| 28.1 / 28.1 / 29 dB(A) |
| Hög belastning |
| 41.1 / 41.1 dB(A) |
 | ||
30 dB tyst 40 dB(A) hörbar 50 dB(A) högt ljud |
||
min: | ||
(±) Den maximala temperaturen på ovansidan är 42.4 °C / 108 F, jämfört med genomsnittet av 35.9 °C / 97 F , allt från 21.4 till 59 °C för klassen Subnotebook.
(-) Botten värms upp till maximalt 48.6 °C / 119 F, jämfört med genomsnittet av 39.2 °C / 103 F
(+) Vid tomgångsbruk är medeltemperaturen för ovansidan 28.4 °C / 83 F, jämfört med enhetsgenomsnittet på 30.8 °C / ### class_avg_f### F.
(±) När du spelar The Witcher 3 är medeltemperaturen för ovansidan 33.6 °C / 92 F, jämfört med enhetsgenomsnittet på 30.8 °C / ## #class_avg_f### F.
(+) Handledsstöden och pekplattan är kallare än hudtemperaturen med maximalt 30.2 °C / 86.4 F och är därför svala att ta på.
(±) Medeltemperaturen för handledsstödsområdet på liknande enheter var 28.2 °C / 82.8 F (-2 °C / -3.6 F).
Asus ZenBook S13 UX392FN ljudanalys
(±) | högtalarljudstyrkan är genomsnittlig men bra (74.1 dB)
Bas 100 - 315 Hz
(±) | reducerad bas - i genomsnitt 10.9% lägre än medianen
(±) | linjäriteten för basen är genomsnittlig (12% delta till föregående frekvens)
Mellan 400 - 2000 Hz
(±) | högre mellan - i genomsnitt 6.4% högre än median
(±) | linjäriteten för mids är genomsnittlig (8.4% delta till föregående frekvens)
Högsta 2 - 16 kHz
(+) | balanserade toppar - endast 2.3% från medianen
(±) | linjäriteten för toppar är genomsnittlig (7.6% delta till föregående frekvens)
Totalt 100 - 16 000 Hz
(±) | linjäriteten för det totala ljudet är genomsnittlig (21.9% skillnad mot median)
Jämfört med samma klass
» 74% av alla testade enheter i den här klassen var bättre, 6% liknande, 20% sämre
» Den bästa hade ett delta på 5%, genomsnittet var 18%, sämst var 53%
Jämfört med alla testade enheter
» 63% av alla testade enheter var bättre, 7% liknande, 31% sämre
» Den bästa hade ett delta på 4%, genomsnittet var 24%, sämst var 134%
Apple MacBook 12 (Early 2016) 1.1 GHz ljudanalys
(+) | högtalare kan spela relativt högt (83.6 dB)
Bas 100 - 315 Hz
(±) | reducerad bas - i genomsnitt 11.3% lägre än medianen
(±) | linjäriteten för basen är genomsnittlig (14.2% delta till föregående frekvens)
Mellan 400 - 2000 Hz
(+) | balanserad mellan - endast 2.4% från medianen
(+) | mids är linjära (5.5% delta till föregående frekvens)
Högsta 2 - 16 kHz
(+) | balanserade toppar - endast 2% från medianen
(+) | toppar är linjära (4.5% delta till föregående frekvens)
Totalt 100 - 16 000 Hz
(+) | det totala ljudet är linjärt (10.2% skillnad mot median)
Jämfört med samma klass
» 7% av alla testade enheter i den här klassen var bättre, 2% liknande, 91% sämre
» Den bästa hade ett delta på 5%, genomsnittet var 18%, sämst var 53%
Jämfört med alla testade enheter
» 5% av alla testade enheter var bättre, 1% liknande, 94% sämre
» Den bästa hade ett delta på 4%, genomsnittet var 24%, sämst var 134%
| Av/Standby | |
| Låg belastning | |
| Hög belastning |
|
Förklaring:
min: | |
| Asus ZenBook S13 UX392FN i7-8565U, GeForce MX150, WDC PC SN520 SDAPNUW-512G, IPS, 1920x1080, 13.9" | Dell XPS 13 9380 2019 i5-8265U, UHD Graphics 620, SK hynix PC401 HFS256GD9TNG, IPS, 3840x2160, 13.3" | Asus ZenBook S UX391U i5-8550U, UHD Graphics 620, Samsung PM961 NVMe MZVLW512HMJP, IPS, 1920x1080, 13.3" | Huawei Matebook X Pro i5 i5-8250U, GeForce MX150, Samsung PM961 MZVLW256HEHP, IPS, 3000x2000, 13.9" | Lenovo Yoga C930-13IKB i5-8250U, UHD Graphics 620, SK hynix PC401 HFS256GD9TNG, IPS, 1920x1080, 13.9" | Razer Blade Stealth i7-8565U i7-8565U, GeForce MX150, Lite-On CA3-8D256-Q11, IPS, 1920x1080, 13.3" | |
|---|---|---|---|---|---|---|
| Power Consumption | -6% | 12% | -10% | 7% | -36% | |
| Idle Minimum * (Watt) | 3.4 | 4.8 -41% | 3.24 5% | 3.5 -3% | 3.3 3% | 6.7 -97% |
| Idle Average * (Watt) | 6.3 | 8.6 -37% | 6.1 3% | 8.9 -41% | 6.8 -8% | 8.6 -37% |
| Idle Maximum * (Watt) | 10.4 | 10.4 -0% | 9.2 12% | 12.3 -18% | 9.5 9% | 9.4 10% |
| Load Average * (Watt) | 51 | 37.9 26% | 38.8 24% | 54.2 -6% | 40.8 20% | 64.1 -26% |
| Witcher 3 ultra * (Watt) | 39 | 42.4 -9% | 63.7 -63% | |||
| Load Maximum * (Watt) | 62.7 | 48.5 23% | 52.6 16% | 52.1 17% | 57 9% | 64.1 -2% |
* ... mindre är bättre
| Asus ZenBook S13 UX392FN i7-8565U, GeForce MX150, 50 Wh | Dell XPS 13 9380 2019 i5-8265U, UHD Graphics 620, 52 Wh | Asus ZenBook S UX391U i5-8550U, UHD Graphics 620, 50 Wh | Huawei Matebook X Pro i5 i5-8250U, GeForce MX150, 57.4 Wh | Lenovo Yoga C930-13IKB i5-8250U, UHD Graphics 620, 60 Wh | HP Spectre x360 13t-ae000 i5-8550U, UHD Graphics 620, 60 Wh | Razer Blade Stealth i7-8565U i7-8565U, GeForce MX150, 53.1 Wh | |
|---|---|---|---|---|---|---|---|
| Batteridrifttid | 0% | -4% | 4% | 6% | 2% | 5% | |
| Reader / Idle (h) | 28.5 | 17.2 -40% | 22.3 -22% | 20.7 -27% | 23.9 -16% | 20.5 -28% | |
| WiFi v1.3 (h) | 8.4 | 8.3 -1% | 8.2 -2% | 9.3 11% | 9.2 10% | 7.1 -15% | 9.5 13% |
| Load (h) | 1.7 | 2.4 41% | 1.9 12% | 2.2 29% | 2.1 24% | 2 18% | 2.2 29% |
För
Emot
Läs den fullständiga versionen av den här recensionen på engelska här.
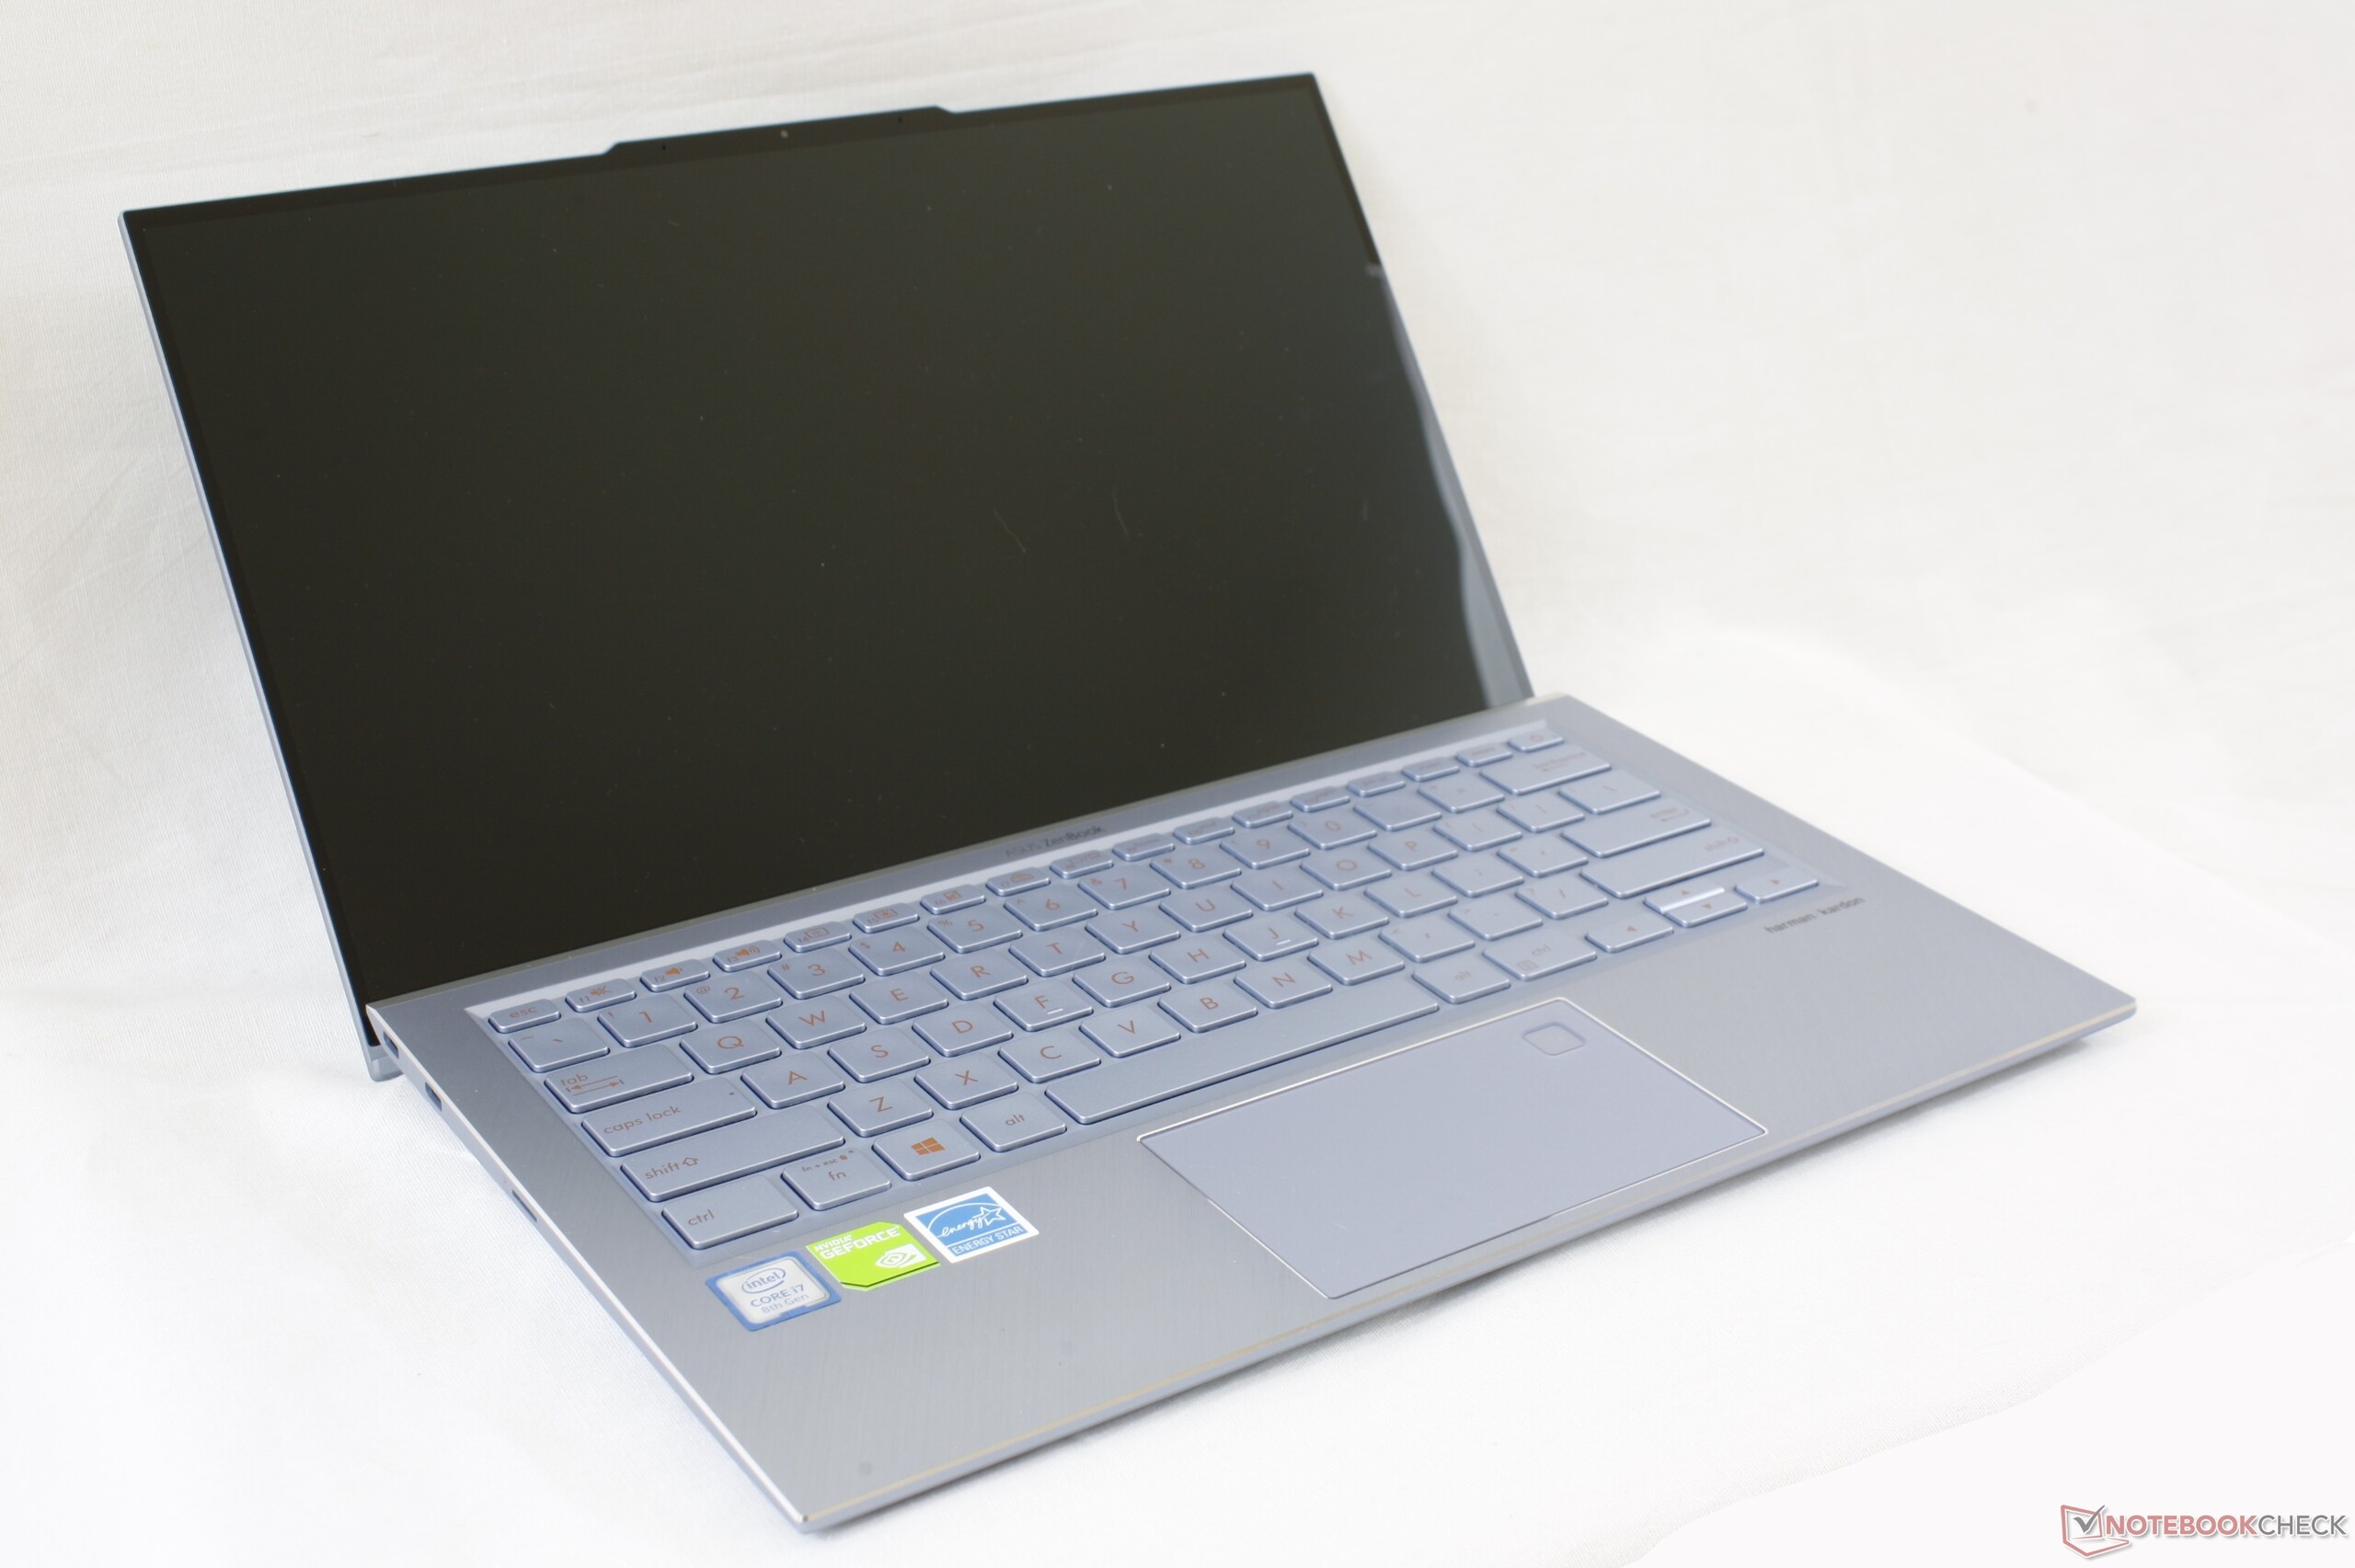
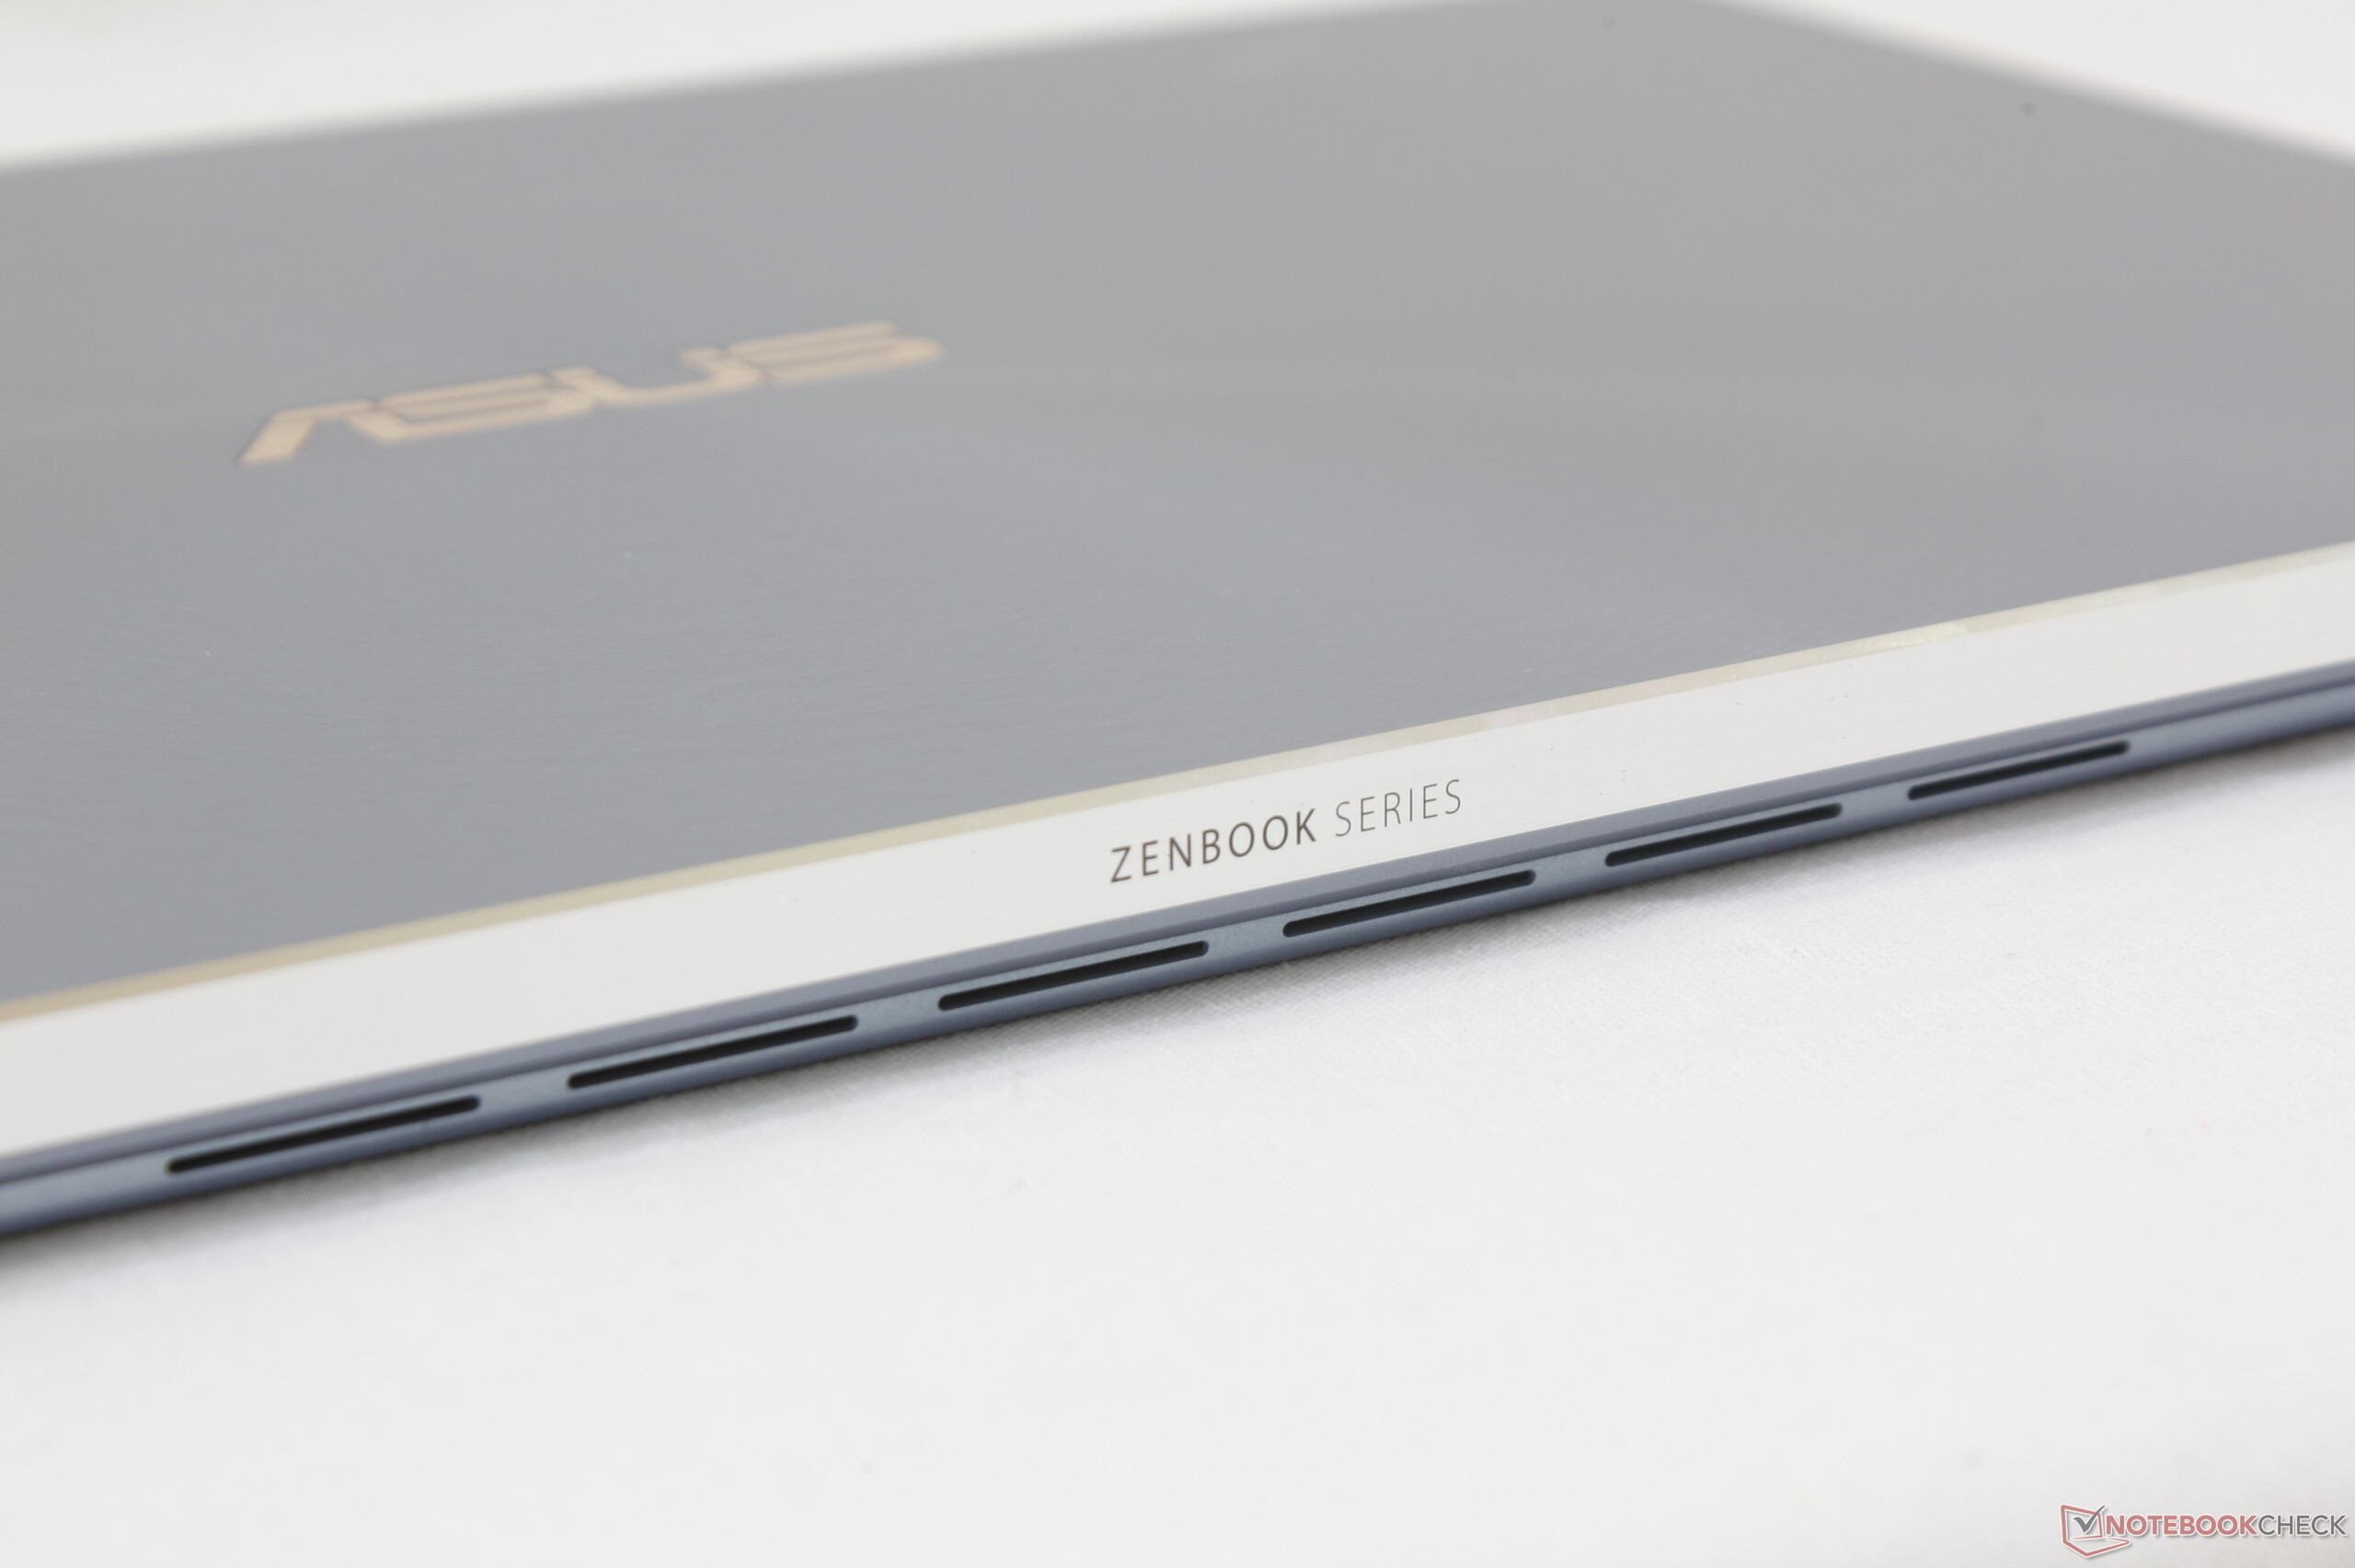
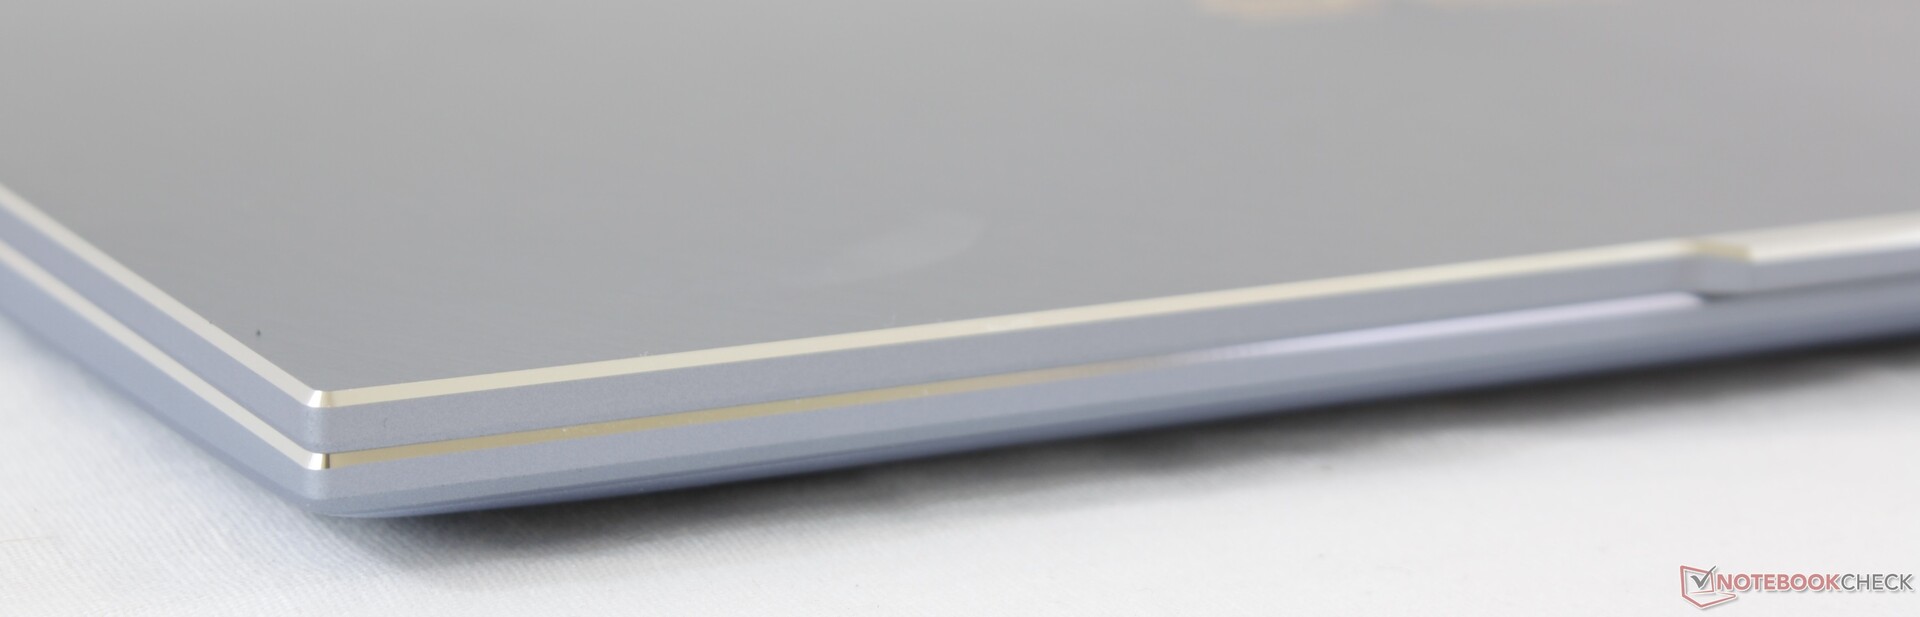
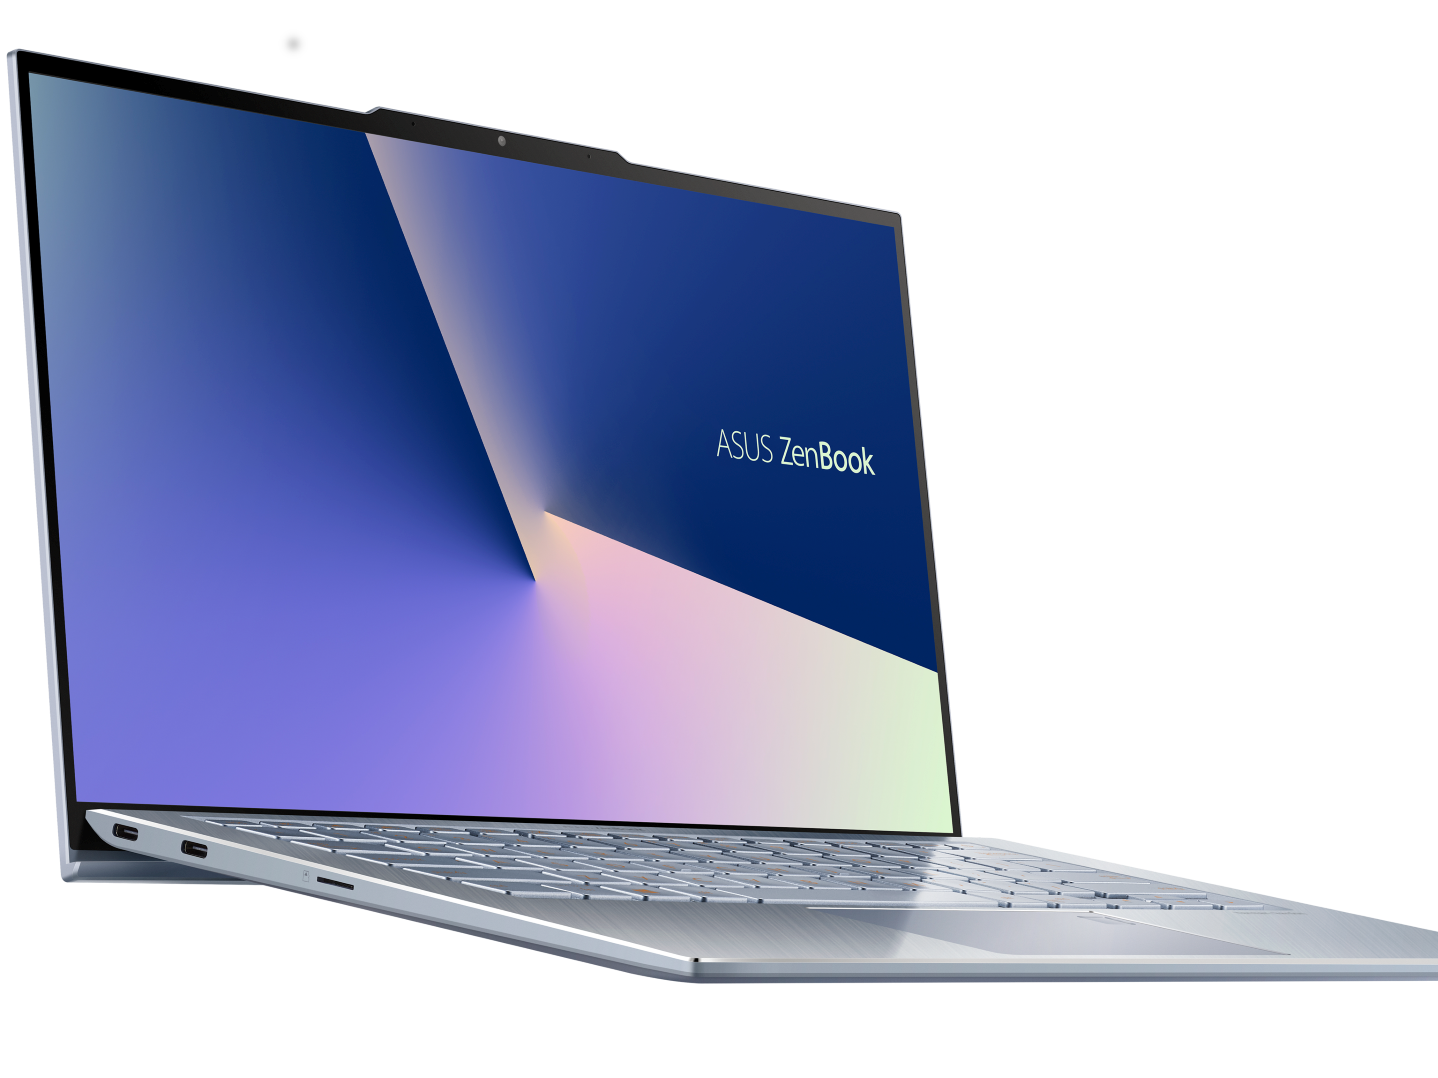
Asus ZenBook S13 UX392 lovar mycket. Den ska tydligen ha världens tunnaste skärminfattning, världens största skärm i förhållande till kroppen och världens tunnaste design som inkluderar diskret Nvidia-grafik. Genom att sikta mot dessa höga mål har Asus skapat en laptop på 13.9 tum som är mindre och lättare än många av de senaste Ultrabook-modellerna på 13.3 tum som finns på marknaden, inklusive Dell XPS 13 9380 och HP Spectre 13. UX392 lyckas till och med ha bättre grafisk kapacitet då den inte är begränsad till inbyggd UHD-grafik som de flesta andra Ultrabook-modeller. Faktum att den har en större skärm och mer GPU-hästkrafter utan att vara större eller tyngre gör det extremt lockande att rekommendera den framför de tidigare nämnda alternativen.
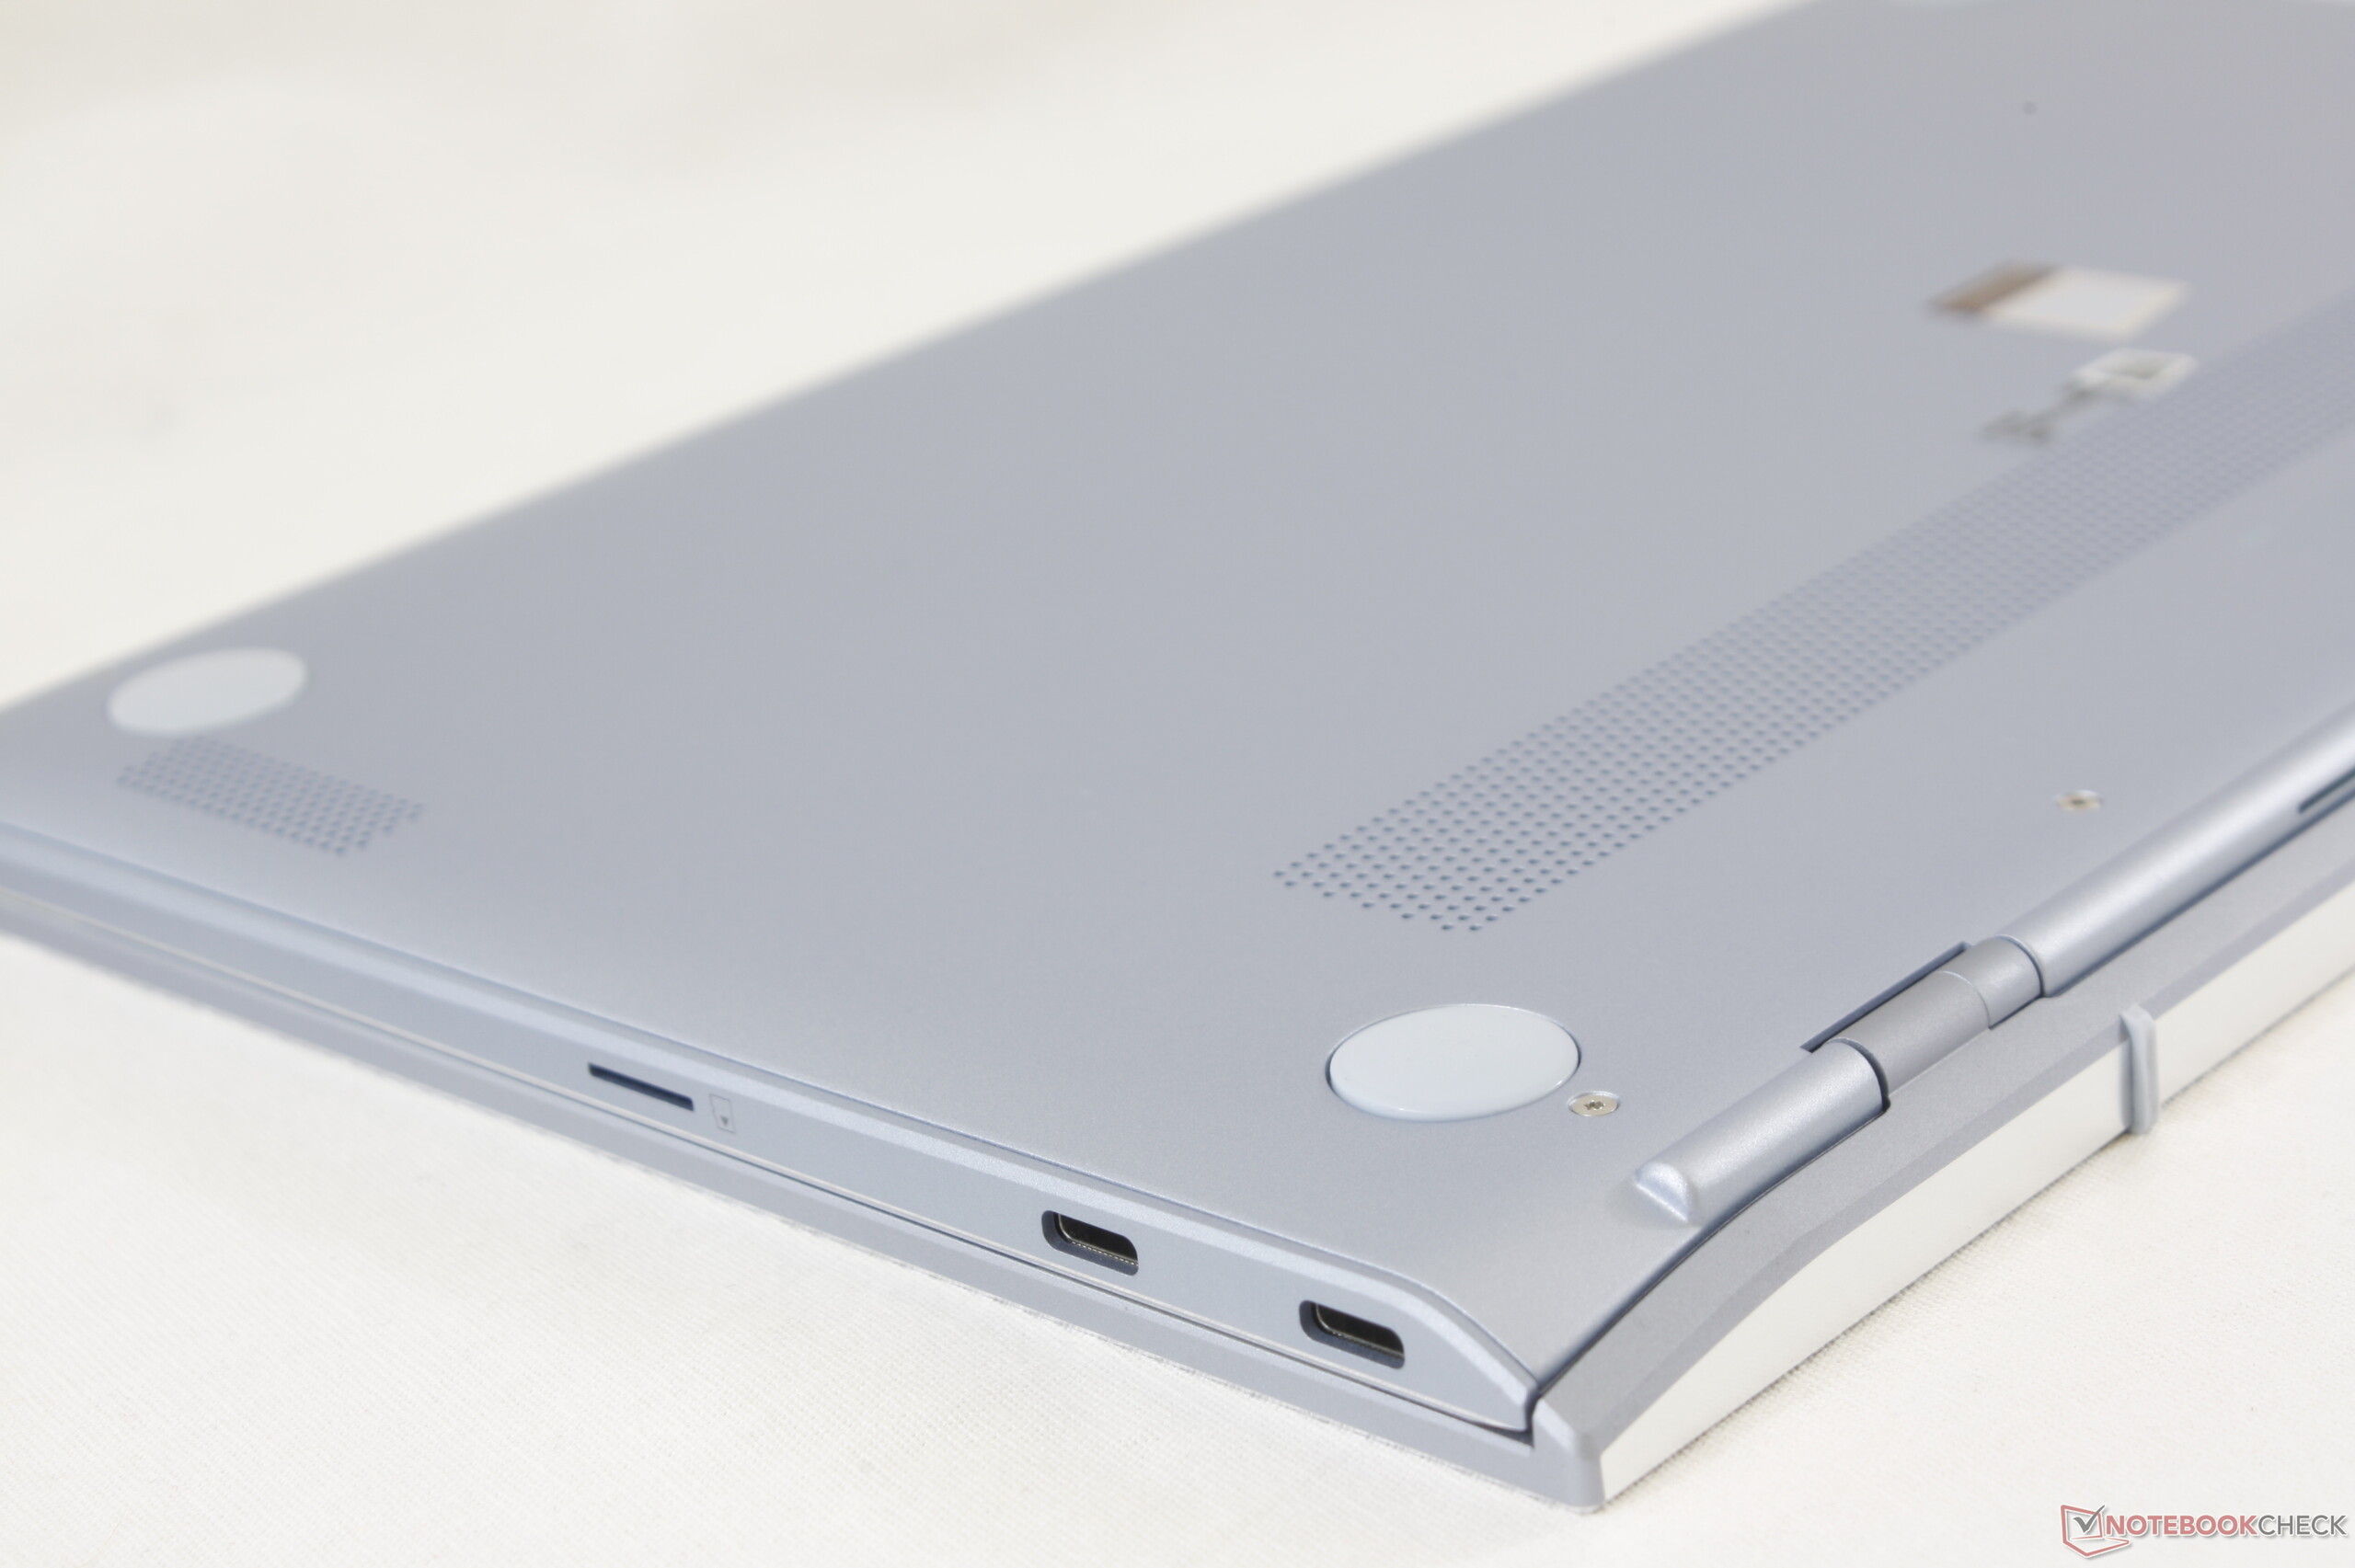
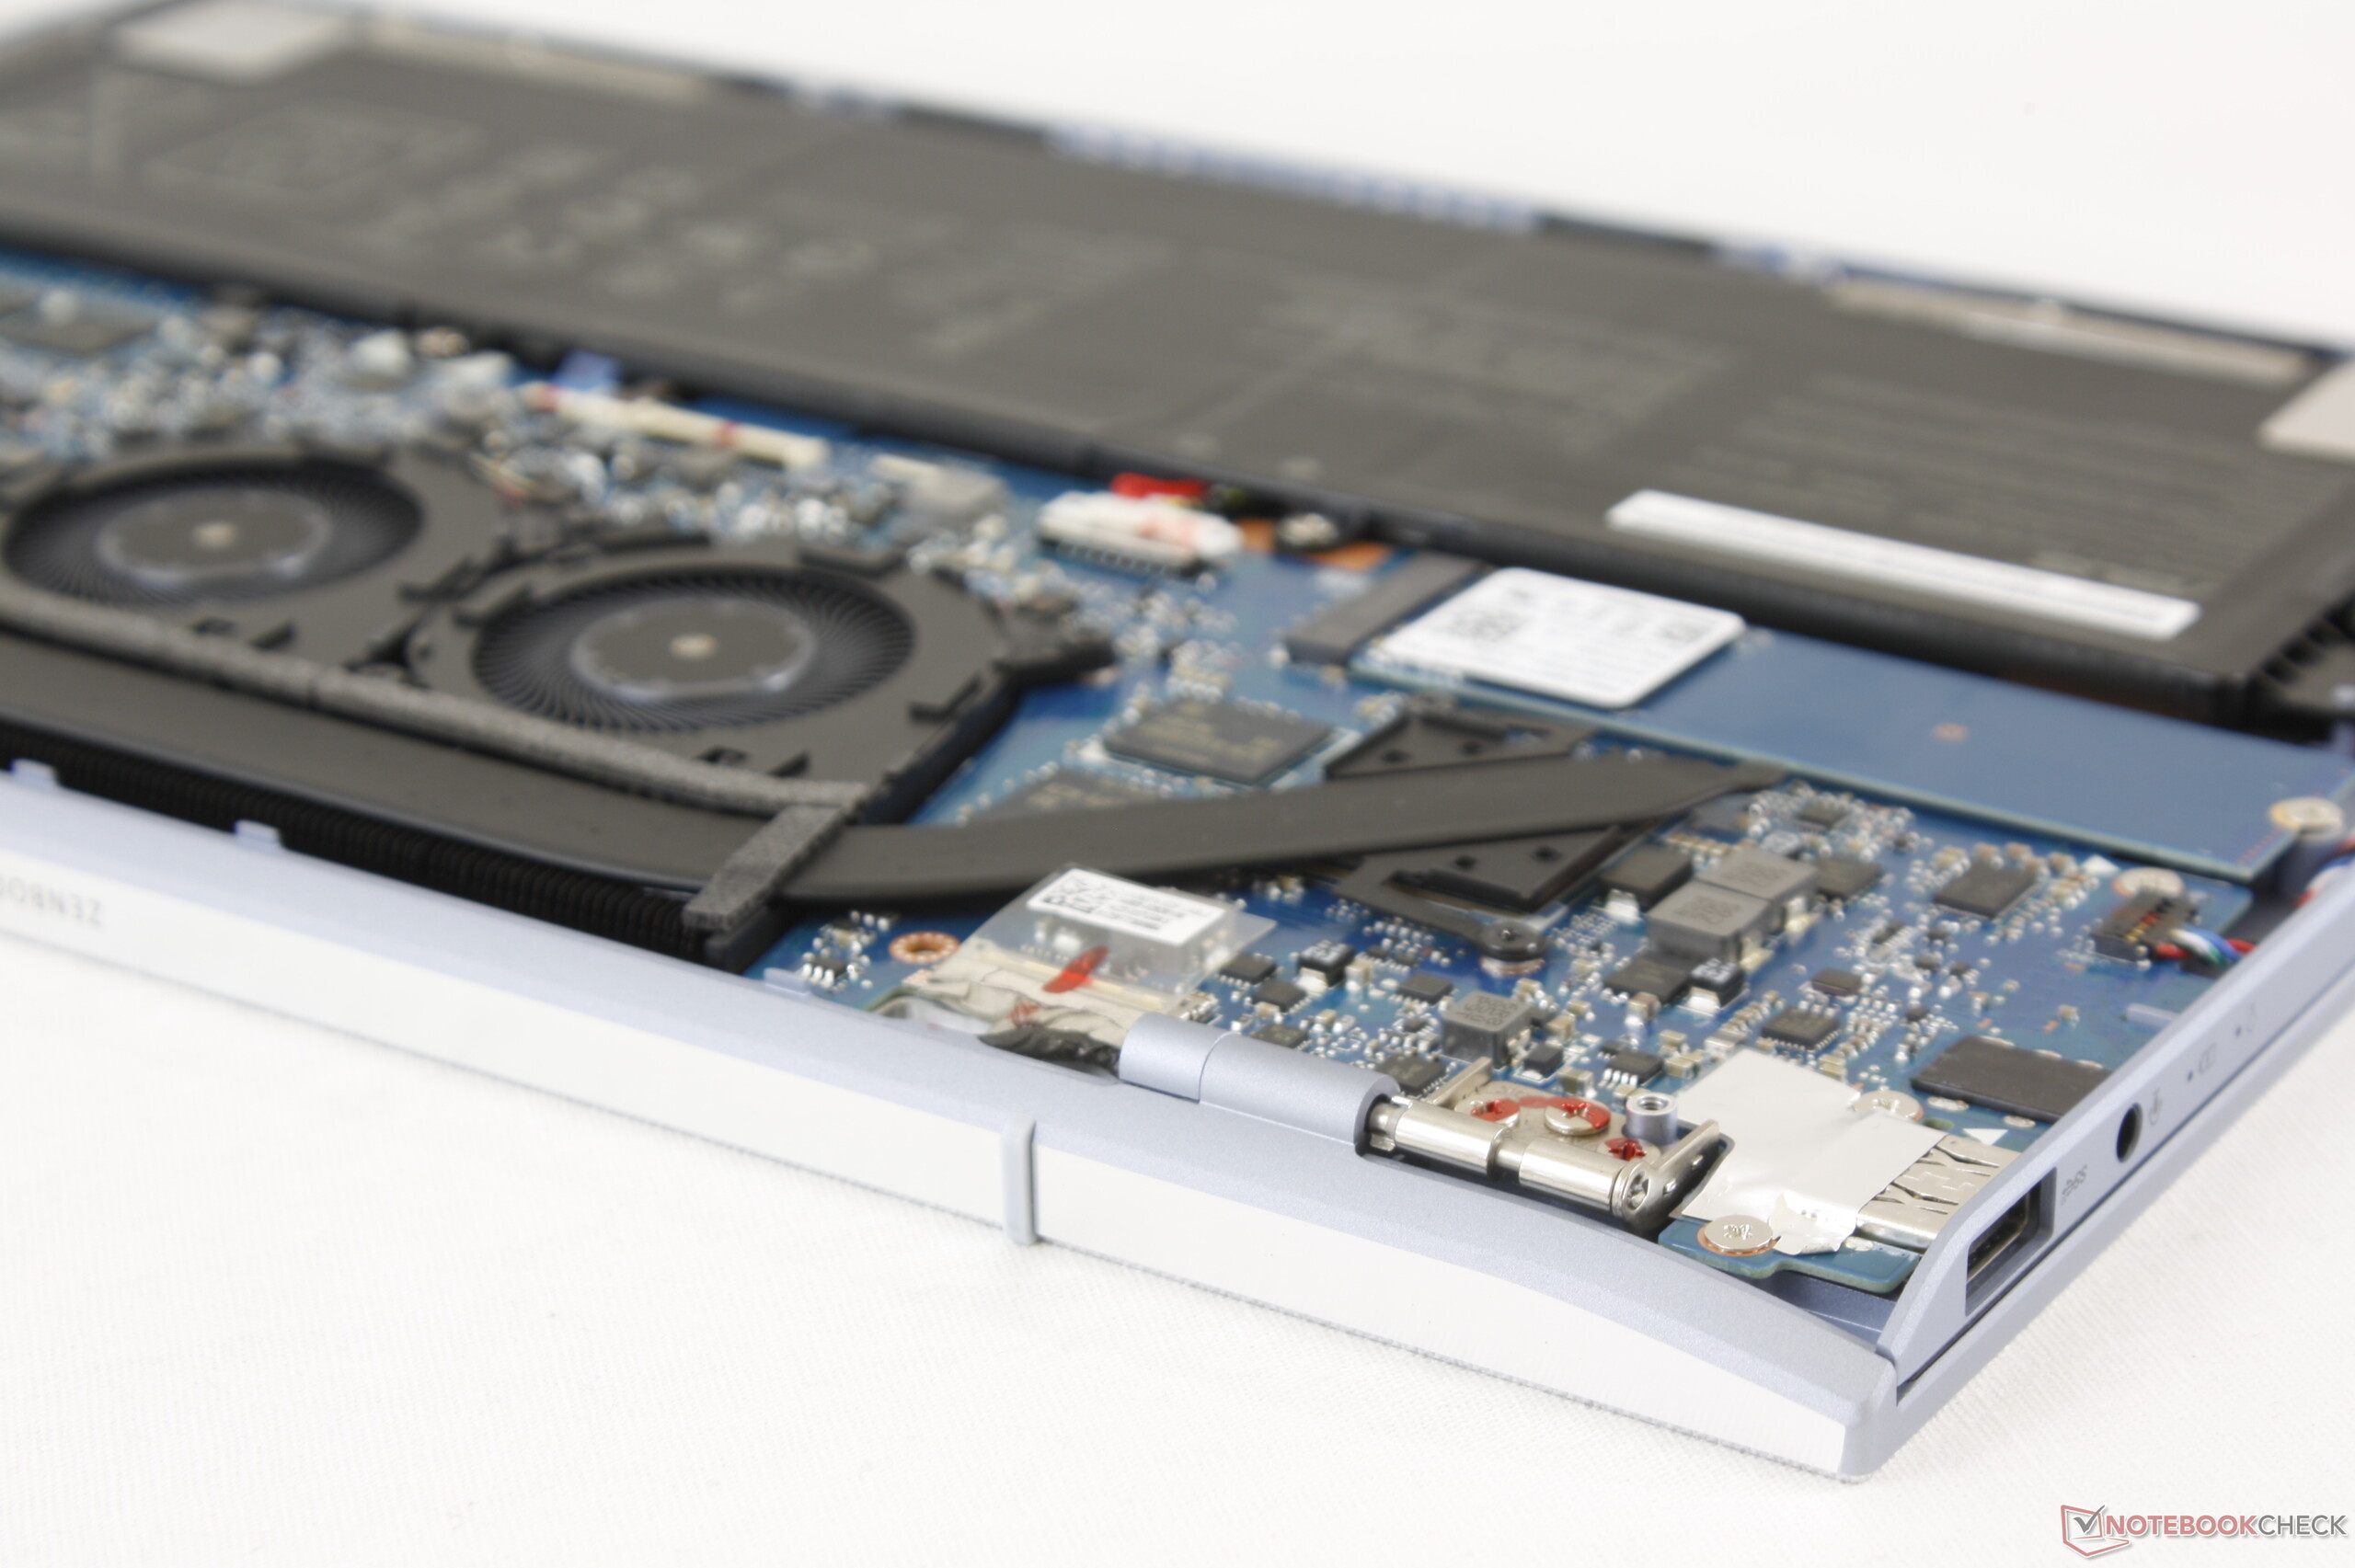
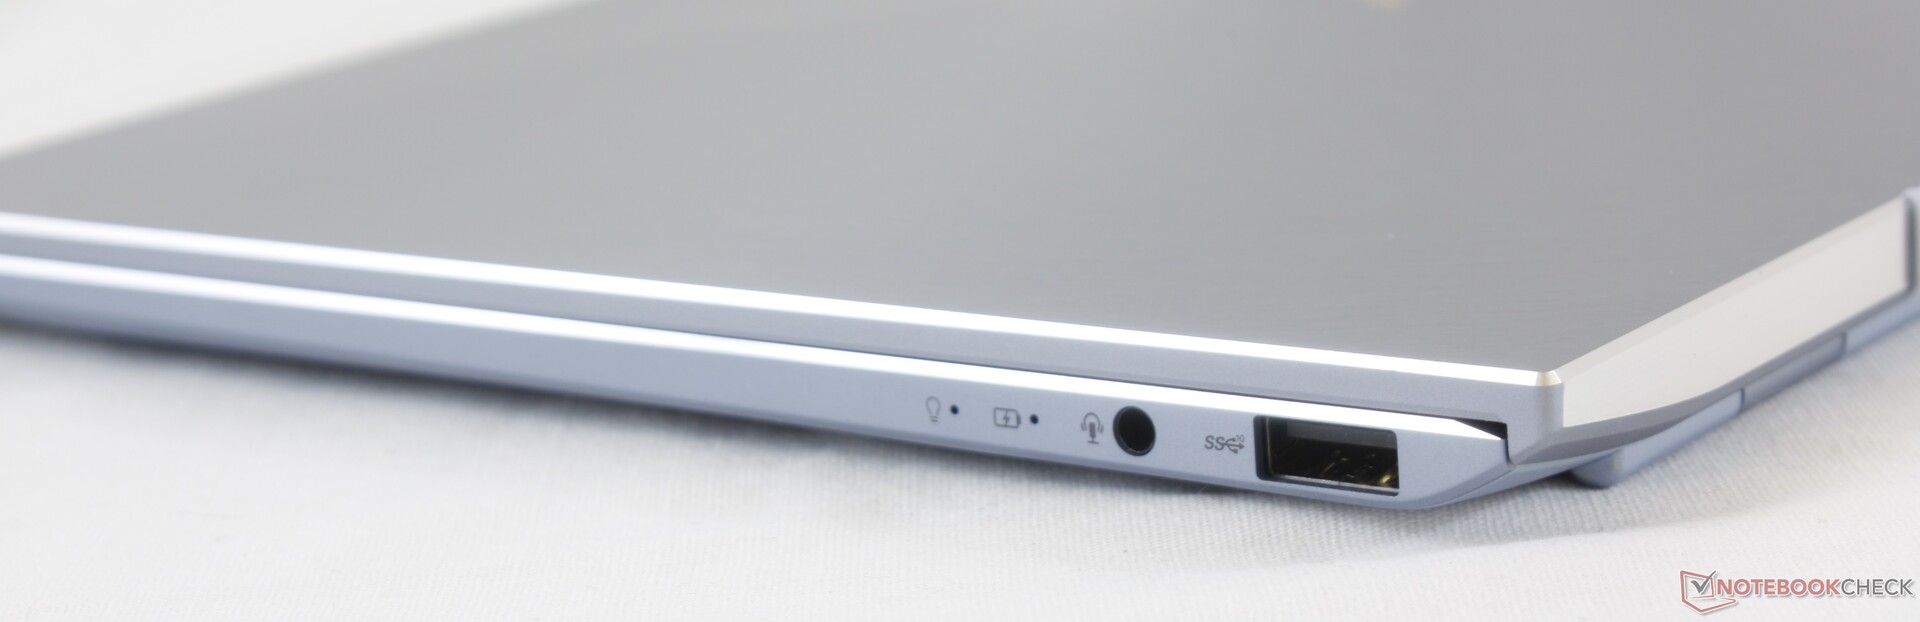
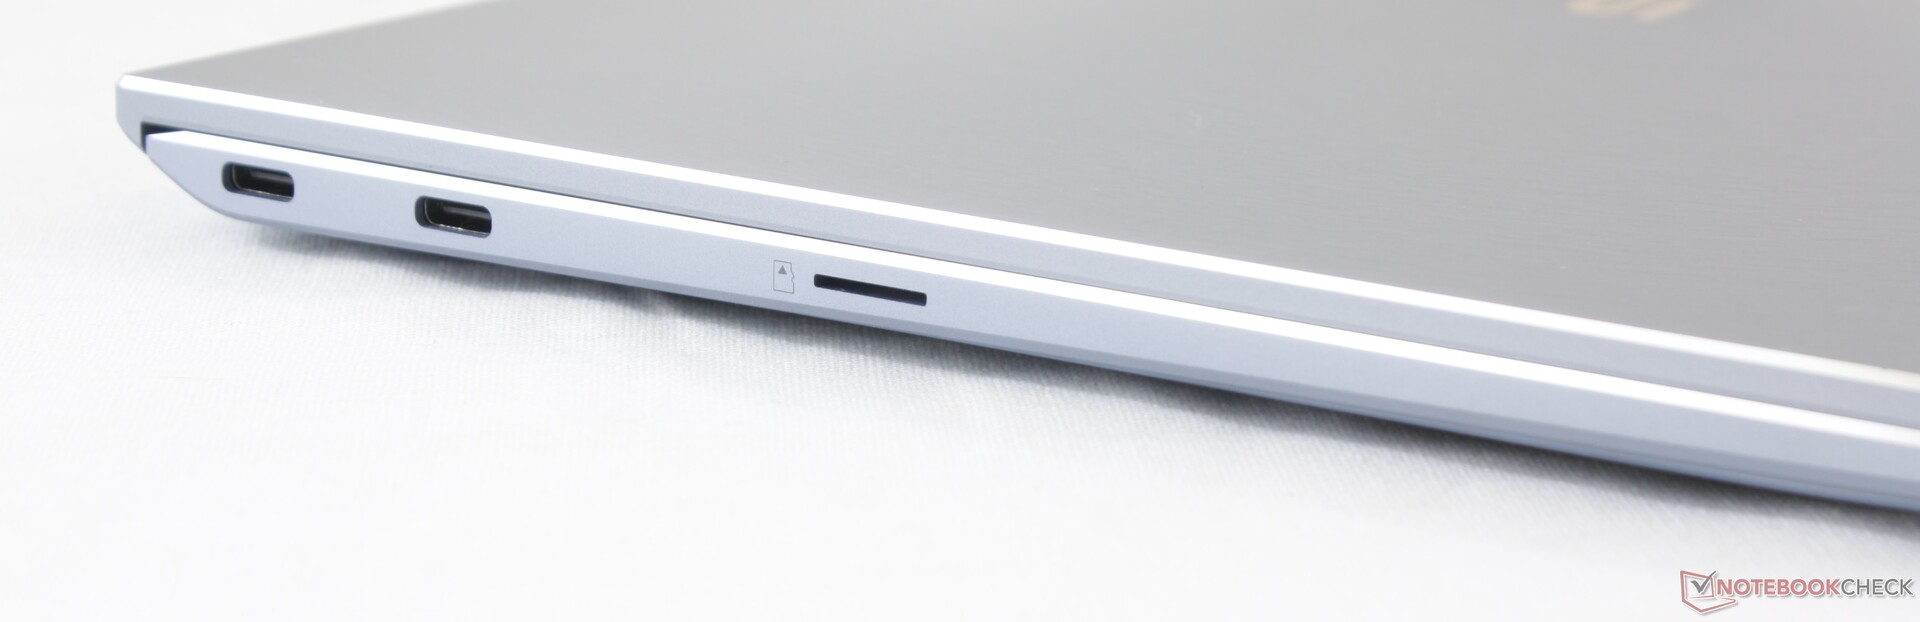
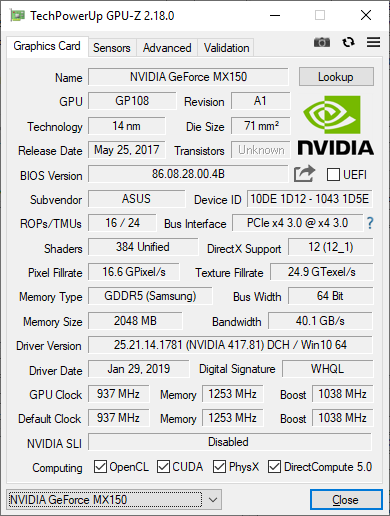
Det finns ett antal brister att ha i åtanke. Bristen på Thunderbolt 3, som exempel, gör att den som vill koppla ihop externa 4K UHD-skärmar eller använda eGPU-dockningsstationer får titta någon annanstans. Vidare är 10W-versionen av GeForce MX150 GPU:n mätbart långsammare än 25W-versionen och datorn är medioker på att upprätthålla Turbo Boost. Konkurrenterna Huawei MateBook 13 och Razer Blade Stealth är båda utrustade med samma CPU och en snabbare GPU på 25W, vilket bevisar att Asus kan göra bättre på prestandafronten. Den klistriga styrplattan gör det dessutom mindre smidigt att styra pekaren jämfört med motsvarigheterna från Dell och HP.
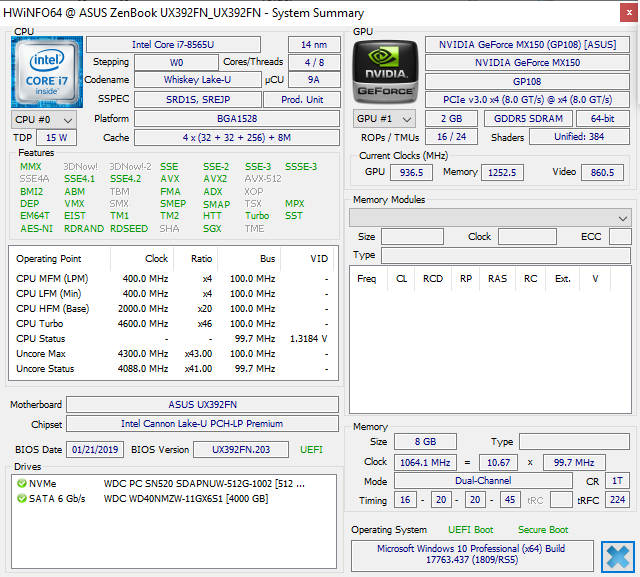
Slutligen finns det ett par nedskärningar som är värda att nämna. De minimala uppgraderingsalternativen, den medelmåttiga MicroSD-prestandan och SSD-enhet som använder PCIe x2 istället för PCIe x4 är märkligt att se på en flaggskepps-Ultrabook. Som tur är påverkar inte dessa saker vardagsprestandan annat än om du verkligen förespråkar WiFi 6 eller vill ha stöd för tryckkänslig skärm/WACOM, WWAN eller vill ha RAM som går att utöka. Bortsett från det är detta definitivt en subnotebook som bör ligga på toppen av varje inköpslista.
Om du planerar att köpa en Ultrabook på 13 tum, stanna till och ta en titt på Asus ZenBook S13 UX392. Det finns en stor chans att den erbjuder det du letar efter samtidigt som den har en större skärm och en snabbare GPU och är precis lika liten och lätt.
Asus ZenBook S13 UX392FN
- 05/01/2019 v6 (old)
Allen Ngo
Price comparison
