Test: Dell XPS 13 9300 – Mindre, men har långsammare CPU (Sammanfattning)
Gradering | Datum | Modell | Vikt | Höjd | Storlek | Upplösning | Pris |
|---|---|---|---|---|---|---|---|
| 88.8 % v7 (old) | 04/2020 | Dell XPS 13 9300 i5 FHD i5-1035G1, UHD Graphics G1 (Ice Lake 32 EU) | 1.2 kg | 14.8 mm | 13.40" | 1920x1200 | |
| 90.6 % v7 (old) | 02/2020 | Apple MacBook Pro 13 2019 2TB3 i5-8257U, Iris Plus Graphics 645 | 1.4 kg | 14.9 mm | 13.30" | 2560x1600 | |
| 87 % v7 (old) | 02/2020 | Acer Swift 3 SF313-52-71Y7 i7-1065G7, Iris Plus Graphics G7 (Ice Lake 64 EU) | 1.2 kg | 16.6 mm | 13.50" | 2256x1504 | |
| 90.3 % v6 (old) | 05/2019 | Lenovo ThinkPad X390-20Q1S02M00 i5-8265U, UHD Graphics 620 | 1.3 kg | 16.9 mm | 13.30" | 1920x1080 | |
| 88 % v6 (old) | 02/2019 | Dell XPS 13 9380 2019 i5-8265U, UHD Graphics 620 | 1.2 kg | 11.6 mm | 13.30" | 3840x2160 | |
| 86.3 % v7 (old) | 10/2019 | Dell XPS 13 7390 2-in-1 Core i7 i7-1065G7, Iris Plus Graphics G7 (Ice Lake 64 EU) | 1.3 kg | 13 mm | 13.40" | 1920x1200 |
| SD Card Reader | |
| average JPG Copy Test (av. of 3 runs) | |
| Dell XPS 13 9380 2019 (Toshiba Exceria Pro SDXC 64 GB UHS-II) | |
| Dell XPS 13 9300 i5 FHD (Toshiba Exceria Pro M501 64 GB UHS-II) | |
| Dell XPS 13 7390 2-in-1 Core i7 (Toshiba Exceria Pro M501 64 GB UHS-II) | |
| Lenovo ThinkPad X390-20Q1S02M00 (Toshiba Exceria Pro M501) | |
| Genomsnitt av klass Subnotebook (23.7 - 188, n=9, senaste 2 åren) | |
| maximum AS SSD Seq Read Test (1GB) | |
| Dell XPS 13 9300 i5 FHD (Toshiba Exceria Pro M501 64 GB UHS-II) | |
| Dell XPS 13 9380 2019 (Toshiba Exceria Pro SDXC 64 GB UHS-II) | |
| Dell XPS 13 7390 2-in-1 Core i7 (Toshiba Exceria Pro M501 64 GB UHS-II) | |
| Genomsnitt av klass Subnotebook (24.9 - 195, n=8, senaste 2 åren) | |
| Lenovo ThinkPad X390-20Q1S02M00 (Toshiba Exceria Pro M501) | |

| |||||||||||||||||||||||||
Distribution av ljusstyrkan: 91 %
Mitt på batteriet: 528 cd/m²
Kontrast: 1769:1 (Svärta: 0.35 cd/m²)
ΔE ColorChecker Calman: 3 | ∀{0.5-29.43 Ø4.71}
calibrated: 1
ΔE Greyscale Calman: 5.2 | ∀{0.09-98 Ø4.96}
99.3% sRGB (Argyll 1.6.3 3D)
66.9% AdobeRGB 1998 (Argyll 1.6.3 3D)
73.5% AdobeRGB 1998 (Argyll 3D)
99.4% sRGB (Argyll 3D)
71.5% Display P3 (Argyll 3D)
Gamma: 2.14
CCT: 6340 K
| Dell XPS 13 9300 i5 FHD SHP14CB, IPS, 1920x1200, 13.4" | Apple MacBook Pro 13 2019 2TB3 APPA03D, IPS, 2560x1600, 13.3" | Acer Swift 3 SF313-52-71Y7 BOE, NE135FBM-N41, IPS, 2256x1504, 13.5" | Lenovo ThinkPad X390-20Q1S02M00 LP133WF7-SPB1, IPS LED, 1920x1080, 13.3" | Dell XPS 13 9380 2019 ID: AUO 282B B133ZAN Dell: 90NTH, IPS, 3840x2160, 13.3" | Dell XPS 13 7390 2-in-1 Core i7 Sharp LQ134N1, IPS, 1920x1200, 13.4" | |
|---|---|---|---|---|---|---|
| Display | 17% | -2% | -7% | -9% | -2% | |
| Display P3 Coverage (%) | 71.5 | 96.1 34% | 70.1 -2% | 65.3 -9% | 64.7 -10% | 69.9 -2% |
| sRGB Coverage (%) | 99.4 | 99.4 0% | 99.8 0% | 95.9 -4% | 93.1 -6% | 99.2 0% |
| AdobeRGB 1998 Coverage (%) | 73.5 | 85.6 16% | 71.2 -3% | 66.6 -9% | 65.3 -11% | 71.5 -3% |
| Response Times | 5% | 8% | 1% | -3% | 17% | |
| Response Time Grey 50% / Grey 80% * (ms) | 60 ? | 50.4 ? 16% | 55 ? 8% | 57.6 ? 4% | 58 ? 3% | 47.6 ? 21% |
| Response Time Black / White * (ms) | 33.2 ? | 35.2 ? -6% | 31 ? 7% | 34 ? -2% | 36 ? -8% | 29.2 ? 12% |
| PWM Frequency (Hz) | 2500 ? | 116300 ? | 208 ? | 2500 ? | ||
| Screen | 18% | -13% | -1% | -22% | 3% | |
| Brightness middle (cd/m²) | 619 | 603 -3% | 474 -23% | 356 -42% | 404 -35% | 549.8 -11% |
| Brightness (cd/m²) | 591 | 577 -2% | 426 -28% | 336 -43% | 389 -34% | 520 -12% |
| Brightness Distribution (%) | 91 | 92 1% | 82 -10% | 88 -3% | 85 -7% | 86 -5% |
| Black Level * (cd/m²) | 0.35 | 0.35 -0% | 0.29 17% | 0.16 54% | 0.37 -6% | 0.39 -11% |
| Contrast (:1) | 1769 | 1723 -3% | 1634 -8% | 2225 26% | 1092 -38% | 1410 -20% |
| Colorchecker dE 2000 * | 3 | 1.7 43% | 2.38 21% | 3.6 -20% | 3.72 -24% | 2.12 29% |
| Colorchecker dE 2000 max. * | 8.2 | 3.1 62% | 5.88 28% | 5.5 33% | 7.38 10% | 3.66 55% |
| Colorchecker dE 2000 calibrated * | 1 | 0.7 30% | 2.69 -169% | 1.1 -10% | 2.06 -106% | 1.37 -37% |
| Greyscale dE 2000 * | 5.2 | 2.1 60% | 3.75 28% | 4.7 10% | 4.44 15% | 2.6 50% |
| Gamma | 2.14 103% | 2.18 101% | 2.37 93% | 2.48 89% | 2.34 94% | 2.3 96% |
| CCT | 6340 103% | 6843 95% | 6466 101% | 6374 102% | 7095 92% | 6884 94% |
| Color Space (Percent of AdobeRGB 1998) (%) | 66.9 | 76.7 15% | 65 -3% | 61.3 -8% | 60 -10% | 65.4 -2% |
| Color Space (Percent of sRGB) (%) | 99.3 | 99.4 0% | 100 1% | 95.7 -4% | 93 -6% | 99.7 0% |
| Totalt genomsnitt (program/inställningar) | 13% /
16% | -2% /
-9% | -2% /
-2% | -11% /
-17% | 6% /
4% |
* ... mindre är bättre
Visa svarstider
| ↔ Svarstid svart till vitt | ||
|---|---|---|
| 33.2 ms ... stiga ↗ och falla ↘ kombinerat | ↗ 16.4 ms stiga | 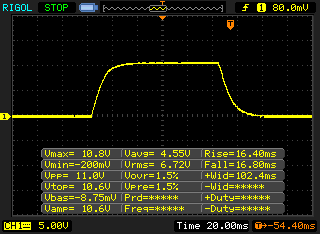 |
| ↘ 16.8 ms hösten | ||
| Skärmen visar långsamma svarsfrekvenser i våra tester och kommer att vara otillfredsställande för spelare. I jämförelse sträcker sig alla testade enheter från 0.1 (minst) till 240 (maximalt) ms. » 90 % av alla enheter är bättre. Detta innebär att den uppmätta svarstiden är sämre än genomsnittet av alla testade enheter (19.8 ms). | ||
| ↔ Svarstid 50 % grått till 80 % grått | ||
| 60 ms ... stiga ↗ och falla ↘ kombinerat | ↗ 28.4 ms stiga | 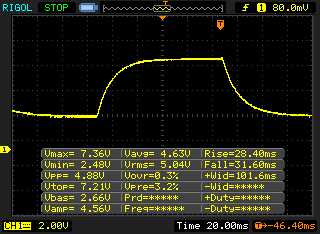 |
| ↘ 31.6 ms hösten | ||
| Skärmen visar långsamma svarsfrekvenser i våra tester och kommer att vara otillfredsställande för spelare. I jämförelse sträcker sig alla testade enheter från 0.165 (minst) till 636 (maximalt) ms. » 96 % av alla enheter är bättre. Detta innebär att den uppmätta svarstiden är sämre än genomsnittet av alla testade enheter (30.9 ms). | ||
Skärmflimmer / PWM (Puls-Width Modulation)
| Skärmflimmer / PWM upptäckt | 2500 Hz | ≤ 20 % ljusstyrka inställning | 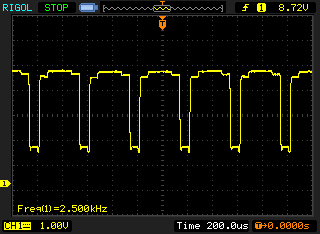 |
Displayens bakgrundsbelysning flimrar vid 2500 Hz (i värsta fall, t.ex. med PWM) Flimrande upptäckt vid en ljusstyrkeinställning på 20 % och lägre. Det ska inte finnas något flimmer eller PWM över denna ljusstyrkeinställning. Frekvensen för 2500 Hz är ganska hög, så de flesta användare som är känsliga för PWM bör inte märka något flimmer. Som jämförelse: 52 % av alla testade enheter använder inte PWM för att dämpa skärmen. Om PWM upptäcktes mättes ett medelvärde av 7744 (minst: 5 - maximum: 343500) Hz. | |||


| PCMark 8 Home Score Accelerated v2 | 3988 poäng | |
| PCMark 8 Creative Score Accelerated v2 | 5194 poäng | |
| PCMark 8 Work Score Accelerated v2 | 4832 poäng | |
| PCMark 10 Score | 4122 poäng | |
Hjälp | ||

| 3DMark 11 Performance | 2875 poäng | |
| 3DMark Ice Storm Standard Score | 60637 poäng | |
| 3DMark Cloud Gate Standard Score | 11119 poäng | |
| 3DMark Fire Strike Score | 1673 poäng | |
| 3DMark Time Spy Score | 542 poäng | |
Hjälp | ||
| låg | med. | hög | ultra | |
|---|---|---|---|---|
| BioShock Infinite (2013) | 74.3 | 46.8 | 40.4 | 14.4 |
| The Witcher 3 (2015) | 35 | 21.6 | 11.5 | |
| Dota 2 Reborn (2015) | 83.4 | 49.7 | 26.2 | 24.2 |
| X-Plane 11.11 (2018) | 21.9 | 14.7 | 14.2 | |
| F1 2019 (2019) | 43 | 17 | 15 |
Ljudnivå
| Låg belastning |
| 29.3 / 29.3 / 29.3 dB(A) |
| Hög belastning |
| 30 / 32.4 dB(A) |
 | ||
30 dB tyst 40 dB(A) hörbar 50 dB(A) högt ljud |
||
min: | ||
| Dell XPS 13 9300 i5 FHD UHD Graphics G1 (Ice Lake 32 EU), i5-1035G1, Toshiba XG6 KXG60ZNV512G | Apple MacBook Pro 13 2019 2TB3 Iris Plus Graphics 645, i5-8257U, Apple SSD AP0256 | Acer Swift 3 SF313-52-71Y7 Iris Plus Graphics G7 (Ice Lake 64 EU), i7-1065G7, Intel SSD 660p 1TB SSDPEKNW010T8 | Lenovo ThinkPad X390-20Q1S02M00 UHD Graphics 620, i5-8265U, Intel SSD Pro 7600p SSDPEKKF512G8L | Dell XPS 13 9380 2019 UHD Graphics 620, i5-8265U, SK hynix PC401 HFS256GD9TNG | Dell XPS 13 7390 2-in-1 Core i7 Iris Plus Graphics G7 (Ice Lake 64 EU), i7-1065G7, Toshiba BG4 KBG40ZPZ512G | |
|---|---|---|---|---|---|---|
| Noise | -5% | -3% | -4% | -7% | -4% | |
| av / miljö * (dB) | 29.3 | 29.5 -1% | 30.3 -3% | 29.2 -0% | 30.4 -4% | 28.1 4% |
| Idle Minimum * (dB) | 29.3 | 29.5 -1% | 30.3 -3% | 29.2 -0% | 30.4 -4% | 28.1 4% |
| Idle Average * (dB) | 29.3 | 29.5 -1% | 30.3 -3% | 29.2 -0% | 30.4 -4% | 28.1 4% |
| Idle Maximum * (dB) | 29.3 | 29.5 -1% | 30.3 -3% | 29.2 -0% | 30.4 -4% | 28.1 4% |
| Load Average * (dB) | 30 | 31.1 -4% | 31.7 -6% | 34.8 -16% | 31.7 -6% | 31.7 -6% |
| Load Maximum * (dB) | 32.4 | 39.3 -21% | 32.7 -1% | 34.8 -7% | 38.1 -18% | 43.4 -34% |
| Witcher 3 ultra * (dB) | 43.4 |
* ... mindre är bättre
(-) Den maximala temperaturen på ovansidan är 50.8 °C / 123 F, jämfört med genomsnittet av 35.9 °C / 97 F , allt från 21.4 till 59 °C för klassen Subnotebook.
(±) Botten värms upp till maximalt 42.2 °C / 108 F, jämfört med genomsnittet av 39.2 °C / 103 F
(+) Vid tomgångsbruk är medeltemperaturen för ovansidan 23.6 °C / 74 F, jämfört med enhetsgenomsnittet på 30.8 °C / ### class_avg_f### F.
(+) Handledsstöden och pekplattan är kallare än hudtemperaturen med maximalt 30.1 °C / 86.2 F och är därför svala att ta på.
(±) Medeltemperaturen för handledsstödsområdet på liknande enheter var 28.2 °C / 82.8 F (-1.9 °C / -3.4 F).
Dell XPS 13 9300 i5 FHD ljudanalys
(±) | högtalarljudstyrkan är genomsnittlig men bra (78.4 dB)
Bas 100 - 315 Hz
(±) | reducerad bas - i genomsnitt 9.4% lägre än medianen
(±) | linjäriteten för basen är genomsnittlig (12.5% delta till föregående frekvens)
Mellan 400 - 2000 Hz
(±) | högre mellan - i genomsnitt 6.7% högre än median
(+) | mids är linjära (5.6% delta till föregående frekvens)
Högsta 2 - 16 kHz
(+) | balanserade toppar - endast 4% från medianen
(+) | toppar är linjära (5% delta till föregående frekvens)
Totalt 100 - 16 000 Hz
(±) | linjäriteten för det totala ljudet är genomsnittlig (19.8% skillnad mot median)
Jämfört med samma klass
» 63% av alla testade enheter i den här klassen var bättre, 7% liknande, 31% sämre
» Den bästa hade ett delta på 5%, genomsnittet var 18%, sämst var 53%
Jämfört med alla testade enheter
» 51% av alla testade enheter var bättre, 7% liknande, 42% sämre
» Den bästa hade ett delta på 4%, genomsnittet var 23%, sämst var 134%
Apple MacBook Pro 13 2019 2TB3 ljudanalys
(±) | högtalarljudstyrkan är genomsnittlig men bra (79.1 dB)
Bas 100 - 315 Hz
(±) | reducerad bas - i genomsnitt 10.7% lägre än medianen
(±) | linjäriteten för basen är genomsnittlig (8.7% delta till föregående frekvens)
Mellan 400 - 2000 Hz
(+) | balanserad mellan - endast 4.6% från medianen
(+) | mids är linjära (3.8% delta till föregående frekvens)
Högsta 2 - 16 kHz
(+) | balanserade toppar - endast 2.3% från medianen
(+) | toppar är linjära (4.7% delta till föregående frekvens)
Totalt 100 - 16 000 Hz
(±) | linjäriteten för det totala ljudet är genomsnittlig (15.6% skillnad mot median)
Jämfört med samma klass
» 36% av alla testade enheter i den här klassen var bättre, 5% liknande, 58% sämre
» Den bästa hade ett delta på 5%, genomsnittet var 18%, sämst var 53%
Jämfört med alla testade enheter
» 24% av alla testade enheter var bättre, 5% liknande, 72% sämre
» Den bästa hade ett delta på 4%, genomsnittet var 23%, sämst var 134%
| Av/Standby | |
| Låg belastning | |
| Hög belastning |
|
Förklaring:
min: | |
| Dell XPS 13 9300 i5 FHD i5-1035G1, UHD Graphics G1 (Ice Lake 32 EU), Toshiba XG6 KXG60ZNV512G, IPS, 1920x1200, 13.4" | Apple MacBook Pro 13 2019 2TB3 i5-8257U, Iris Plus Graphics 645, Apple SSD AP0256, IPS, 2560x1600, 13.3" | Acer Swift 3 SF313-52-71Y7 i7-1065G7, Iris Plus Graphics G7 (Ice Lake 64 EU), Intel SSD 660p 1TB SSDPEKNW010T8, IPS, 2256x1504, 13.5" | Lenovo ThinkPad X390-20Q1S02M00 i5-8265U, UHD Graphics 620, Intel SSD Pro 7600p SSDPEKKF512G8L, IPS LED, 1920x1080, 13.3" | Dell XPS 13 9380 2019 i5-8265U, UHD Graphics 620, SK hynix PC401 HFS256GD9TNG, IPS, 3840x2160, 13.3" | Dell XPS 13 7390 2-in-1 Core i7 i7-1065G7, Iris Plus Graphics G7 (Ice Lake 64 EU), Toshiba BG4 KBG40ZPZ512G, IPS, 1920x1200, 13.4" | Genomsnitt Intel UHD Graphics G1 (Ice Lake 32 EU) | Genomsnitt av klass Subnotebook | |
|---|---|---|---|---|---|---|---|---|
| Power Consumption | 0% | 36% | -6% | -18% | 10% | 1% | -9% | |
| Idle Minimum * (Watt) | 3.4 | 2.1 38% | 1.8 47% | 3.4 -0% | 4.8 -41% | 2.6 24% | 4.13 ? -21% | 3.73 ? -10% |
| Idle Average * (Watt) | 6 | 6.9 -15% | 4.6 23% | 5.6 7% | 8.6 -43% | 5.3 12% | 7.07 ? -18% | 6.57 ? -10% |
| Idle Maximum * (Watt) | 10.2 | 7.8 24% | 6.1 40% | 8.7 15% | 10.4 -2% | 7 31% | 8.36 ? 18% | 7.93 ? 22% |
| Load Average * (Watt) | 36.6 | 42 -15% | 27.4 25% | 43.6 -19% | 37.9 -4% | 43.1 -18% | 30.6 ? 16% | 42.1 ? -15% |
| Load Maximum * (Watt) | 49.3 | 64.5 -31% | 27 45% | 65 -32% | 48.5 2% | 49 1% | 45.6 ? 8% | 65.1 ? -32% |
| Witcher 3 ultra * (Watt) | 43.1 |
* ... mindre är bättre
| Dell XPS 13 9300 i5 FHD i5-1035G1, UHD Graphics G1 (Ice Lake 32 EU), 52 Wh | Apple MacBook Pro 13 2019 2TB3 i5-8257U, Iris Plus Graphics 645, 58.2 Wh | Acer Swift 3 SF313-52-71Y7 i7-1065G7, Iris Plus Graphics G7 (Ice Lake 64 EU), 54.5 Wh | Lenovo ThinkPad X390-20Q1S02M00 i5-8265U, UHD Graphics 620, 48 Wh | Dell XPS 13 9380 2019 i5-8265U, UHD Graphics 620, 52 Wh | Dell XPS 13 7390 2-in-1 Core i7 i7-1065G7, Iris Plus Graphics G7 (Ice Lake 64 EU), 51 Wh | Genomsnitt av klass Subnotebook | |
|---|---|---|---|---|---|---|---|
| Batteridrifttid | 11% | -24% | -31% | -29% | -23% | -5% | |
| H.264 (h) | 14.4 | 10.5 -27% | 12.7 -12% | 15.3 ? 6% | |||
| WiFi v1.3 (h) | 11.7 | 13 11% | 10.3 -12% | 8.3 -29% | 8.3 -29% | 9 -23% | 13.9 ? 19% |
| Load (h) | 3.4 | 2.3 -32% | 1.6 -53% | 2.4 -29% | 2.04 ? -40% | ||
| Reader / Idle (h) | 21.4 | 17.2 | 26.4 ? |
För
Emot
Omdöme – XPS 13 9300 är totalt sett bättre än tidigare, men också dyrare
Läs den fullständiga versionen av den här recensionen på engelska här.
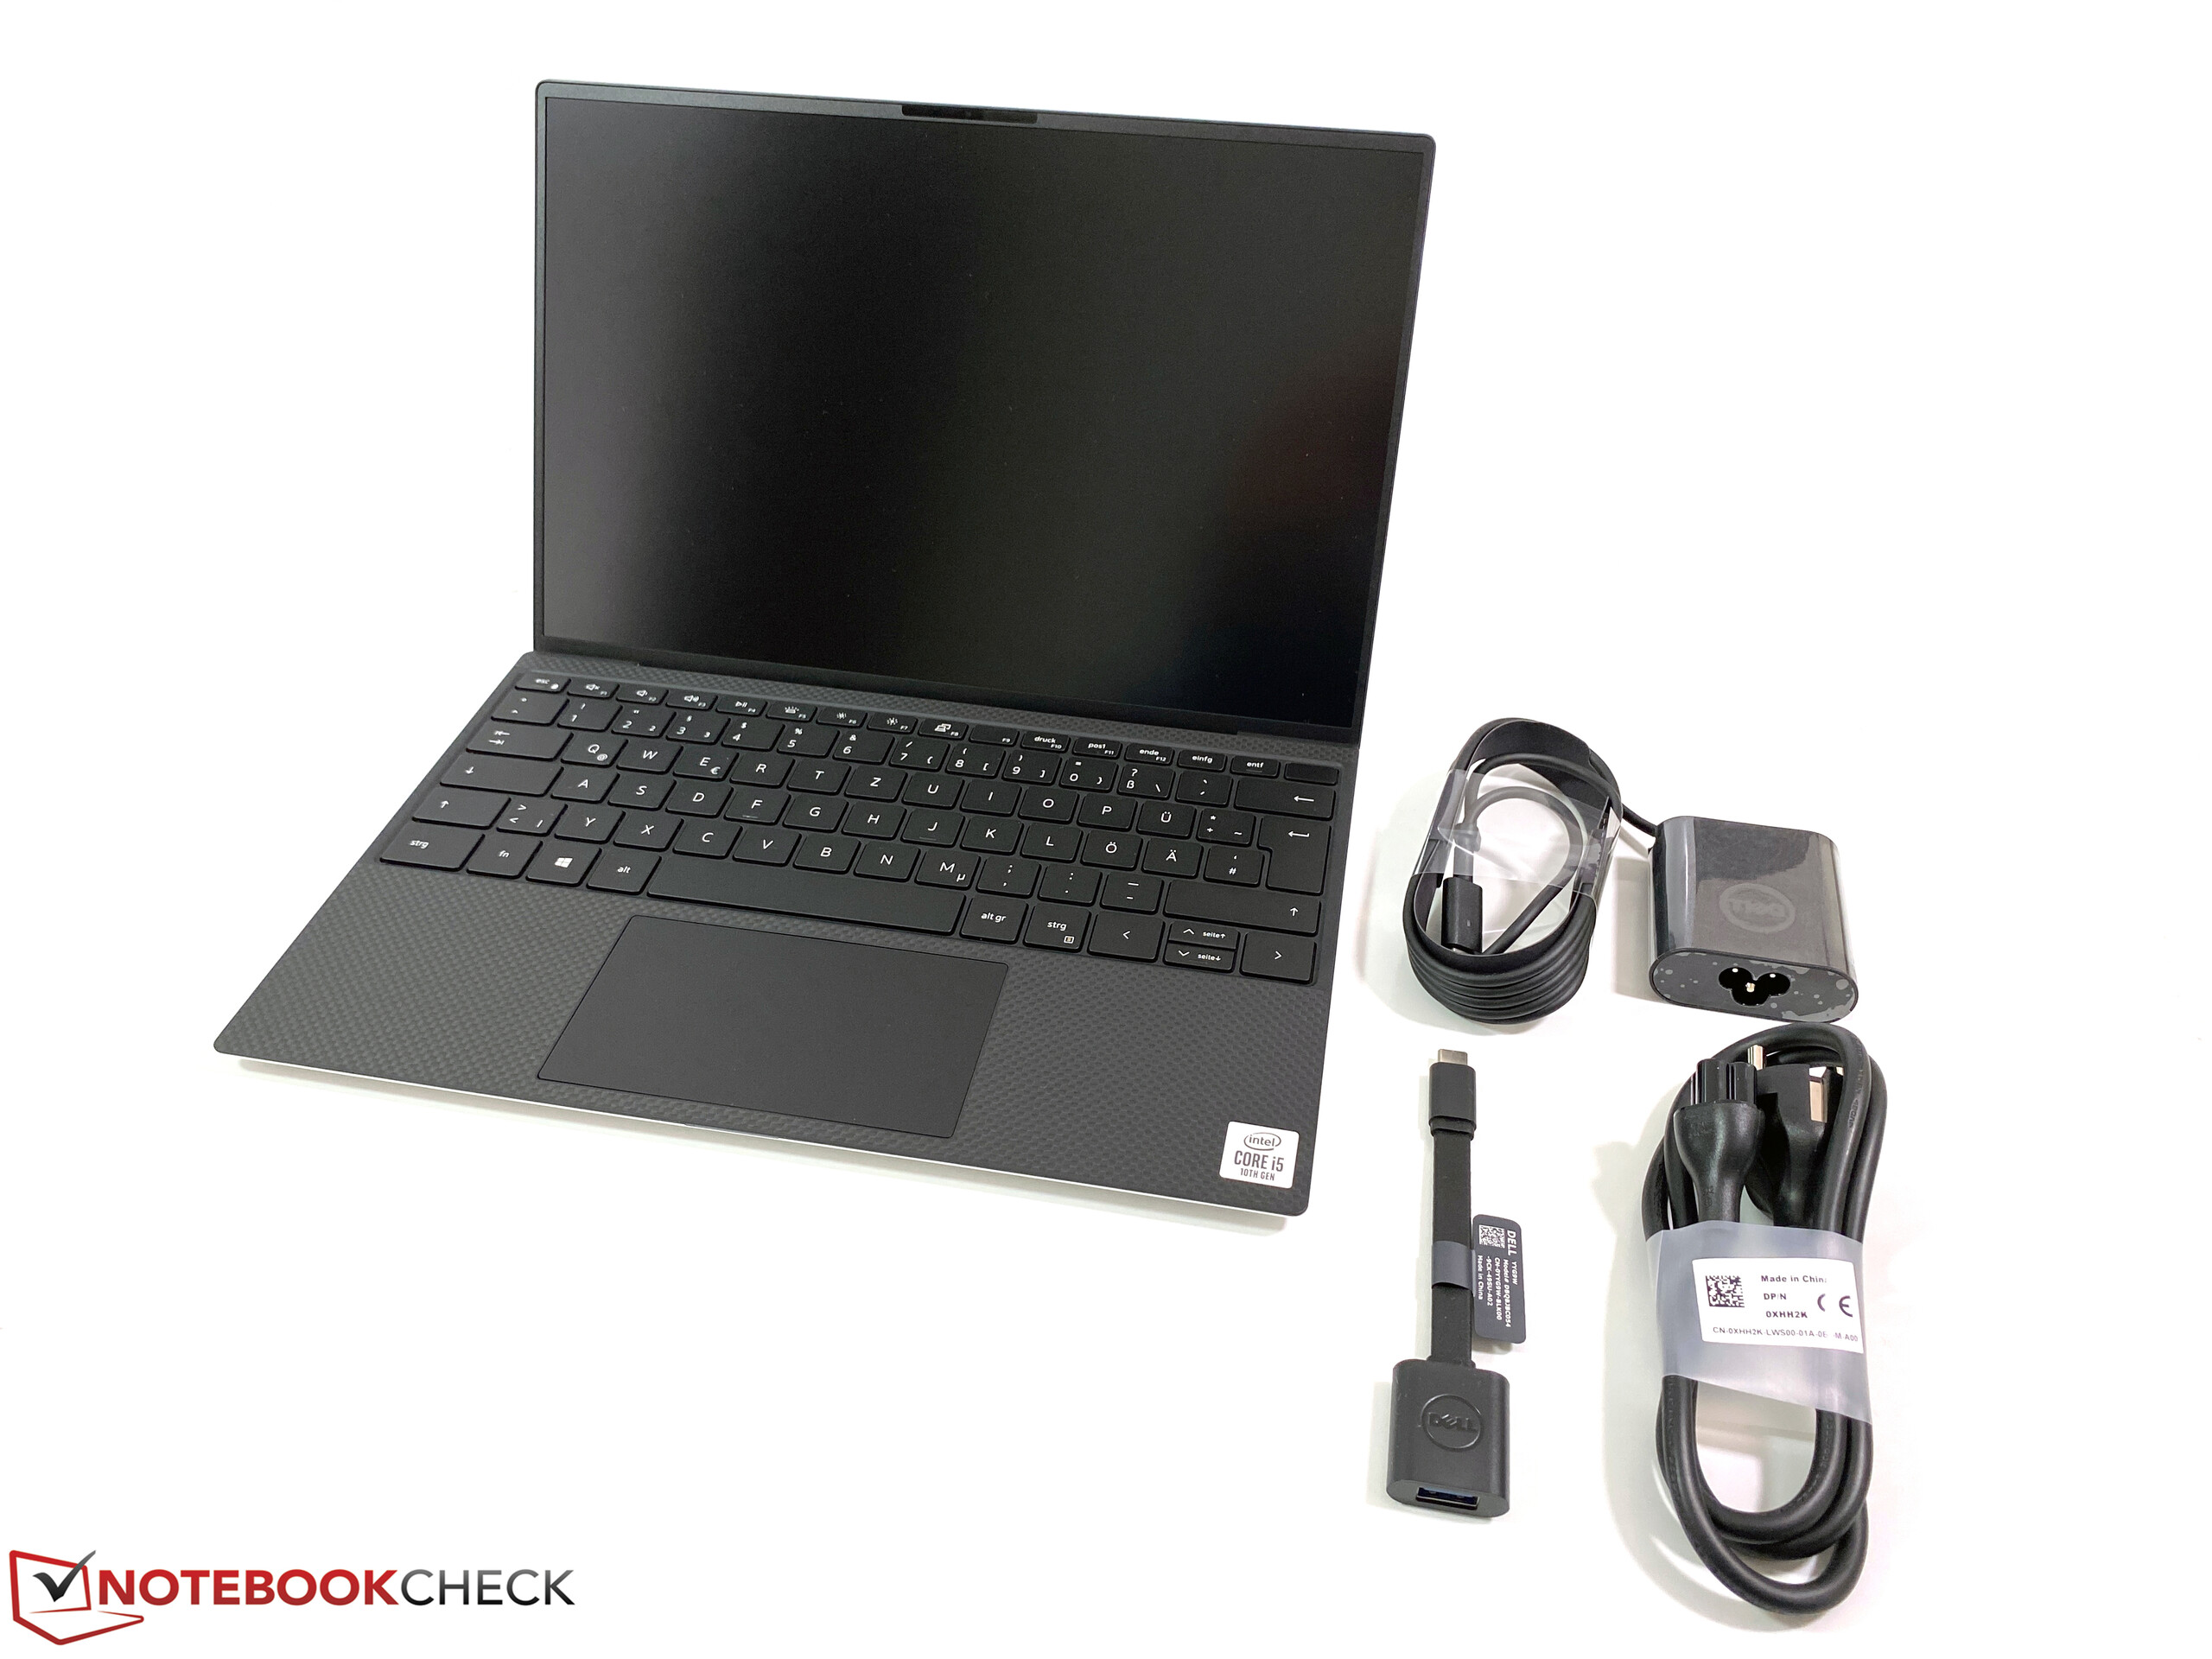
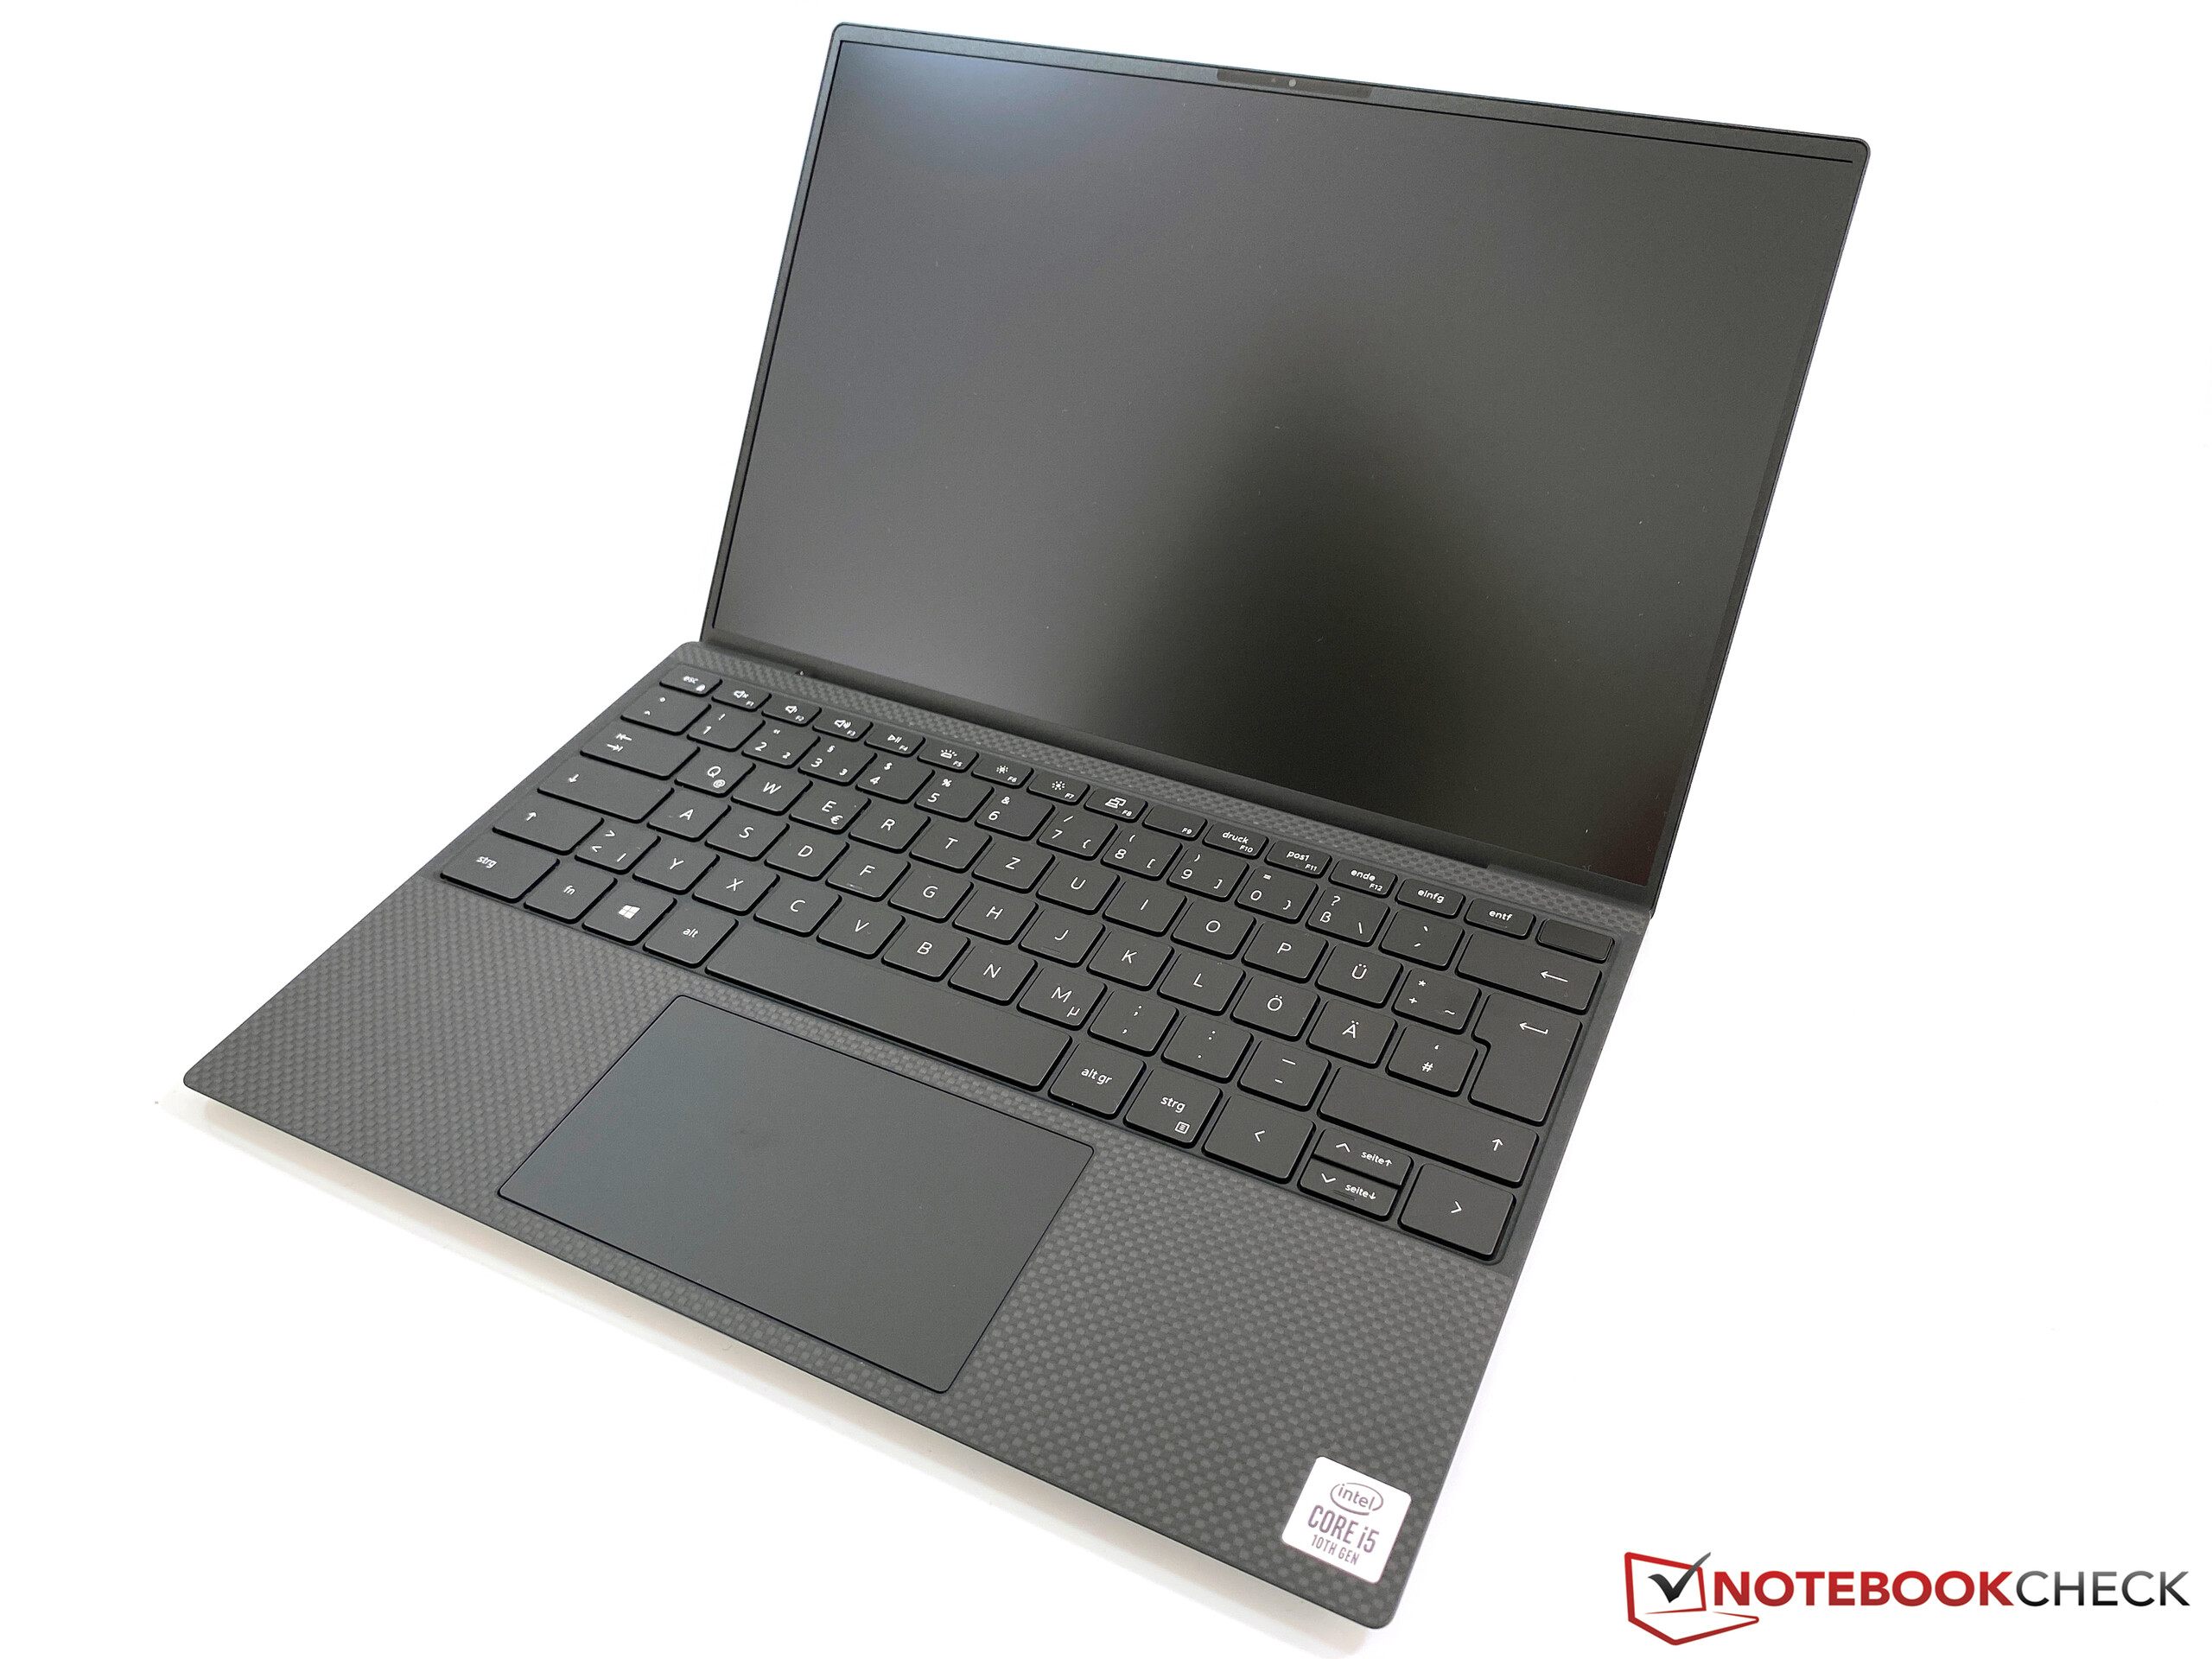
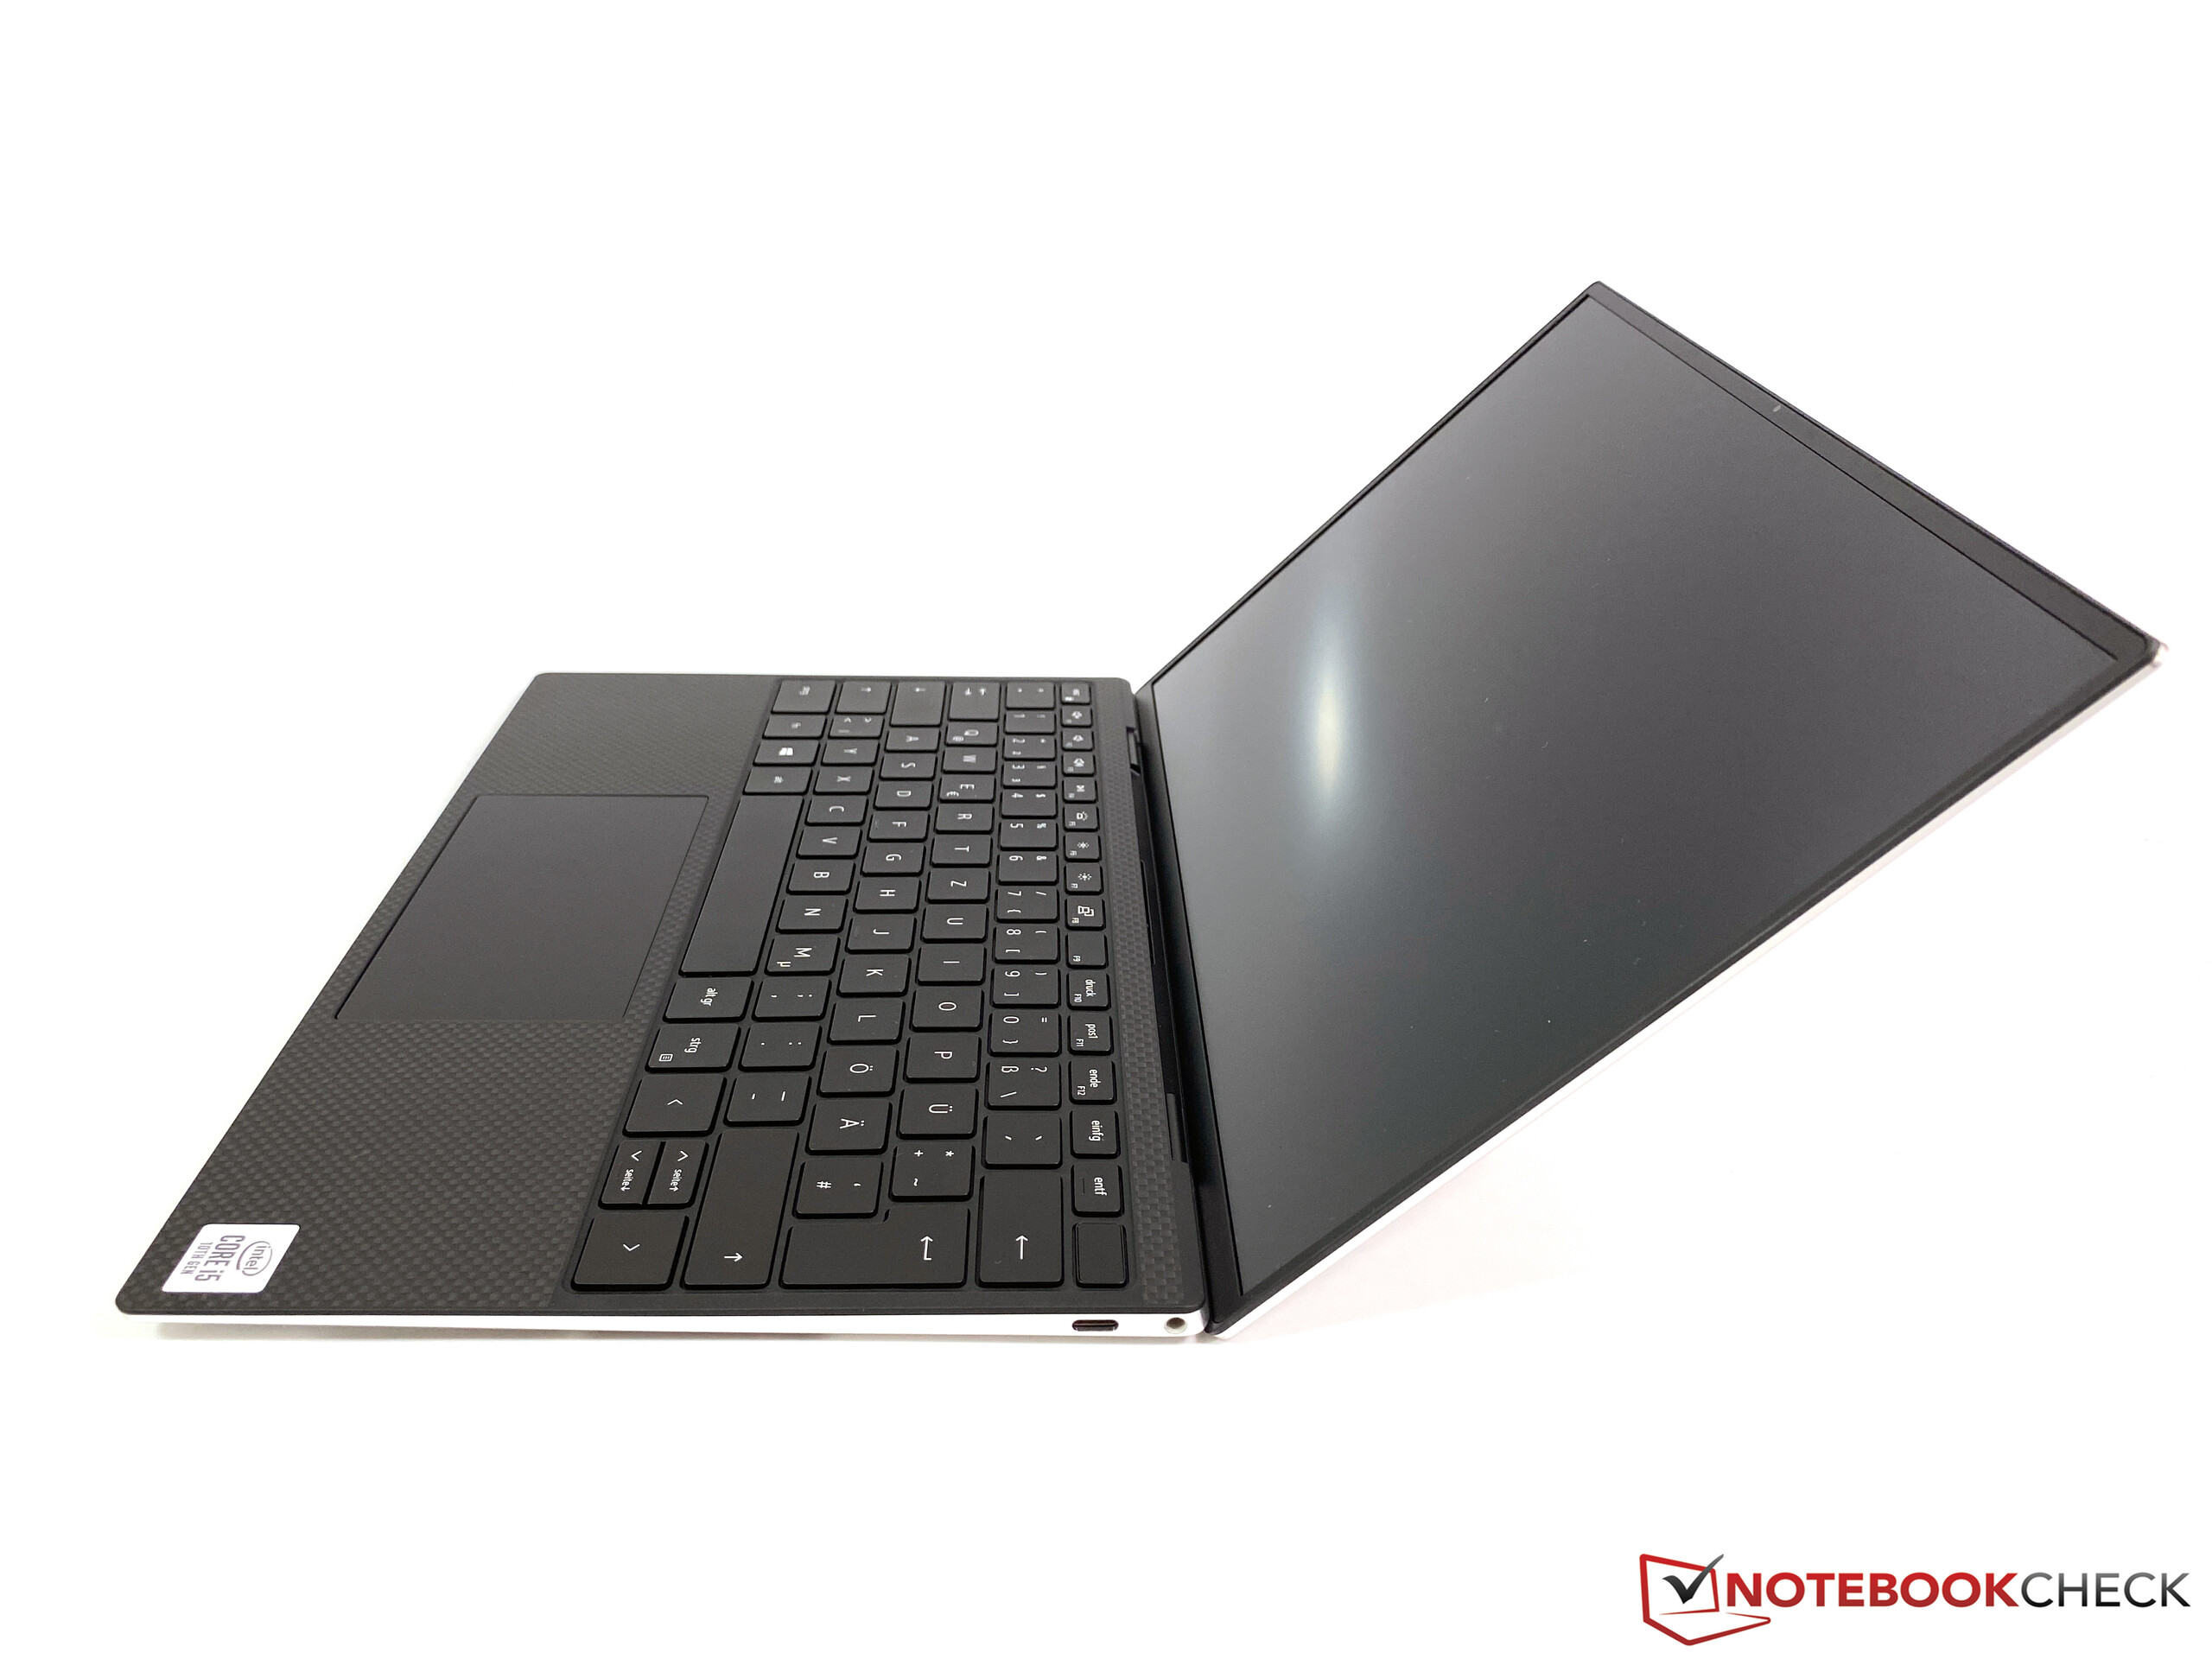
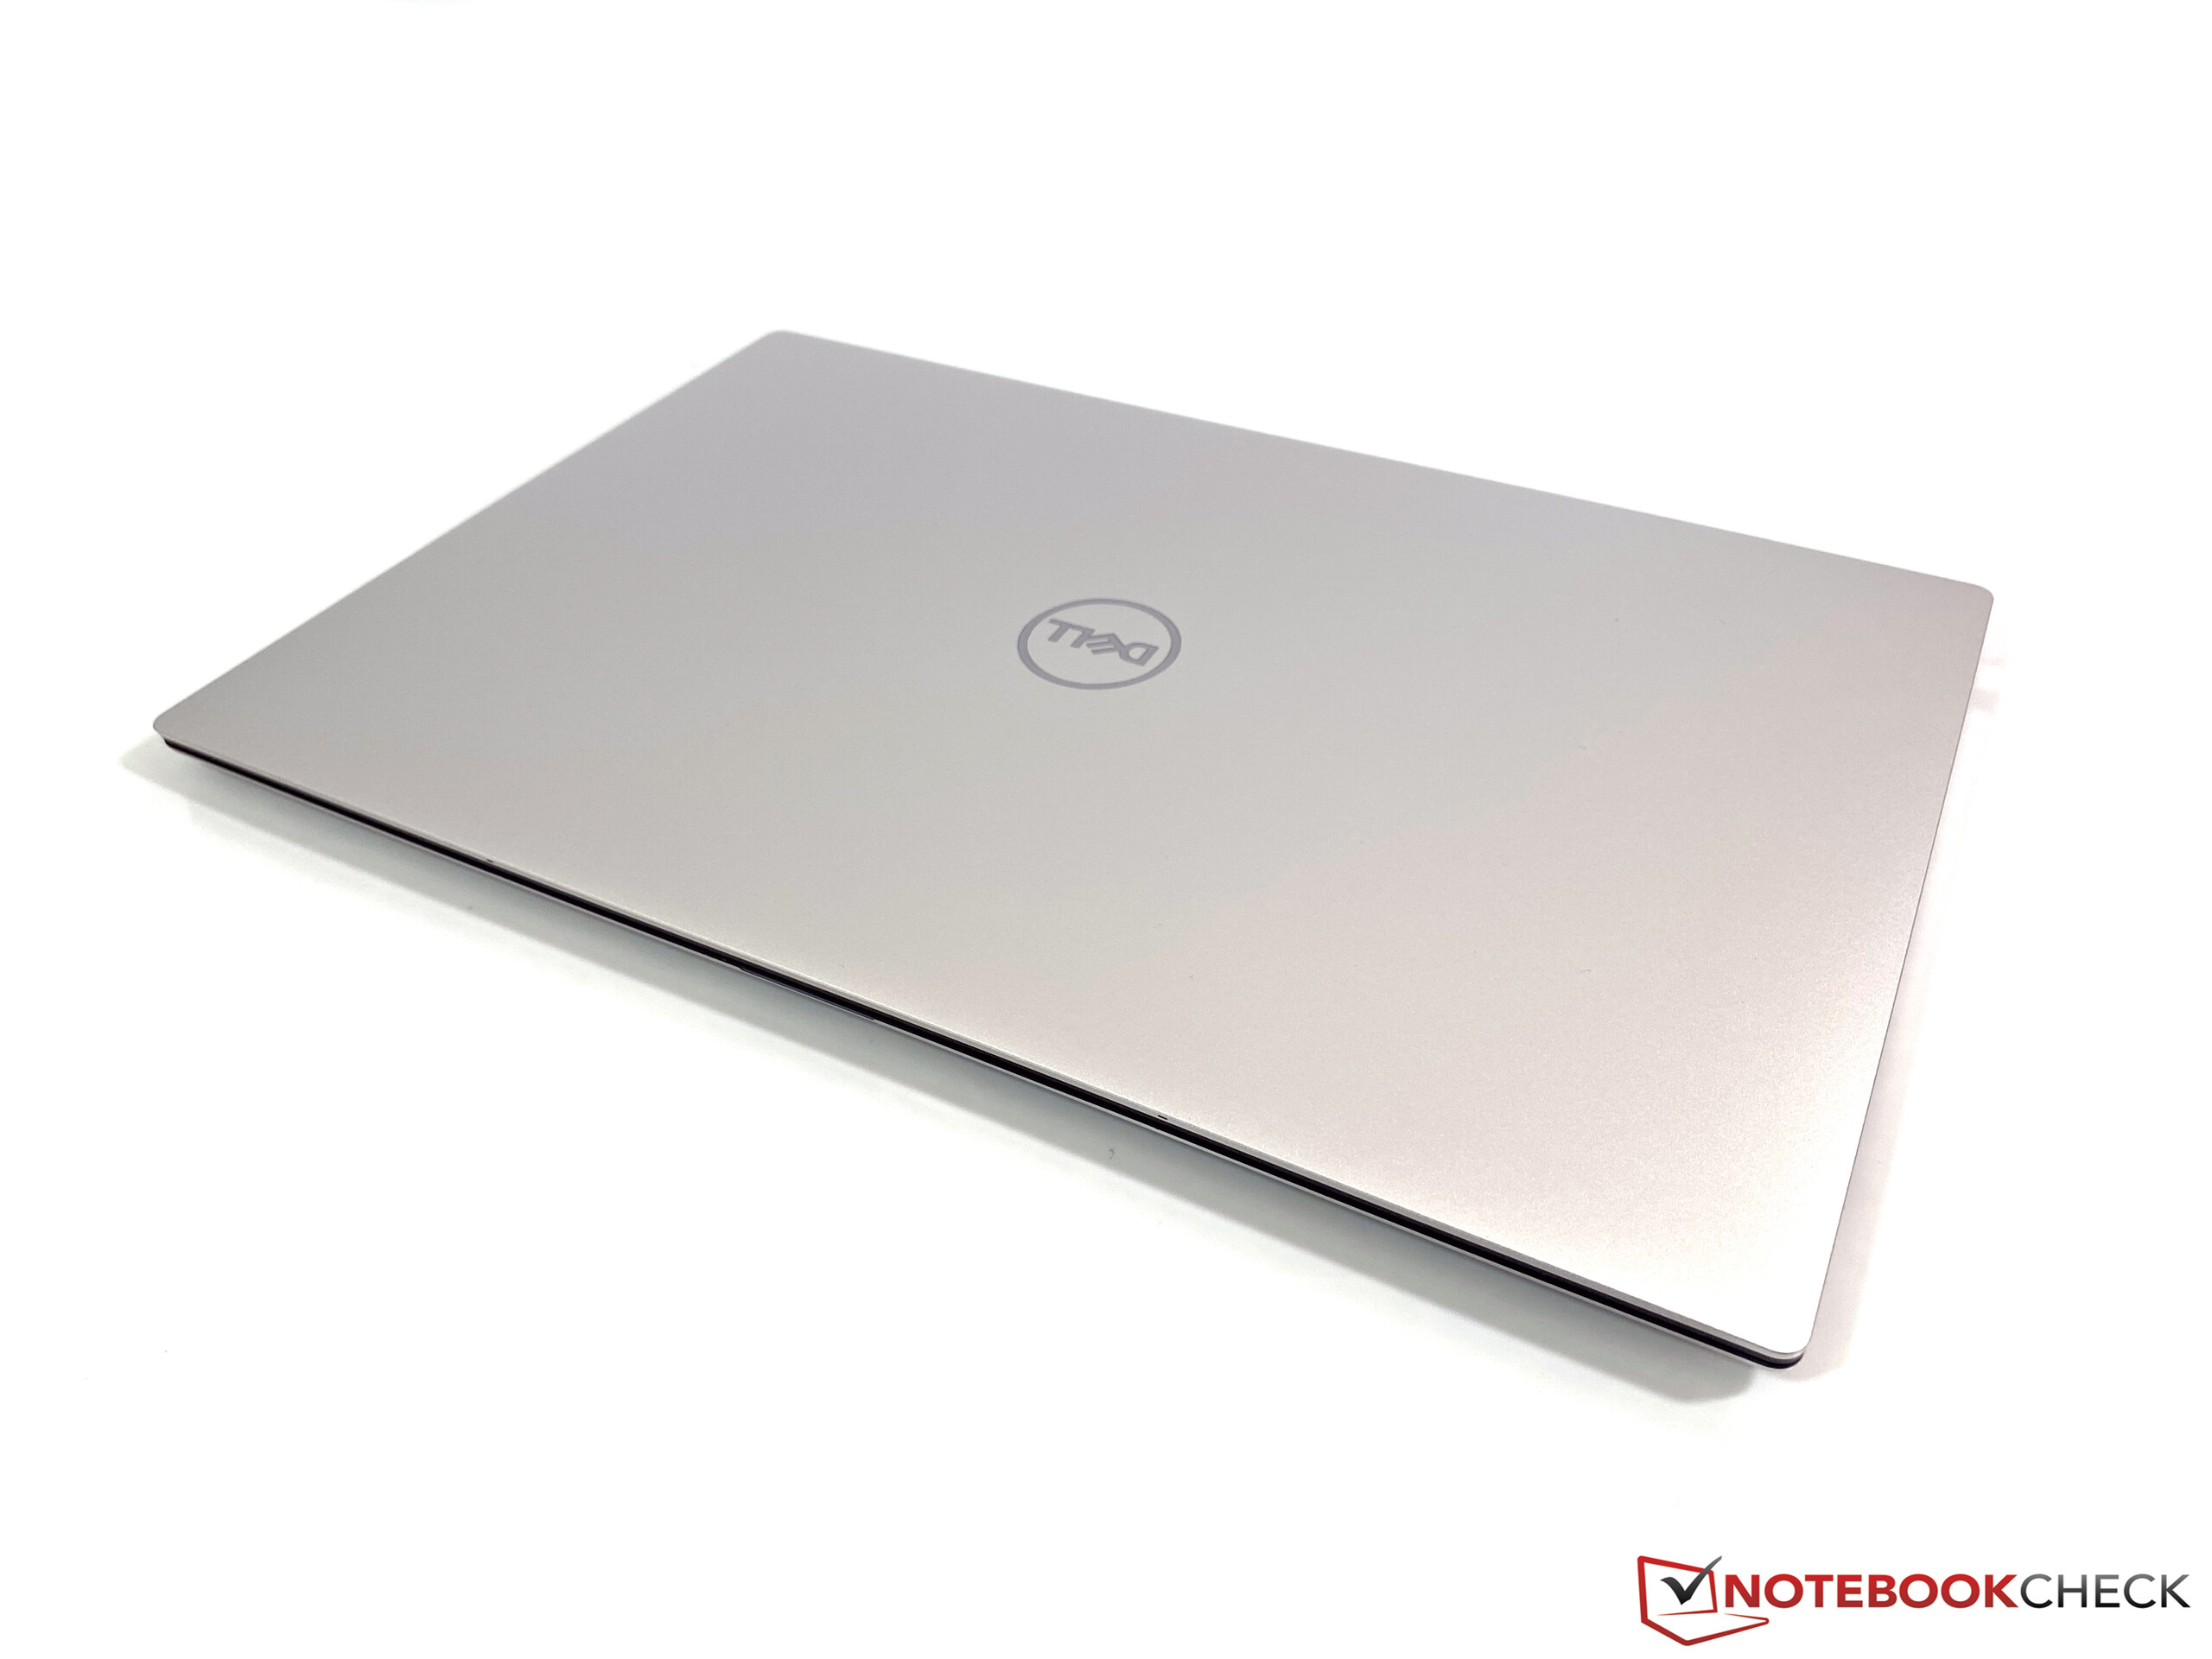
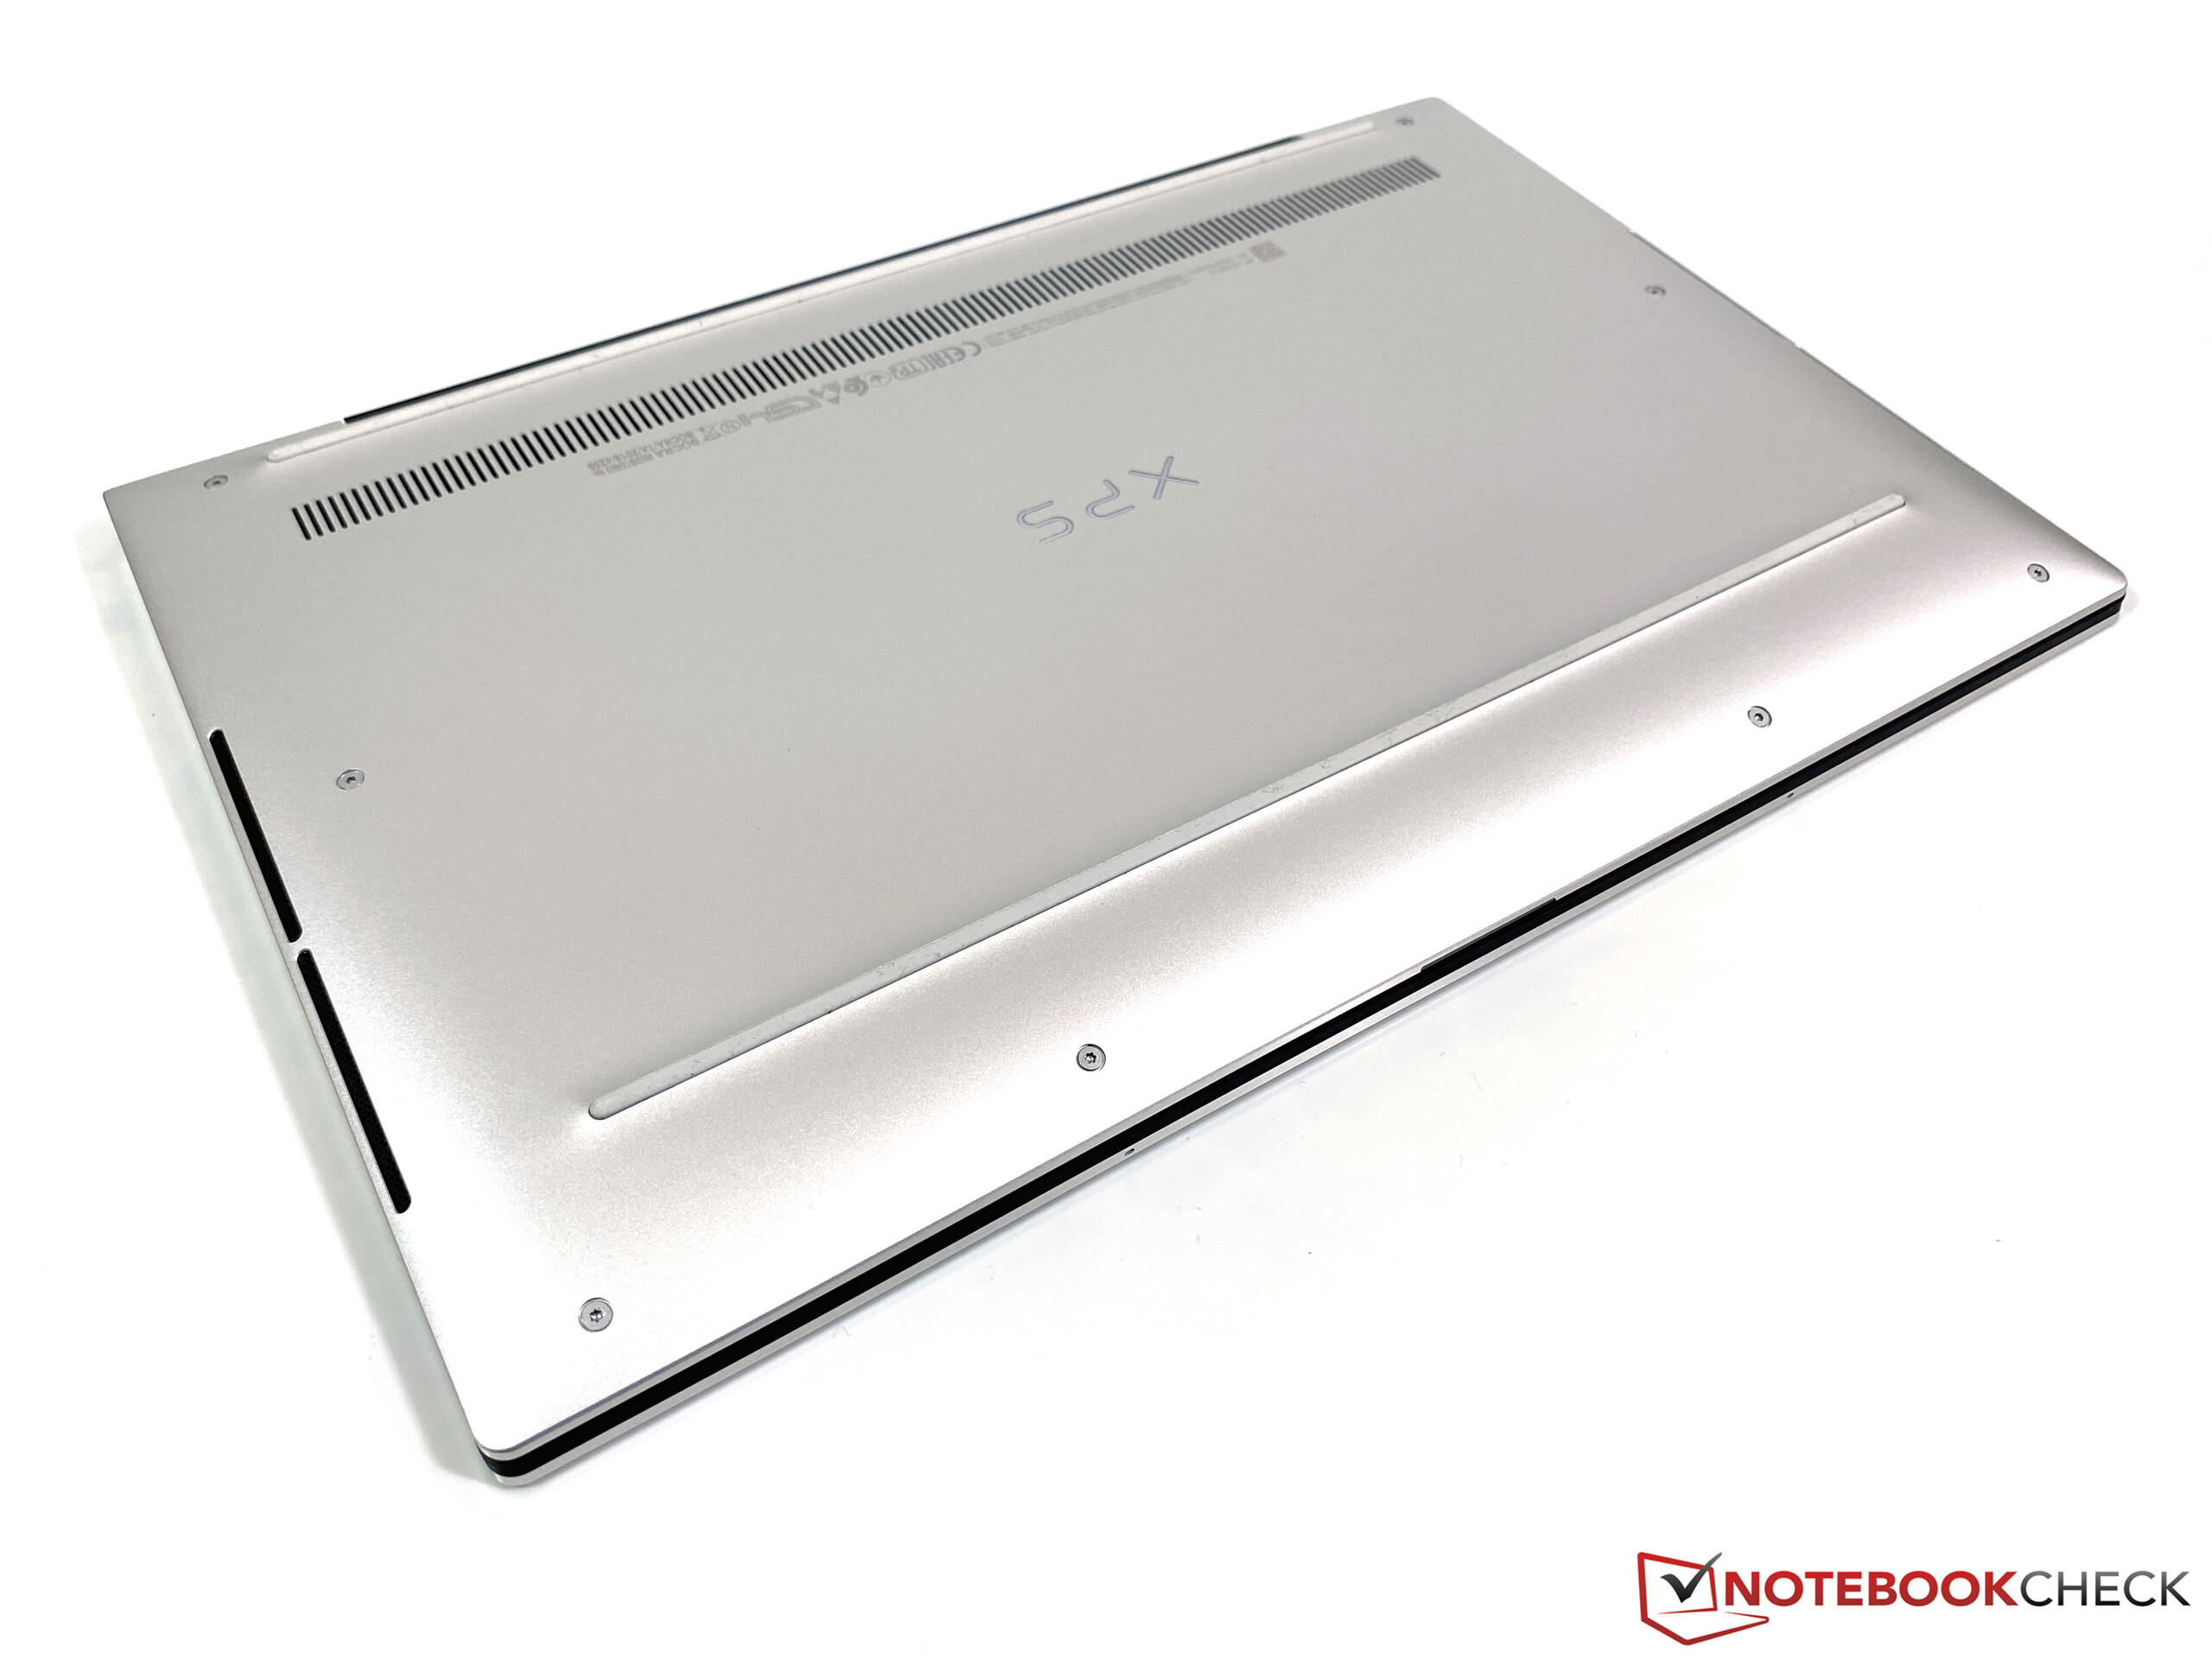
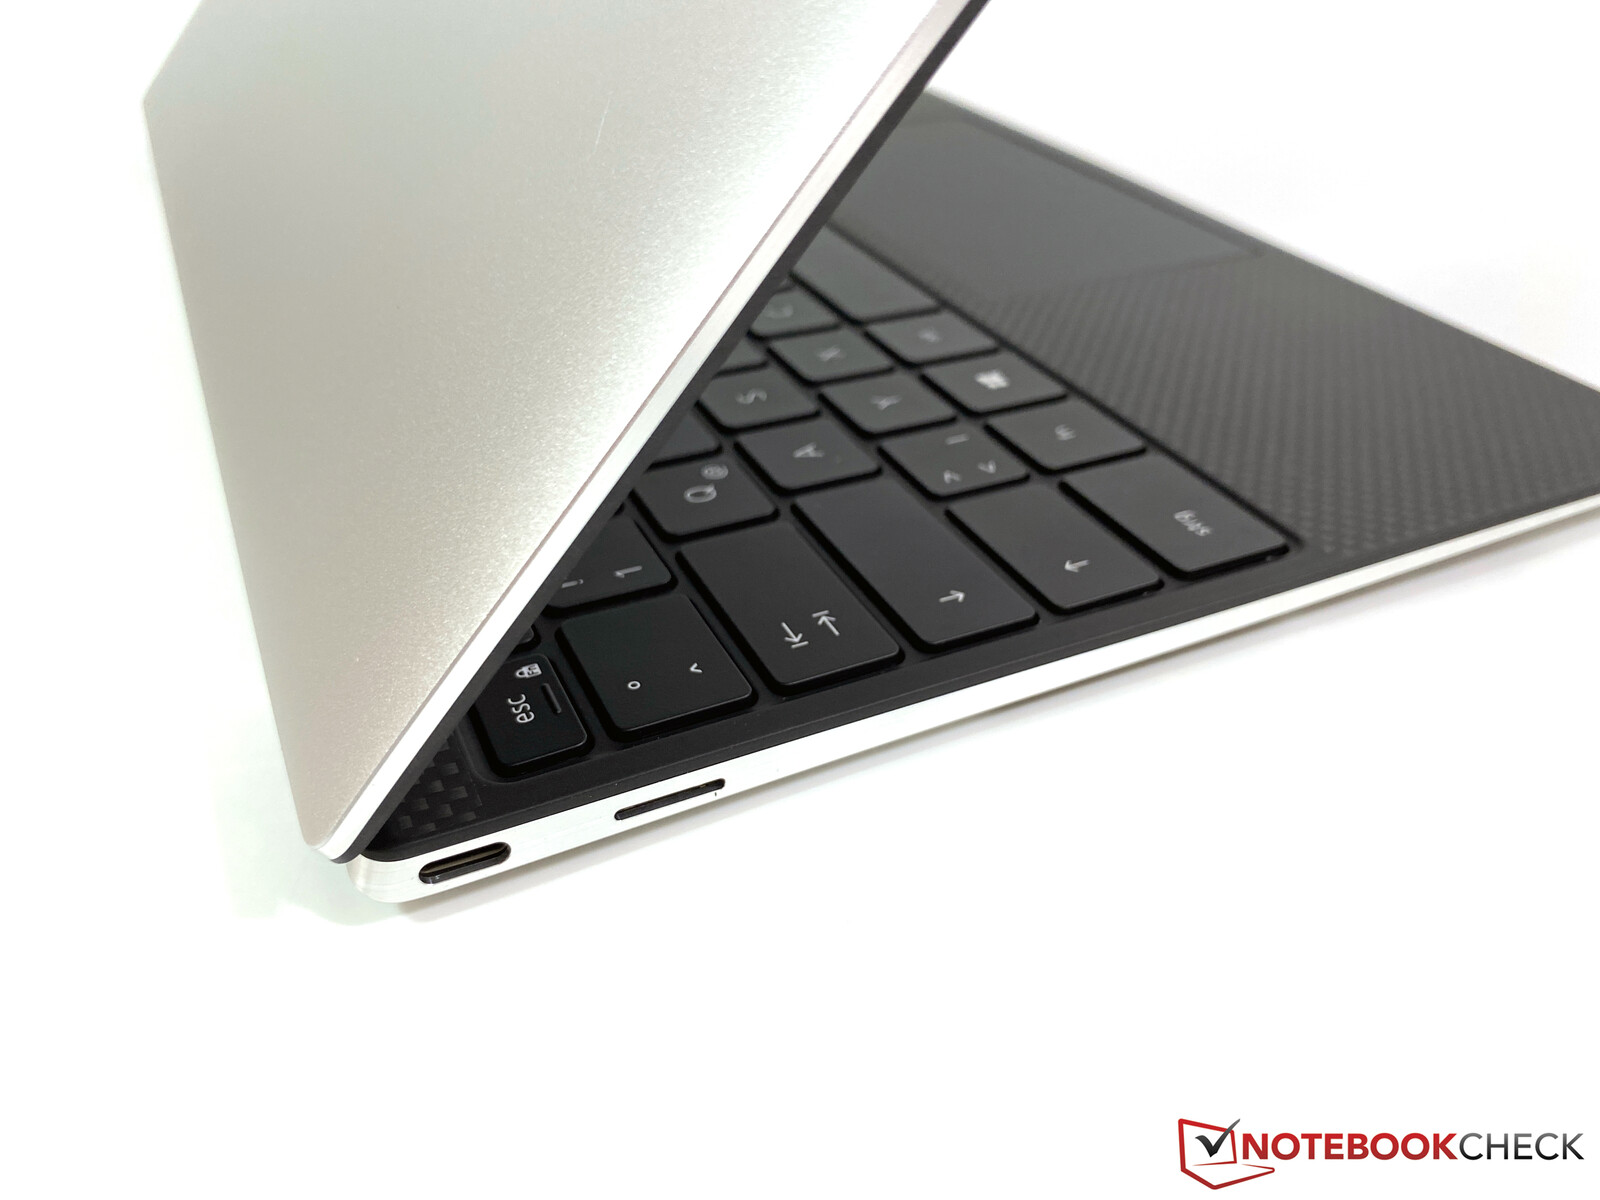
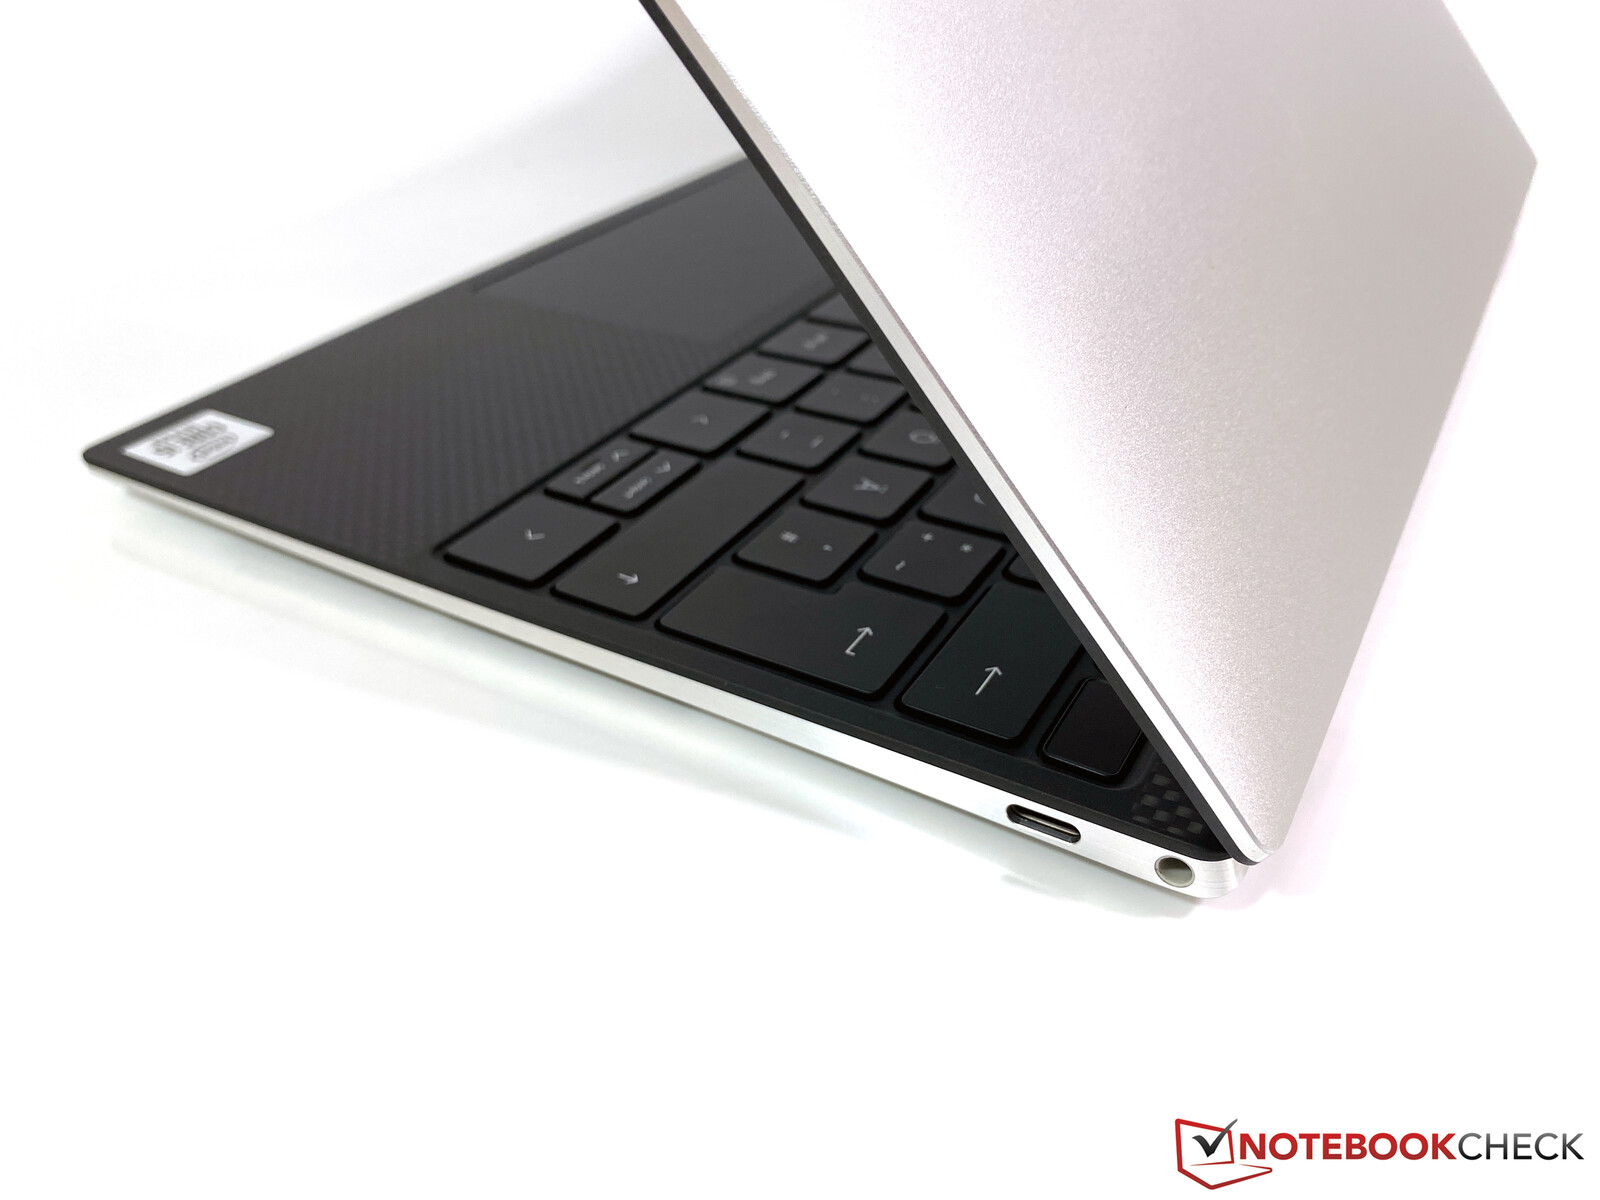
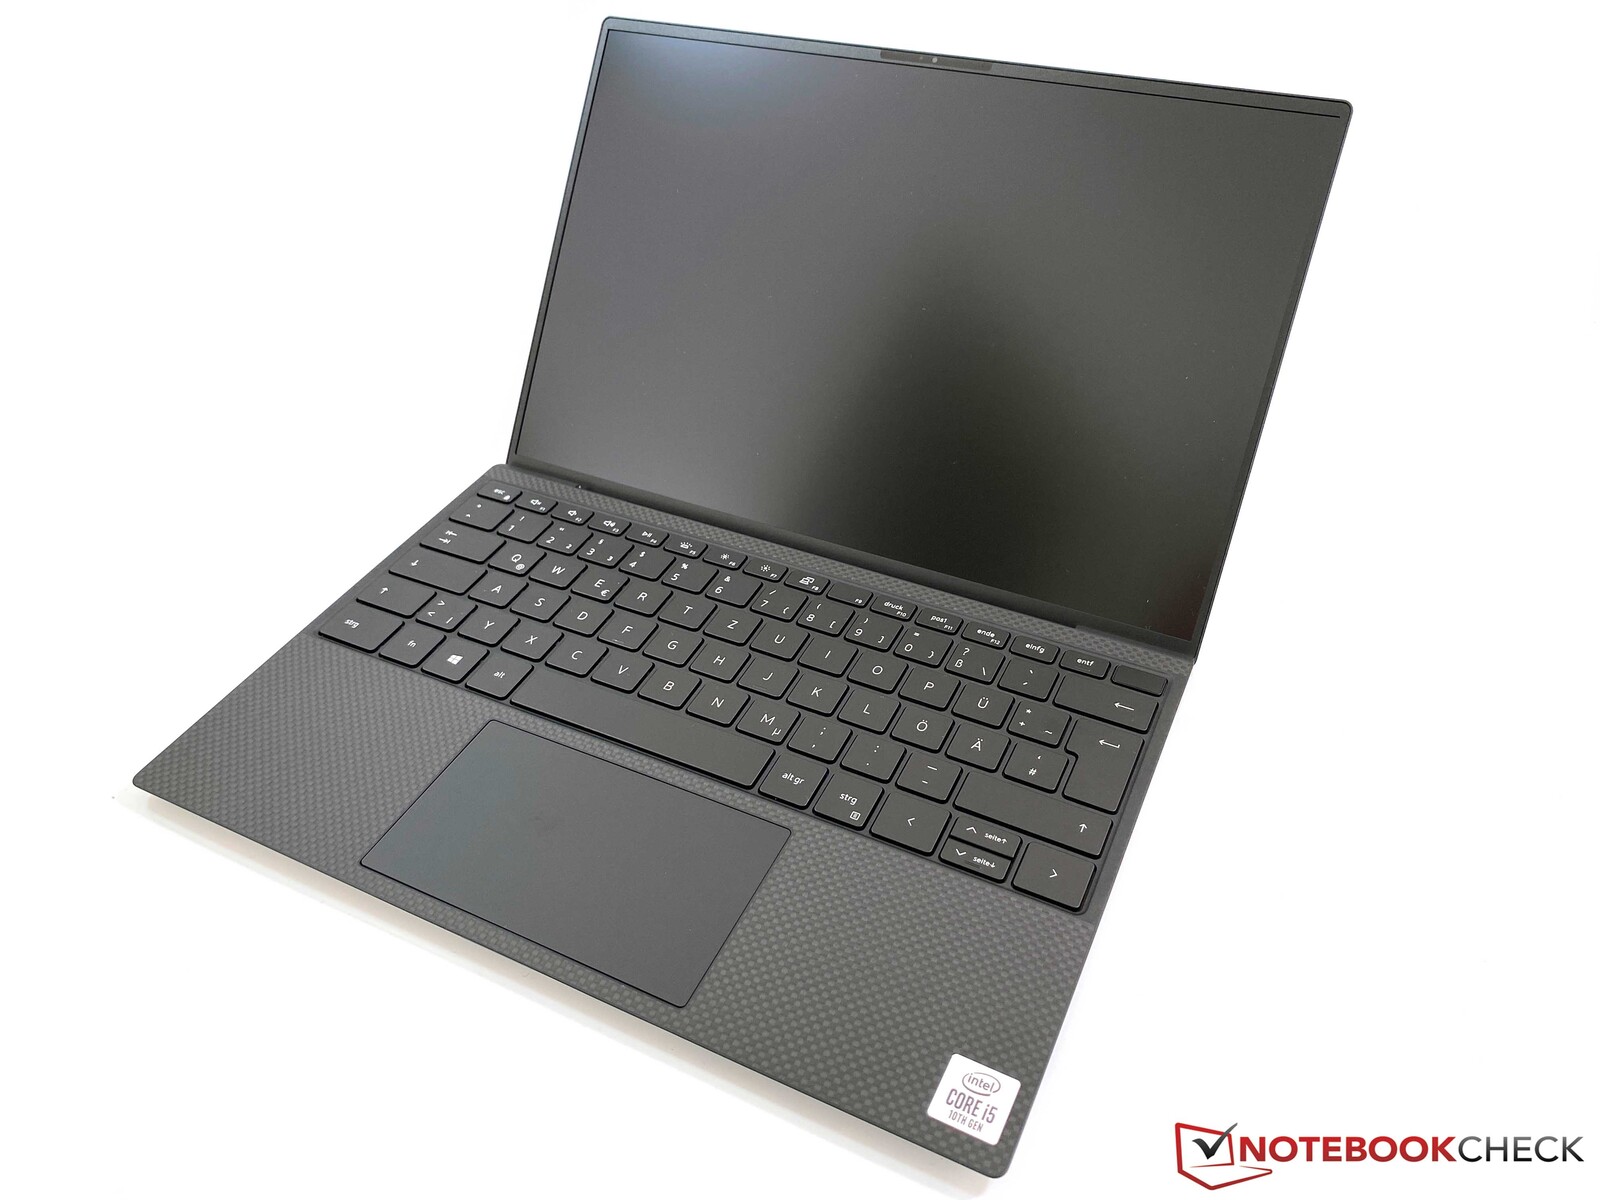
Nya XPS 13 9300 lämnade ett riktigt gott intryck i vår recension. Höljet är välbyggt och extremt kompakt samtidigt som det är robust. Den matta 16:10-skärmen övertygade oss med undantag för de långsamma responstiderna. Vi rekommenderar dock att kalibrera den. De två högtalarna var också fullt tillräckliga.
Prestandan är ett tveeggat svärd, för CPU-prestandan är lägre än på föregångaren. Det är förstås inte en optimal utveckling, men i rättvisans namn så kommer prestandan från dess Core i5 vara mer än tillräcklig för många användare, särskilt i kombination med en snabb SSD. Det integrerade grafikkortets prestanda har dessutom ökat, så det går att spela en del spel. Detta för oss till den Core i7-processor som finns som tillval och som har en ännu snabbare iGPU. Det borde inte vara någon skillnad i fråga om ren CPU-prestanda, men grafikkortet är en betydande uppgradering som är värd en titt.
Dells nya XPS 13 9300 är en riktigt bra efterföljare till denna populära subnotebook. Vi upptäckte inga allvarliga brister i vår recension, men den nya modellen är inte direkt ett kap med sitt pris på 15.000 kronor.
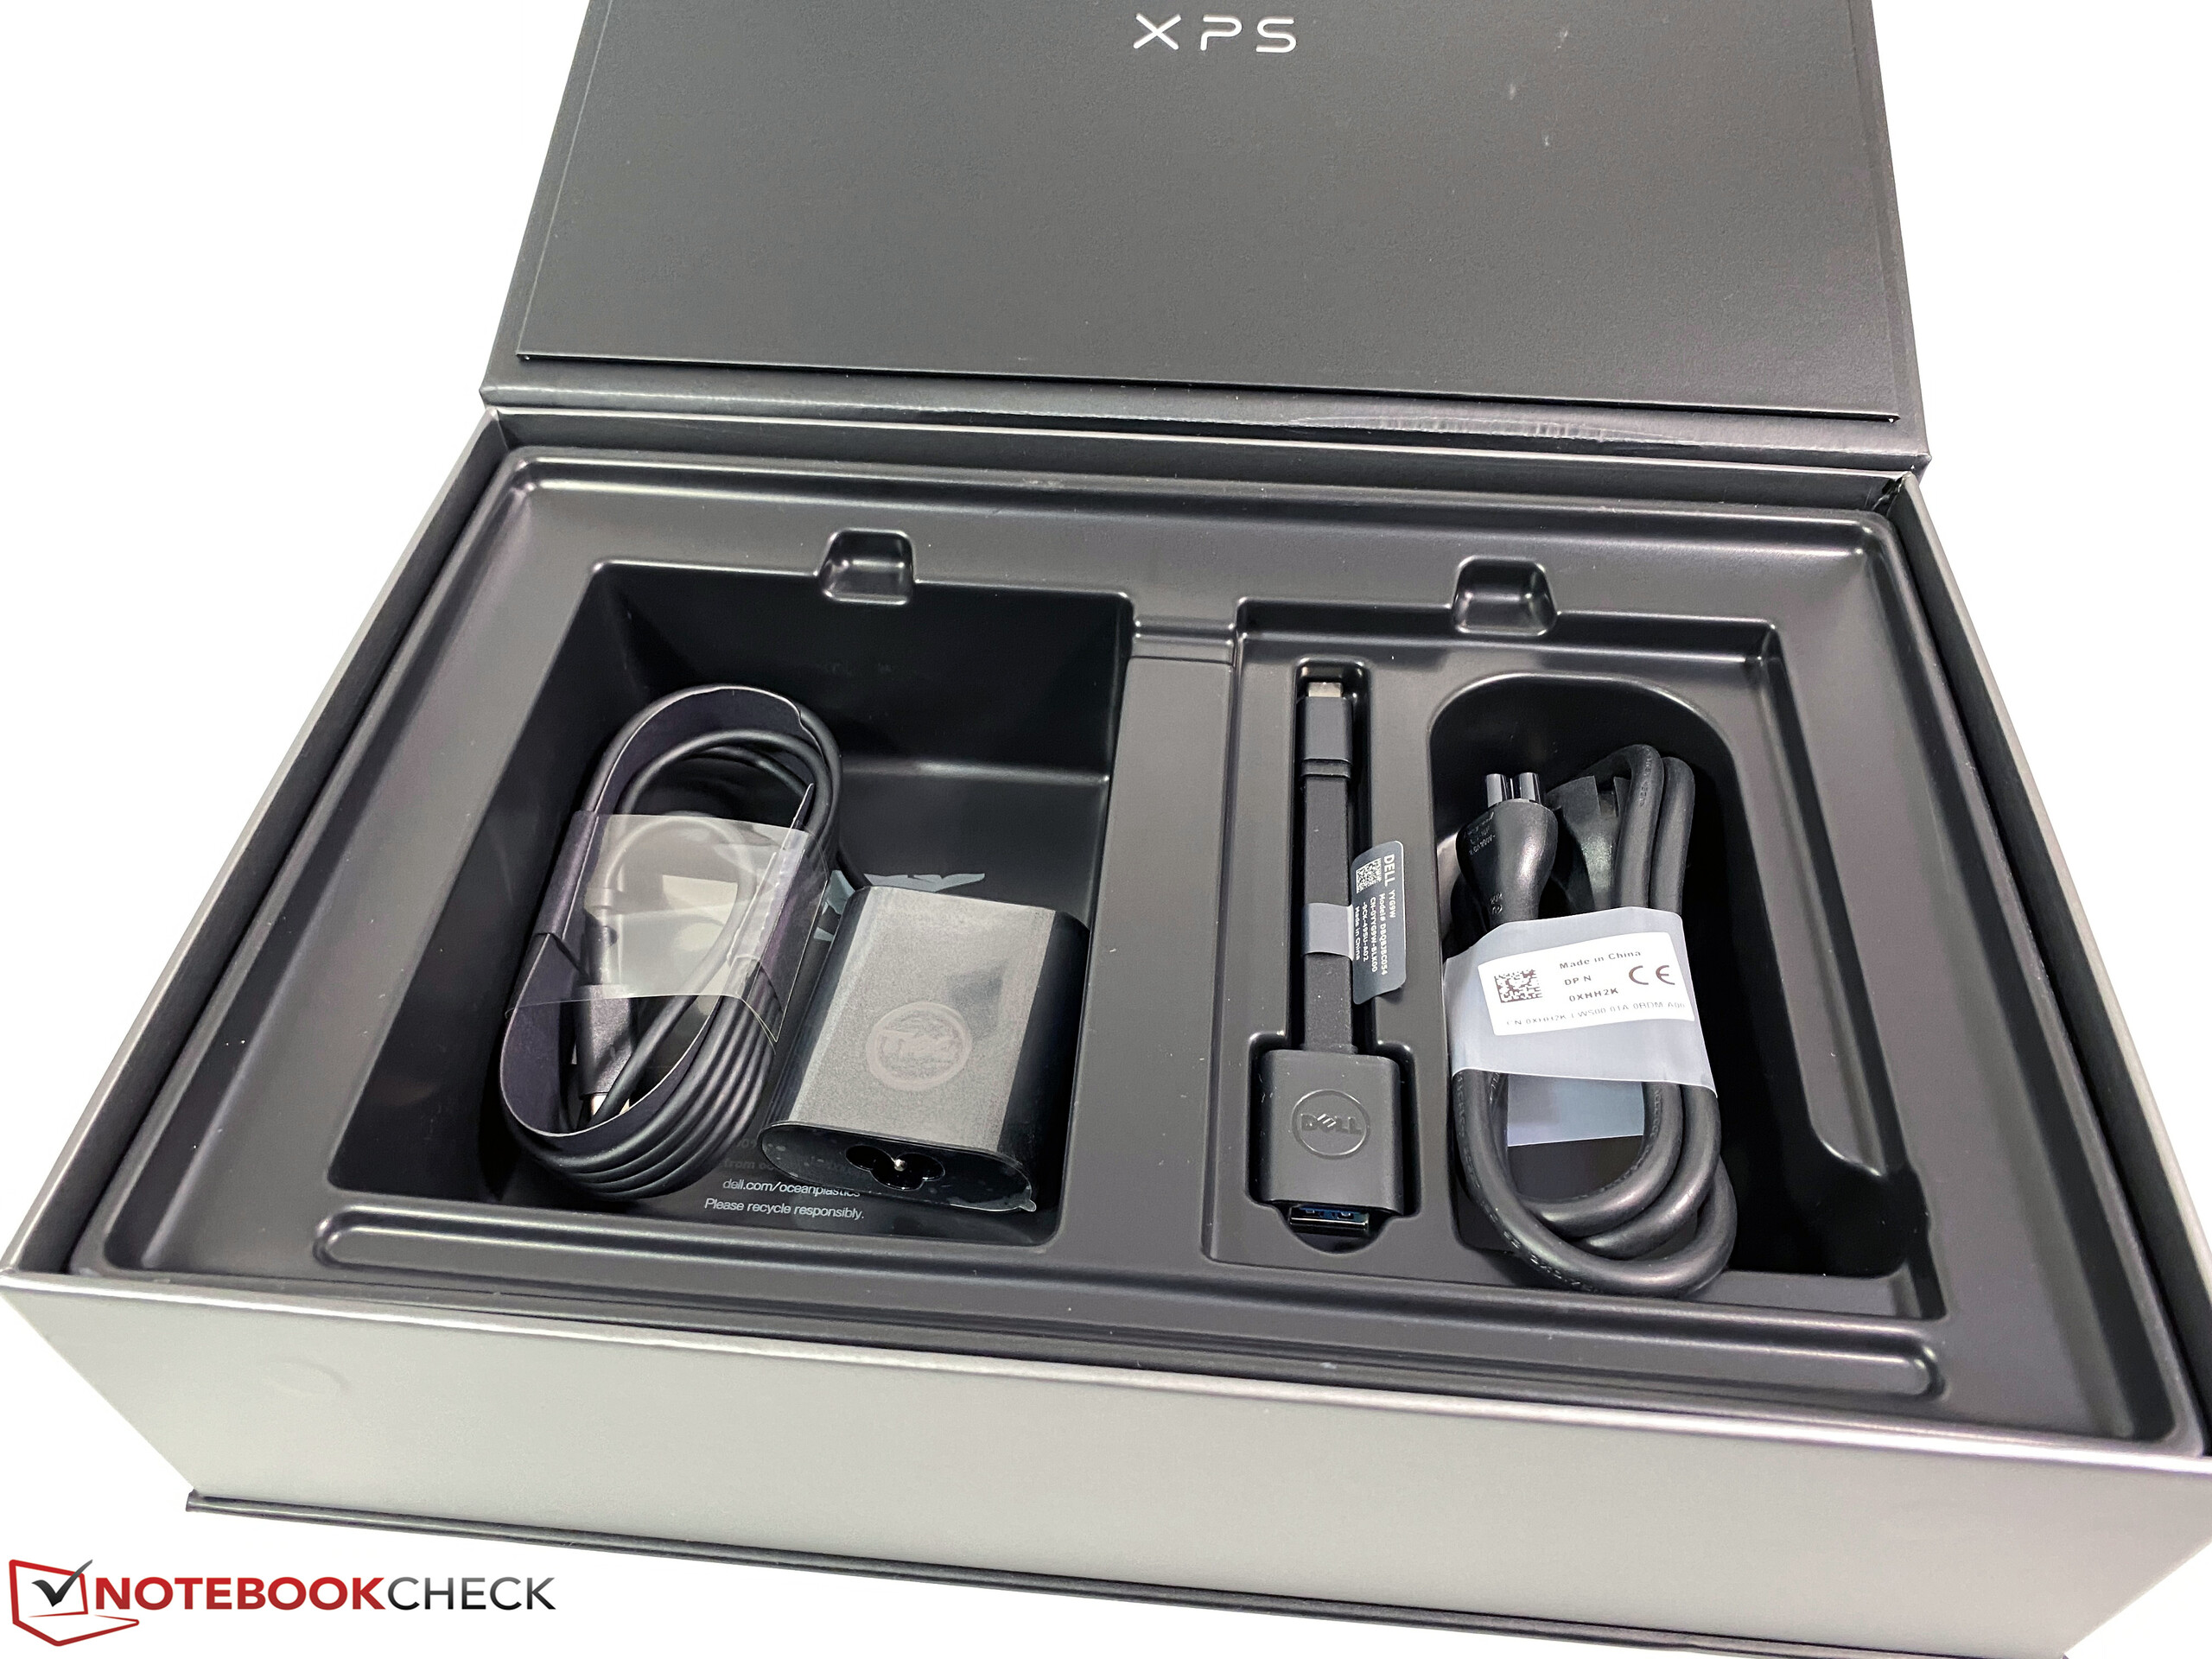
Vi uppskattar att 16:10-skärmen har gjort en återkomst och vi gillade också den snabba kortläsaren. Vi hade däremot gärna sett ytterligare en USB-port. Vi kommer även snart att recensera XPS 13 9300 med den snabbare Core i7-processorn och en UHD-skärm.
Dell XPS 13 9300 i5 FHD
- 03/19/2020 v7 (old)
Andreas Osthoff
Price comparison
