Test: Microsoft Surface Pro 7 Core i5 - Snarare en Surface Pro 6.5 (Sammanfattning)
Gradering | Datum | Modell | Vikt | Höjd | Storlek | Upplösning | Pris |
|---|---|---|---|---|---|---|---|
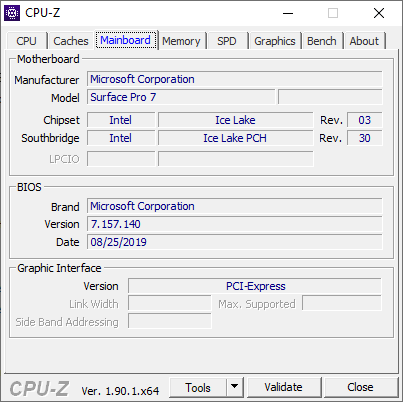
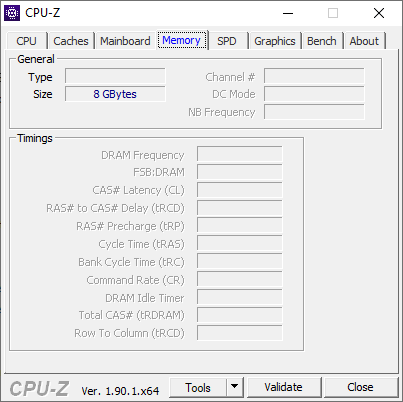
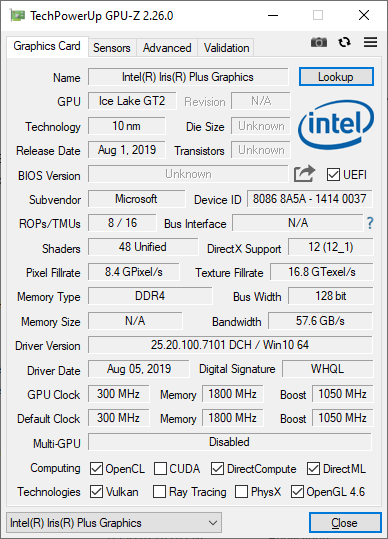
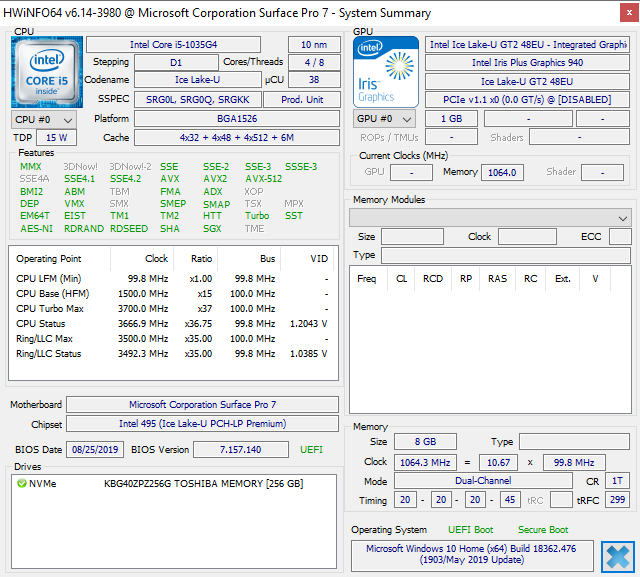
| 88.4 % v7 (old) | 11/2019 | Microsoft Surface Pro 7 Core i5-1035G4 i5-1035G4, Iris Plus Graphics G4 (Ice Lake 48 EU) | 1.1 kg | 8.5 mm | 12.30" | 2736x1824 | |
| 89.1 % v7 (old) | 11/2018 | Microsoft Surface Pro 6, Core i7, 512 GB i7-8650U, UHD Graphics 620 | 1.1 kg | 8.5 mm | 12.30" | 2736x1824 | |
| 86.3 % v7 (old) | 10/2019 | Dell XPS 13 7390 2-in-1 Core i7 i7-1065G7, Iris Plus Graphics G7 (Ice Lake 64 EU) | 1.3 kg | 13 mm | 13.40" | 1920x1200 | |
| 87 % v7 (old) | 10/2018 | HP Elite x2 1013 G3-2TT14EA i5-8350U, UHD Graphics 620 | 1.2 kg | 7.9 mm | 13.00" | 3000x2000 | |
| 83.3 % v6 (old) | 03/2018 | Lenovo Miix 520-12IKB 20M3000LGE i5-8550U, UHD Graphics 620 | 1.3 kg | 9.9 mm | 12.20" | 1920x1200 |

| SD Card Reader | |
| average JPG Copy Test (av. of 3 runs) | |
| Microsoft Surface Book 2 (Toshiba Exceria Pro SDXC 64 GB UHS-II) | |
| Dell XPS 13 7390 2-in-1 Core i7 (Toshiba Exceria Pro M501 64 GB UHS-II) | |
| Microsoft Surface Pro 6, Core i7, 512 GB (Toshiba Exceria Pro M501 microSDXC 64GB) | |
| Microsoft Surface Pro 7 Core i5-1035G4 (Toshiba Exceria Pro M501 64 GB UHS-II) | |
| Chuwi UBook Pro (Toshiba Exceria Pro M501 64 GB UHS-II) | |
| Microsoft Surface Go MHN-00003 (Toshiba Exceria Pro M501) | |
| Microsoft Surface Pro (2017) i7 (Toshiba Exceria Pro M401 64 GB) | |
| maximum AS SSD Seq Read Test (1GB) | |
| Microsoft Surface Book 2 (Toshiba Exceria Pro SDXC 64 GB UHS-II) | |
| Dell XPS 13 7390 2-in-1 Core i7 (Toshiba Exceria Pro M501 64 GB UHS-II) | |
| Microsoft Surface Pro (2017) i7 (Toshiba Exceria Pro M401 64 GB) | |
| Microsoft Surface Pro 6, Core i7, 512 GB (Toshiba Exceria Pro M501 microSDXC 64GB) | |
| Microsoft Surface Pro 7 Core i5-1035G4 (Toshiba Exceria Pro M501 64 GB UHS-II) | |
| Microsoft Surface Go MHN-00003 (Toshiba Exceria Pro M501) | |
| Chuwi UBook Pro (Toshiba Exceria Pro M501 64 GB UHS-II) | |
| |||||||||||||||||||||||||
Distribution av ljusstyrkan: 91 %
Mitt på batteriet: 480.4 cd/m²
Kontrast: 1001:1 (Svärta: 0.48 cd/m²)
ΔE ColorChecker Calman: 5 | ∀{0.5-29.43 Ø4.72}
calibrated: 2.44
ΔE Greyscale Calman: 5.9 | ∀{0.09-98 Ø4.97}
93.2% sRGB (Argyll 1.6.3 3D)
60.3% AdobeRGB 1998 (Argyll 1.6.3 3D)
66.9% AdobeRGB 1998 (Argyll 3D)
93.8% sRGB (Argyll 3D)
66% Display P3 (Argyll 3D)
Gamma: 2.38
CCT: 7805 K
| Microsoft Surface Pro 7 Core i5-1035G4 LG Philips LP123WQ112604, IPS, 12.3", 2736x1824 | Microsoft Surface Pro 6, Core i7, 512 GB LGPhilips LP123WQ112604, IPS, 12.3", 2736x1824 | Microsoft Surface Go MHN-00003 Sharp SHP14A6, IPS, 10", 1800x1200 | Microsoft Surface Pro (2017) i7 LG Display LP123WQ112604, IPS, 12.3", 2736x1824 | Microsoft Surface Pro 4 Core i7 Samsung 123YL01-001 ID: SDC3853, IPS, 12.3", 2736x1824 | Microsoft Surface Pro 3 SEC3542, IPS, 12", 2160x1440 | |
|---|---|---|---|---|---|---|
| Display | 2% | 2% | 2% | 3% | -4% | |
| Display P3 Coverage (%) | 66 | 67.1 2% | 66.5 1% | 66.6 1% | 66.9 1% | 63.6 -4% |
| sRGB Coverage (%) | 93.8 | 95.5 2% | 97.5 4% | 96.5 3% | 97.5 4% | 88.8 -5% |
| AdobeRGB 1998 Coverage (%) | 66.9 | 67.9 1% | 67.5 1% | 67.8 1% | 68.6 3% | 65.6 -2% |
| Response Times | -10% | -12% | -1% | -37% | ||
| Response Time Grey 50% / Grey 80% * (ms) | 34.8 ? | 43 ? -24% | 44 ? -26% | 37 ? -6% | 48.4 ? -39% | |
| Response Time Black / White * (ms) | 26.4 ? | 25 ? 5% | 25.6 ? 3% | 25 ? 5% | 35.6 ? -35% | |
| PWM Frequency (Hz) | 21550 ? | 22000 ? | 1020 ? | 22130 ? | 10420 | |
| Screen | 17% | 30% | 7% | 21% | -3% | |
| Brightness middle (cd/m²) | 480.4 | 484 1% | 456 -5% | 482 0% | 436.7 -9% | 355.3 -26% |
| Brightness (cd/m²) | 485 | 473 -2% | 426 -12% | 466 -4% | 433 -11% | 338 -30% |
| Brightness Distribution (%) | 91 | 91 0% | 88 -3% | 92 1% | 87 -4% | 91 0% |
| Black Level * (cd/m²) | 0.48 | 0.33 31% | 0.31 35% | 0.395 18% | 0.326 32% | 0.33 31% |
| Contrast (:1) | 1001 | 1467 47% | 1471 47% | 1220 22% | 1340 34% | 1077 8% |
| Colorchecker dE 2000 * | 5 | 4.29 14% | 1.3 74% | 4 20% | 1.82 64% | 4.72 6% |
| Colorchecker dE 2000 max. * | 7.72 | 6.46 16% | 3 61% | 7.2 7% | ||
| Colorchecker dE 2000 calibrated * | 2.44 | 1.34 45% | 1.1 55% | |||
| Greyscale dE 2000 * | 5.9 | 4.3 27% | 1.4 76% | 5.7 3% | 1.44 76% | 6.53 -11% |
| Gamma | 2.38 92% | 2.51 88% | 2.24 98% | 2.28 96% | 2.1 105% | 2.17 101% |
| CCT | 7805 83% | 7315 89% | 6687 97% | 7950 82% | 6560 99% | 6707 97% |
| Color Space (Percent of AdobeRGB 1998) (%) | 60.3 | 62 3% | 62.3 3% | 62 3% | 62.3 3% | 59.37 -2% |
| Color Space (Percent of sRGB) (%) | 93.2 | 95 2% | 96.8 4% | 96 3% | 97.5 5% | |
| Totalt genomsnitt (program/inställningar) | 3% /
11% | 7% /
20% | 3% /
5% | -4% /
9% | -4% /
-3% |
* ... mindre är bättre
Visa svarstider
| ↔ Svarstid svart till vitt | ||
|---|---|---|
| 26.4 ms ... stiga ↗ och falla ↘ kombinerat | ↗ 13.2 ms stiga | 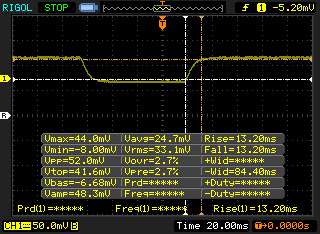 |
| ↘ 13.2 ms hösten | ||
| Skärmen visar relativt långsamma svarsfrekvenser i våra tester och kan vara för långsam för spelare. I jämförelse sträcker sig alla testade enheter från 0.1 (minst) till 240 (maximalt) ms. » 66 % av alla enheter är bättre. Detta innebär att den uppmätta svarstiden är sämre än genomsnittet av alla testade enheter (19.8 ms). | ||
| ↔ Svarstid 50 % grått till 80 % grått | ||
| 34.8 ms ... stiga ↗ och falla ↘ kombinerat | ↗ 16.8 ms stiga | 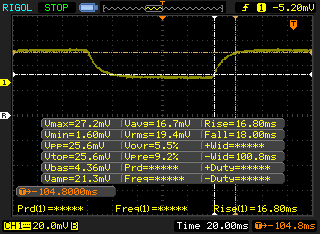 |
| ↘ 18 ms hösten | ||
| Skärmen visar långsamma svarsfrekvenser i våra tester och kommer att vara otillfredsställande för spelare. I jämförelse sträcker sig alla testade enheter från 0.165 (minst) till 636 (maximalt) ms. » 49 % av alla enheter är bättre. Detta innebär att den uppmätta svarstiden är sämre än genomsnittet av alla testade enheter (31 ms). | ||
Skärmflimmer / PWM (Puls-Width Modulation)
| Skärmflimmer / PWM upptäckt | 21550 Hz | ≤ 24 % ljusstyrka inställning | 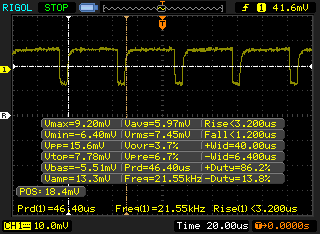 |
Displayens bakgrundsbelysning flimrar vid 21550 Hz (i värsta fall, t.ex. med PWM) Flimrande upptäckt vid en ljusstyrkeinställning på 24 % och lägre. Det ska inte finnas något flimmer eller PWM över denna ljusstyrkeinställning. Frekvensen för 21550 Hz är ganska hög, så de flesta användare som är känsliga för PWM bör inte märka något flimmer. Som jämförelse: 52 % av alla testade enheter använder inte PWM för att dämpa skärmen. Om PWM upptäcktes mättes ett medelvärde av 7772 (minst: 5 - maximum: 343500) Hz. | |||
* ... mindre är bättre
| PCMark 8 Home Score Accelerated v2 | 3537 poäng | |
| PCMark 8 Work Score Accelerated v2 | 4639 poäng | |
| PCMark 10 Score | 4163 poäng | |
Hjälp | ||
| Microsoft Surface Pro 7 Core i5-1035G4 Toshiba BG4 KBG40ZPZ256G | Microsoft Surface Pro 6, Core i7, 512 GB Toshiba KBG30ZPZ512G | Microsoft Surface Go MHN-00003 64 GB eMMC Flash | Microsoft Surface Pro (2017) i7 Samsung PM971 KUS040202M | Microsoft Surface Pro 4 Core i7 Samsung MZFLV256 NVMe | Microsoft Surface Laptop 3 15 Ryzen 5 3580U SK hynix BC501 HFM256GDGTNG | |
|---|---|---|---|---|---|---|
| AS SSD | -45% | -77% | -101% | -10% | -18% | |
| Seq Read (MB/s) | 1590 | 1154 -27% | 289.8 -82% | 1070 -33% | 1312 -17% | 1122 -29% |
| Seq Write (MB/s) | 714 | 393.6 -45% | 126.7 -82% | 171 -76% | 274.8 -62% | 514 -28% |
| 4K Read (MB/s) | 50.7 | 34.42 -32% | 18.29 -64% | 41 -19% | 33.47 -34% | 34.98 -31% |
| 4K Write (MB/s) | 109.4 | 68.9 -37% | 35.07 -68% | 0.2 -100% | 89.2 -18% | 96.8 -12% |
| 4K-64 Read (MB/s) | 924 | 494.1 -47% | 40.27 -96% | 1015 10% | 1280 39% | 492 -47% |
| 4K-64 Write (MB/s) | 294.6 | 171.3 -42% | 44.48 -85% | 34 -88% | 268.7 -9% | 339.9 15% |
| Access Time Read * (ms) | 0.066 | 0.213 -223% | 0.151 -129% | 0.04 39% | 0.047 29% | 0.056 15% |
| Access Time Write * (ms) | 0.697 | 0.3 57% | 0.233 67% | 7.6 -990% | 0.036 95% | 0.11 84% |
| Score Read (Points) | 1133 | 644 -43% | 88 -92% | 1164 3% | 1445 28% | 639 -44% |
| Score Write (Points) | 475 | 280 -41% | 92 -81% | 52 -89% | 385 -19% | 488 3% |
| Score Total (Points) | 2157 | 1225 -43% | 225 -90% | 1774 -18% | 2518 17% | 1434 -34% |
| Copy ISO MB/s (MB/s) | 1177 | 985 -16% | 99.1 -92% | 1036 -12% | 409.9 -65% | 828 -30% |
| Copy Program MB/s (MB/s) | 406 | 143.1 -65% | 44.34 -89% | 386 -5% | 209.8 -48% | 200.5 -51% |
| Copy Game MB/s (MB/s) | 923 | 676 -27% | 76.5 -92% | 582 -37% | 273.9 -70% | 387.4 -58% |
* ... mindre är bättre

| 3DMark 06 Standard Score | 13031 poäng | |
| 3DMark 11 Performance | 3485 poäng | |
| 3DMark Time Spy Score | 699 poäng | |
Hjälp | ||
| Fortnite | |
| 1280x720 Low Preset | |
| Microsoft Surface Laptop 3 15 Ryzen 5 3580U | |
| Microsoft Surface Pro 7 Core i5-1035G4 | |
| 1920x1080 Medium Preset | |
| Microsoft Surface Laptop 3 15 Ryzen 5 3580U | |
| Microsoft Surface Pro 7 Core i5-1035G4 | |
| låg | med. | hög | ultra | |
|---|---|---|---|---|
| StarCraft II: Heart of the Swarm (2013) | 247.2 | 29.9 | 29.8 | 16.5 |
| BioShock Infinite (2013) | 87.3 | 50.8 | 42.9 | 15.2 |
| The Witcher 3 (2015) | 39.4 | 24.5 | 12.6 | 6.7 |
| Overwatch (2016) | 54.6 | 33.8 | 17.7 | 12.7 |
| Rocket League (2017) | 45.9 | 29.8 | 20.3 | |
| Fortnite (2018) | 39.5 | 12.3 | 11.6 | 7 |
| Shadow of the Tomb Raider (2018) | 18 | |||
| Borderlands 3 (2019) | 25.3 | 8.3 | 5.1 | 3.5 |
(±) Den maximala temperaturen på ovansidan är 43.6 °C / 110 F, jämfört med genomsnittet av 35.4 °C / 96 F , allt från 19.6 till 60 °C för klassen Convertible.
(-) Botten värms upp till maximalt 47.8 °C / 118 F, jämfört med genomsnittet av 36.9 °C / 98 F
(+) Vid tomgångsbruk är medeltemperaturen för ovansidan 29.8 °C / 86 F, jämfört med enhetsgenomsnittet på 30.3 °C / ### class_avg_f### F.
(±) Handledsstöden och pekplattan kan bli väldigt varma vid beröring med maximalt 39.4 °C / 102.9 F.
(-) Medeltemperaturen för handledsstödsområdet på liknande enheter var 28 °C / 82.4 F (-11.4 °C / -20.5 F).
Microsoft Surface Pro 7 Core i5-1035G4 ljudanalys
(±) | högtalarljudstyrkan är genomsnittlig men bra (78.4 dB)
Bas 100 - 315 Hz
(±) | reducerad bas - i genomsnitt 10.6% lägre än medianen
(±) | linjäriteten för basen är genomsnittlig (11.3% delta till föregående frekvens)
Mellan 400 - 2000 Hz
(+) | balanserad mellan - endast 4.8% från medianen
(+) | mids är linjära (4.1% delta till föregående frekvens)
Högsta 2 - 16 kHz
(±) | högre toppar - i genomsnitt 5.4% högre än medianen
(±) | linjäriteten för toppar är genomsnittlig (7.9% delta till föregående frekvens)
Totalt 100 - 16 000 Hz
(±) | linjäriteten för det totala ljudet är genomsnittlig (24.9% skillnad mot median)
Jämfört med samma klass
» 75% av alla testade enheter i den här klassen var bättre, 7% liknande, 18% sämre
» Den bästa hade ett delta på 6%, genomsnittet var 20%, sämst var 57%
Jämfört med alla testade enheter
» 76% av alla testade enheter var bättre, 5% liknande, 19% sämre
» Den bästa hade ett delta på 4%, genomsnittet var 24%, sämst var 134%
Apple MacBook 12 (Early 2016) 1.1 GHz ljudanalys
(+) | högtalare kan spela relativt högt (83.6 dB)
Bas 100 - 315 Hz
(±) | reducerad bas - i genomsnitt 11.3% lägre än medianen
(±) | linjäriteten för basen är genomsnittlig (14.2% delta till föregående frekvens)
Mellan 400 - 2000 Hz
(+) | balanserad mellan - endast 2.4% från medianen
(+) | mids är linjära (5.5% delta till föregående frekvens)
Högsta 2 - 16 kHz
(+) | balanserade toppar - endast 2% från medianen
(+) | toppar är linjära (4.5% delta till föregående frekvens)
Totalt 100 - 16 000 Hz
(+) | det totala ljudet är linjärt (10.2% skillnad mot median)
Jämfört med samma klass
» 7% av alla testade enheter i den här klassen var bättre, 2% liknande, 91% sämre
» Den bästa hade ett delta på 5%, genomsnittet var 18%, sämst var 53%
Jämfört med alla testade enheter
» 5% av alla testade enheter var bättre, 1% liknande, 94% sämre
» Den bästa hade ett delta på 4%, genomsnittet var 24%, sämst var 134%
| Av/Standby | |
| Låg belastning | |
| Hög belastning |
|
Förklaring:
min: | |
| Microsoft Surface Pro 7 Core i5-1035G4 i5-1035G4, Iris Plus Graphics G4 (Ice Lake 48 EU), Toshiba BG4 KBG40ZPZ256G, IPS, 2736x1824, 12.3" | Microsoft Surface Pro 6, Core i7, 512 GB i7-8650U, UHD Graphics 620, Toshiba KBG30ZPZ512G, IPS, 2736x1824, 12.3" | Microsoft Surface Go MHN-00003 Pentium 4415Y, UHD Graphics 615, 64 GB eMMC Flash, IPS, 1800x1200, 10" | Microsoft Surface Pro (2017) i7 i7-7660U, Iris Plus Graphics 640, Samsung PM971 KUS040202M, IPS, 2736x1824, 12.3" | Microsoft Surface Pro (2017) i5 i5-7300U, HD Graphics 620, Samsung PM971 KUS030202M, IPS, 2736x1824, 12.3" | HP Elite x2 1013 G3-2TT14EA i5-8350U, UHD Graphics 620, Samsung PM961 MZVLW256HEHP, IPS, 3000x2000, 13" | |
|---|---|---|---|---|---|---|
| Power Consumption | 18% | 46% | 2% | 29% | 9% | |
| Idle Minimum * (Watt) | 4.5 | 3.2 29% | 2.88 36% | 4.2 7% | 3.6 20% | 4.9 -9% |
| Idle Average * (Watt) | 9.2 | 8.7 5% | 4.8 48% | 10.1 -10% | 8.1 12% | 8.9 3% |
| Idle Maximum * (Watt) | 9.6 | 10.4 -8% | 7.5 22% | 14 -46% | 8.7 9% | 11 -15% |
| Load Average * (Watt) | 42 | 29.2 30% | 16.9 60% | 37.4 11% | 25.5 39% | 32 24% |
| Load Maximum * (Watt) | 63.5 | 40.8 36% | 23.8 63% | 34 46% | 23.5 63% | 36 43% |
| Witcher 3 ultra * (Watt) | 38.1 |
* ... mindre är bättre
| Microsoft Surface Pro 7 Core i5-1035G4 i5-1035G4, Iris Plus Graphics G4 (Ice Lake 48 EU), 45 Wh | Microsoft Surface Pro 6, Core i7, 512 GB i7-8650U, UHD Graphics 620, 45 Wh | Microsoft Surface Go MHN-00003 Pentium 4415Y, UHD Graphics 615, 28 Wh | Microsoft Surface Pro 4 Core i7 6650U, Iris Graphics 540, 38 Wh | Microsoft Surface Pro 3 4300U, HD Graphics 4400, 42 Wh | HP Elite x2 1013 G3-2TT14EA i5-8350U, UHD Graphics 620, 50 Wh | Microsoft Surface Pro (2017) i5 i5-7300U, HD Graphics 620, 45 Wh | |
|---|---|---|---|---|---|---|---|
| Batteridrifttid | -6% | -3% | -45% | -4% | -15% | 17% | |
| Reader / Idle (h) | 22.3 | 18.1 -19% | 12.9 -42% | 10.9 -51% | 18.3 -18% | 13 -42% | 17.6 -21% |
| WiFi v1.3 (h) | 10 | 8.5 -15% | 7.5 -25% | 4.9 -51% | 7.7 -23% | 12.4 24% | |
| Load (h) | 1.9 | 2.2 16% | 3 58% | 1.3 -32% | 2.1 11% | 2.3 21% | 2.8 47% |
| WiFi (h) | 8.4 |
För
Emot

Läs den fullständiga versionen av den här recensionen på engelska här.
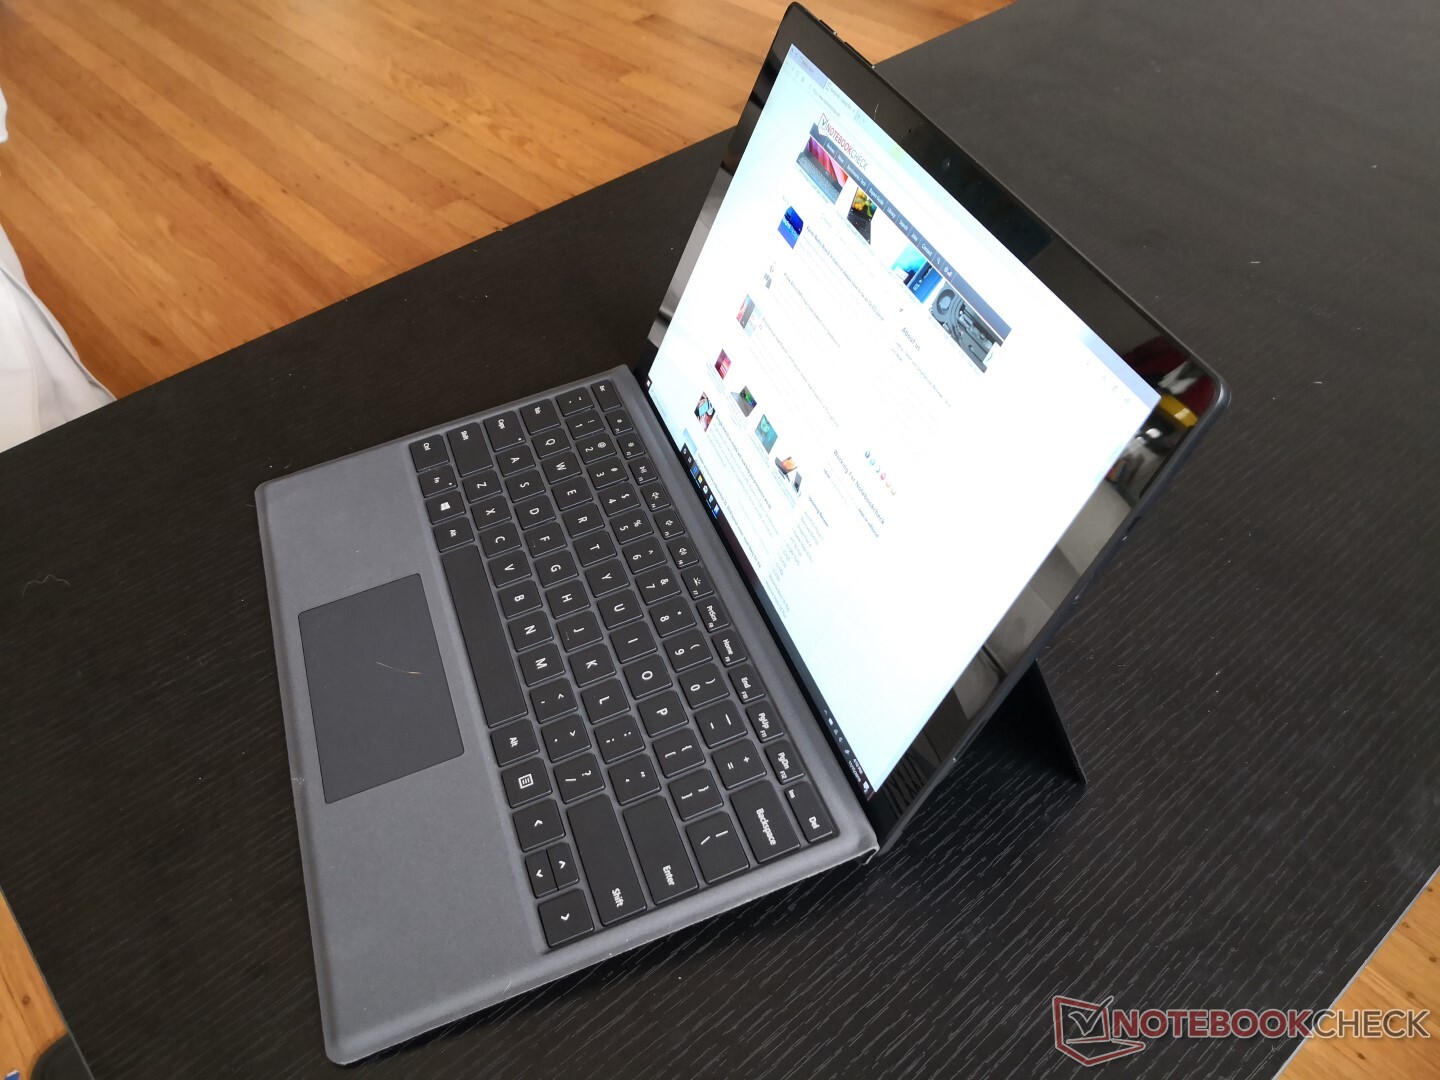
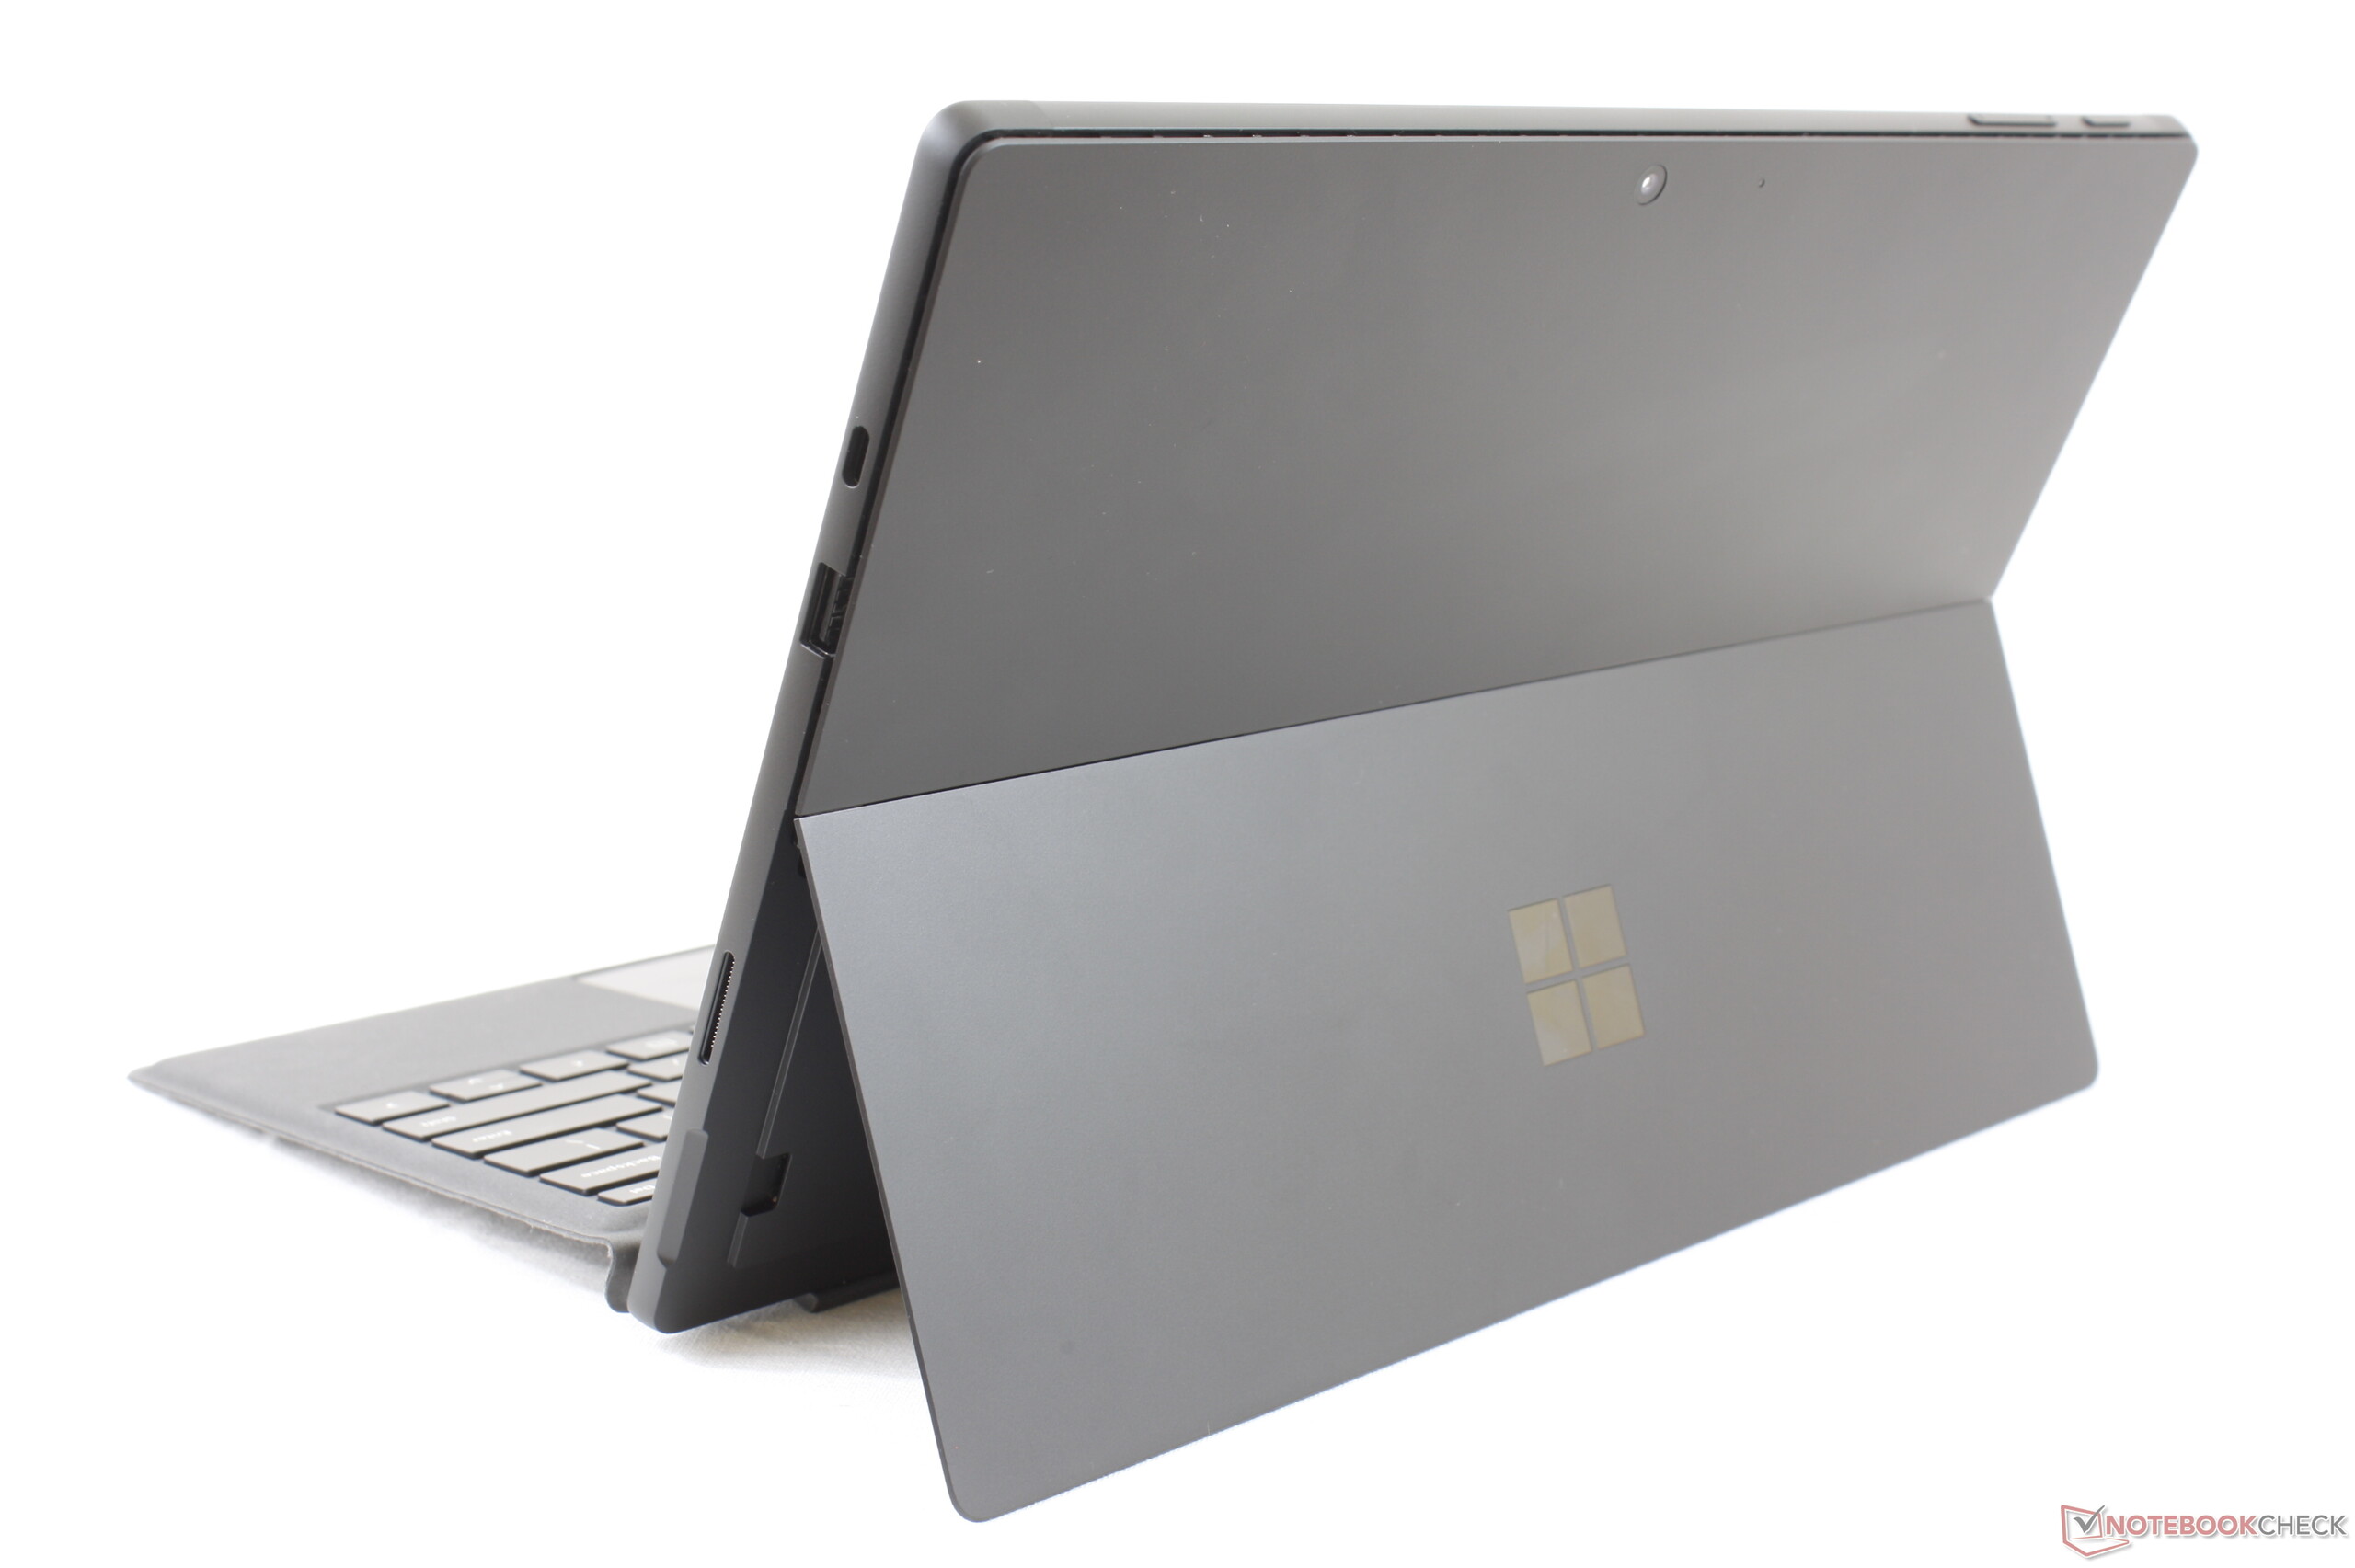
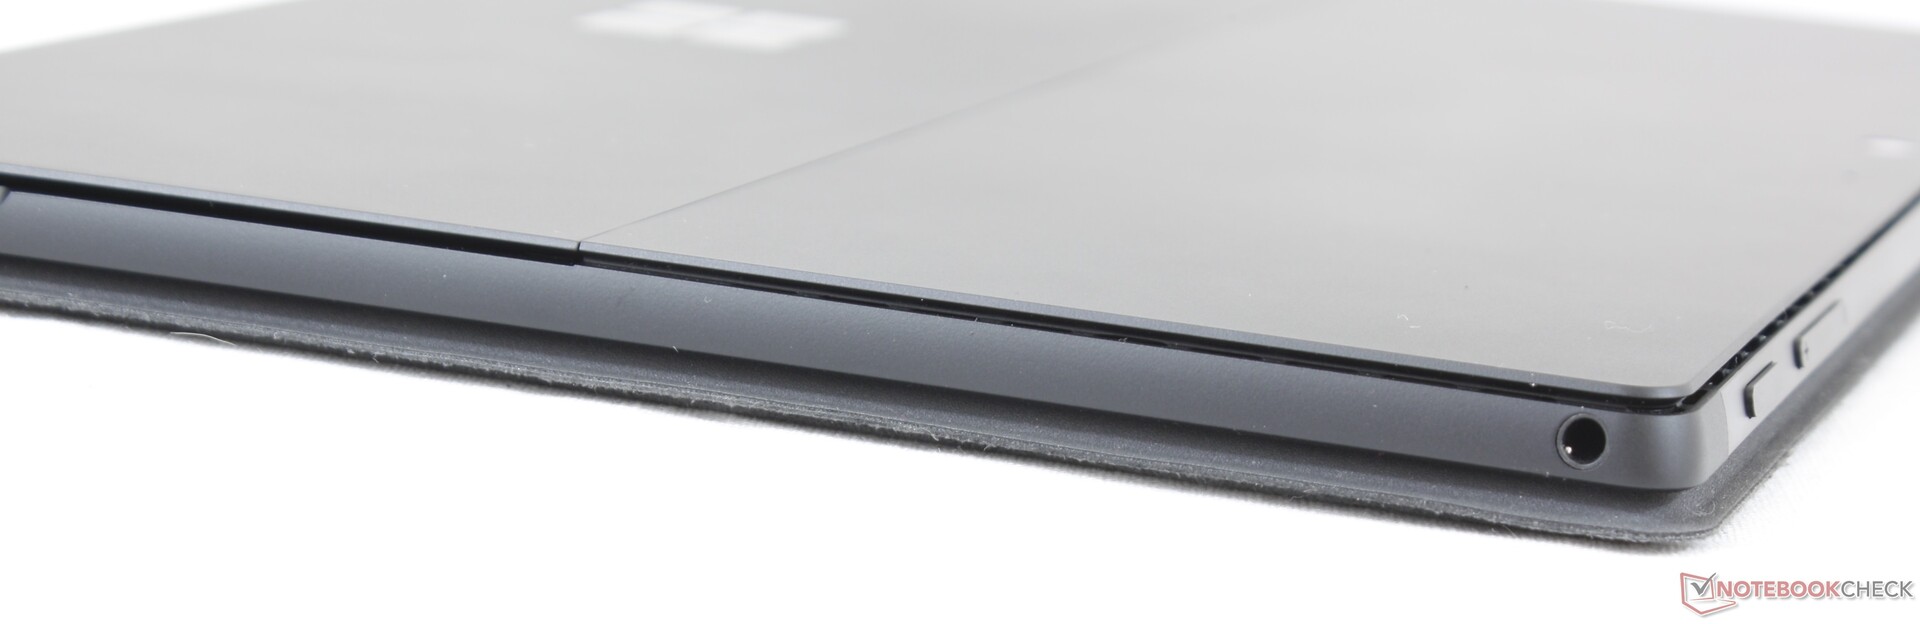
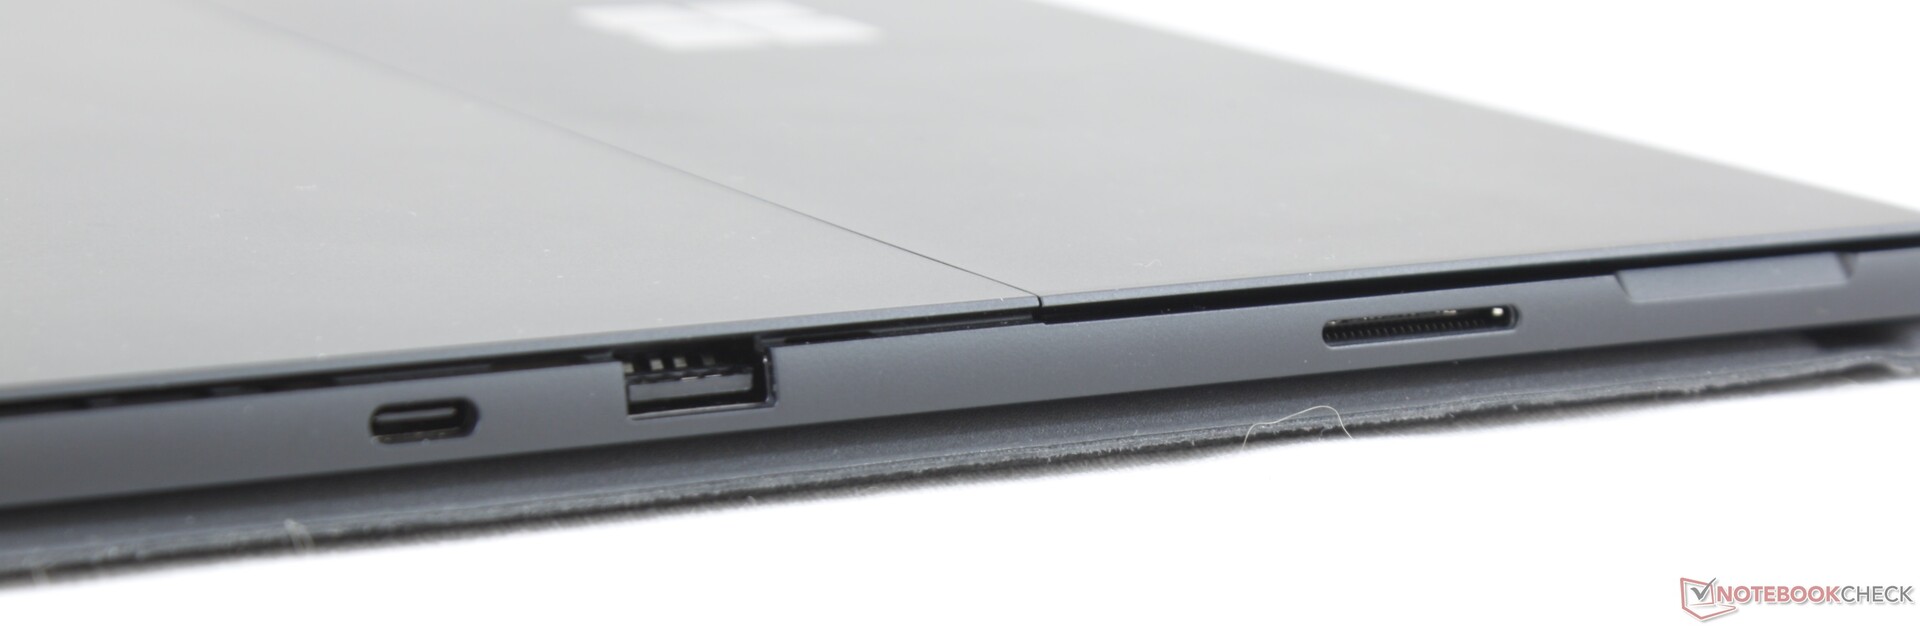
Om du redan är en nöjd ägare av en Surface Pro 5 eller en Surface Pro 6 finns det få anledningar att uppgradera till Surface Pro 7. Det är svårt att rekommendera Microsofts senaste utgåva när den har exakt samma skärm som den två år gamla Surface Pro 5 och har ungefär samma CPU-prestanda som Surface Pro 6:s Core i7. Det handlar i så fall om hur mycket du värderar den inbyggda USB C-porten och snabbare inbyggd grafik i form av Iris Plus G4 eller G7. Den sistnämnda kan definitivt hjälpa till vid enklare fotoredigering och bildbehandling, men om du i huvudsak ska använda plattan för ordbehandling, epost, surfande eller videoströmning erbjuder Core i5- eller Core i7-varianterna av Surface Pro 6 i princip samma upplevelse till ett lägre pris.
Den numrerade Surface Pro-serien har stagnerat sen 2017 års Surface Pro 5. Även om de fortfarande är bland de bästa Windows-baserade surfplattorna som finns på marknaden håller vi tummarna för att 2020 års Surface Pro kommer vara mer av en evolution för serien snarare än ytterligare en marginell iteration.
Surface Pro 7 känns mer som en SKU av Surface Pro 6 än en komplett numrerad uppföljare. Uppgraderingarna är små och kommer knappt ens märkas om man bara är intresserad av enklare uppgifter som ordbehandling, surfande och videoströmning.
Microsoft Surface Pro 7 Core i5-1035G4
- 11/19/2019 v7 (old)
Allen Ngo
Price comparison
