Test: Dell XPS 13 9300 4K UHD - 16:10 är det nya 16:9 (Sammanfattning)
Gradering | Datum | Modell | Vikt | Höjd | Storlek | Upplösning | Pris |
|---|---|---|---|---|---|---|---|
| 88 % v7 (old) | 05/2020 | Dell XPS 13 9300 4K UHD i7-1065G7, Iris Plus Graphics G7 (Ice Lake 64 EU) | 1.2 kg | 14.8 mm | 13.40" | 3840x2400 | |
| 86.3 % v7 (old) | 10/2019 | Dell XPS 13 7390 2-in-1 Core i7 i7-1065G7, Iris Plus Graphics G7 (Ice Lake 64 EU) | 1.3 kg | 13 mm | 13.40" | 1920x1200 | |
| 85.9 % v7 (old) | 11/2019 | Dell XPS 13 7390 Core i7-10710U i7-10710U, UHD Graphics 620 | 1.2 kg | 11.6 mm | 13.30" | 3840x2160 | |
| 90.6 % v7 (old) | 02/2020 | Apple MacBook Pro 13 2019 2TB3 i5-8257U, Iris Plus Graphics 645 | 1.4 kg | 14.9 mm | 13.30" | 2560x1600 | |
| 83.9 % v7 (old) | 01/2020 | Microsoft Surface Laptop 3 15 i7-1065G7 i7-1065G7, Iris Plus Graphics G7 (Ice Lake 64 EU) | 1.5 kg | 14.7 mm | 15.00" | 2496x1664 | |
| 83.7 % v7 (old) | 11/2019 | Razer Blade Stealth 13, Core i7-1065G7 i7-1065G7, GeForce GTX 1650 Max-Q | 1.5 kg | 15.3 mm | 13.30" | 3840x2160 |
| SD Card Reader | |
| average JPG Copy Test (av. of 3 runs) | |
| Dell XPS 13 9300 4K UHD (Toshiba Exceria Pro M501 64 GB UHS-II) | |
| Dell XPS 13 7390 Core i7-10710U (Toshiba Exceria Pro M501 64 GB UHS-II) | |
| HP Spectre x360 13-aw0013dx (Toshiba Exceria Pro M501 microSDXC 64GB) | |
| Dell XPS 13 7390 2-in-1 Core i7 (Toshiba Exceria Pro M501 64 GB UHS-II) | |
| Asus ZenBook Duo UX481FL (Toshiba Exceria Pro M501 microSDXC 64GB) | |
| maximum AS SSD Seq Read Test (1GB) | |
| Dell XPS 13 9300 4K UHD (Toshiba Exceria Pro M501 64 GB UHS-II) | |
| Dell XPS 13 7390 Core i7-10710U (Toshiba Exceria Pro M501 64 GB UHS-II) | |
| Dell XPS 13 7390 2-in-1 Core i7 (Toshiba Exceria Pro M501 64 GB UHS-II) | |
| HP Spectre x360 13-aw0013dx (Toshiba Exceria Pro M501 microSDXC 64GB) | |
| Asus ZenBook Duo UX481FL (Toshiba Exceria Pro M501 microSDXC 64GB) | |
| Networking | |
| iperf3 transmit AX12 | |
| Asus ZenBook Duo UX481FL | |
| MSI GP65 10SFK-047US | |
| Gigabyte Aero 17 HDR XB | |
| Dell XPS 13 9300 4K UHD | |
| iperf3 receive AX12 | |
| Gigabyte Aero 17 HDR XB | |
| Dell XPS 13 9300 4K UHD | |
| Asus ZenBook Duo UX481FL | |
| MSI GP65 10SFK-047US | |

, i7-1065G7, Intel SSDPEMKF512G8 NVMe SSD")
, i7-1065G7, Intel SSDPEMKF512G8 NVMe SSD")
| |||||||||||||||||||||||||
Distribution av ljusstyrkan: 94 %
Mitt på batteriet: 414 cd/m²
Kontrast: 1479:1 (Svärta: 0.28 cd/m²)
ΔE ColorChecker Calman: 3.06 | ∀{0.5-29.43 Ø4.72}
calibrated: 3.5
ΔE Greyscale Calman: 3 | ∀{0.09-98 Ø4.97}
91.4% sRGB (Argyll 1.6.3 3D)
61.1% AdobeRGB 1998 (Argyll 1.6.3 3D)
66.6% AdobeRGB 1998 (Argyll 3D)
91.4% sRGB (Argyll 3D)
64.5% Display P3 (Argyll 3D)
Gamma: 2.42
CCT: 6840 K
| Dell XPS 13 9300 4K UHD Sharp LQ134R1, IPS, 13.4", 3840x2400 | Dell XPS 13 9300 Core i7-1065G7 Sharp LQ134N1, IPS, 13.4", 1920x1200 | Dell XPS 13 7390 2-in-1 Core i7 Sharp LQ134N1, IPS, 13.4", 1920x1200 | Dell XPS 13 7390 Core i7-10710U AU Optronics B133ZAN, Dell P/N: 90NTH, IPS, 13.3", 3840x2160 | Apple MacBook Pro 13 2019 2TB3 APPA03D, IPS, 13.3", 2560x1600 | Microsoft Surface Laptop 3 13 Core i5-1035G7 Sharp LQ135P1JX51, IPS, 13.5", 2256x1504 | |
|---|---|---|---|---|---|---|
| Display | 4% | 8% | -1% | 29% | 4% | |
| Display P3 Coverage (%) | 64.5 | 66.3 3% | 69.9 8% | 63.4 -2% | 96.1 49% | 65.7 2% |
| sRGB Coverage (%) | 91.4 | 97.3 6% | 99.2 9% | 93.7 3% | 99.4 9% | 98.6 8% |
| AdobeRGB 1998 Coverage (%) | 66.6 | 68.5 3% | 71.5 7% | 64.3 -3% | 85.6 29% | 67.8 2% |
| Response Times | -25% | -14% | -28% | -30% | -53% | |
| Response Time Grey 50% / Grey 80% * (ms) | 41.6 ? | 50 ? -20% | 47.6 ? -14% | 51.6 ? -24% | 50.4 ? -21% | 59.2 ? -42% |
| Response Time Black / White * (ms) | 25.6 ? | 33.2 ? -30% | 29.2 ? -14% | 33.6 ? -31% | 35.2 ? -38% | 41.6 ? -63% |
| PWM Frequency (Hz) | 2500 ? | 2500 ? | 116300 ? | 21740 ? | ||
| Screen | 1% | 16% | -29% | 29% | 21% | |
| Brightness middle (cd/m²) | 414 | 607.6 47% | 549.8 33% | 408.2 -1% | 603 46% | 403.4 -3% |
| Brightness (cd/m²) | 401 | 595 48% | 520 30% | 399 0% | 577 44% | 397 -1% |
| Brightness Distribution (%) | 94 | 96 2% | 86 -9% | 89 -5% | 92 -2% | 89 -5% |
| Black Level * (cd/m²) | 0.28 | 0.4 -43% | 0.39 -39% | 0.39 -39% | 0.35 -25% | 0.34 -21% |
| Contrast (:1) | 1479 | 1519 3% | 1410 -5% | 1047 -29% | 1723 16% | 1186 -20% |
| Colorchecker dE 2000 * | 3.06 | 3.23 -6% | 2.12 31% | 4.6 -50% | 1.7 44% | 0.94 69% |
| Colorchecker dE 2000 max. * | 6.5 | 8.67 -33% | 3.66 44% | 11.84 -82% | 3.1 52% | 2.92 55% |
| Colorchecker dE 2000 calibrated * | 3.5 | 1.01 71% | 1.37 61% | 2.03 42% | 0.7 80% | 0.99 72% |
| Greyscale dE 2000 * | 3 | 5.5 -83% | 2.6 13% | 7.5 -150% | 2.1 30% | 0.9 70% |
| Gamma | 2.42 91% | 2.12 104% | 2.3 96% | 2.12 104% | 2.18 101% | 2.13 103% |
| CCT | 6840 95% | 6413 101% | 6884 94% | 7966 82% | 6843 95% | 6620 98% |
| Color Space (Percent of AdobeRGB 1998) (%) | 61.1 | 63 3% | 65.4 7% | 59.5 -3% | 76.7 26% | 62.3 2% |
| Color Space (Percent of sRGB) (%) | 91.4 | 97.5 7% | 99.7 9% | 93.5 2% | 99.4 9% | 98.7 8% |
| Totalt genomsnitt (program/inställningar) | -7% /
-1% | 3% /
11% | -19% /
-23% | 9% /
22% | -9% /
8% |
* ... mindre är bättre
Visa svarstider
| ↔ Svarstid svart till vitt | ||
|---|---|---|
| 25.6 ms ... stiga ↗ och falla ↘ kombinerat | ↗ 15.6 ms stiga | 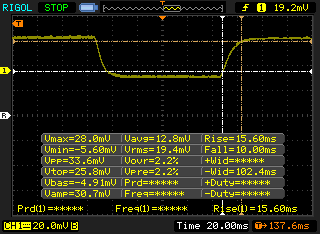 |
| ↘ 10 ms hösten | ||
| Skärmen visar relativt långsamma svarsfrekvenser i våra tester och kan vara för långsam för spelare. I jämförelse sträcker sig alla testade enheter från 0.1 (minst) till 240 (maximalt) ms. » 61 % av alla enheter är bättre. Detta innebär att den uppmätta svarstiden är sämre än genomsnittet av alla testade enheter (19.8 ms). | ||
| ↔ Svarstid 50 % grått till 80 % grått | ||
| 41.6 ms ... stiga ↗ och falla ↘ kombinerat | ↗ 23.2 ms stiga | 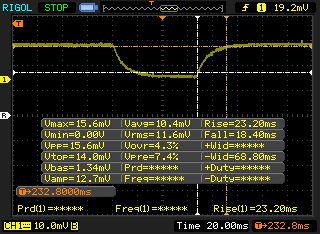 |
| ↘ 18.4 ms hösten | ||
| Skärmen visar långsamma svarsfrekvenser i våra tester och kommer att vara otillfredsställande för spelare. I jämförelse sträcker sig alla testade enheter från 0.165 (minst) till 636 (maximalt) ms. » 67 % av alla enheter är bättre. Detta innebär att den uppmätta svarstiden är sämre än genomsnittet av alla testade enheter (31 ms). | ||
Skärmflimmer / PWM (Puls-Width Modulation)
| Skärmflimmer / PWM upptäcktes inte | 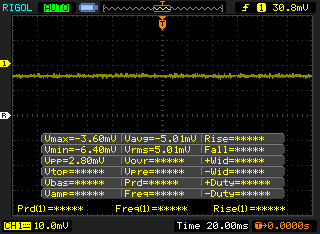 | ||
Som jämförelse: 52 % av alla testade enheter använder inte PWM för att dämpa skärmen. Om PWM upptäcktes mättes ett medelvärde av 7763 (minst: 5 - maximum: 343500) Hz. | |||
Cinebench R15: CPU Single 64Bit | CPU Multi 64Bit
Blender: v2.79 BMW27 CPU
7-Zip 18.03: 7z b 4 -mmt1 | 7z b 4
Geekbench 5.5: Single-Core | Multi-Core
HWBOT x265 Benchmark v2.2: 4k Preset
LibreOffice : 20 Documents To PDF
R Benchmark 2.5: Overall mean
| Cinebench R20 / CPU (Multi Core) | |
| Dell XPS 13 7390 Core i7-10710U | |
| Acer Aspire 7 A715-74G-50U5 | |
| Dell XPS 13 9300 i5 FHD | |
| Genomsnitt Intel Core i7-1065G7 (1081 - 2024, n=31) | |
| Huawei MateBook D 14-53010TVS | |
| Huawei MateBook D 14-53010TVS | |
| Dell Inspiron 15 5000 5585 | |
| Asus ZenBook Duo UX481FL | |
| Dell XPS 13 9300 4K UHD | |
| Acer Aspire 5 A515-54G | |
| HP Envy 13-aq0003ng | |
| Dynabook Portege A30-E-174 | |
| Dell XPS 13 7390 2-in-1 Core i3 | |
| Cinebench R20 / CPU (Single Core) | |
| Dell XPS 13 7390 Core i7-10710U | |
| Dell XPS 13 9300 4K UHD | |
| Asus ZenBook Duo UX481FL | |
| Genomsnitt Intel Core i7-1065G7 (358 - 474, n=31) | |
| Acer Aspire 7 A715-74G-50U5 | |
| Dell XPS 13 9300 i5 FHD | |
| Acer Aspire 5 A515-54G | |
| Dell XPS 13 7390 2-in-1 Core i3 | |
| Dynabook Portege A30-E-174 | |
| HP Envy 13-aq0003ng | |
| Dell Inspiron 15 5000 5585 | |
| Huawei MateBook D 14-53010TVS | |
| Huawei MateBook D 14-53010TVS | |
| Cinebench R15 / CPU Single 64Bit | |
| Dell XPS 13 9300 4K UHD | |
| Dell XPS 13 7390 Core i7-10710U | |
| Asus ZenBook Duo UX481FL | |
| Genomsnitt Intel Core i7-1065G7 (141 - 190, n=35) | |
| HP Envy 13-aq0003ng | |
| Acer Aspire 7 A715-74G-50U5 | |
| Dell XPS 13 9300 i5 FHD | |
| Acer Aspire 5 A515-54G | |
| Dell XPS 13 7390 2-in-1 Core i3 | |
| Dynabook Portege A30-E-174 | |
| Huawei MateBook D 14-53010TVS | |
| Dell Inspiron 15 5000 5585 | |
| Cinebench R15 / CPU Multi 64Bit | |
| Dell XPS 13 7390 Core i7-10710U | |
| Acer Aspire 7 A715-74G-50U5 | |
| Asus ZenBook Duo UX481FL | |
| Dell XPS 13 9300 4K UHD | |
| Huawei MateBook D 14-53010TVS | |
| Dell Inspiron 15 5000 5585 | |
| Dell XPS 13 9300 i5 FHD | |
| Dell XPS 13 9300 i5 FHD | |
| Genomsnitt Intel Core i7-1065G7 (288 - 836, n=36) | |
| Acer Aspire 5 A515-54G | |
| HP Envy 13-aq0003ng | |
| Dynabook Portege A30-E-174 | |
| Dell XPS 13 7390 2-in-1 Core i3 | |
| Blender / v2.79 BMW27 CPU | |
| Dell XPS 13 7390 2-in-1 Core i3 | |
| Genomsnitt Intel Core i7-1065G7 (675 - 1650, n=23) | |
| Acer Aspire 5 A515-54G | |
| Asus ZenBook Duo UX481FL | |
| Dell XPS 13 9300 i5 FHD | |
| Huawei MateBook D 14-53010TVS | |
| Huawei MateBook D 14-53010TVS | |
| Dell XPS 13 9300 4K UHD | |
| Dell XPS 13 7390 Core i7-10710U | |
| 7-Zip 18.03 / 7z b 4 -mmt1 | |
| Asus ZenBook Duo UX481FL | |
| Dell XPS 13 9300 4K UHD | |
| Dell XPS 13 7390 Core i7-10710U | |
| Genomsnitt Intel Core i7-1065G7 (3289 - 4589, n=24) | |
| Acer Aspire 5 A515-54G | |
| Dell XPS 13 9300 i5 FHD | |
| Dell XPS 13 7390 2-in-1 Core i3 | |
| Huawei MateBook D 14-53010TVS | |
| Huawei MateBook D 14-53010TVS | |
| 7-Zip 18.03 / 7z b 4 | |
| Dell XPS 13 7390 Core i7-10710U | |
| Dell XPS 13 9300 4K UHD | |
| Asus ZenBook Duo UX481FL | |
| Dell XPS 13 9300 i5 FHD | |
| Acer Aspire 5 A515-54G | |
| Huawei MateBook D 14-53010TVS | |
| Huawei MateBook D 14-53010TVS | |
| Genomsnitt Intel Core i7-1065G7 (10406 - 22898, n=24) | |
| Dell XPS 13 7390 2-in-1 Core i3 | |
| Geekbench 5.5 / Single-Core | |
| Dell XPS 13 9300 4K UHD | |
| Genomsnitt Intel Core i7-1065G7 (948 - 1348, n=18) | |
| Asus ZenBook Duo UX481FL | |
| Dell XPS 13 9300 i5 FHD | |
| Acer Aspire 5 A515-54G | |
| Huawei MateBook D 14-53010TVS | |
| Huawei MateBook D 14-53010TVS | |
| Geekbench 5.5 / Multi-Core | |
| Dell XPS 13 9300 4K UHD | |
| Dell XPS 13 9300 i5 FHD | |
| Genomsnitt Intel Core i7-1065G7 (2464 - 4855, n=18) | |
| Asus ZenBook Duo UX481FL | |
| Acer Aspire 5 A515-54G | |
| Huawei MateBook D 14-53010TVS | |
| Huawei MateBook D 14-53010TVS | |
| HWBOT x265 Benchmark v2.2 / 4k Preset | |
| Dell XPS 13 9300 4K UHD | |
| Dell XPS 13 7390 Core i7-10710U | |
| Asus ZenBook Duo UX481FL | |
| Genomsnitt Intel Core i7-1065G7 (2.2 - 6.38, n=22) | |
| Acer Aspire 5 A515-54G | |
| Dell XPS 13 9300 i5 FHD | |
| Huawei MateBook D 14-53010TVS | |
| Huawei MateBook D 14-53010TVS | |
| Dell XPS 13 7390 2-in-1 Core i3 | |
| LibreOffice / 20 Documents To PDF | |
| Dell XPS 13 9300 4K UHD | |
| Asus ZenBook Duo UX481FL | |
| Acer Aspire 5 A515-54G | |
| Genomsnitt Intel Core i7-1065G7 (46.9 - 85.3, n=19) | |
| R Benchmark 2.5 / Overall mean | |
| Asus ZenBook Duo UX481FL | |
| Huawei MateBook D 14-53010TVS | |
| Huawei MateBook D 14-53010TVS | |
| Dell XPS 13 9300 i5 FHD | |
| Acer Aspire 5 A515-54G | |
| Genomsnitt Intel Core i7-1065G7 (0.661 - 0.798, n=18) | |
| Dell XPS 13 9300 4K UHD | |
* ... mindre är bättre
| PCMark 8 Home Score Accelerated v2 | 3397 poäng | |
| PCMark 8 Work Score Accelerated v2 | 4314 poäng | |
| PCMark 10 Score | 4451 poäng | |
Hjälp | ||
| DPC Latencies / LatencyMon - interrupt to process latency (max), Web, Youtube, Prime95 | |
| Dell XPS 13 9300 4K UHD | |
* ... mindre är bättre
| Dell XPS 13 9300 4K UHD Intel SSDPEMKF512G8 NVMe SSD | Dell XPS 13 9300 Core i7-1065G7 Intel SSDPEMKF512G8 NVMe SSD | Dell XPS 13 7390 2-in-1 Core i7 Toshiba BG4 KBG40ZPZ512G | Dell XPS 13 7390 Core i7-10710U SK Hynix PC601 NVMe 512 GB | Apple MacBook Pro 13 2019 2TB3 Apple SSD AP0256 | |
|---|---|---|---|---|---|
| AS SSD | 1% | -21% | 22% | -77% | |
| Seq Read (MB/s) | 1821 | 1956 7% | 1801 -1% | 1804 -1% | 974 -47% |
| Seq Write (MB/s) | 931 | 1227 32% | 1125 21% | 1000 7% | 1340 44% |
| 4K Read (MB/s) | 56.4 | 63 12% | 39.7 -30% | 45.1 -20% | 11.35 -80% |
| 4K Write (MB/s) | 127.2 | 156.6 23% | 67 -47% | 115 -10% | 15.95 -87% |
| 4K-64 Read (MB/s) | 462.6 | 475.6 3% | 1253 171% | 893 93% | 643 39% |
| 4K-64 Write (MB/s) | 541 | 539 0% | 209 -61% | 732 35% | 163 -70% |
| Access Time Read * (ms) | 0.04 | 0.042 -5% | 0.069 -73% | 0.044 -10% | 0.316 -690% |
| Access Time Write * (ms) | 0.123 | 0.105 15% | 0.625 -408% | 0.095 23% | 0.258 -110% |
| Score Read (Points) | 701 | 734 5% | 1472 110% | 1119 60% | 752 7% |
| Score Write (Points) | 762 | 818 7% | 388 -49% | 947 24% | 313 -59% |
| Score Total (Points) | 1797 | 1915 7% | 2583 44% | 2608 45% | 1465 -18% |
| Copy ISO MB/s (MB/s) | 1068 | 1022 -4% | 1293 21% | 1515 42% | 1404 31% |
| Copy Program MB/s (MB/s) | 446.4 | 302.8 -32% | 560 25% | 535 20% | 406.9 -9% |
| Copy Game MB/s (MB/s) | 1163 | 491.4 -58% | 927 -20% | 1211 4% | 850 -27% |
| CrystalDiskMark 5.2 / 6 | 20% | 1% | 27% | ||
| Write 4K (MB/s) | 126.2 | 186.8 48% | 106.7 -15% | 134 6% | |
| Read 4K (MB/s) | 61.1 | 71.4 17% | 49.94 -18% | 42.91 -30% | |
| Write Seq (MB/s) | 1049 | 1203 15% | 1223 17% | 1841 76% | |
| Read Seq (MB/s) | 2231 | 2600 17% | 1801 -19% | 1707 -23% | |
| Write 4K Q32T1 (MB/s) | 410.1 | 514 25% | 325.3 -21% | 394.7 -4% | |
| Read 4K Q32T1 (MB/s) | 418.9 | 570 36% | 551 32% | 398.5 -5% | |
| Write Seq Q32T1 (MB/s) | 784 | 786 0% | 1224 56% | 2250 187% | |
| Read Seq Q32T1 (MB/s) | 2964 | 2947 -1% | 2350 -21% | 3265 10% | |
| Totalt genomsnitt (program/inställningar) | 11% /
8% | -10% /
-13% | 25% /
24% | -77% /
-77% |
* ... mindre är bättre

Diskstrypning: DiskSpd Read Loop, Queue Depth 8
| 3DMark 11 Performance | 4478 poäng | |
| 3DMark Cloud Gate Standard Score | 12940 poäng | |
| 3DMark Fire Strike Score | 2707 poäng | |
| 3DMark Time Spy Score | 847 poäng | |
Hjälp | ||
| låg | med. | hög | ultra | |
|---|---|---|---|---|
| Dota 2 Reborn (2015) | 80.2 | 48.6 | 30.1 | 27.6 |
| X-Plane 11.11 (2018) | 27.6 | 15.2 | 17.3 |
| Dell XPS 13 9300 4K UHD Iris Plus Graphics G7 (Ice Lake 64 EU), i7-1065G7, Intel SSDPEMKF512G8 NVMe SSD | Dell XPS 13 9300 Core i7-1065G7 Iris Plus Graphics G7 (Ice Lake 64 EU), i7-1065G7, Intel SSDPEMKF512G8 NVMe SSD | Dell XPS 13 7390 2-in-1 Core i7 Iris Plus Graphics G7 (Ice Lake 64 EU), i7-1065G7, Toshiba BG4 KBG40ZPZ512G | Dell XPS 13 7390 Core i7-10710U UHD Graphics 620, i7-10710U, SK Hynix PC601 NVMe 512 GB | Apple MacBook Pro 13 2019 2TB3 Iris Plus Graphics 645, i5-8257U, Apple SSD AP0256 | Microsoft Surface Laptop 3 13 Core i5-1035G7 Iris Plus Graphics G7 (Ice Lake 64 EU), i5-1035G7, SK hynix BC501 HFM256GDGTNG | |
|---|---|---|---|---|---|---|
| Noise | 2% | 0% | -1% | 0% | 3% | |
| av / miljö * (dB) | 29 | 28.3 2% | 28.1 3% | 28 3% | 29.5 -2% | 28.5 2% |
| Idle Minimum * (dB) | 29 | 28.3 2% | 28.1 3% | 28 3% | 29.5 -2% | 28.5 2% |
| Idle Average * (dB) | 29 | 28.3 2% | 28.1 3% | 28 3% | 29.5 -2% | 28.5 2% |
| Idle Maximum * (dB) | 29 | 28.3 2% | 28.1 3% | 28 3% | 29.5 -2% | 28.5 2% |
| Load Average * (dB) | 33.5 | 32.5 3% | 31.7 5% | 33.7 -1% | 31.1 7% | 28.5 15% |
| Witcher 3 ultra * (dB) | 40.5 | 39.3 3% | 43.4 -7% | 40.4 -0% | ||
| Load Maximum * (dB) | 40.5 | 39.3 3% | 43.4 -7% | 46.5 -15% | 39.3 3% | 40.4 -0% |
* ... mindre är bättre
Ljudnivå
| Låg belastning |
| 29 / 29 / 29 dB(A) |
| Hög belastning |
| 33.5 / 40.5 dB(A) |
 | ||
30 dB tyst 40 dB(A) hörbar 50 dB(A) högt ljud |
||
min: | ||
(-) Den maximala temperaturen på ovansidan är 48.4 °C / 119 F, jämfört med genomsnittet av 35.9 °C / 97 F , allt från 21.4 till 59 °C för klassen Subnotebook.
(±) Botten värms upp till maximalt 44.4 °C / 112 F, jämfört med genomsnittet av 39.2 °C / 103 F
(+) Vid tomgångsbruk är medeltemperaturen för ovansidan 27.3 °C / 81 F, jämfört med enhetsgenomsnittet på 30.8 °C / ### class_avg_f### F.
(+) Handledsstöden och pekplattan når maximal hudtemperatur (32 °C / 89.6 F) och är därför inte varma.
(-) Medeltemperaturen för handledsstödsområdet på liknande enheter var 28.2 °C / 82.8 F (-3.8 °C / -6.8 F).
| Av/Standby | |
| Låg belastning | |
| Hög belastning |
|
Förklaring:
min: | |
| Dell XPS 13 9300 4K UHD i7-1065G7, Iris Plus Graphics G7 (Ice Lake 64 EU), Intel SSDPEMKF512G8 NVMe SSD, IPS, 3840x2400, 13.4" | Dell XPS 13 9300 Core i7-1065G7 i7-1065G7, Iris Plus Graphics G7 (Ice Lake 64 EU), Intel SSDPEMKF512G8 NVMe SSD, IPS, 1920x1200, 13.4" | Dell XPS 13 7390 2-in-1 Core i7 i7-1065G7, Iris Plus Graphics G7 (Ice Lake 64 EU), Toshiba BG4 KBG40ZPZ512G, IPS, 1920x1200, 13.4" | Dell XPS 13 7390 Core i7-10710U i7-10710U, UHD Graphics 620, SK Hynix PC601 NVMe 512 GB, IPS, 3840x2160, 13.3" | Apple MacBook Pro 13 2019 2TB3 i5-8257U, Iris Plus Graphics 645, Apple SSD AP0256, IPS, 2560x1600, 13.3" | Microsoft Surface Laptop 3 13 Core i5-1035G7 i5-1035G7, Iris Plus Graphics G7 (Ice Lake 64 EU), SK hynix BC501 HFM256GDGTNG, IPS, 2256x1504, 13.5" | |
|---|---|---|---|---|---|---|
| Power Consumption | 16% | 20% | 4% | 13% | 4% | |
| Idle Minimum * (Watt) | 5.3 | 4.2 21% | 2.6 51% | 4.7 11% | 2.1 60% | 4.4 17% |
| Idle Average * (Watt) | 7.8 | 6.9 12% | 5.3 32% | 8.3 -6% | 6.9 12% | 7.5 4% |
| Idle Maximum * (Watt) | 9.8 | 7.5 23% | 7 29% | 9 8% | 7.8 20% | 7.8 20% |
| Load Average * (Watt) | 46 | 33.3 28% | 43.1 6% | 42 9% | 42 9% | 41.9 9% |
| Witcher 3 ultra * (Watt) | 43 | 37.1 14% | 43.1 -0% | 40.8 5% | ||
| Load Maximum * (Watt) | 48.3 | 48.4 -0% | 49 -1% | 49 -1% | 64.5 -34% | 63.9 -32% |
* ... mindre är bättre
| Dell XPS 13 9300 4K UHD i7-1065G7, Iris Plus Graphics G7 (Ice Lake 64 EU), 52 Wh | Dell XPS 13 9300 Core i7-1065G7 i7-1065G7, Iris Plus Graphics G7 (Ice Lake 64 EU), 52 Wh | Dell XPS 13 7390 2-in-1 Core i7 i7-1065G7, Iris Plus Graphics G7 (Ice Lake 64 EU), 51 Wh | Dell XPS 13 7390 Core i7-10710U i7-10710U, UHD Graphics 620, 52 Wh | Apple MacBook Pro 13 2019 2TB3 i5-8257U, Iris Plus Graphics 645, 58.2 Wh | Microsoft Surface Laptop 3 13 Core i5-1035G7 i5-1035G7, Iris Plus Graphics G7 (Ice Lake 64 EU), 45 Wh | |
|---|---|---|---|---|---|---|
| Batteridrifttid | 11% | -21% | -26% | 14% | -27% | |
| WiFi v1.3 (h) | 11.4 | 12.7 11% | 9 -21% | 8.4 -26% | 13 14% | 8.3 -27% |
| Reader / Idle (h) | 34.4 | |||||
| Load (h) | 1.9 |
För
Emot
Läs den fullständiga versionen av den här recensionen på engelska här.
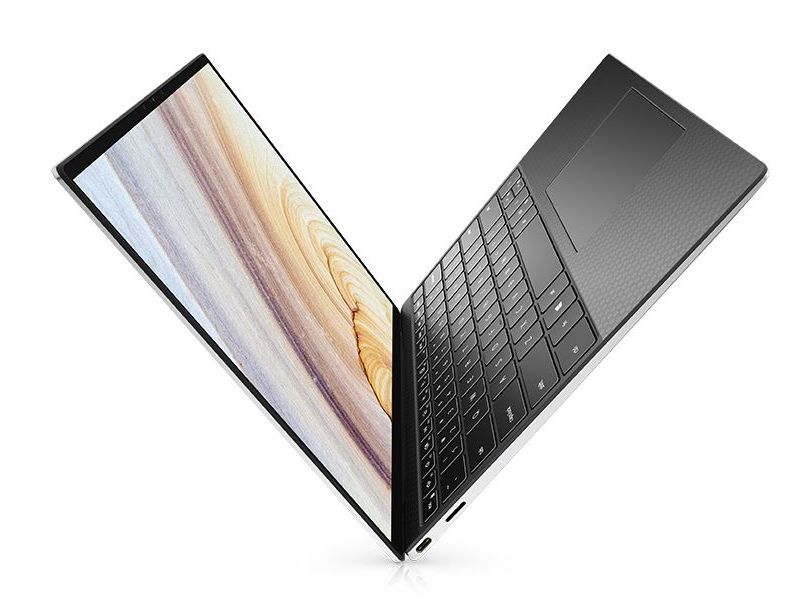
Dell XPS 9300 är unik såtillvida att det är en av få (om inte den enda) Windows-baserade subnotebook-modeller i snäckskalsformat som har en tryckkänslig 16:10-skärm med 4K UHD-upplösning. Om du överväger 4K UHD-alternativet istället för FHD-varianten finns det några fördelar och nackdelar att ha i åtanke.
Först till fördelarna: Utöver en tätare upplösning och en skarpare bild har 4K-alternativet snabbare svart-vita och grå-grå responstider än FHD-alternativet, vilket leder till att man upplever mindre ghosting. Pulsbreddsmodulering förekommer inte alls, ett fenomen som är närvarande på FHD-modellerna. Kontrast och färgrymd är i princip helt identiska med FHD-panelen vilket innebär att man inte hamnar efter på den punkten heller om man väljer den mer högupplösta skärmen.
Den största nackdelen med 4K-alternativet är att den inte är lika ljusstark som FHD-skärmen. Skillnaden är inte stor nog för att spela någon roll när man arbetar inomhus, men varje extra nit av ljusstyrka är bra att ha om man vill använda datorn utomhus regelbundet. Batteritiden är dessutom en till två timmar kortare, men det gör ingen större skillnad med tanke på hur lång batteritid XPS 13 har totalt sett.
4K-alternativet har en del oväntade fördelar jämfört med FHD-versionen, vilket inkluderar snabbare responstider och ingen pulsbreddsmodulering. Om du gillar att arbeta i farten kan däremot FHD-versionen vara bättre helt enkelt eftersom den är 50 procent mer ljusstark än 4K-alternativet.
Dell XPS 13 9300 4K UHD
- 05/15/2020 v7 (old)
Allen Ngo
Price comparison
