Test: Hot Ice - Dell XPS 13 7390 2-in-1 Core i3 (Sammanfattning)
| SD Card Reader | |
| average JPG Copy Test (av. of 3 runs) | |
| Dell XPS 13 9380 2019 (Toshiba Exceria Pro SDXC 64 GB UHS-II) | |
| Dell XPS 13 7390 2-in-1 Core i3 (Toshiba Exceria Pro M501 64 GB UHS-II) | |
| HP Spectre x360 13-ap0312ng (Toshiba Exceria Pro M501 64 GB UHS-II) | |
| Dell XPS 13-9365 2-in-1 (Toshiba THN-M401S0640E2) | |
| maximum AS SSD Seq Read Test (1GB) | |
| Dell XPS 13 7390 2-in-1 Core i3 (Toshiba Exceria Pro M501 64 GB UHS-II) | |
| HP Spectre x360 13-ap0312ng (Toshiba Exceria Pro M501 64 GB UHS-II) | |
| Dell XPS 13 9380 2019 (Toshiba Exceria Pro SDXC 64 GB UHS-II) | |
| Dell XPS 13-9365 2-in-1 (Toshiba THN-M401S0640E2) | |
| Networking | |
| iperf3 transmit AX12 | |
| HP Spectre x360 13-ap0312ng | |
| Dell XPS 13 9380 2019 | |
| Dell XPS 13 7390 2-in-1 Core i3 | |
| Dell XPS 13-9365 2-in-1 | |
| iperf3 receive AX12 | |
| Dell XPS 13 7390 2-in-1 Core i3 | |
| HP Spectre x360 13-ap0312ng | |
| Dell XPS 13 9380 2019 | |
| Dell XPS 13-9365 2-in-1 | |
| |||||||||||||||||||||||||
Distribution av ljusstyrkan: 88 %
Mitt på batteriet: 576.3 cd/m²
Kontrast: 1746:1 (Svärta: 0.33 cd/m²)
ΔE ColorChecker Calman: 1.45 | ∀{0.5-29.43 Ø4.73}
calibrated: 1.19
ΔE Greyscale Calman: 3.1 | ∀{0.09-98 Ø4.97}
98.5% sRGB (Argyll 1.6.3 3D)
64.2% AdobeRGB 1998 (Argyll 1.6.3 3D)
70.4% AdobeRGB 1998 (Argyll 3D)
98.2% sRGB (Argyll 3D)
68.6% Display P3 (Argyll 3D)
Gamma: 2.27
CCT: 6931 K
| Dell XPS 13 7390 2-in-1 Core i3 Sharp LQ134N1, IPS, 13.4", 1920x1200 | Dell XPS 13 9380 2019 ID: AUO 282B B133ZAN Dell: 90NTH, IPS, 13.3", 3840x2160 | Dell XPS 13-9365 2-in-1 IPS, 13.3", 1920x1080 | HP Spectre x360 13-ap0312ng M133NVF3, IPS, 13.3", 1920x1080 | Lenovo Yoga C930-13IKB 81C4 AUO B139HAN03_0, IPS, 13.9", 1920x1080 | Asus ZenBook S13 UX392FN Tianma XM, IPS, 13.9", 1920x1080 | |
|---|---|---|---|---|---|---|
| Display | -6% | -30% | -9% | -8% | -2% | |
| Display P3 Coverage (%) | 68.6 | 64.7 -6% | 47.32 -31% | 63 -8% | 62.7 -9% | 67.5 -2% |
| sRGB Coverage (%) | 98.2 | 93.1 -5% | 71.1 -28% | 89.8 -9% | 92.6 -6% | 95.8 -2% |
| AdobeRGB 1998 Coverage (%) | 70.4 | 65.3 -7% | 48.83 -31% | 64.1 -9% | 64.7 -8% | 69 -2% |
| Response Times | -17% | -1% | 39% | 25% | 12% | |
| Response Time Grey 50% / Grey 80% * (ms) | 46 ? | 58 ? -26% | 48 ? -4% | 29.2 ? 37% | 34.4 ? 25% | 47.2 ? -3% |
| Response Time Black / White * (ms) | 33.6 ? | 36 ? -7% | 32.8 ? 2% | 20 ? 40% | 25.6 ? 24% | 24.8 ? 26% |
| PWM Frequency (Hz) | 2525 ? | 1042 ? | 1000 ? | |||
| Screen | -43% | -86% | -60% | -103% | -11% | |
| Brightness middle (cd/m²) | 576.3 | 404 -30% | 322.6 -44% | 272 -53% | 312 -46% | 466 -19% |
| Brightness (cd/m²) | 555 | 389 -30% | 306 -45% | 298 -46% | 295 -47% | 462 -17% |
| Brightness Distribution (%) | 88 | 85 -3% | 91 3% | 84 -5% | 87 -1% | 90 2% |
| Black Level * (cd/m²) | 0.33 | 0.37 -12% | 0.19 42% | 0.39 -18% | 0.43 -30% | 0.33 -0% |
| Contrast (:1) | 1746 | 1092 -37% | 1698 -3% | 697 -60% | 726 -58% | 1412 -19% |
| Colorchecker dE 2000 * | 1.45 | 3.72 -157% | 7.7 -431% | 4.3 -197% | 7.6 -424% | 1.93 -33% |
| Colorchecker dE 2000 max. * | 4.12 | 7.38 -79% | 11.1 -169% | 9 -118% | 15.06 -266% | 4.26 -3% |
| Colorchecker dE 2000 calibrated * | 1.19 | 2.06 -73% | 2.4 -102% | 1.96 -65% | 1.99 -67% | |
| Greyscale dE 2000 * | 3.1 | 4.44 -43% | 7.9 -155% | 4.4 -42% | 8.8 -184% | 1.7 45% |
| Gamma | 2.27 97% | 2.34 94% | 2.88 76% | 1.97 112% | 2.01 109% | 2.15 102% |
| CCT | 6931 94% | 7095 92% | 7044 92% | 5825 112% | 6874 95% | 6382 102% |
| Color Space (Percent of AdobeRGB 1998) (%) | 64.2 | 60 -7% | 44.1 -31% | 58.9 -8% | 59.1 -8% | 62.2 -3% |
| Color Space (Percent of sRGB) (%) | 98.5 | 93 -6% | 69.9 -29% | 89.8 -9% | 92.3 -6% | 95.7 -3% |
| Totalt genomsnitt (program/inställningar) | -22% /
-33% | -39% /
-64% | -10% /
-38% | -29% /
-69% | -0% /
-6% |
* ... mindre är bättre
Visa svarstider
| ↔ Svarstid svart till vitt | ||
|---|---|---|
| 33.6 ms ... stiga ↗ och falla ↘ kombinerat | ↗ 19.2 ms stiga | 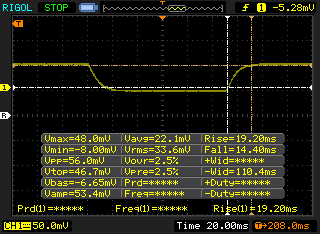 |
| ↘ 14.4 ms hösten | ||
| Skärmen visar långsamma svarsfrekvenser i våra tester och kommer att vara otillfredsställande för spelare. I jämförelse sträcker sig alla testade enheter från 0.1 (minst) till 240 (maximalt) ms. » 90 % av alla enheter är bättre. Detta innebär att den uppmätta svarstiden är sämre än genomsnittet av alla testade enheter (19.9 ms). | ||
| ↔ Svarstid 50 % grått till 80 % grått | ||
| 46 ms ... stiga ↗ och falla ↘ kombinerat | ↗ 23.2 ms stiga | 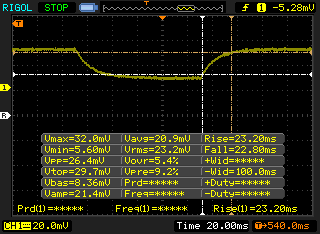 |
| ↘ 22.8 ms hösten | ||
| Skärmen visar långsamma svarsfrekvenser i våra tester och kommer att vara otillfredsställande för spelare. I jämförelse sträcker sig alla testade enheter från 0.165 (minst) till 636 (maximalt) ms. » 79 % av alla enheter är bättre. Detta innebär att den uppmätta svarstiden är sämre än genomsnittet av alla testade enheter (31.1 ms). | ||
Skärmflimmer / PWM (Puls-Width Modulation)
| Skärmflimmer / PWM upptäckt | 2525 Hz | ≤ 25 % ljusstyrka inställning | 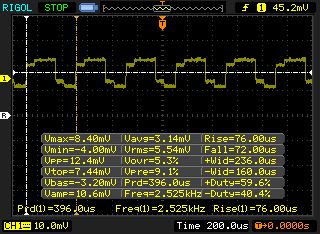 |
Displayens bakgrundsbelysning flimrar vid 2525 Hz (i värsta fall, t.ex. med PWM) Flimrande upptäckt vid en ljusstyrkeinställning på 25 % och lägre. Det ska inte finnas något flimmer eller PWM över denna ljusstyrkeinställning. Frekvensen för 2525 Hz är ganska hög, så de flesta användare som är känsliga för PWM bör inte märka något flimmer. Som jämförelse: 52 % av alla testade enheter använder inte PWM för att dämpa skärmen. Om PWM upptäcktes mättes ett medelvärde av 7798 (minst: 5 - maximum: 343500) Hz. | |||
| Cinebench R15 | |
| CPU Single 64Bit | |
| Lenovo Yoga C930-13IKB 81C4 | |
| HP Spectre x360 13-ap0312ng | |
| Microsoft Surface Pro 6, Core i7, 512 GB | |
| Dell XPS 13 7390 2-in-1 Core i3 | |
| Acer Swift 3 SF314-55-31N8 | |
| Dell XPS 13 9380 2019 | |
| HP EliteBook 735 G5 3UN62EA | |
| Asus VivoBook Flip 14 TP412UA-EC969T | |
| Dell XPS 13-9365 2-in-1 | |
| Lenovo V330-15IKB | |
| Lenovo Thinkpad 13-20J1001BUS | |
| Dell Inspiron 15 3585 (2300U, Vega 6) | |
| CPU Multi 64Bit | |
| Dell XPS 13 9380 2019 | |
| Lenovo Yoga C930-13IKB 81C4 | |
| HP EliteBook 735 G5 3UN62EA | |
| Microsoft Surface Pro 6, Core i7, 512 GB | |
| HP Spectre x360 13-ap0312ng | |
| Dell Inspiron 15 3585 (2300U, Vega 6) | |
| Dell XPS 13 7390 2-in-1 Core i3 | |
| Acer Swift 3 SF314-55-31N8 | |
| Asus VivoBook Flip 14 TP412UA-EC969T | |
| Lenovo V330-15IKB | |
| Dell XPS 13-9365 2-in-1 | |
| Lenovo Thinkpad 13-20J1001BUS | |
| Cinebench R11.5 | |
| CPU Single 64Bit | |
| Dell XPS 13 7390 2-in-1 Core i3 | |
| Acer Swift 3 SF314-55-31N8 | |
| Dell XPS 13-9365 2-in-1 | |
| Lenovo V330-15IKB | |
| Lenovo Thinkpad 13-20J1001BUS | |
| Dell Inspiron 15 3585 (2300U, Vega 6) | |
| CPU Multi 64Bit | |
| Dell XPS 13 7390 2-in-1 Core i3 | |
| Dell Inspiron 15 3585 (2300U, Vega 6) | |
| Acer Swift 3 SF314-55-31N8 | |
| Lenovo V330-15IKB | |
| Dell XPS 13-9365 2-in-1 | |
| Lenovo Thinkpad 13-20J1001BUS | |
| Cinebench R10 | |
| Rendering Multiple CPUs 32Bit | |
| Dell XPS 13 7390 2-in-1 Core i3 | |
| Acer Swift 3 SF314-55-31N8 | |
| Asus VivoBook Flip 14 TP412UA-EC969T | |
| Lenovo V330-15IKB | |
| Dell XPS 13-9365 2-in-1 | |
| Lenovo Thinkpad 13-20J1001BUS | |
| Rendering Single 32Bit | |
| Dell XPS 13 7390 2-in-1 Core i3 | |
| Acer Swift 3 SF314-55-31N8 | |
| Dell XPS 13-9365 2-in-1 | |
| Asus VivoBook Flip 14 TP412UA-EC969T | |
| Lenovo V330-15IKB | |
| Lenovo Thinkpad 13-20J1001BUS | |
| wPrime 2.10 - 1024m | |
| Lenovo Thinkpad 13-20J1001BUS | |
| Dell XPS 13-9365 2-in-1 | |
| Lenovo V330-15IKB | |
| Acer Swift 3 SF314-55-31N8 | |
| Dell XPS 13 7390 2-in-1 Core i3 | |
* ... mindre är bättre
| PCMark 8 Home Score Accelerated v2 | 3240 poäng | |
| PCMark 8 Work Score Accelerated v2 | 4519 poäng | |
| PCMark 10 Score | 3562 poäng | |
Hjälp | ||
| Dell XPS 13 7390 2-in-1 Core i3 Toshiba BG4 KBG40ZPZ256G | Dell XPS 13 9380 2019 SK hynix PC401 HFS256GD9TNG | Asus ZenBook S13 UX392FN WDC PC SN520 SDAPNUW-512G | Microsoft Surface Pro 6, Core i7, 512 GB Toshiba KBG30ZPZ512G | Dell XPS 13-9365 2-in-1 Toshiba NVMe THNSN5256GPUK | Dell Latitude 7300-P99G Samsung SSD PM981 MZVLB512HAJQ | |
|---|---|---|---|---|---|---|
| AS SSD | 11% | 86% | -25% | 5% | 144% | |
| Seq Read (MB/s) | 1558 | 2035 31% | 1224 -21% | 1154 -26% | 1283 -18% | 2749 76% |
| Seq Write (MB/s) | 1103 | 658 -40% | 907 -18% | 393.6 -64% | 735 -33% | 1367 24% |
| 4K Read (MB/s) | 37.52 | 39.74 6% | 41.46 11% | 34.42 -8% | 37.69 0% | 49.94 33% |
| 4K Write (MB/s) | 59 | 105.7 79% | 126.2 114% | 68.9 17% | 96.9 64% | 137.6 133% |
| 4K-64 Read (MB/s) | 1684 | 461 -73% | 1021 -39% | 494.1 -71% | 586 -65% | 987 -41% |
| 4K-64 Write (MB/s) | 198.9 | 300.1 51% | 1251 529% | 171.3 -14% | 204.7 3% | 1465 637% |
| Access Time Read * (ms) | 0.099 | 0.061 38% | 0.053 46% | 0.213 -115% | 0.045 55% | 0.042 58% |
| Access Time Write * (ms) | 0.722 | 0.051 93% | 0.027 96% | 0.3 58% | 0.037 95% | 0.029 96% |
| Score Read (Points) | 1877 | 704 -62% | 1185 -37% | 644 -66% | 752 -60% | 1312 -30% |
| Score Write (Points) | 368 | 471 28% | 1468 299% | 280 -24% | 375 2% | 1739 373% |
| Score Total (Points) | 3180 | 1479 -53% | 3250 2% | 1225 -61% | 1495 -53% | 3662 15% |
| Copy ISO MB/s (MB/s) | 677 | 893 32% | 1404 107% | 985 45% | 950 40% | 2761 308% |
| Copy Program MB/s (MB/s) | 298.4 | 287.9 -4% | 402.4 35% | 143.1 -52% | 263.8 -12% | 622 108% |
| Copy Game MB/s (MB/s) | 496.1 | 618 25% | 902 82% | 676 36% | 726 46% | 1584 219% |
* ... mindre är bättre

| 3DMark 06 Standard Score | 11753 poäng | |
| 3DMark 11 Performance | 2374 poäng | |
| 3DMark Ice Storm Standard Score | 56698 poäng | |
| 3DMark Cloud Gate Standard Score | 8145 poäng | |
| 3DMark Fire Strike Score | 1443 poäng | |
Hjälp | ||
| Rocket League | |
| 1920x1080 High Quality AA:High FX | |
| Huawei MateBook 13 i7 | |
| Lenovo IdeaPad 320s-14IKB | |
| Acer Swift 3 SF313-51-59SZ | |
| Lenovo Flex 14IWL | |
| Dell XPS 13 7390 2-in-1 Core i3 | |
| Samsung Notebook 9 NP930QAA | |
| Acer Switch 5 SW512-52-5819 | |
| Dell Inspiron 15 3585 (2300U, Vega 6) | |
| Dell Inspiron 14 5000 5482 2-in-1 | |
| Fujitsu LifeBook U937 | |
| 1920x1080 Quality AA:Medium FX | |
| Huawei MateBook 13 i7 | |
| Lenovo IdeaPad 320s-14IKB | |
| Dell XPS 13 7390 2-in-1 Core i3 | |
| Acer Swift 3 SF313-51-59SZ | |
| Samsung Notebook 9 NP930QAA | |
| Lenovo Flex 14IWL | |
| Acer Switch 5 SW512-52-5819 | |
| Dell Inspiron 15 3585 (2300U, Vega 6) | |
| Fujitsu LifeBook U937 | |
| Dell Inspiron 14 5000 5482 2-in-1 | |
| 1920x1080 Performance | |
| Lenovo IdeaPad 320s-14IKB | |
| Acer Swift 3 SF313-51-59SZ | |
| Dell XPS 13 7390 2-in-1 Core i3 | |
| Acer Switch 5 SW512-52-5819 | |
| Dell Inspiron 15 3585 (2300U, Vega 6) | |
| Samsung Notebook 9 NP930QAA | |
| Lenovo Flex 14IWL | |
| Fujitsu LifeBook U937 | |
| låg | med. | hög | ultra | |
|---|---|---|---|---|
| StarCraft II: Heart of the Swarm (2013) | 60.5 | 40.5 | 18.9 | |
| BioShock Infinite (2013) | 82.6 | 40 | 34.8 | 11.7 |
| The Witcher 3 (2015) | 29.7 | 19.1 | 10.4 | 5.4 |
| Overwatch (2016) | 71.4 | 52.3 | 23.5 | |
| Rocket League (2017) | 69.5 | 42.2 | 22.8 |
| Dell XPS 13 7390 2-in-1 Core i3 UHD Graphics G1 (Ice Lake 32 EU), i3-1005G1, Toshiba BG4 KBG40ZPZ256G | Dell XPS 13 9380 2019 UHD Graphics 620, i5-8265U, SK hynix PC401 HFS256GD9TNG | Dell XPS 13-9365 2-in-1 HD Graphics 615, i7-7Y75, Toshiba NVMe THNSN5256GPUK | HP Spectre x360 13-ap0312ng UHD Graphics 620, i7-8565U, Toshiba XG5 KXG50ZNV512G | Lenovo Yoga C930-13IKB 81C4 UHD Graphics 620, i5-8550U, SK hynix PC401 HFS256GD9TNG | Asus ZenBook S13 UX392FN GeForce MX150, i7-8565U, WDC PC SN520 SDAPNUW-512G | |
|---|---|---|---|---|---|---|
| Noise | -4% | 1% | 1% | -5% | ||
| av / miljö * (dB) | 28 | 30.4 -9% | 29.2 -4% | 27.9 -0% | 28.1 -0% | |
| Idle Minimum * (dB) | 28 | 30.4 -9% | 29.2 -4% | 27.9 -0% | 28.1 -0% | |
| Idle Average * (dB) | 28 | 30.4 -9% | 29.2 -4% | 27.9 -0% | 28.1 -0% | |
| Idle Maximum * (dB) | 28 | 30.4 -9% | 30.4 -9% | 29.3 -5% | 29 -4% | |
| Load Average * (dB) | 31.7 | 31.7 -0% | 31 2% | 32 -1% | 41.1 -30% | |
| Load Maximum * (dB) | 43.5 | 38.1 12% | 32.1 26% | 39.3 10% | 41.1 6% | |
| Witcher 3 ultra * (dB) | 41.1 |
* ... mindre är bättre
Ljudnivå
| Låg belastning |
| 28 / 28 / 28 dB(A) |
| Hög belastning |
| 31.7 / 43.5 dB(A) |
 | ||
30 dB tyst 40 dB(A) hörbar 50 dB(A) högt ljud |
||
min: | ||
(-) Den maximala temperaturen på ovansidan är 50 °C / 122 F, jämfört med genomsnittet av 35.4 °C / 96 F , allt från 19.6 till 60 °C för klassen Convertible.
(-) Botten värms upp till maximalt 47 °C / 117 F, jämfört med genomsnittet av 36.9 °C / 98 F
(+) Vid tomgångsbruk är medeltemperaturen för ovansidan 28.8 °C / 84 F, jämfört med enhetsgenomsnittet på 30.3 °C / ### class_avg_f### F.
(+) Handledsstöden och pekplattan är kallare än hudtemperaturen med maximalt 31 °C / 87.8 F och är därför svala att ta på.
(-) Medeltemperaturen för handledsstödsområdet på liknande enheter var 28 °C / 82.4 F (-3 °C / -5.4 F).
| Av/Standby | |
| Låg belastning | |
| Hög belastning |
|
Förklaring:
min: | |
| Dell XPS 13 7390 2-in-1 Core i3 i3-1005G1, UHD Graphics G1 (Ice Lake 32 EU), Toshiba BG4 KBG40ZPZ256G, IPS, 1920x1200, 13.4" | Dell XPS 13 9380 2019 i5-8265U, UHD Graphics 620, SK hynix PC401 HFS256GD9TNG, IPS, 3840x2160, 13.3" | Dell XPS 13-9365 2-in-1 i7-7Y75, HD Graphics 615, Toshiba NVMe THNSN5256GPUK, IPS, 1920x1080, 13.3" | HP Spectre x360 13-ap0312ng i7-8565U, UHD Graphics 620, Toshiba XG5 KXG50ZNV512G, IPS, 1920x1080, 13.3" | Lenovo Yoga C930-13IKB 81C4 i5-8550U, UHD Graphics 620, SK hynix PC401 HFS256GD9TNG, IPS, 1920x1080, 13.9" | Asus ZenBook S13 UX392FN i7-8565U, GeForce MX150, WDC PC SN520 SDAPNUW-512G, IPS, 1920x1080, 13.9" | |
|---|---|---|---|---|---|---|
| Power Consumption | -35% | 26% | -19% | -38% | -31% | |
| Idle Minimum * (Watt) | 3 | 4.8 -60% | 3.1 -3% | 4.32 -44% | 3.4 -13% | 3.4 -13% |
| Idle Average * (Watt) | 5.4 | 8.6 -59% | 4.3 20% | 6.84 -27% | 7.5 -39% | 6.3 -17% |
| Idle Maximum * (Watt) | 7.3 | 10.4 -42% | 4.9 33% | 8.64 -18% | 11.8 -62% | 10.4 -42% |
| Load Average * (Watt) | 33.4 | 37.9 -13% | 24.3 27% | 31.8 5% | 47.7 -43% | 51 -53% |
| Load Maximum * (Watt) | 48.3 | 48.5 -0% | 22.8 53% | 53 -10% | 63.2 -31% | 62.7 -30% |
| Witcher 3 ultra * (Watt) | 39 |
* ... mindre är bättre
| Dell XPS 13 7390 2-in-1 Core i3 i3-1005G1, UHD Graphics G1 (Ice Lake 32 EU), 51 Wh | Dell XPS 13 9380 2019 i5-8265U, UHD Graphics 620, 52 Wh | Dell XPS 13-9365 2-in-1 i7-7Y75, HD Graphics 615, 46 Wh | HP Spectre x360 13-ap0312ng i7-8565U, UHD Graphics 620, 61 Wh | Lenovo Yoga C930-13IKB 81C4 i5-8550U, UHD Graphics 620, 60 Wh | Asus ZenBook S13 UX392FN i7-8565U, GeForce MX150, 50 Wh | |
|---|---|---|---|---|---|---|
| Batteridrifttid | -17% | 2% | 3% | 25% | -16% | |
| Reader / Idle (h) | 35.7 | 17.2 -52% | 16.2 -55% | 28.5 -20% | ||
| WiFi v1.3 (h) | 8.9 | 8.3 -7% | 11.4 28% | 8.9 0% | 11.1 25% | 8.4 -6% |
| Load (h) | 2.2 | 2.4 9% | 2.9 32% | 2.3 5% | 1.7 -23% |
För
Emot
Läs den fullständiga versionen av den här recensionen på engelska här.
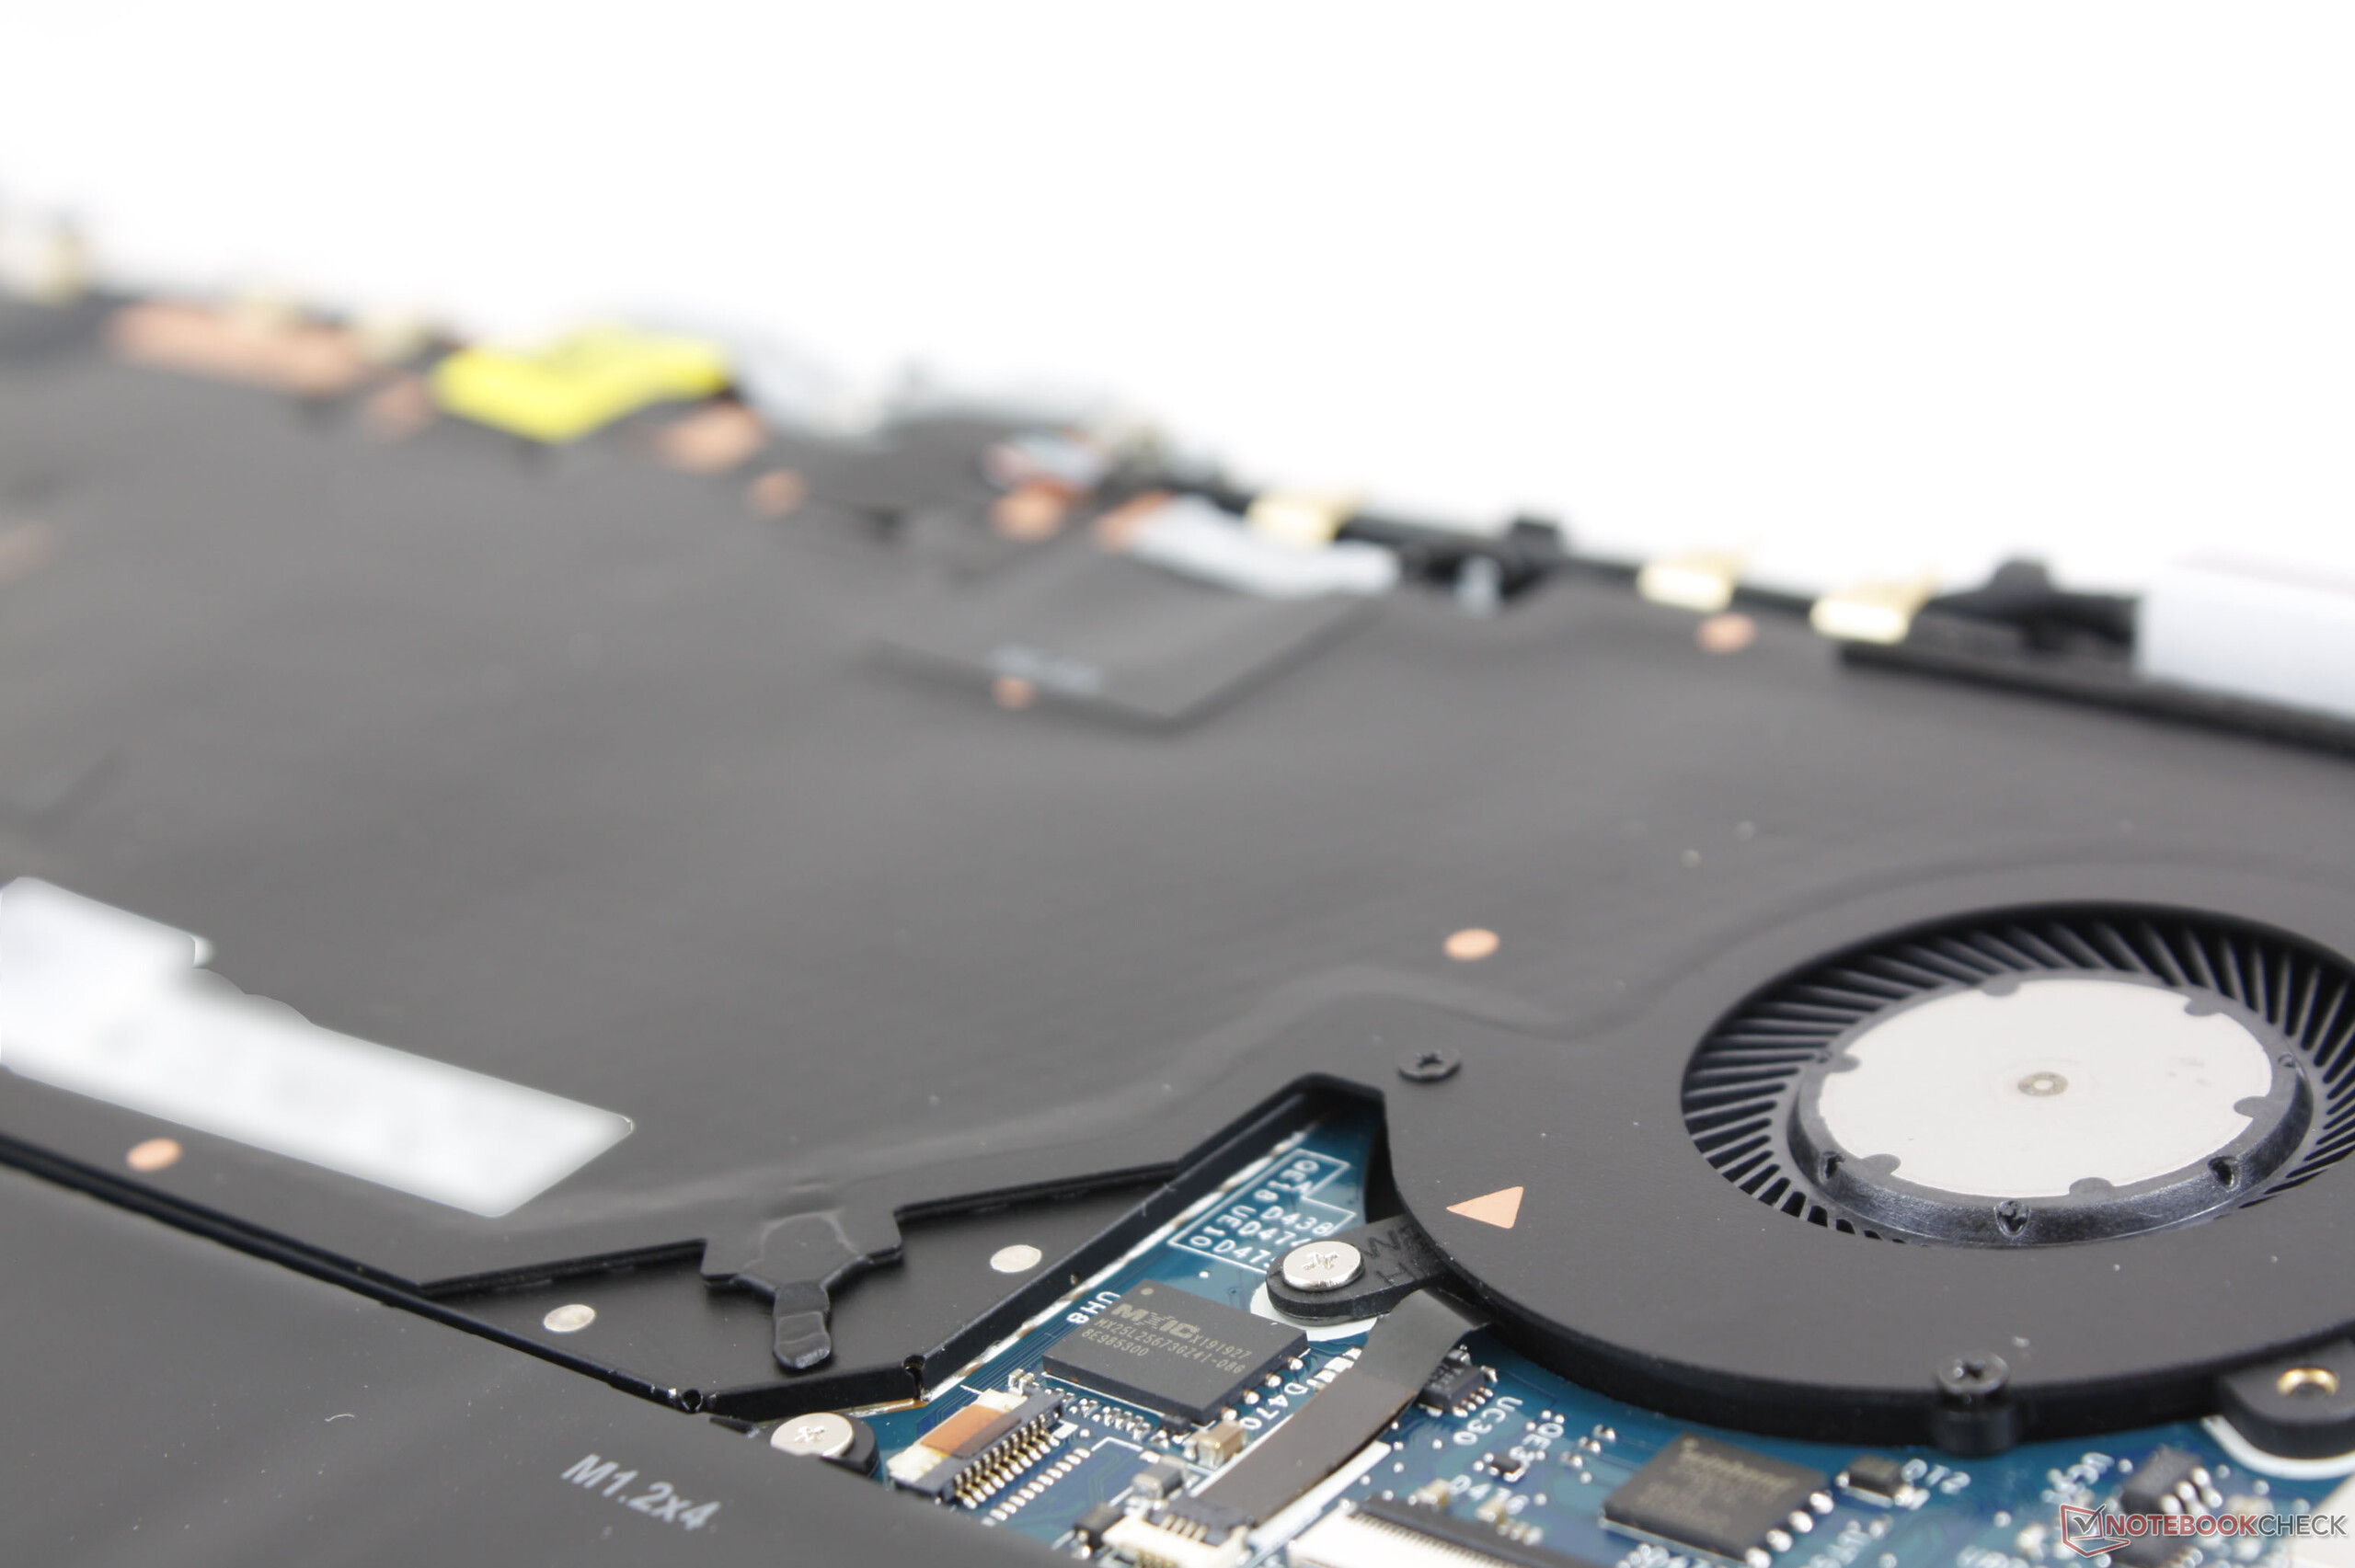
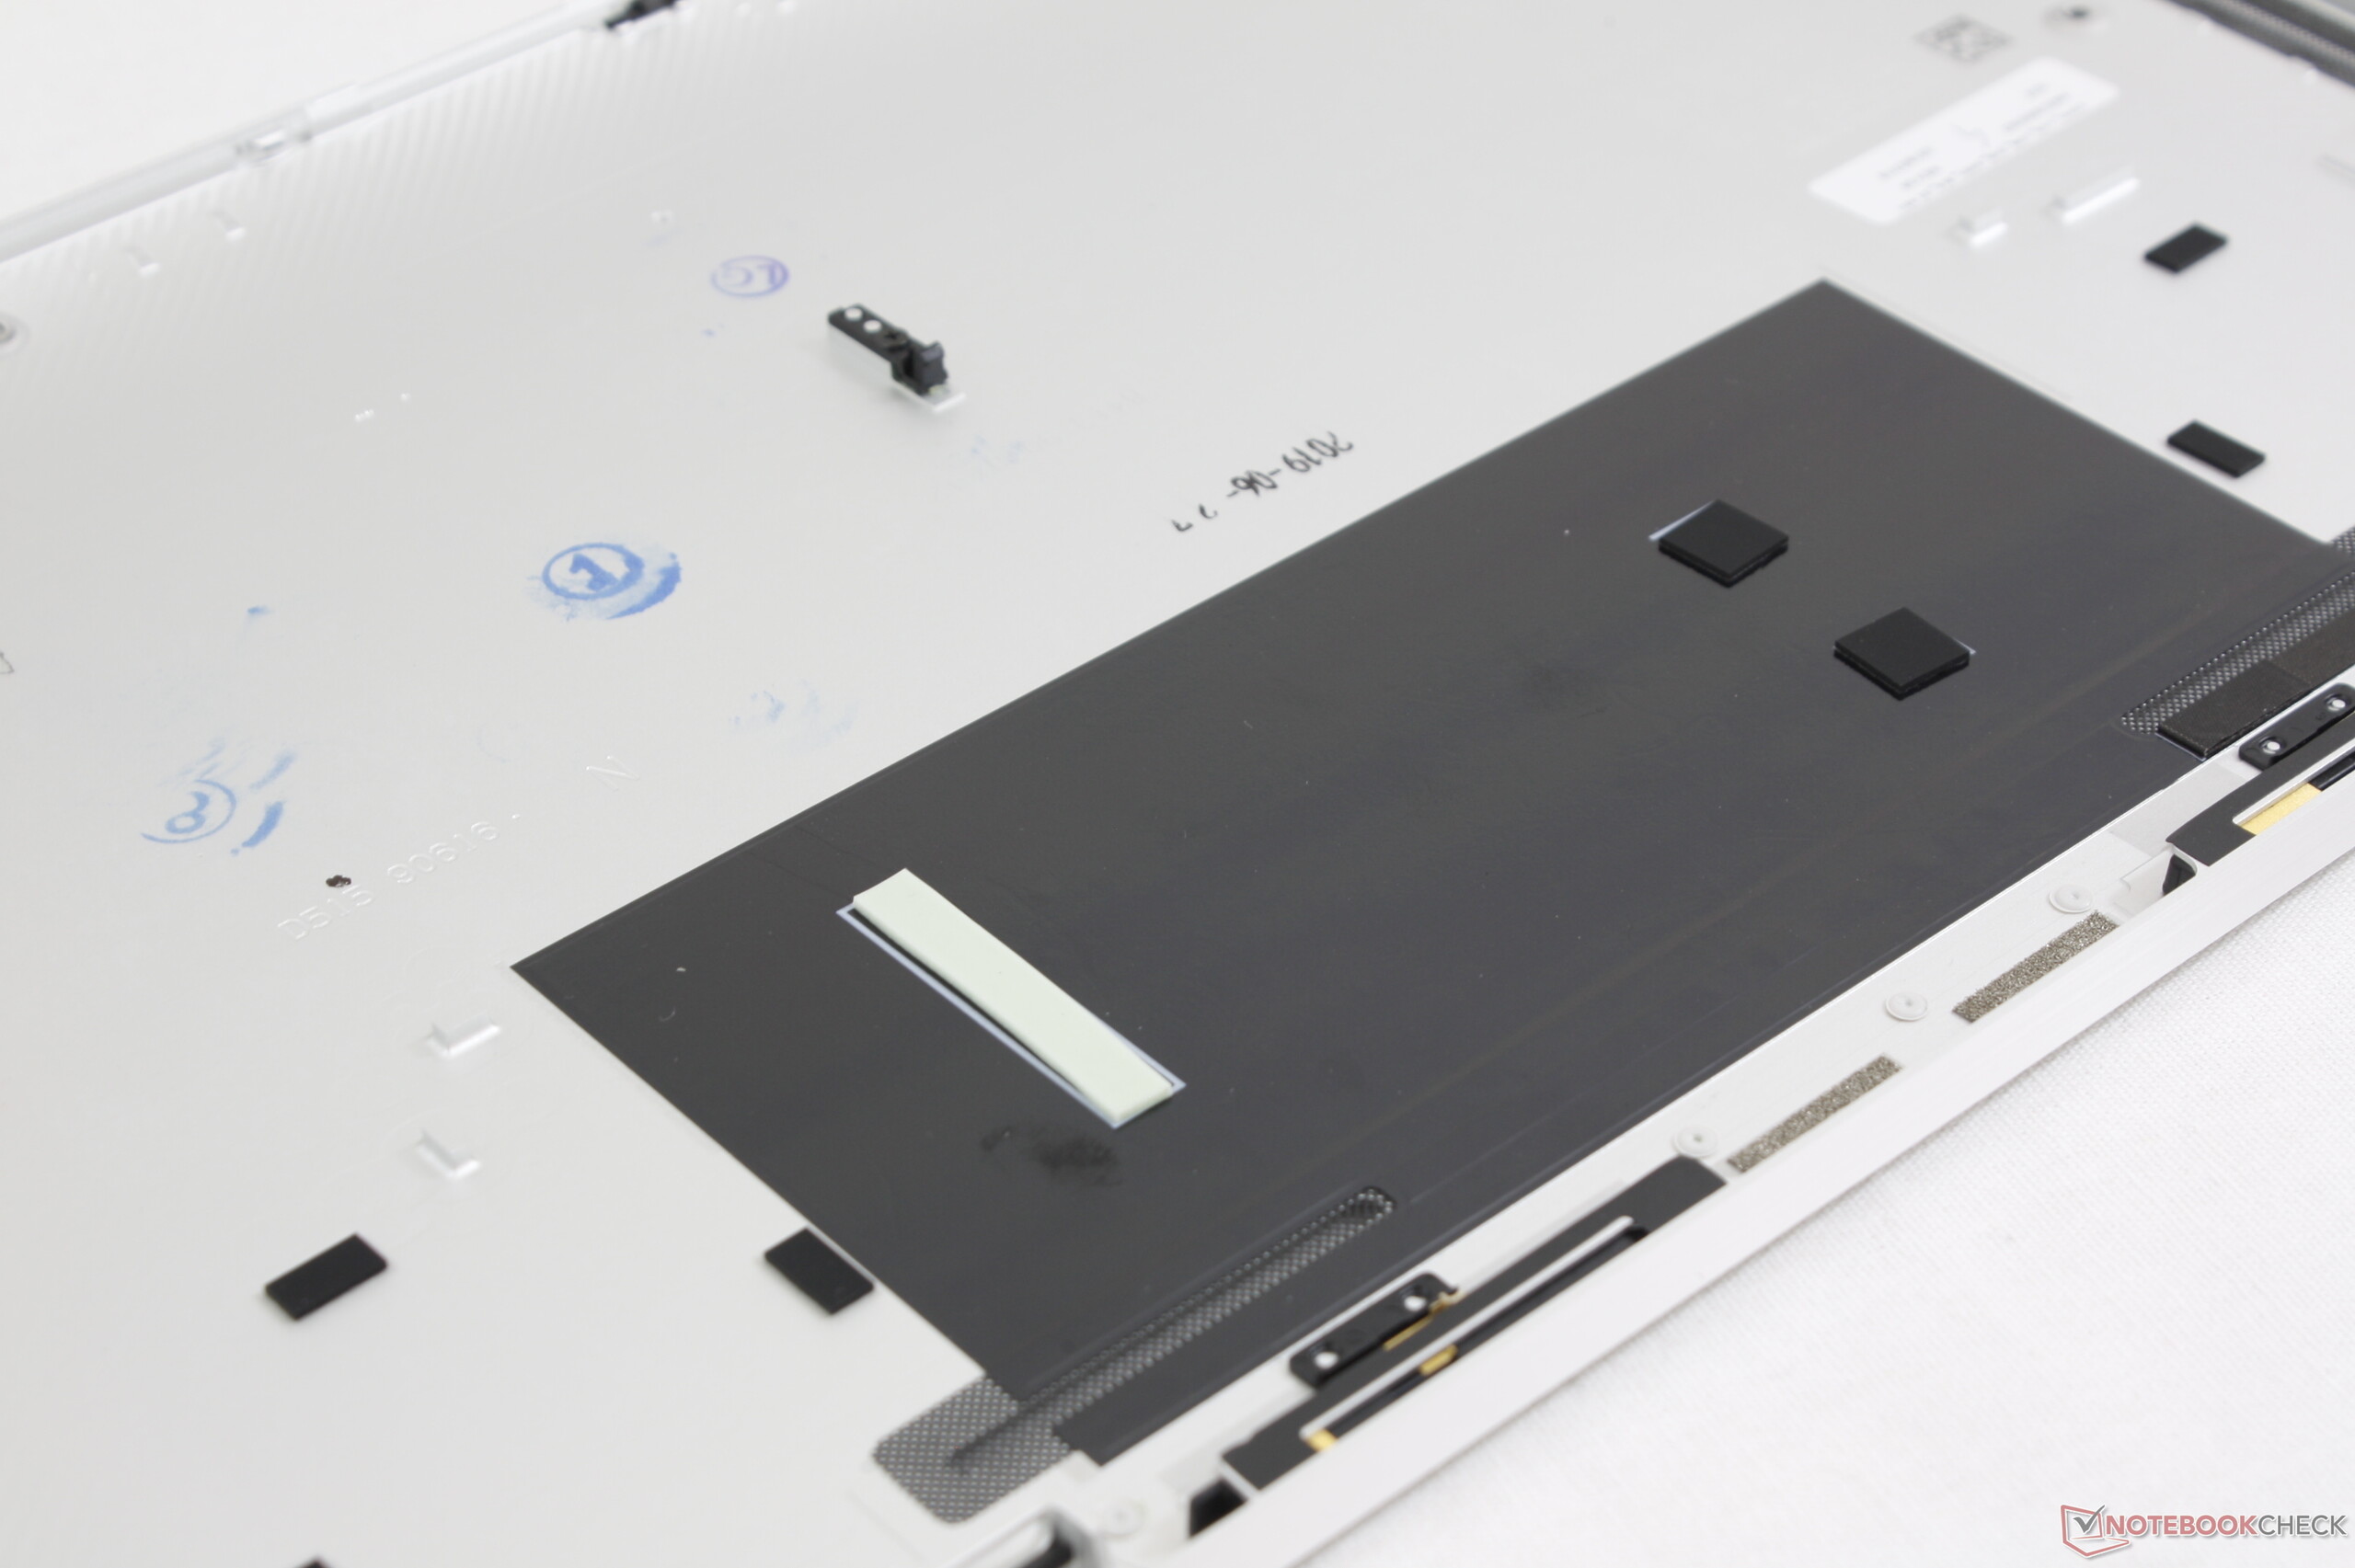
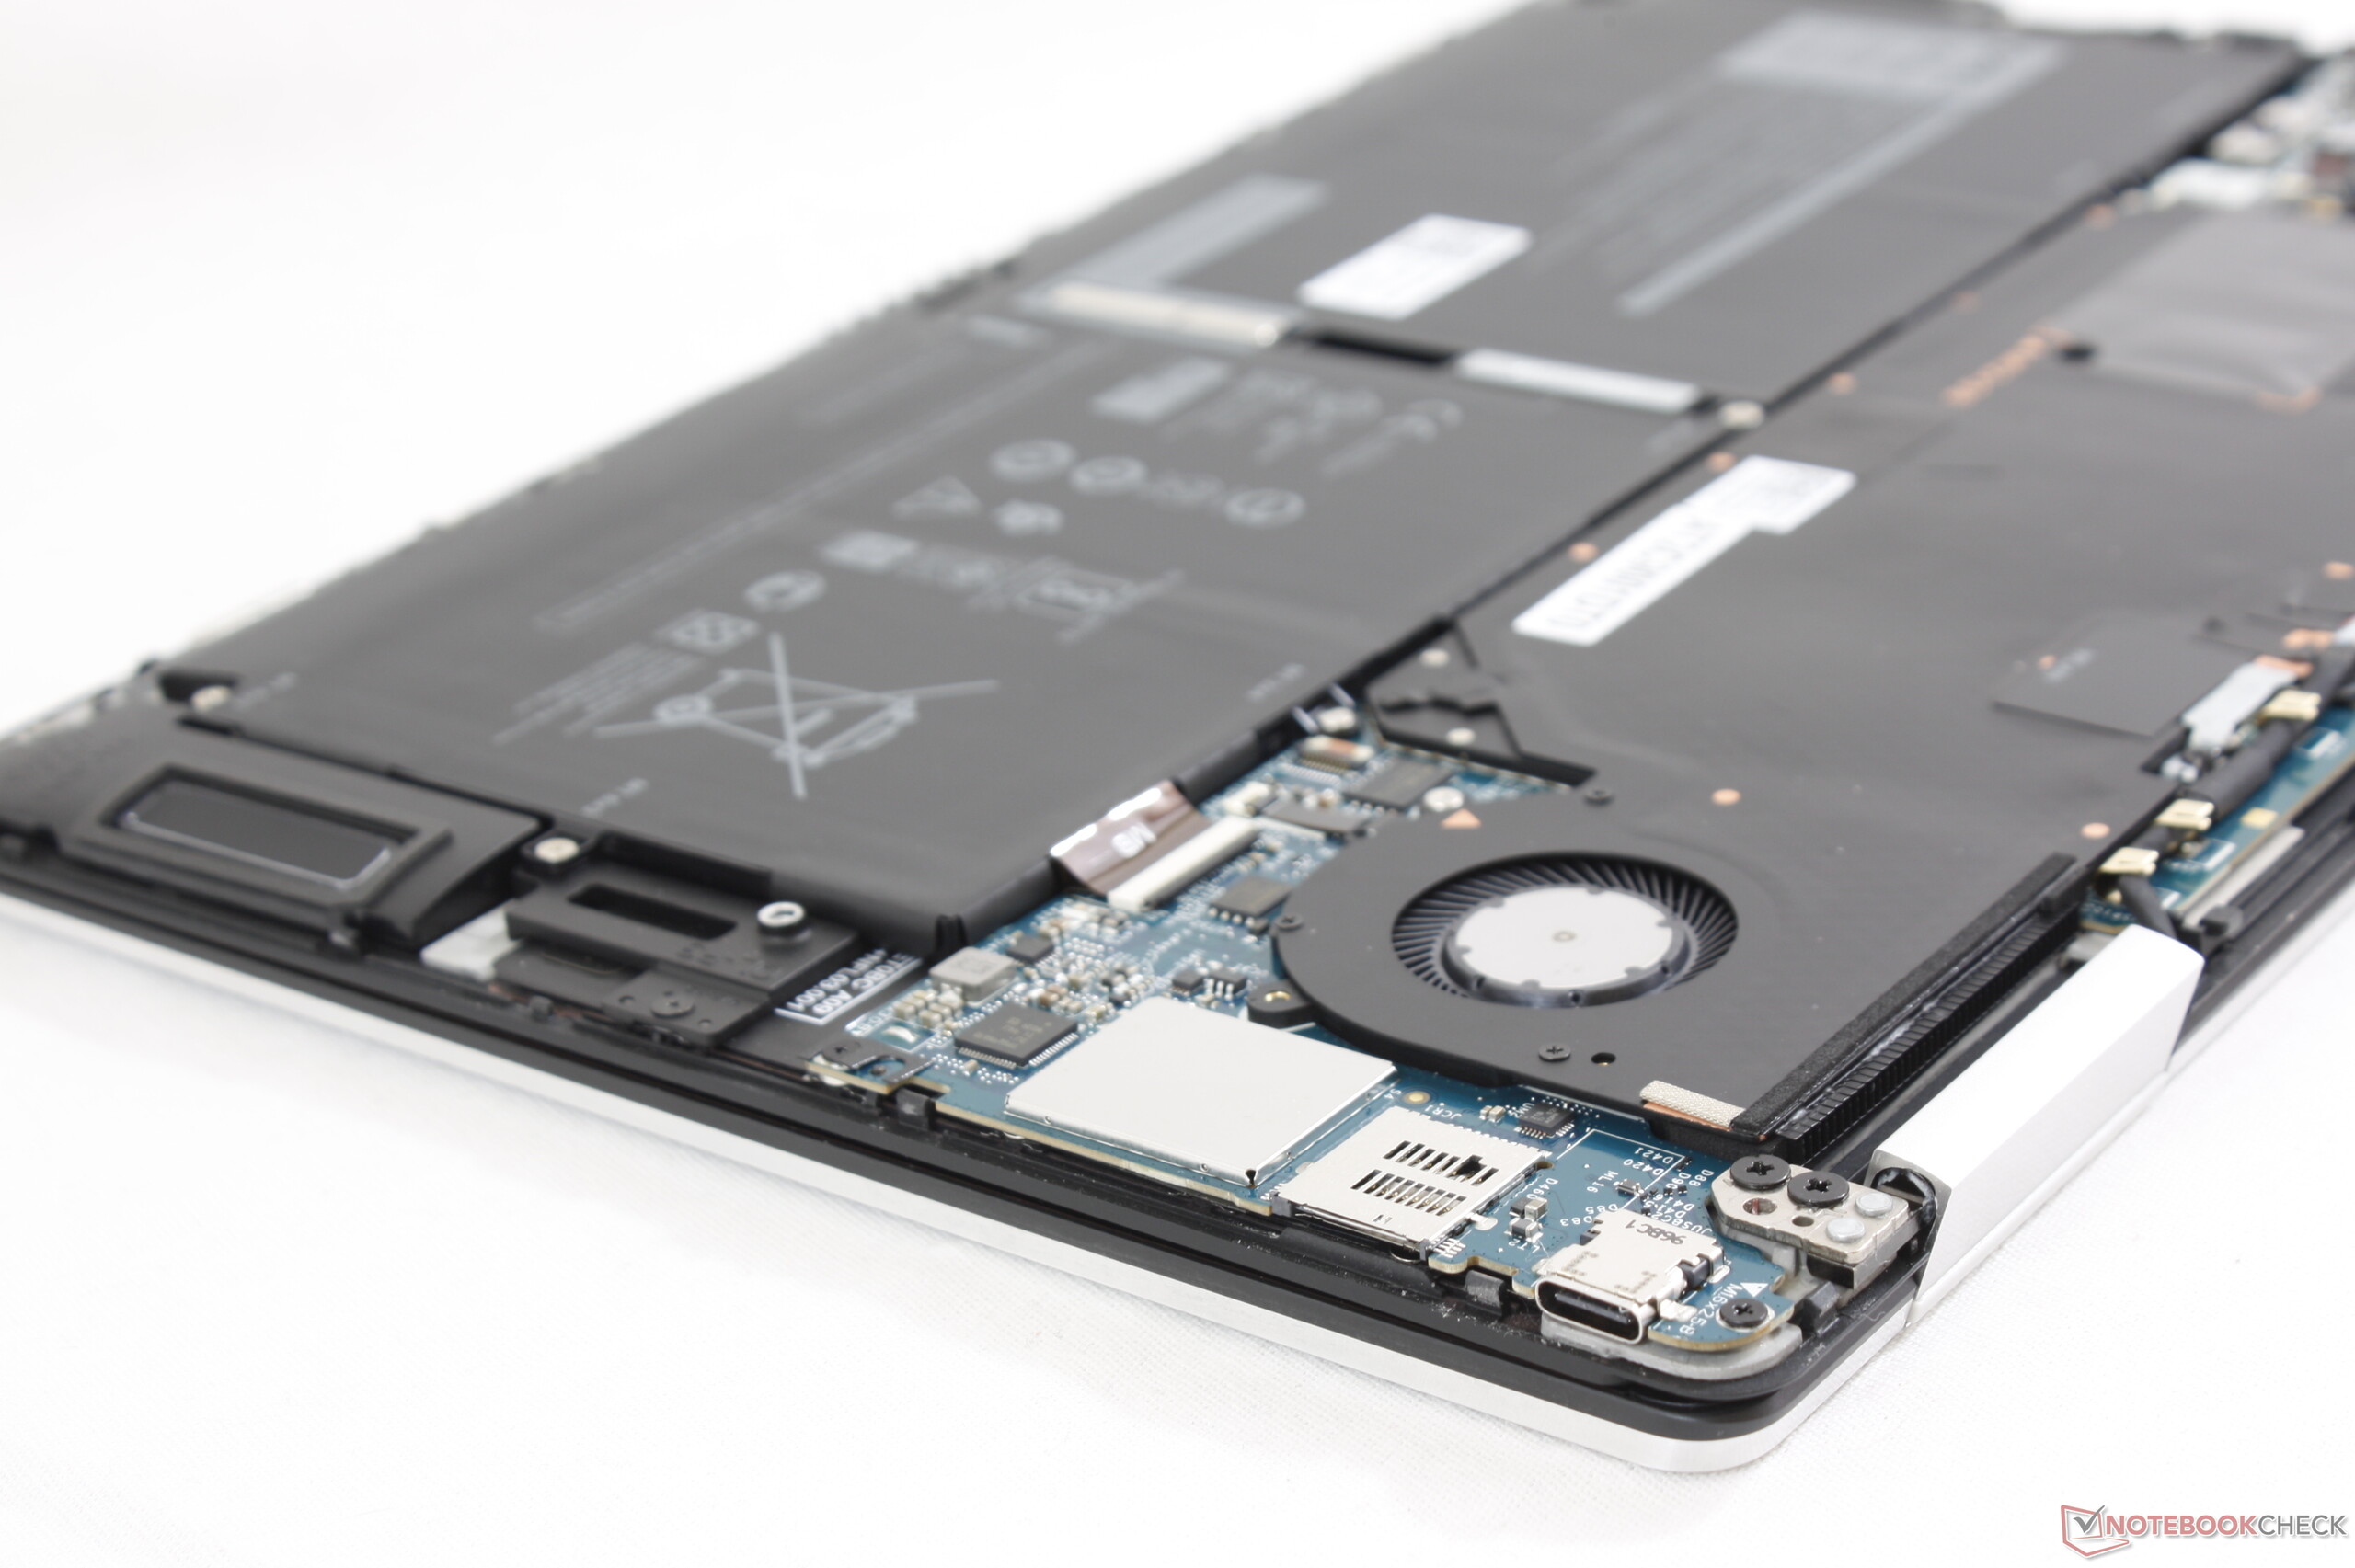
Entusiaster kommer troligen klaga högt över att XPS 13 7390 2-in-1 använder fastlödda komponenter. Men även om det är synd att viktiga saker som RAM, WLAN och till och med lagring inte går att serva eller uppgradera så riktar sig Dell åt en målgrupp som antagligen inte ser detta som avgörande. XPS 13 är tänkt att sluka 2-i-1 marknaden där löstagbara modeller som Surface Pro redan är kraftigt begränsade i fråga om uppgraderingsmöjligheter.
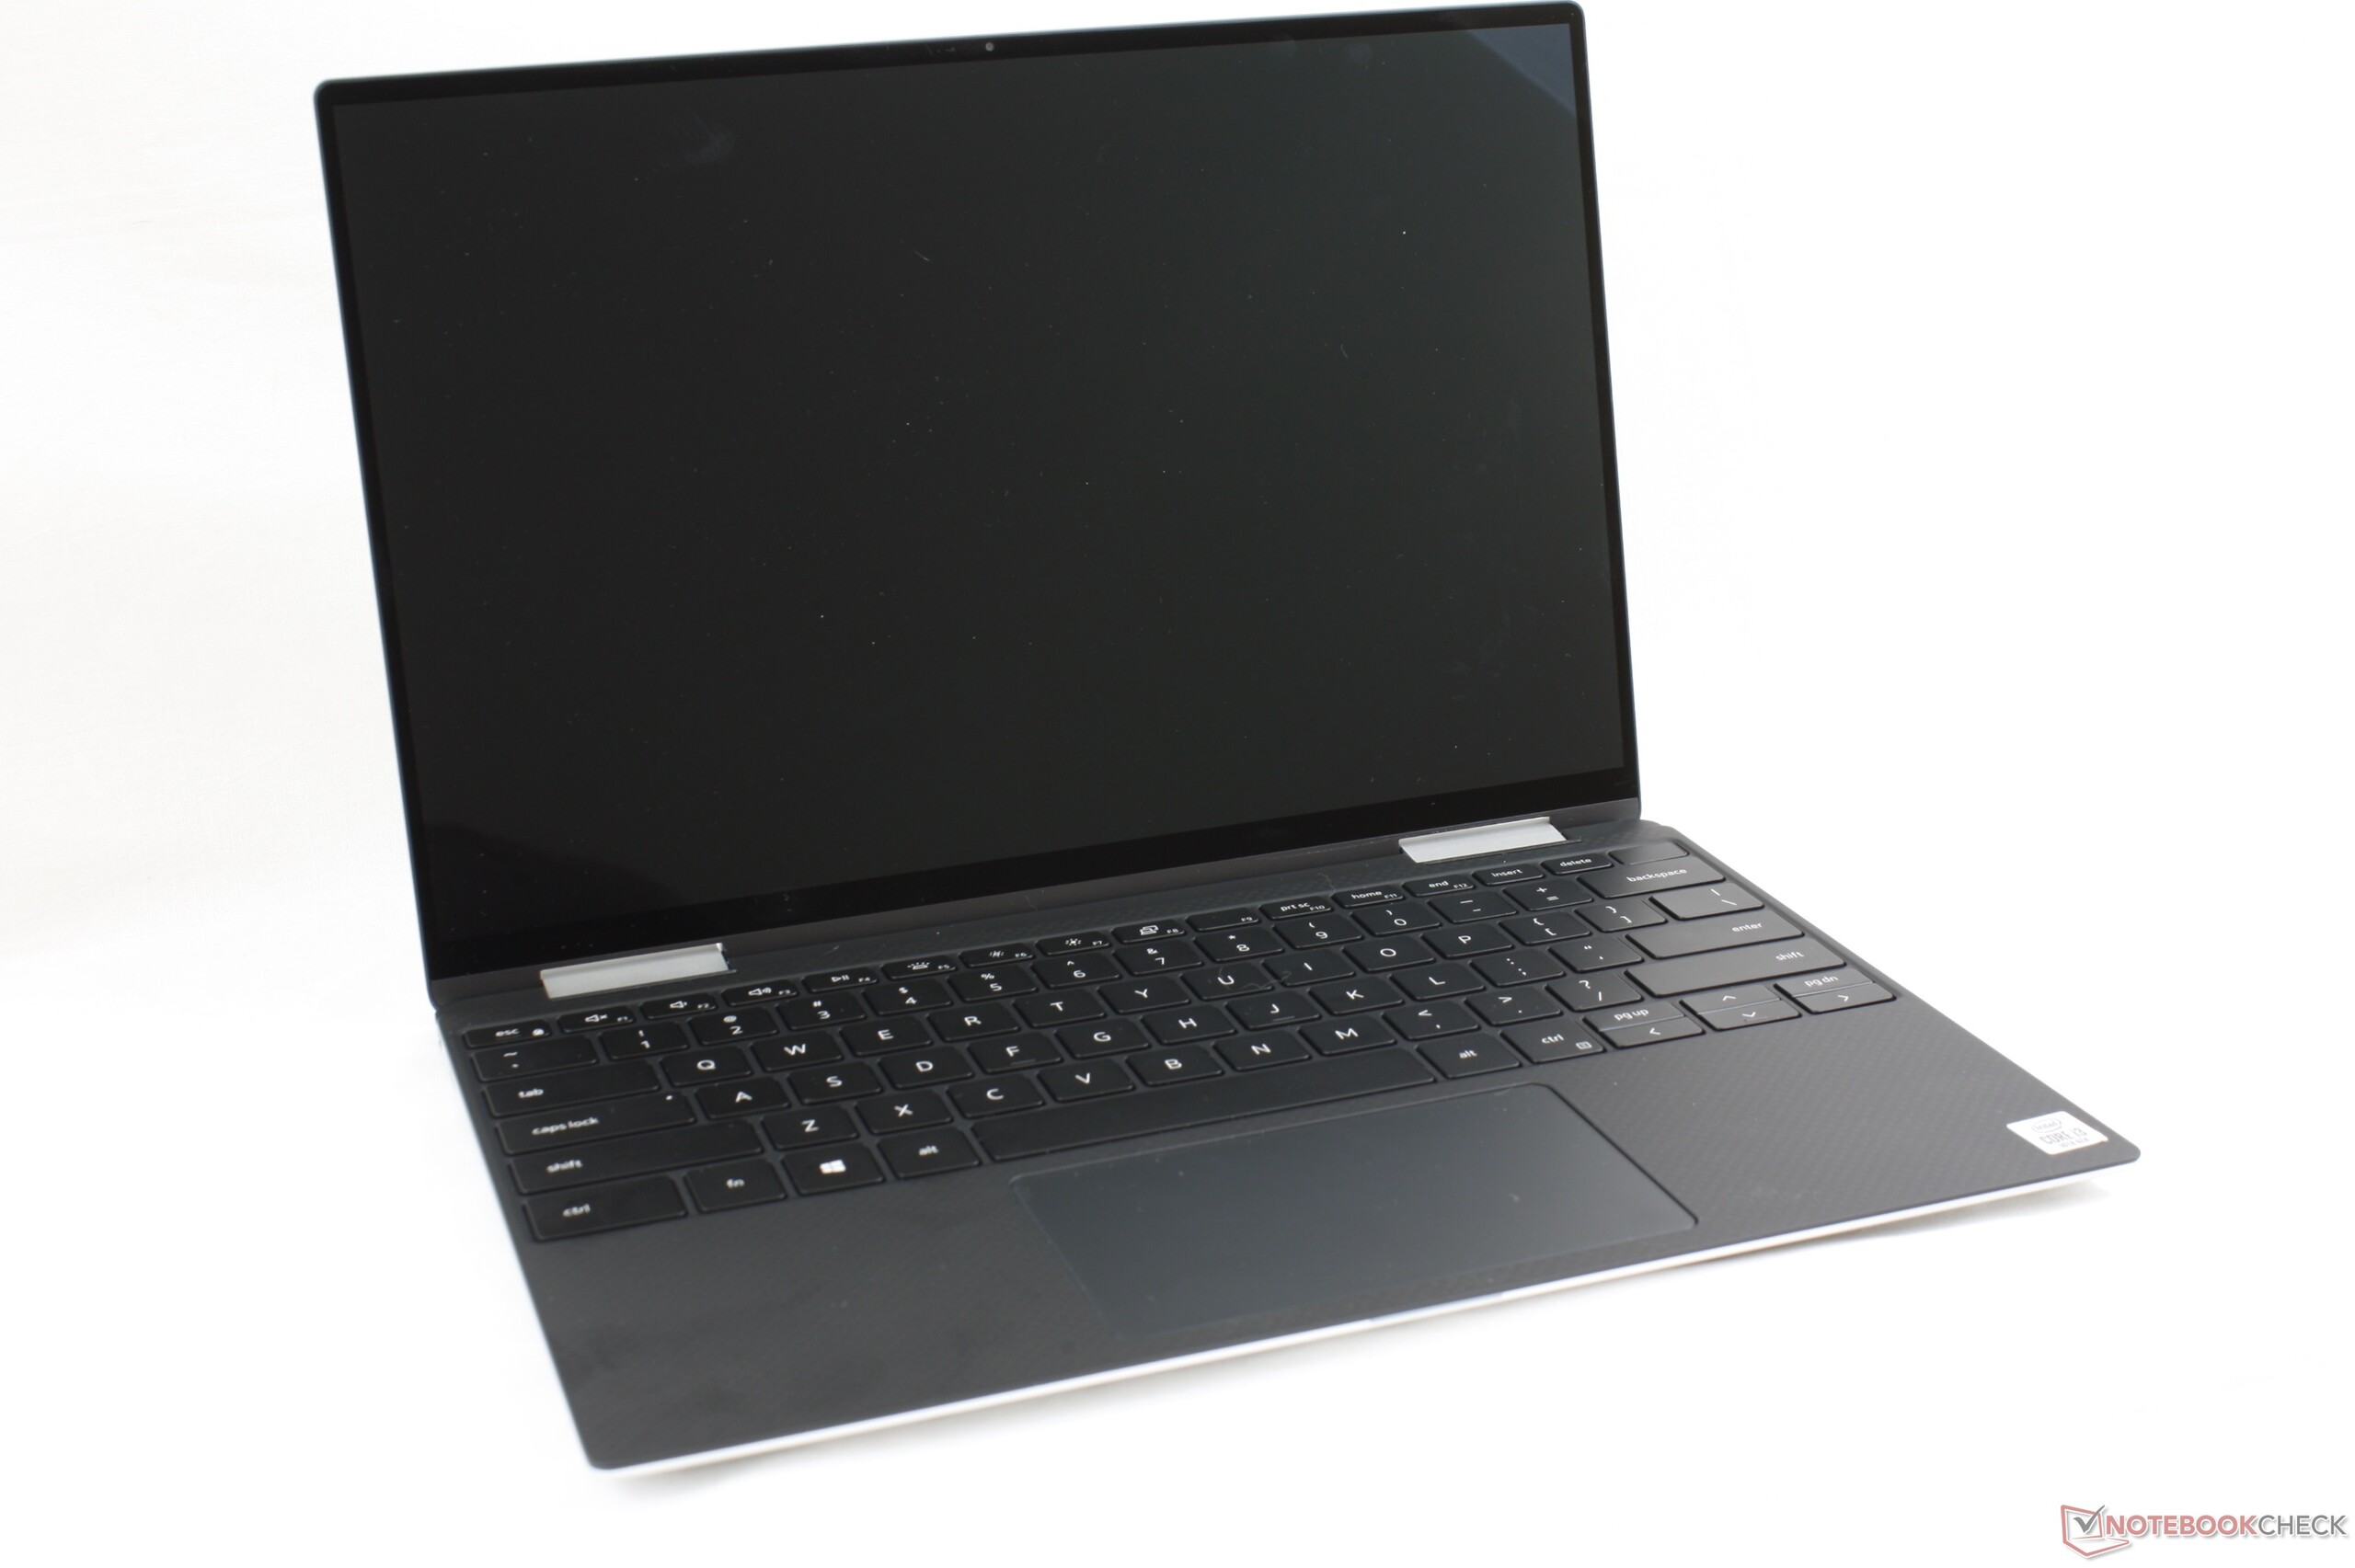
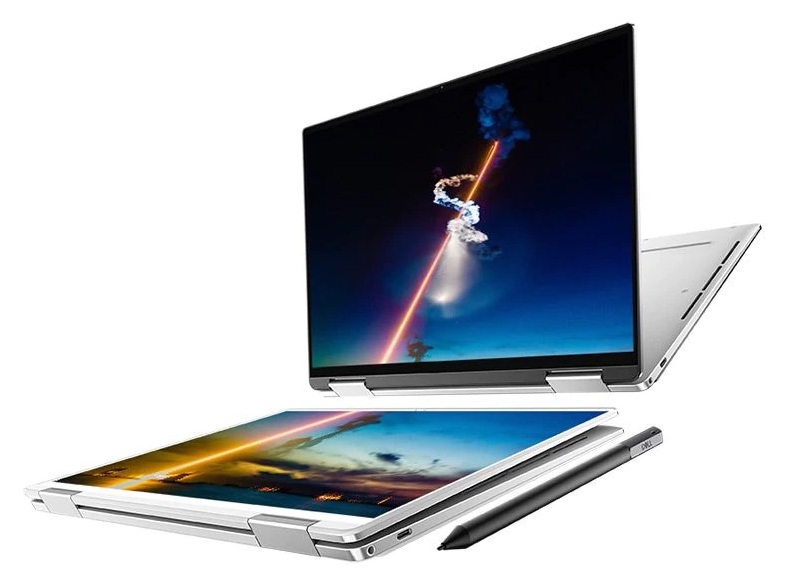
Den bästa egenskapen med Dells omvandlingsbara är skärmen snarare än den nya flashiga Ice Lake U-processorn. Till och med skärmen på den billigaste Core i3-varianten är objektivt sett bättre än skärmarna på många Ultrabook-flaggskepp som kostar flera tusen kronor mer. Den har högre ljusstyrka, bättre kalibrering vid leverans och känns dessutom rymligare än vad de flesta användare är vana vid tack vare det högre 16:10-formatet. Om du alltid önskat dig en omvandlingsbar laptop på 13 tum att använda på resor eller utomhus är detta ditt bästa alternativ med tanke på hur mycket starkare bakgrundsbelysningen är jämfört med konkurrenterna.
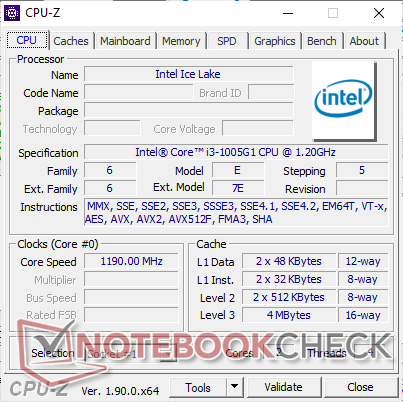
När det kommer till Core i3-1005G1, är dess rena CPU-prestanda bara en aning bättre än Core i3-8145U samtidigt som den erbjuder samma integrerade grafikprestanda som en Core i7-8565U - allt i en mer effektiv 10 nm-design. På så sätt är skillnaden jämfört med förra generationen minimal, men den är fortfarande väldigt mycket bättre än vad den äldre XPS 13 9365-serien kunde erbjuda med Core 7Y54 eller Core 7Y75.
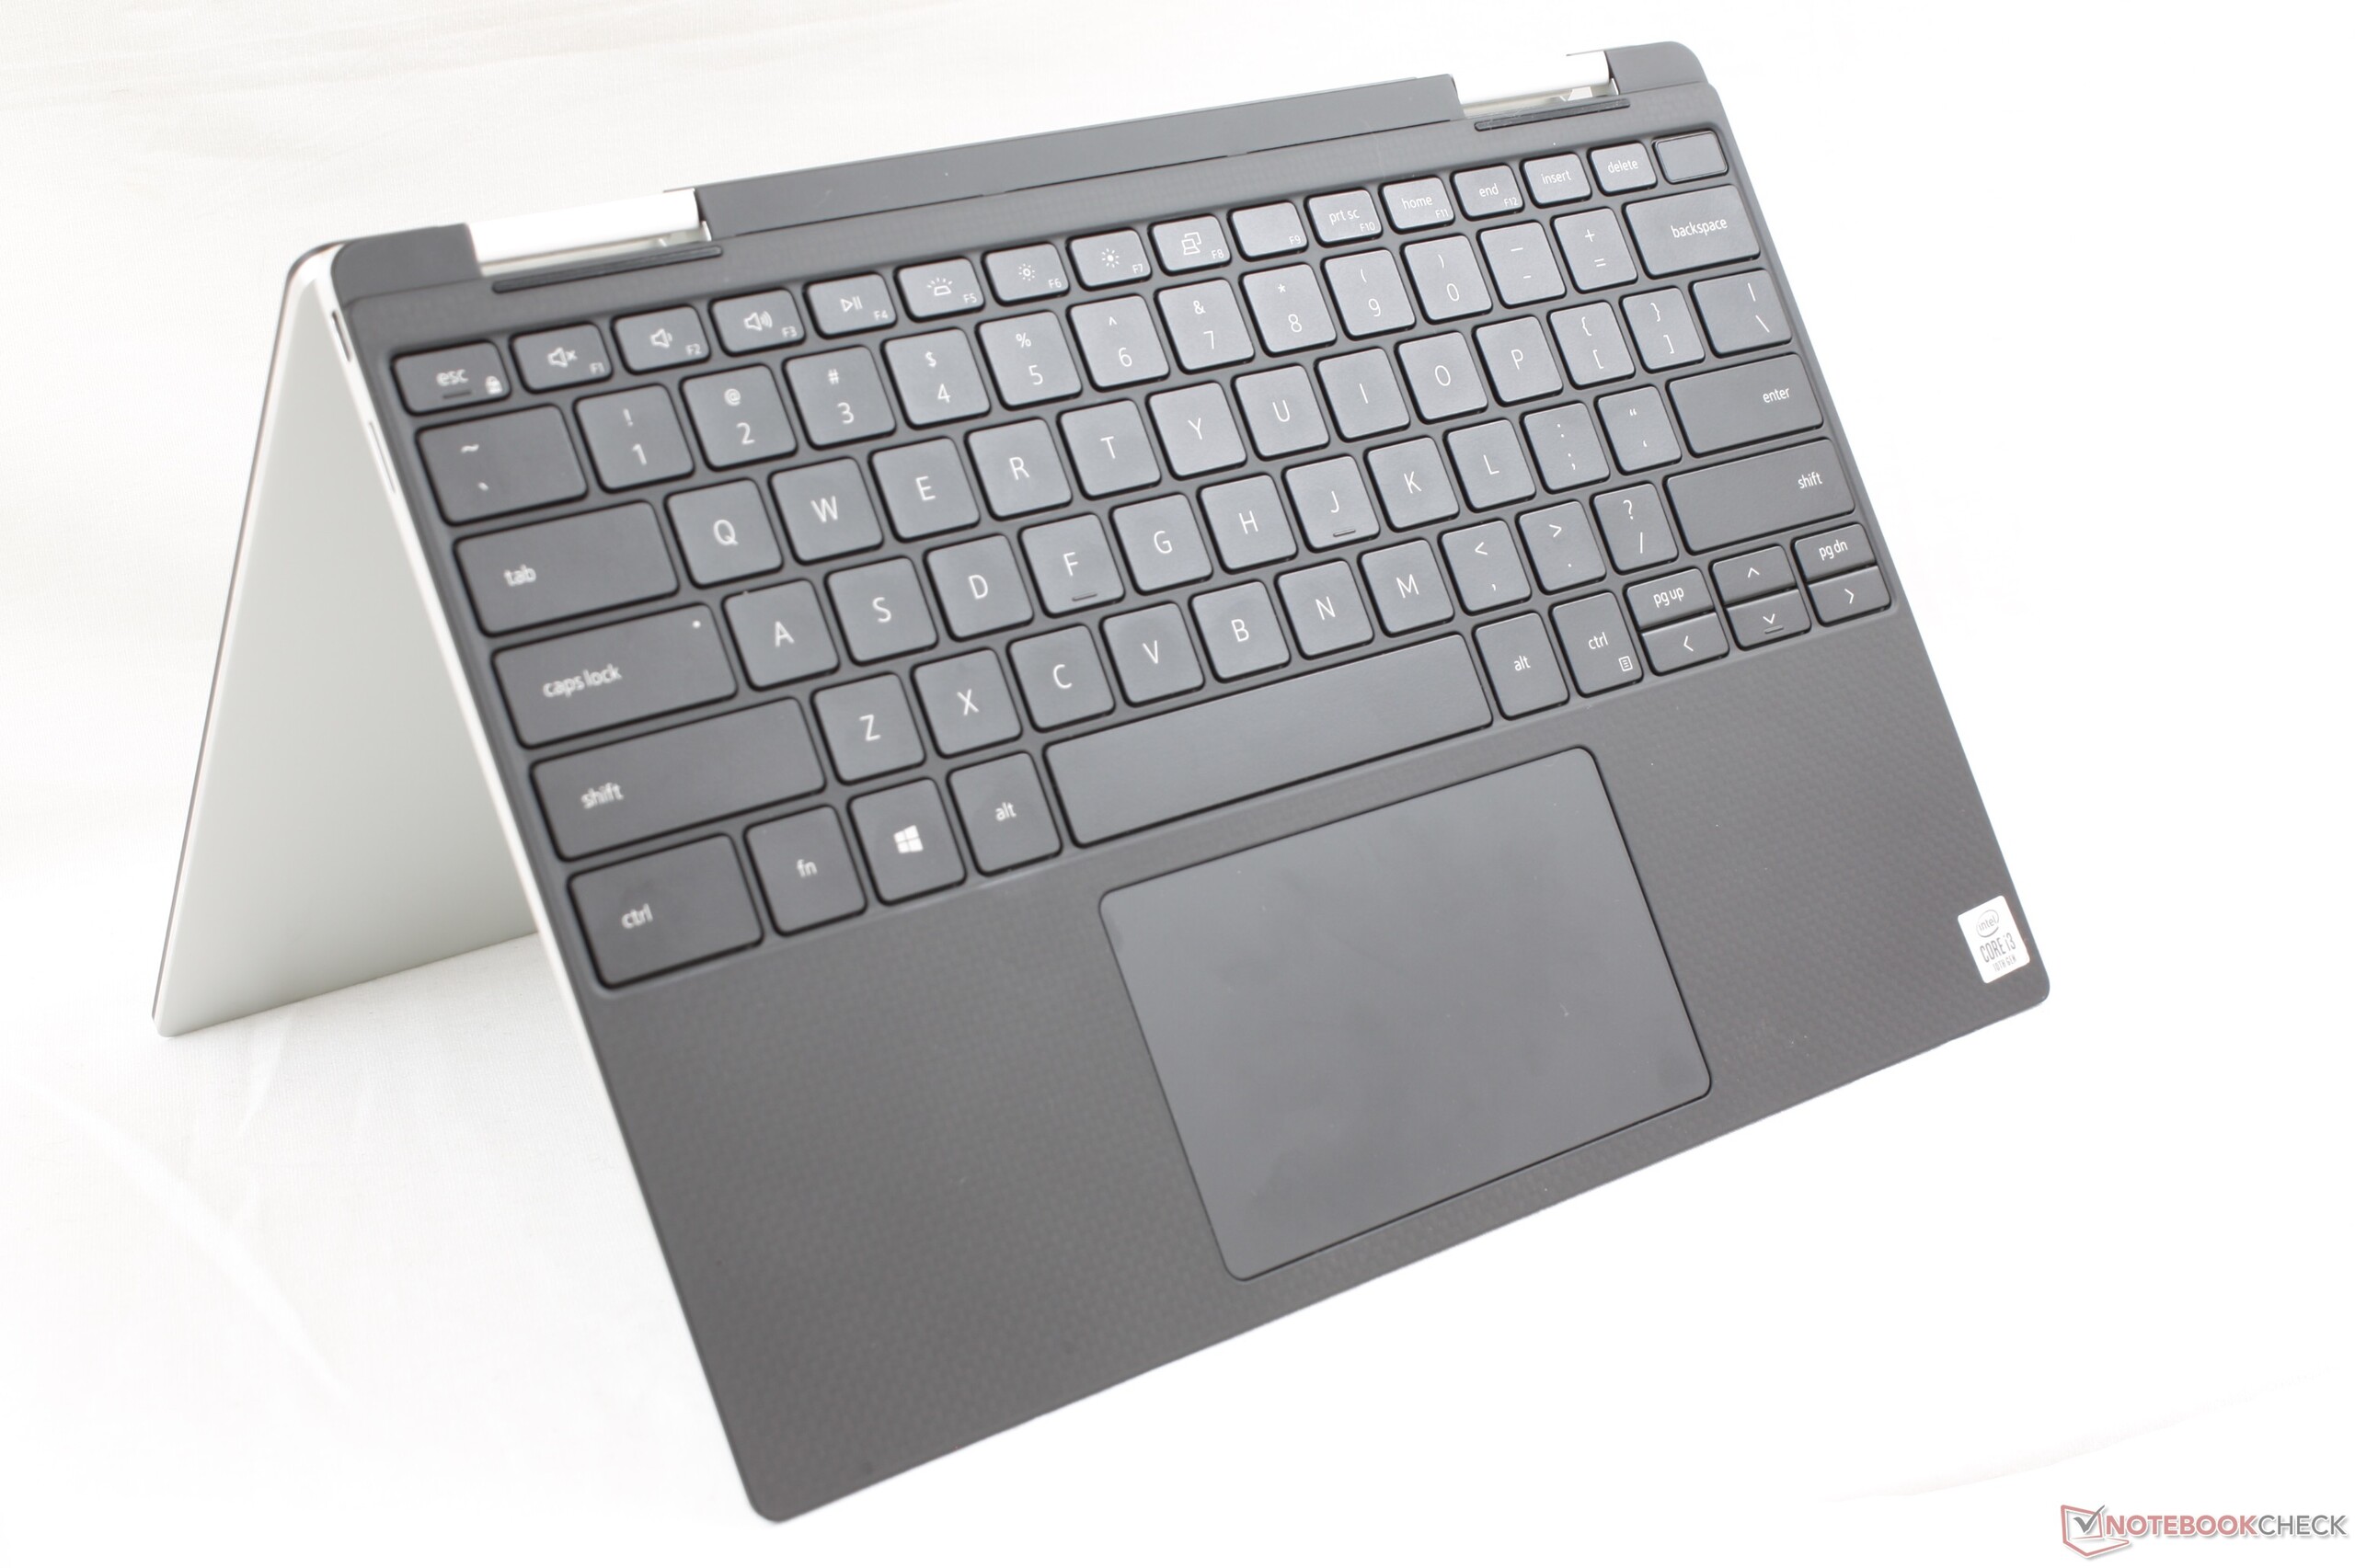
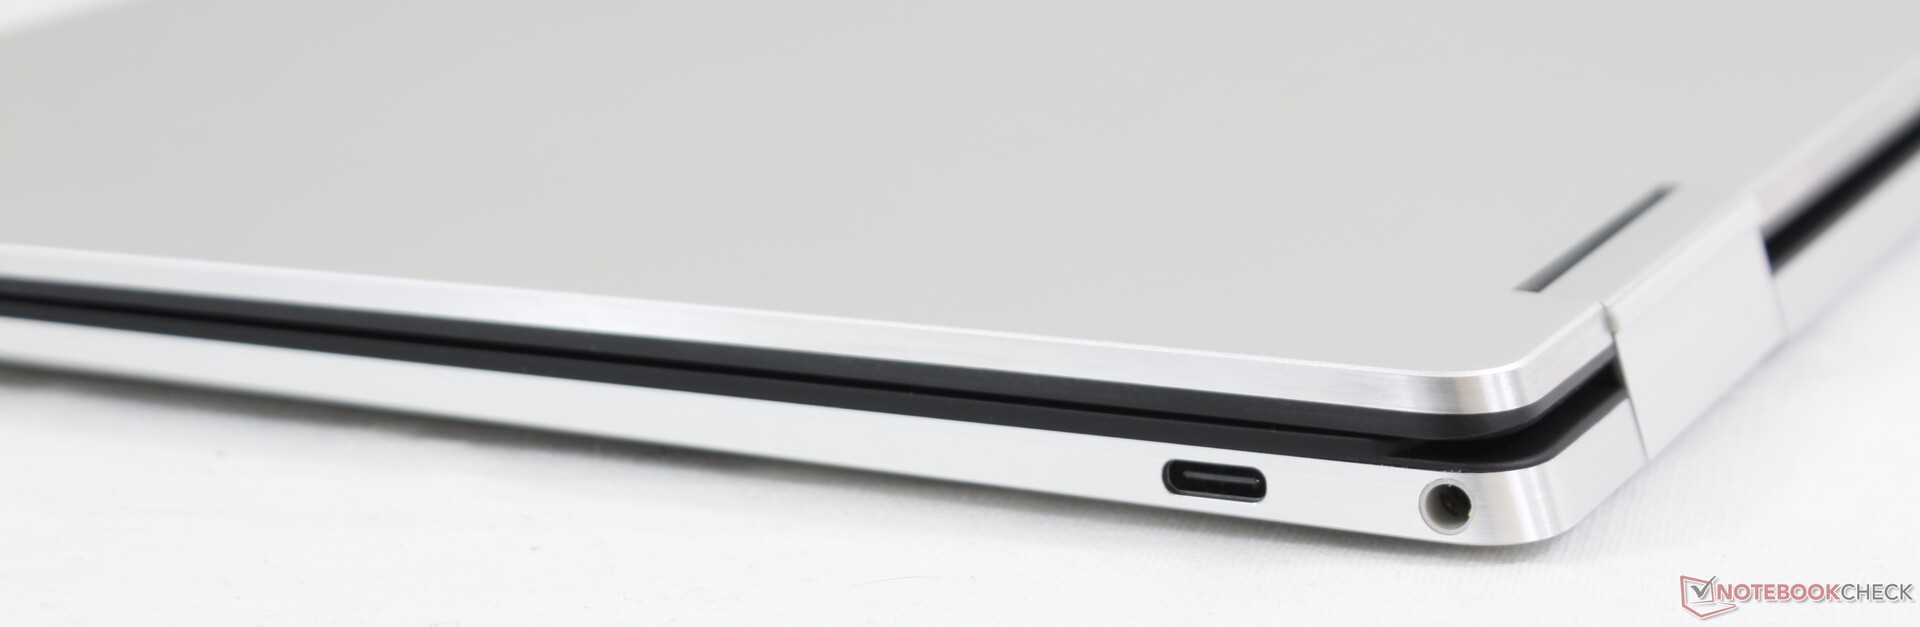
Våra klagomål rör i huvudsak mindre saker som tillsammans utgör märkbara irritationsmoment. De trånga piltangenterna, de fingeravtrycks-älskande ytorna, de långsamma svart-vita responstiderna, problem med DPC-latens och faktum att den saknar snabbare bilduppdatering och möjlighet till WWAN hindrar den från att vara den "ultimata" omvandlingsbara subnotebook-modellen. En del funktioner som fanns på 2017 års utgåva, såsom Noble-lås, IR-kamera och löstagbar lagring, har försvunnit. Dessutom får man kärntemperaturer på 99 C när man belastar processorn fullt ut, vilket gör oss oroade över konfigurationerna med Core i7. Det närmaste alternativet som finns att välja på är HP EliteBook x360 1040 G5 på 14 tum, som är den enda subnotebook-modellen vi känner till som har WWAN, en riktigt ljusstark 120 Hz-skärm, lagring som går att uppdatera av användaren och betydligt fler portalternativ än Dells modell - allt i ett paket som är nästan lika litet.
Eftersom vi upplevde ett antal hårdvarurelaterade problem med den här enheten rekommenderar vi att man undersöker datorn efter konstigheter direkt efter köp. Förvrängt ljud från högtalarna och problem med strömförsörjning genom USB Typ C är allvarliga brister som vi hoppas bara beror på otur snarare än något annat.
XPS 13 7390 2-in-1 på 13.4 tum är en betydande uppgradering från 2017 års XPS 13 9365 på i princip alla sätt. Den största överraskningen är inte den nya processorn utan den välkalibrerade skärmen som är mycket mer ljusstark än vad de flesta andra Ultrabook-modellerna har att erbjuda. Om du kan tänka dig en lite större dator klarar dock HP EliteBook x360 1040 G5 på 14 tum av nästan allt XPS 2-in-1 kan och har dessutom bättre uppgraderingsmöjligheter och bättre anslutbarhet.
Dell XPS 13 7390 2-in-1 Core i3
- 09/10/2019 v7 (old)
Allen Ngo
Price comparison
