Test: Dell Inspiron 15 5000 5584 (i7-8565U) Laptop (Sammanfattning)
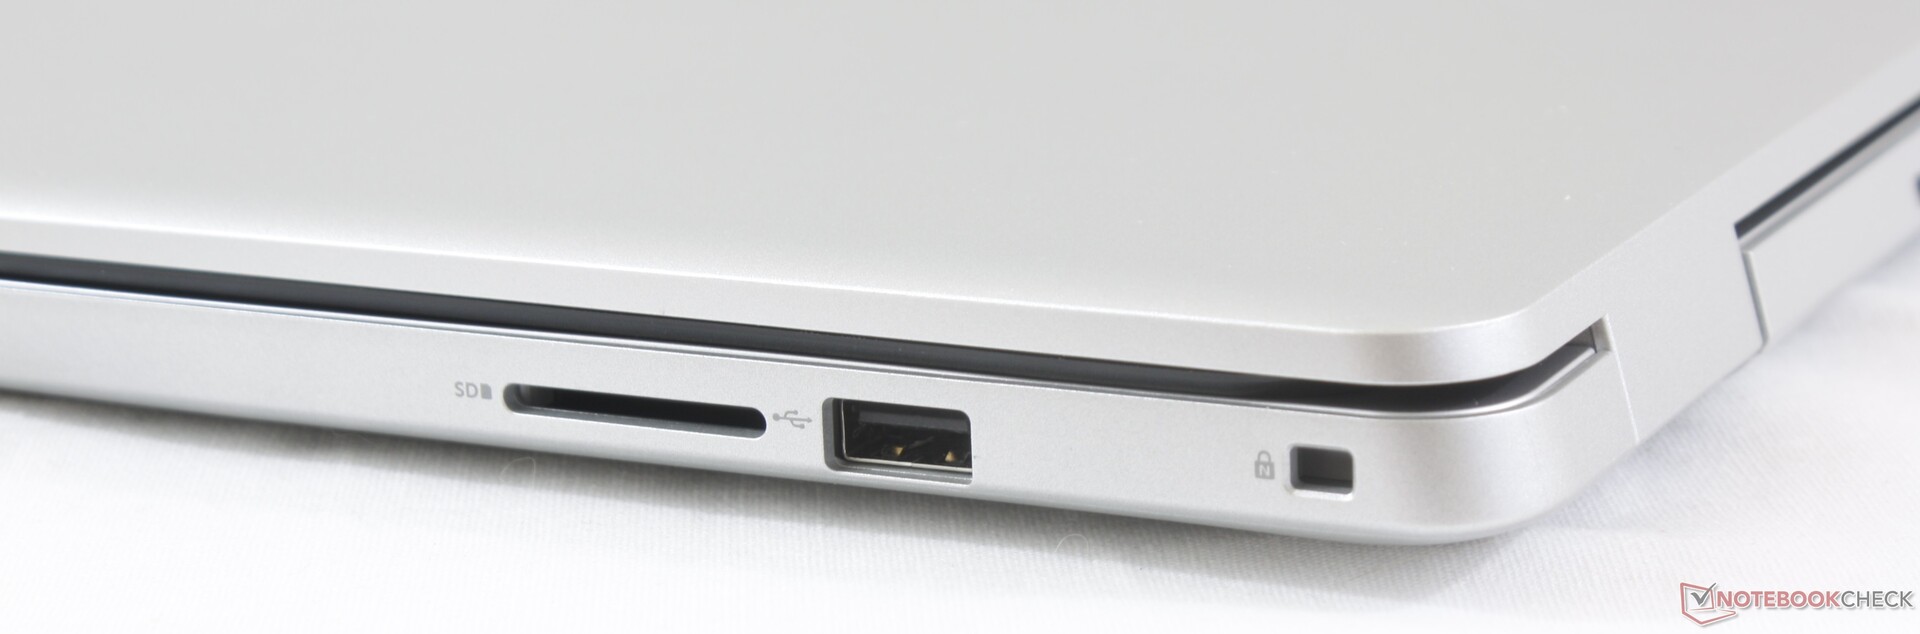
| SD Card Reader | |
| average JPG Copy Test (av. of 3 runs) | |
| Dell XPS 15 9570 i7 UHD (Toshiba Exceria Pro SDXC 64 GB UHS-II) | |
| Acer Aspire 5 A515-52G-723L (Toshiba Exceria Pro SDXC 64 GB UHS-II) | |
| HP Pavilion 15-cs2019ng (Toshiba Exceria Pro SDXC 64 GB UHS-II) | |
| Dell Inspiron 15 5575-98MH4 (Toshiba Exceria Pro SDXC 64 GB UHS-II) | |
| Dell Inspiron 15 5000 5584 (Toshiba Exceria Pro SDXC 64 GB UHS-II) | |
| maximum AS SSD Seq Read Test (1GB) | |
| Dell XPS 15 9570 i7 UHD (Toshiba Exceria Pro SDXC 64 GB UHS-II) | |
| Acer Aspire 5 A515-52G-723L (Toshiba Exceria Pro SDXC 64 GB UHS-II) | |
| Dell Inspiron 15 5575-98MH4 (Toshiba Exceria Pro SDXC 64 GB UHS-II) | |
| HP Pavilion 15-cs2019ng (Toshiba Exceria Pro SDXC 64 GB UHS-II) | |
| Dell Inspiron 15 5000 5584 (Toshiba Exceria Pro SDXC 64 GB UHS-II) | |
| Networking | |
| iperf3 transmit AX12 | |
| Acer Aspire 5 A515-52G-723L | |
| Dell XPS 15 9570 i7 UHD | |
| HP Pavilion 15-cs2019ng | |
| Dell Inspiron 15 5575-98MH4 | |
| Dell Inspiron 15 5000 5584 | |
| iperf3 receive AX12 | |
| HP Pavilion 15-cs2019ng | |
| Dell XPS 15 9570 i7 UHD | |
| Acer Aspire 5 A515-52G-723L | |
| Dell Inspiron 15 5575-98MH4 | |
| Dell Inspiron 15 5000 5584 | |
| |||||||||||||||||||||||||
Distribution av ljusstyrkan: 92 %
Mitt på batteriet: 227 cd/m²
Kontrast: 1081:1 (Svärta: 0.21 cd/m²)
ΔE ColorChecker Calman: 6.55 | ∀{0.5-29.43 Ø4.72}
calibrated: 4.61
ΔE Greyscale Calman: 5.2 | ∀{0.09-98 Ø4.97}
58.2% sRGB (Argyll 1.6.3 3D)
37% AdobeRGB 1998 (Argyll 1.6.3 3D)
40.48% AdobeRGB 1998 (Argyll 3D)
58.8% sRGB (Argyll 3D)
39.17% Display P3 (Argyll 3D)
Gamma: 2.66
CCT: 6434 K
| Dell Inspiron 15 5000 5584 AU Optronics AUO22ED, B156HAK, IPS, 15.6", 1920x1080 | Dell XPS 15 9570 i7 UHD LQ156D1, IPS, 15.6", 3840x2160 | HP Pavilion 15-cs2019ng BOE080D, IPS, 15.6", 1920x1080 | Acer Aspire 5 A515-52G-723L BOE NV156FHM-N48, IPS, 15.6", 1920x1080 | Lenovo Yoga 730-15IKB BOE HF NV156QUM-N51, IPS, 15.6", 3840x2160 | Dell Inspiron 15 5575-98MH4 Innolux JMC9X 156BGA, TN LED, 15.6", 1366x768 | |
|---|---|---|---|---|---|---|
| Display | 89% | 60% | 1% | 64% | 2% | |
| Display P3 Coverage (%) | 39.17 | 79.1 102% | 67.2 72% | 40.02 2% | 68.7 75% | 40.02 2% |
| sRGB Coverage (%) | 58.8 | 98.8 68% | 88.1 50% | 58.5 -1% | 90 53% | 59.8 2% |
| AdobeRGB 1998 Coverage (%) | 40.48 | 79.2 96% | 64.4 59% | 41.34 2% | 65.8 63% | 41.37 2% |
| Response Times | -3% | 7% | -3% | 22% | 8% | |
| Response Time Grey 50% / Grey 80% * (ms) | 48.8 ? | 46.4 ? 5% | 43 ? 12% | 45 ? 8% | 34 ? 30% | 50 ? -2% |
| Response Time Black / White * (ms) | 29.2 ? | 32 ? -10% | 29 ? 1% | 33 ? -13% | 25 ? 14% | 24 ? 18% |
| PWM Frequency (Hz) | 980 ? | 208 ? | 250 ? | 961 ? | 250 ? | |
| Screen | 44% | 26% | 13% | 20% | -34% | |
| Brightness middle (cd/m²) | 227 | 494 118% | 320 41% | 278 22% | 309 36% | 197 -13% |
| Brightness (cd/m²) | 230 | 457 99% | 293 27% | 271 18% | 299 30% | 195 -15% |
| Brightness Distribution (%) | 92 | 88 -4% | 86 -7% | 89 -3% | 84 -9% | 78 -15% |
| Black Level * (cd/m²) | 0.21 | 0.34 -62% | 0.26 -24% | 0.26 -24% | 0.29 -38% | 0.43 -105% |
| Contrast (:1) | 1081 | 1453 34% | 1231 14% | 1069 -1% | 1066 -1% | 458 -58% |
| Colorchecker dE 2000 * | 6.55 | 5.2 21% | 4.5 31% | 4.73 28% | 3.9 40% | 10.35 -58% |
| Colorchecker dE 2000 max. * | 23.45 | 17.5 25% | 8.81 62% | 8.38 64% | 7.5 68% | 16.02 32% |
| Colorchecker dE 2000 calibrated * | 4.61 | 5.17 -12% | ||||
| Greyscale dE 2000 * | 5.2 | 2.7 48% | 4.71 9% | 2.59 50% | 4.58 12% | 11.25 -116% |
| Gamma | 2.66 83% | 2.1 105% | 2.45 90% | 2.38 92% | 2.43 91% | 2.08 106% |
| CCT | 6434 101% | 7038 92% | 7085 92% | 6160 106% | 7344 89% | 11592 56% |
| Color Space (Percent of AdobeRGB 1998) (%) | 37 | 71.2 92% | 58 57% | 36 -3% | 39 5% | 38 3% |
| Color Space (Percent of sRGB) (%) | 58.2 | 98.8 70% | 88 51% | 58 0% | 90 55% | 60 3% |
| Totalt genomsnitt (program/inställningar) | 43% /
47% | 31% /
30% | 4% /
9% | 35% /
29% | -8% /
-21% |
* ... mindre är bättre
Visa svarstider
| ↔ Svarstid svart till vitt | ||
|---|---|---|
| 29.2 ms ... stiga ↗ och falla ↘ kombinerat | ↗ 15.6 ms stiga | 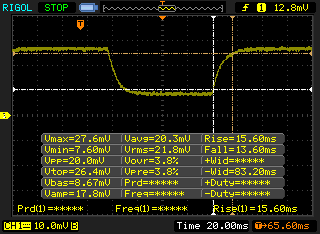 |
| ↘ 13.6 ms hösten | ||
| Skärmen visar relativt långsamma svarsfrekvenser i våra tester och kan vara för långsam för spelare. I jämförelse sträcker sig alla testade enheter från 0.1 (minst) till 240 (maximalt) ms. » 78 % av alla enheter är bättre. Detta innebär att den uppmätta svarstiden är sämre än genomsnittet av alla testade enheter (19.8 ms). | ||
| ↔ Svarstid 50 % grått till 80 % grått | ||
| 48.8 ms ... stiga ↗ och falla ↘ kombinerat | ↗ 25.6 ms stiga | 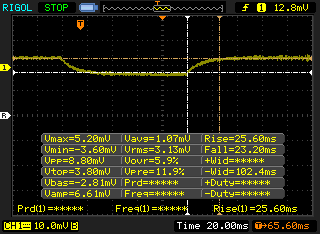 |
| ↘ 23.2 ms hösten | ||
| Skärmen visar långsamma svarsfrekvenser i våra tester och kommer att vara otillfredsställande för spelare. I jämförelse sträcker sig alla testade enheter från 0.165 (minst) till 636 (maximalt) ms. » 84 % av alla enheter är bättre. Detta innebär att den uppmätta svarstiden är sämre än genomsnittet av alla testade enheter (31 ms). | ||
Skärmflimmer / PWM (Puls-Width Modulation)
| Skärmflimmer / PWM upptäcktes inte | 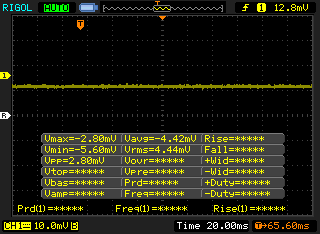 | ||
Som jämförelse: 52 % av alla testade enheter använder inte PWM för att dämpa skärmen. Om PWM upptäcktes mättes ett medelvärde av 7781 (minst: 5 - maximum: 343500) Hz. | |||
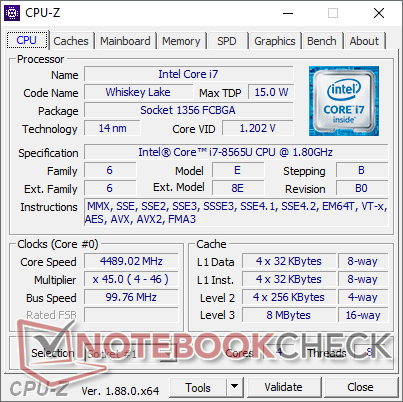
| Cinebench R11.5 | |
| CPU Single 64Bit | |
| Genomsnitt Intel Core i7-8565U (0.65 - 2.16, n=11) | |
| Acer Swift 3 SF314-55-31N8 | |
| CPU Multi 64Bit | |
| Genomsnitt Intel Core i7-8565U (4.09 - 7.4, n=11) | |
| Acer Swift 3 SF314-55-31N8 | |
| Cinebench R10 | |
| Rendering Multiple CPUs 32Bit | |
| Dell G5 15 5590 | |
| Genomsnitt Intel Core i7-8565U (13806 - 23118, n=16) | |
| Acer Swift 3 SF314-55-31N8 | |
| Rendering Single 32Bit | |
| Genomsnitt Intel Core i7-8565U (2682 - 8906, n=16) | |
| Dell G5 15 5590 | |
| Acer Swift 3 SF314-55-31N8 | |
| wPrime 2.10 - 1024m | |
| Acer Swift 3 SF314-55-31N8 | |
| Genomsnitt Intel Core i7-8565U (263 - 420, n=7) | |
* ... mindre är bättre
| PCMark 8 | |
| Home Score Accelerated v2 | |
| Acer Aspire 5 A515-52G-723L | |
| Dell XPS 15 9570 i7 UHD | |
| HP Pavilion 15-cs2019ng | |
| Genomsnitt Intel Core i7-8565U, Intel UHD Graphics 620 (2577 - 4179, n=20) | |
| Lenovo Yoga 730-15IKB | |
| Dell Inspiron 15 5000 5584 | |
| Dell Inspiron 15 5575-98MH4 | |
| Work Score Accelerated v2 | |
| Acer Aspire 5 A515-52G-723L | |
| HP Pavilion 15-cs2019ng | |
| Genomsnitt Intel Core i7-8565U, Intel UHD Graphics 620 (3596 - 5189, n=19) | |
| Dell Inspiron 15 5000 5584 | |
| Dell XPS 15 9570 i7 UHD | |
| Lenovo Yoga 730-15IKB | |
| PCMark 8 Home Score Accelerated v2 | 3386 poäng | |
| PCMark 8 Work Score Accelerated v2 | 4540 poäng | |
| PCMark 10 Score | 4060 poäng | |
Hjälp | ||
| Dell Inspiron 15 5000 5584 Toshiba BG3 KBG30ZMS512G | HP Pavilion 15-cs2019ng Toshiba KBG30ZMV256G | Acer Aspire 5 A515-52G-723L WDC PC SN520 SDAPNUW-512G | Lenovo Yoga 730-15IKB SK Hynix PC401 512GB M.2 (HFS512GD9TNG) | Dell XPS 15 9570 Core i9 UHD Samsung SSD PM981 MZVLB1T0HALR | |
|---|---|---|---|---|---|
| AS SSD | -69% | 47% | 16% | 92% | |
| Seq Read (MB/s) | 1115 | 1153 3% | 1557 40% | 2158 94% | 1320 18% |
| Seq Write (MB/s) | 841 | 736 -12% | 1237 47% | 680 -19% | 1500 78% |
| 4K Read (MB/s) | 46.39 | 46.51 0% | 42.56 -8% | 44.74 -4% | 30.73 -34% |
| 4K Write (MB/s) | 87.6 | 114.1 30% | 127.2 45% | 123 40% | 94.4 8% |
| 4K-64 Read (MB/s) | 904 | 618 -32% | 1034 14% | 623 -31% | 1453 61% |
| 4K-64 Write (MB/s) | 326.5 | 461.4 41% | 1186 263% | 486 49% | 1815 456% |
| Access Time Read * (ms) | 0.048 | 0.421 -777% | 0.077 -60% | 0.044 8% | 0.061 -27% |
| Access Time Write * (ms) | 0.24 | 0.233 3% | 0.028 88% | 0.051 79% | 0.044 82% |
| Score Read (Points) | 1062 | 780 -27% | 1233 16% | 884 -17% | 1616 52% |
| Score Write (Points) | 498 | 649 30% | 1437 189% | 677 36% | 2059 313% |
| Score Total (Points) | 2100 | 1822 -13% | 3291 57% | 1951 -7% | 4507 115% |
| Copy ISO MB/s (MB/s) | 1090 | 1313 20% | 1641 51% | 2577 136% | |
| Copy Program MB/s (MB/s) | 618 | 334.6 -46% | 390 -37% | 515 -17% | |
| Copy Game MB/s (MB/s) | 750 | 684 -9% | 574 -23% | 1120 49% |
* ... mindre är bättre

| 3DMark 11 | |
| 1280x720 Performance GPU | |
| Dell XPS 15 9570 Core i9 UHD | |
| Lenovo Yoga 730-15IKB | |
| Dell Inspiron 17-7786 | |
| HP Pavilion 15-cs2019ng | |
| Dell Latitude 14 5495 | |
| Dell Vostro 15-5568 | |
| Dell XPS 13 9360 FHD i7 Iris | |
| Dell Inspiron 15 5000 5584 | |
| Genomsnitt Intel UHD Graphics 620 (1144 - 3432, n=244) | |
| 1280x720 Performance Combined | |
| Dell XPS 15 9570 Core i9 UHD | |
| Lenovo Yoga 730-15IKB | |
| HP Pavilion 15-cs2019ng | |
| Dell Inspiron 17-7786 | |
| Dell Vostro 15-5568 | |
| Dell Latitude 14 5495 | |
| Dell XPS 13 9360 FHD i7 Iris | |
| Genomsnitt Intel UHD Graphics 620 (927 - 2505, n=244) | |
| Dell Inspiron 15 5000 5584 | |
| 3DMark - 1280x720 Cloud Gate Standard Graphics | |
| Dell XPS 15 9570 Core i9 UHD | |
| Lenovo Yoga 730-15IKB | |
| HP Pavilion 15-cs2019ng | |
| Dell Inspiron 17-7786 | |
| Dell Vostro 15-5568 | |
| Dell XPS 13 9360 FHD i7 Iris | |
| Dell Latitude 14 5495 | |
| Dell Inspiron 15 5000 5584 | |
| Genomsnitt Intel UHD Graphics 620 (6205 - 16400, n=225) | |
| Dell Inspiron 15 5575-98MH4 | |
| 3DMark 11 Performance | 1993 poäng | |
| 3DMark Cloud Gate Standard Score | 8174 poäng | |
| 3DMark Fire Strike Score | 1077 poäng | |
Hjälp | ||
| Dell Inspiron 15 5000 5584 UHD Graphics 620, i7-8565U, Toshiba BG3 KBG30ZMS512G | HP Pavilion 15-cs2019ng GeForce MX250, i5-8265U, Toshiba KBG30ZMV256G | Acer Aspire 5 A515-52G-723L GeForce MX250, i7-8565U, WDC PC SN520 SDAPNUW-512G | Dell XPS 15 9570 Core i9 UHD GeForce GTX 1050 Ti Max-Q, i9-8950HK, Samsung SSD PM981 MZVLB1T0HALR | Dell Inspiron 15 5575-98MH4 Vega 3, R3 2200U, Seagate Mobile HDD 1TB ST1000LM035 | LG Gram 17Z990-R.AAS7U1 UHD Graphics 620, i7-8565U, Samsung SSD PM871b MZNLN256HAJQ | |
|---|---|---|---|---|---|---|
| Noise | -18% | -13% | -10% | -11% | -4% | |
| av / miljö * (dB) | 28.4 | 30.5 -7% | 29.9 -5% | 28.2 1% | 30.4 -7% | 28.1 1% |
| Idle Minimum * (dB) | 28.4 | 31.5 -11% | 29.9 -5% | 28.5 -0% | 31.4 -11% | 28.1 1% |
| Idle Average * (dB) | 28.4 | 31.5 -11% | 29.9 -5% | 28.6 -1% | 31.4 -11% | 28.1 1% |
| Idle Maximum * (dB) | 28.4 | 31.5 -11% | 29.9 -5% | 28.8 -1% | 31.6 -11% | 28.1 1% |
| Load Average * (dB) | 28.9 | 42.5 -47% | 41.7 -44% | 36.2 -25% | 31.9 -10% | 35 -21% |
| Load Maximum * (dB) | 36 | 42.5 -18% | 41.7 -16% | 47.6 -32% | 40.9 -14% | 37.4 -4% |
| Witcher 3 ultra * (dB) | 47.6 |
* ... mindre är bättre
Ljudnivå
| Låg belastning |
| 28.4 / 28.4 / 28.4 dB(A) |
| Hög belastning |
| 28.9 / 36 dB(A) |
 | ||
30 dB tyst 40 dB(A) hörbar 50 dB(A) högt ljud |
||
min: | ||
(±) Den maximala temperaturen på ovansidan är 40.8 °C / 105 F, jämfört med genomsnittet av 36.8 °C / 98 F , allt från 21 till 71 °C för klassen Multimedia.
(-) Botten värms upp till maximalt 47.4 °C / 117 F, jämfört med genomsnittet av 39.1 °C / 102 F
(+) Vid tomgångsbruk är medeltemperaturen för ovansidan 26.4 °C / 80 F, jämfört med enhetsgenomsnittet på 31.3 °C / ### class_avg_f### F.
(+) Handledsstöden och pekplattan är kallare än hudtemperaturen med maximalt 25.4 °C / 77.7 F och är därför svala att ta på.
(+) Medeltemperaturen för handledsstödsområdet på liknande enheter var 28.7 °C / 83.7 F (+3.3 °C / 6 F).
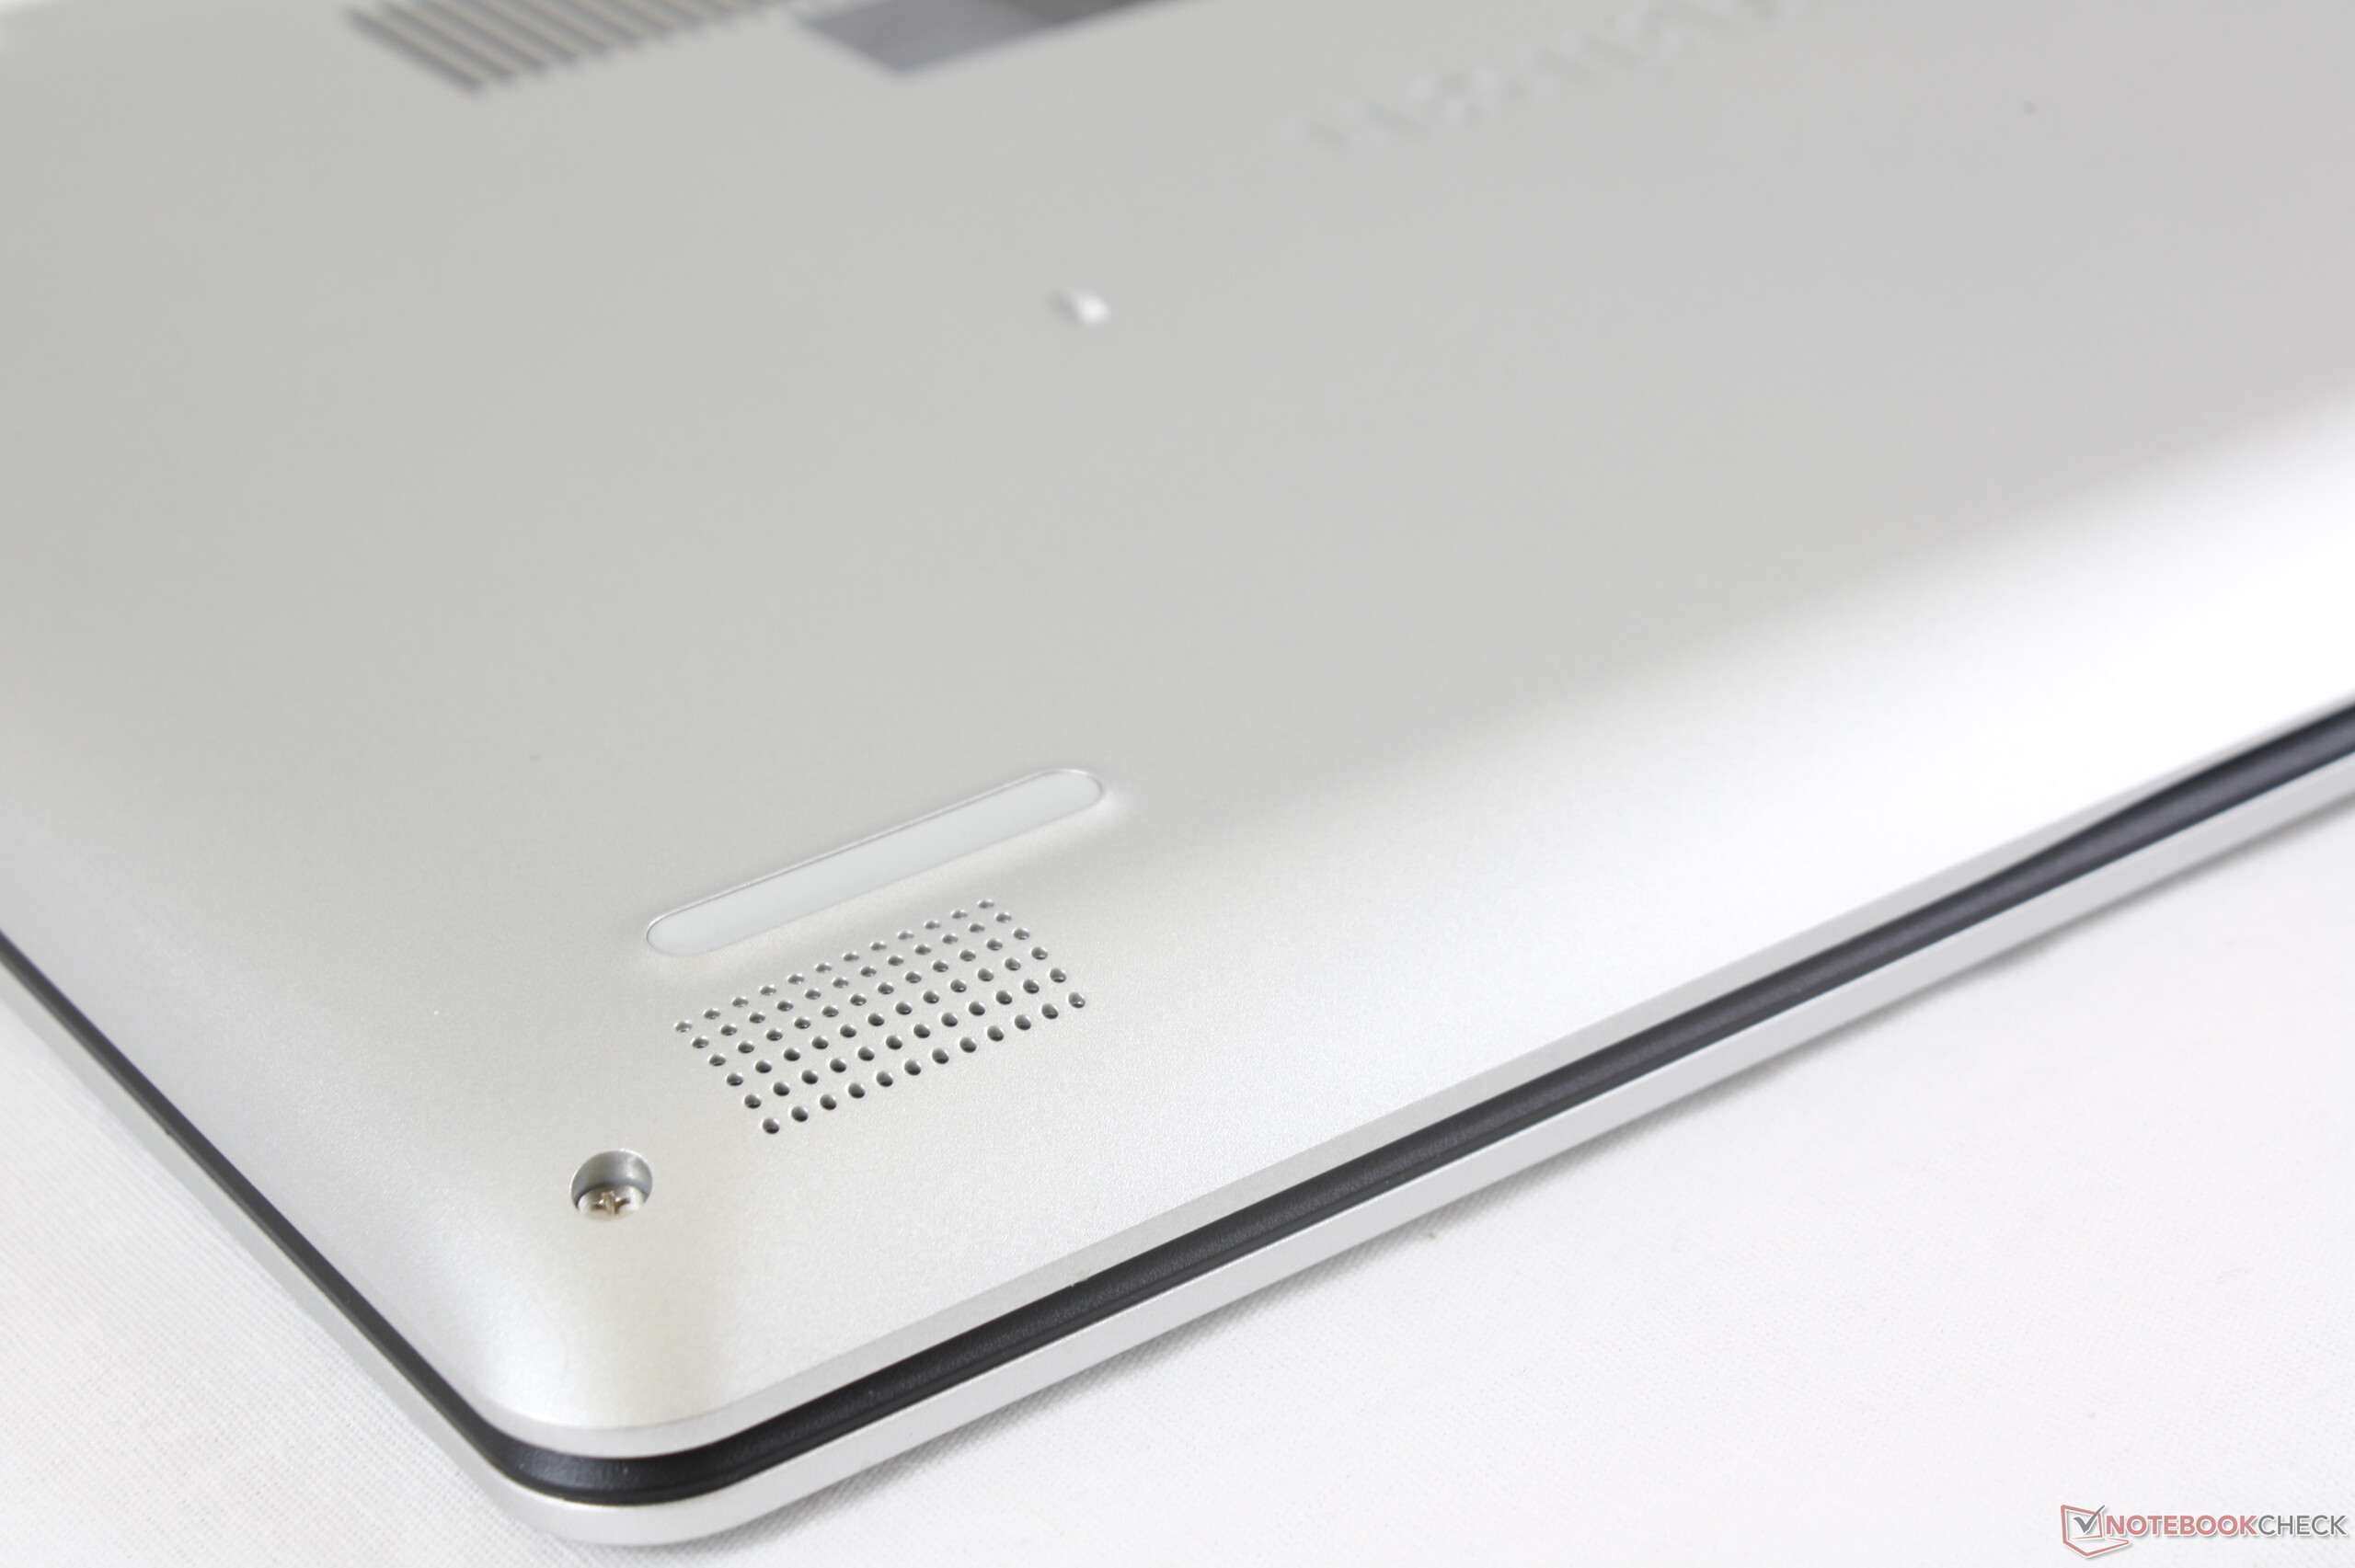
Dell Inspiron 15 5000 5584 ljudanalys
(+) | högtalare kan spela relativt högt (85.4 dB)
Bas 100 - 315 Hz
(-) | nästan ingen bas - i genomsnitt 18.1% lägre än medianen
(±) | linjäriteten för basen är genomsnittlig (14.1% delta till föregående frekvens)
Mellan 400 - 2000 Hz
(+) | balanserad mellan - endast 2.6% från medianen
(±) | linjäriteten för mids är genomsnittlig (7.6% delta till föregående frekvens)
Högsta 2 - 16 kHz
(+) | balanserade toppar - endast 4.3% från medianen
(+) | toppar är linjära (6.8% delta till föregående frekvens)
Totalt 100 - 16 000 Hz
(±) | linjäriteten för det totala ljudet är genomsnittlig (18.2% skillnad mot median)
Jämfört med samma klass
» 54% av alla testade enheter i den här klassen var bättre, 7% liknande, 38% sämre
» Den bästa hade ett delta på 5%, genomsnittet var 17%, sämst var 45%
Jämfört med alla testade enheter
» 39% av alla testade enheter var bättre, 8% liknande, 53% sämre
» Den bästa hade ett delta på 4%, genomsnittet var 24%, sämst var 134%
Apple MacBook 12 (Early 2016) 1.1 GHz ljudanalys
(+) | högtalare kan spela relativt högt (83.6 dB)
Bas 100 - 315 Hz
(±) | reducerad bas - i genomsnitt 11.3% lägre än medianen
(±) | linjäriteten för basen är genomsnittlig (14.2% delta till föregående frekvens)
Mellan 400 - 2000 Hz
(+) | balanserad mellan - endast 2.4% från medianen
(+) | mids är linjära (5.5% delta till föregående frekvens)
Högsta 2 - 16 kHz
(+) | balanserade toppar - endast 2% från medianen
(+) | toppar är linjära (4.5% delta till föregående frekvens)
Totalt 100 - 16 000 Hz
(+) | det totala ljudet är linjärt (10.2% skillnad mot median)
Jämfört med samma klass
» 7% av alla testade enheter i den här klassen var bättre, 2% liknande, 91% sämre
» Den bästa hade ett delta på 5%, genomsnittet var 18%, sämst var 53%
Jämfört med alla testade enheter
» 5% av alla testade enheter var bättre, 1% liknande, 94% sämre
» Den bästa hade ett delta på 4%, genomsnittet var 24%, sämst var 134%
| Av/Standby | |
| Låg belastning | |
| Hög belastning |
|
Förklaring:
min: | |
| Dell Inspiron 15 5000 5584 i7-8565U, UHD Graphics 620, Toshiba BG3 KBG30ZMS512G, IPS, 1920x1080, 15.6" | HP Pavilion 15-cs2019ng i5-8265U, GeForce MX250, Toshiba KBG30ZMV256G, IPS, 1920x1080, 15.6" | Acer Aspire 5 A515-52G-723L i7-8565U, GeForce MX250, WDC PC SN520 SDAPNUW-512G, IPS, 1920x1080, 15.6" | Lenovo Yoga 730-15IKB i5-8550U, GeForce GTX 1050 Mobile, SK Hynix PC401 512GB M.2 (HFS512GD9TNG), IPS, 3840x2160, 15.6" | Dell XPS 15 9570 Core i9 UHD i9-8950HK, GeForce GTX 1050 Ti Max-Q, Samsung SSD PM981 MZVLB1T0HALR, IPS, 3840x2160, 15.6" | Dell XPS 15 9570 i7 UHD i7-8750H, GeForce GTX 1050 Ti Max-Q, Toshiba XG5 KXG50ZNV512G, IPS, 3840x2160, 15.6" | |
|---|---|---|---|---|---|---|
| Power Consumption | -20% | -22% | -42% | -119% | -141% | |
| Idle Minimum * (Watt) | 3.6 | 4.9 -36% | 4.4 -22% | 4.8 -33% | 7.1 -97% | 9.48 -163% |
| Idle Average * (Watt) | 7.4 | 7.9 -7% | 6.9 7% | 10.1 -36% | 13.6 -84% | 16.1 -118% |
| Idle Maximum * (Watt) | 8.3 | 10.1 -22% | 9.9 -19% | 10.7 -29% | 14.1 -70% | 16.9 -104% |
| Load Average * (Watt) | 38 | 60 -58% | 55 -45% | 44 -16% | 103.9 -173% | 90.8 -139% |
| Load Maximum * (Watt) | 47.9 | 38 21% | 63.4 -32% | 94.7 -98% | 130.9 -173% | 134.4 -181% |
| Witcher 3 ultra * (Watt) | 103 |
* ... mindre är bättre
| Dell Inspiron 15 5000 5584 i7-8565U, UHD Graphics 620, 42 Wh | HP Pavilion 15-cs2019ng i5-8265U, GeForce MX250, 41 Wh | Acer Aspire 5 A515-52G-723L i7-8565U, GeForce MX250, 48 Wh | Lenovo Yoga 730-15IKB i5-8550U, GeForce GTX 1050 Mobile, 51.5 Wh | Dell XPS 15 9570 Core i9 UHD i9-8950HK, GeForce GTX 1050 Ti Max-Q, 97 Wh | Acer Swift 5 SF515-51T-76B6 i7-8565U, UHD Graphics 620, 53.9 Wh | |
|---|---|---|---|---|---|---|
| Batteridrifttid | -2% | 45% | 5% | 40% | 66% | |
| Reader / Idle (h) | 15.3 | 8 -48% | 12.9 -16% | 11.6 -24% | 15 -2% | 16.2 6% |
| WiFi v1.3 (h) | 3.5 | 5 43% | 6.9 97% | 6.2 77% | 8.6 146% | 7.2 106% |
| Load (h) | 1.3 | 1.3 0% | 2 54% | 0.8 -38% | 1 -23% | 2.4 85% |
För
Emot
Läs den fullständiga versionen av den här recensionen på engelska här.
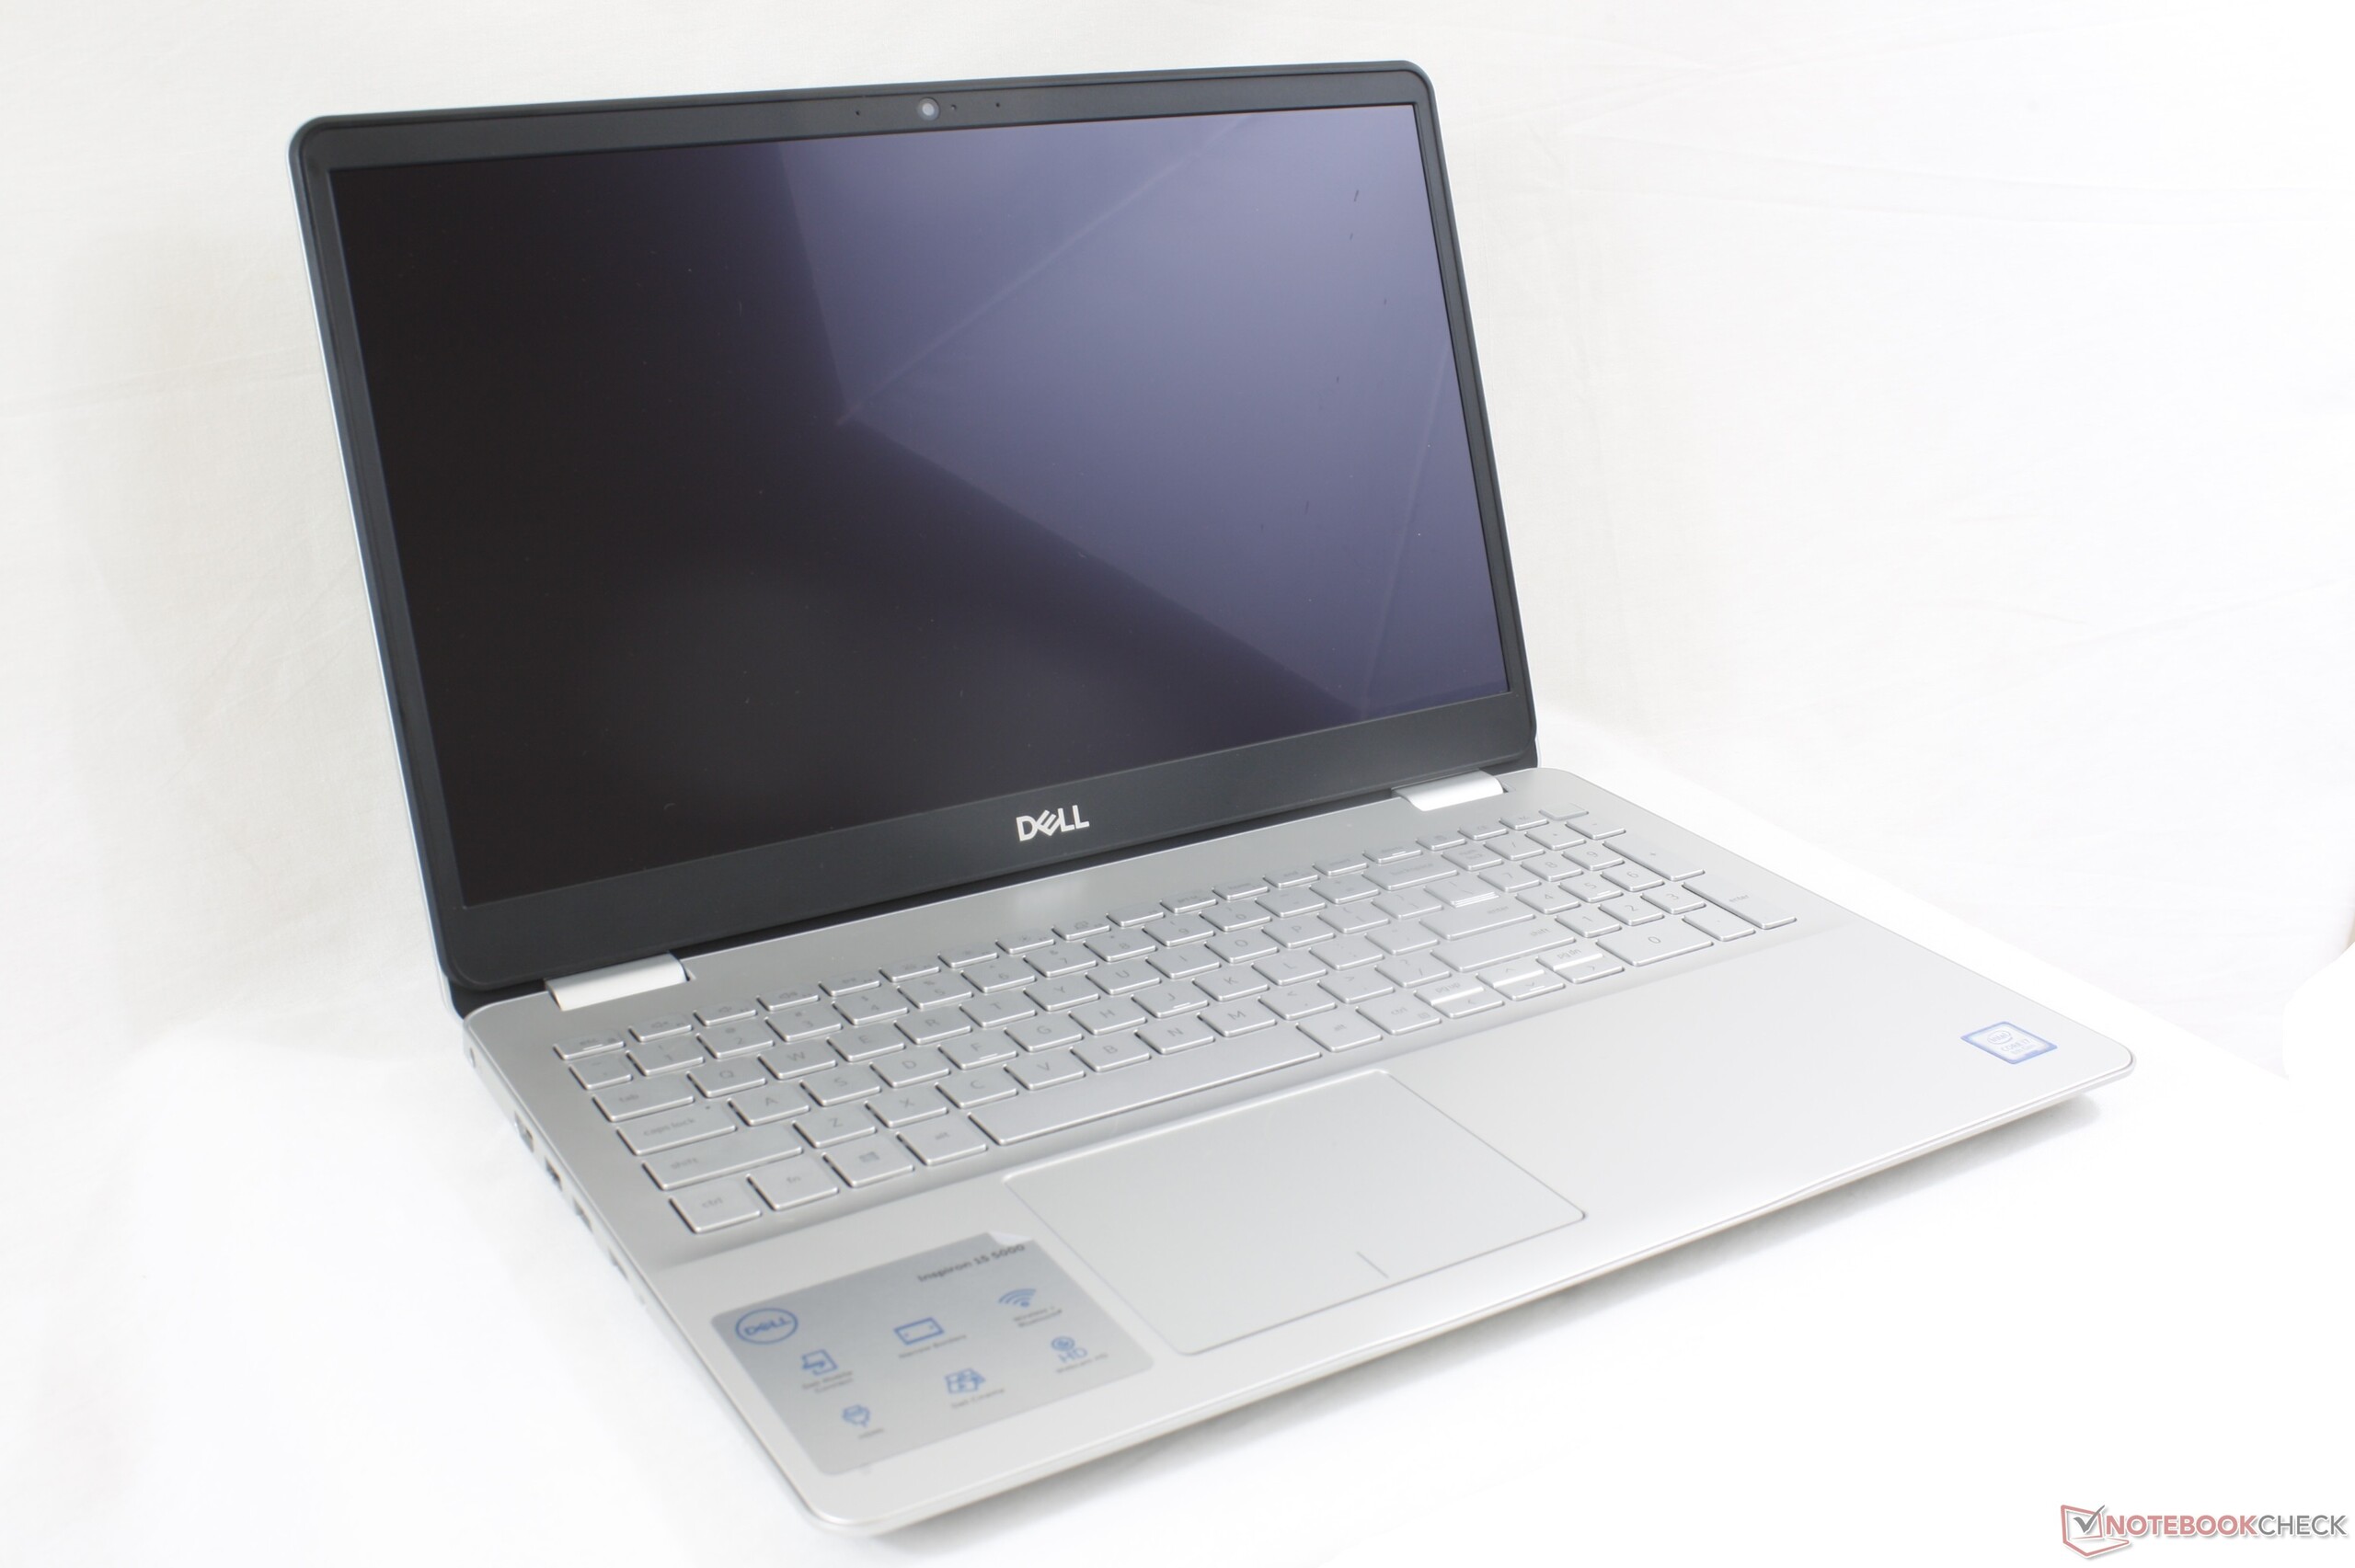
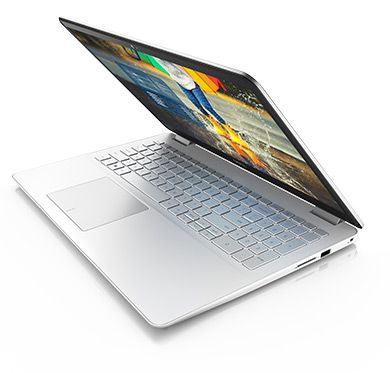
Vi får ge Inspiron 15 5584 beröm för att den sätter en ny standard som alla billiga bärbara datorer bör följa. En primär SSD-enhet, en IPS-skärm på 1080p och tunn infattning borde vara minimumnivå för en multimedialaptop från 2019, så det känns bra att se att Dell har hoppat över de vanliga HDD-enheterna och 768p-skärmarna.
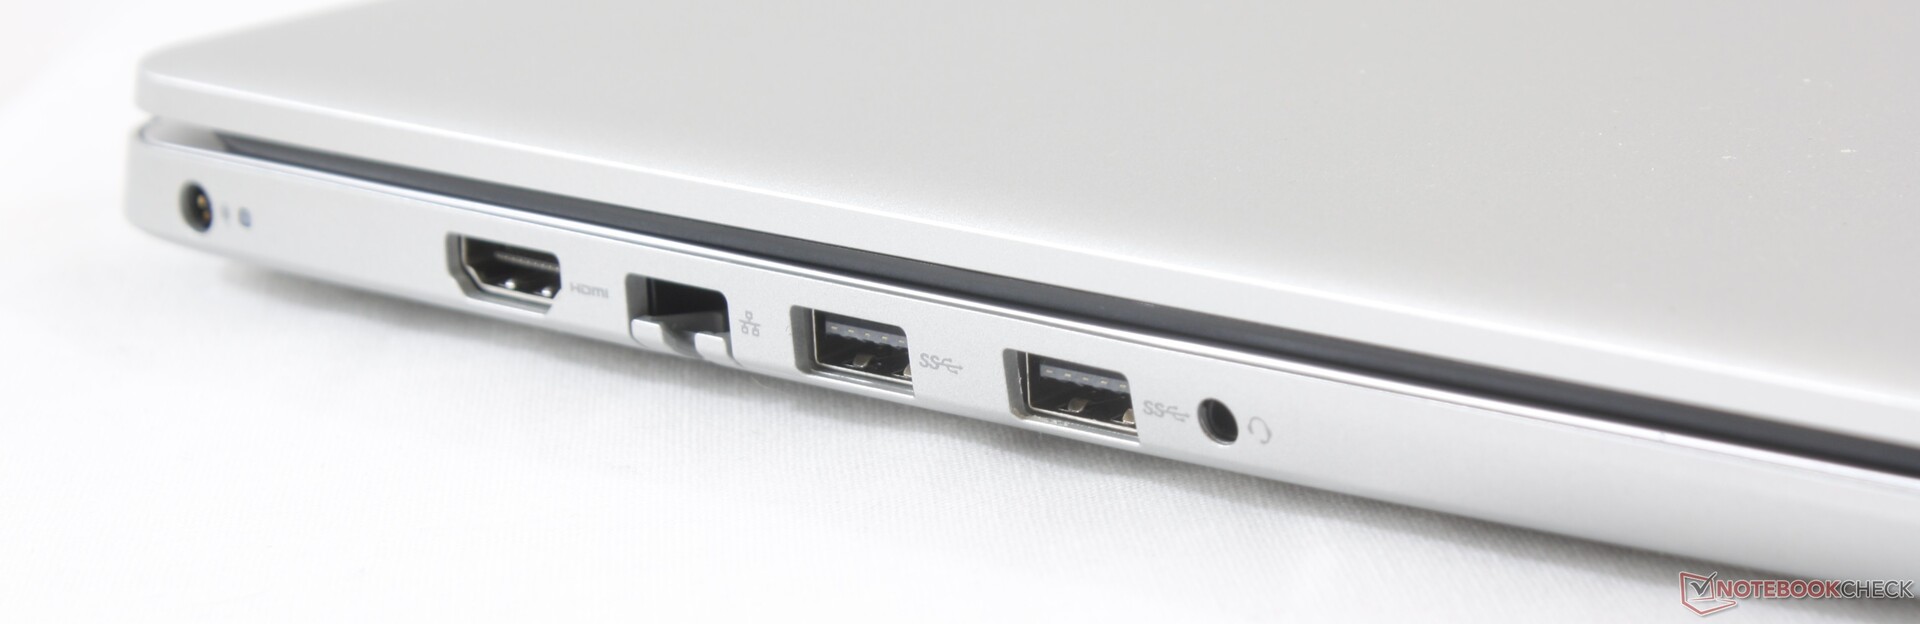
Det finns några brister att tänka på. Utöver att USB Typ C-porten är tillval och inte standard så passar systemet dåligt som resekamrat på grund av en mörk skärm, en svampig styrplatta, kort till medelmåttig batteritid och en tjockare profil än både Pavilion 15 och Aspire 5. Det här är snarare en inomhuslaptop som kan tänkas resa mellan olika platser ibland. Dessutom får den som spelar spel då och då leta någon annanstans eller överväga varianten med AMD Ryzen då den till skillnad från tidigare nämnda alternativ från HP och Acer inte har någon diskret GPU att välja till. Vi hoppas att en framtida revidering gör USB Typ C som standard för både data och laddning, förbättrar styrplattans återkoppling och ser till att det numeriska tangentbordet och piltangenterna blir större utan att något av detta påverkar seriens tilltalande pris.
En billig lösning för ordbehandling eller uppspelning av multimedia i hemmet. Vi rekommenderar att välja varianten med en Core i5-8265U snarare än den med en i7-8565U då skillnaden i prestanda som bäst kommer vara minimal i det här chassit. Pengarna du sparar kan du istället lägga på extra RAM eller lagring.
Dell Inspiron 15 5000 5584
- 05/25/2019 v6 (old)
Allen Ngo
Price comparison
