Test: Dell G7 15 7590 - Alienware-prestanda till ett lägre pris (Sammanfattning)
Gradering | Datum | Modell | Vikt | Höjd | Storlek | Upplösning | Pris |
|---|---|---|---|---|---|---|---|
| 82.3 % v7 (old) | 10/2019 | Dell G7 7590 i7-9750H, GeForce RTX 2060 Mobile | 2.5 kg | 19.9 mm | 15.60" | 1920x1080 | |
| 80.8 % v7 (old) | 10/2019 | MSI GL65 9SEK i7-9750H, GeForce RTX 2060 Mobile | 2.3 kg | 27.5 mm | 15.60" | 1920x1080 | |
| 85.5 % v6 (old) | 08/2019 | Aorus 15-SA i7-9750H, GeForce GTX 1660 Ti Mobile | 2.1 kg | 24.4 mm | 15.60" | 1920x1080 | |
| 84.5 % v6 (old) | 08/2018 | Dell G7 15-7588 i7-8750H, GeForce GTX 1060 Max-Q | 2.6 kg | 24.95 mm | 15.60" | 1920x1080 |
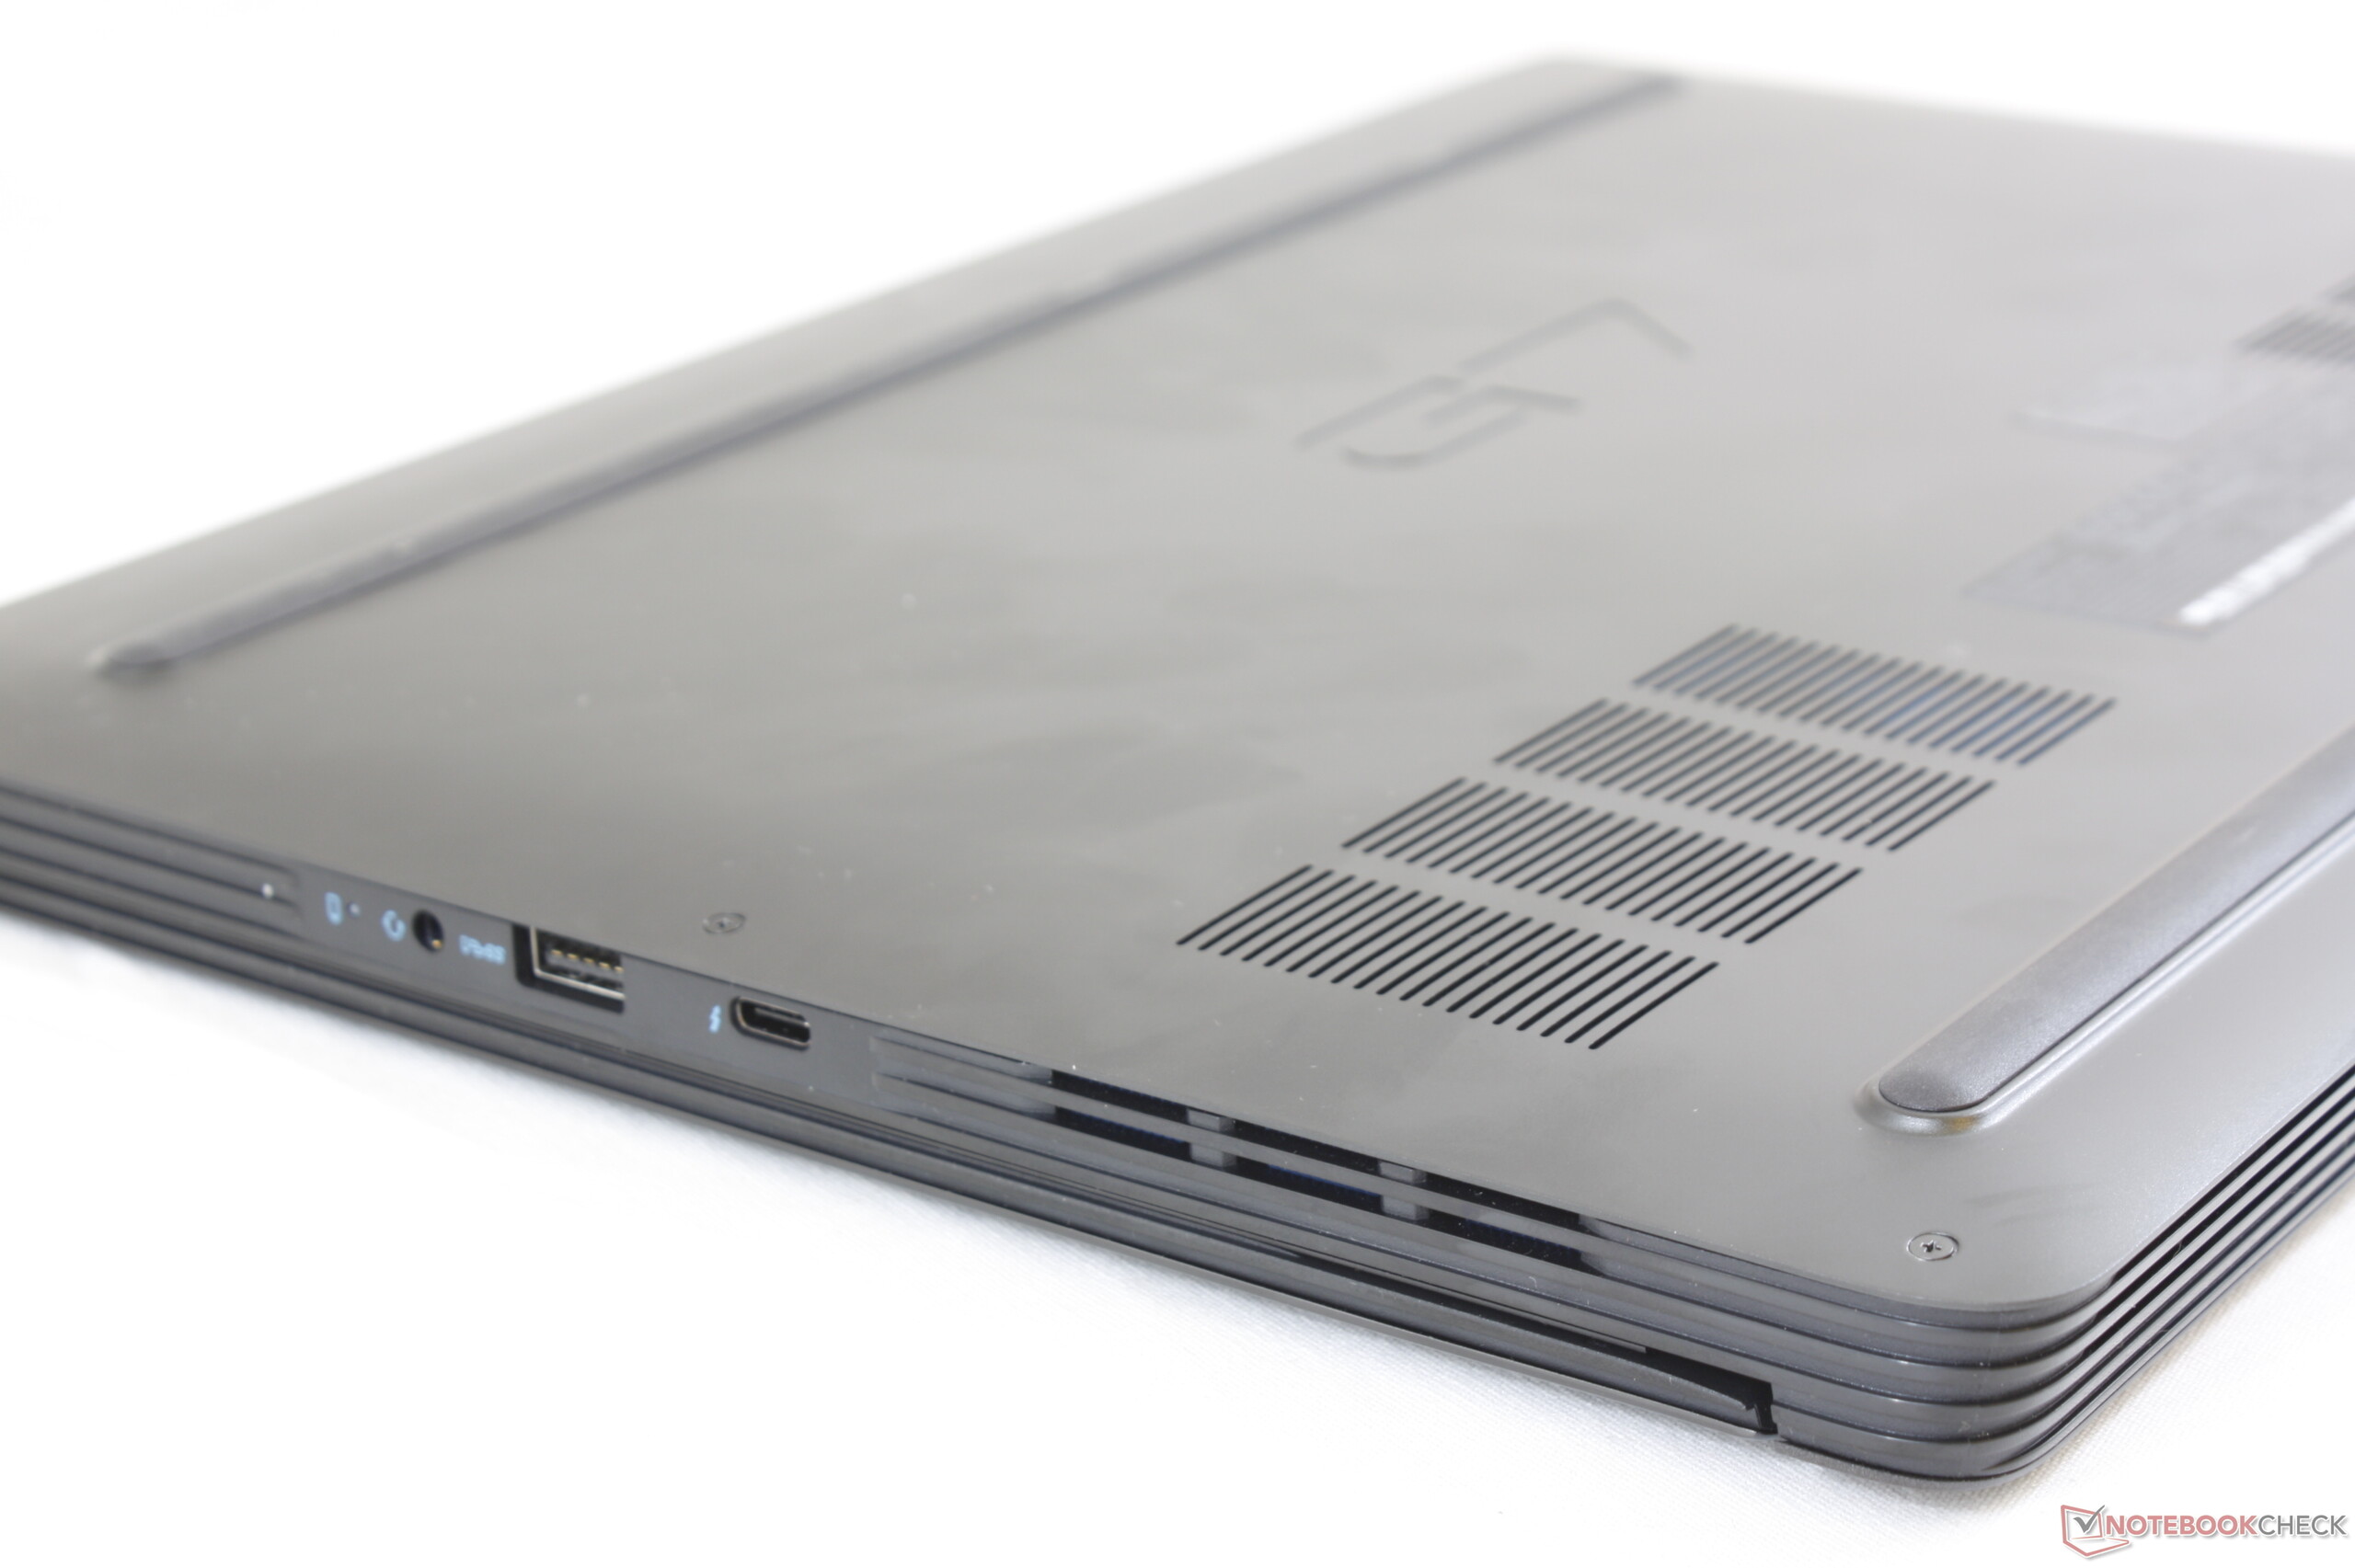
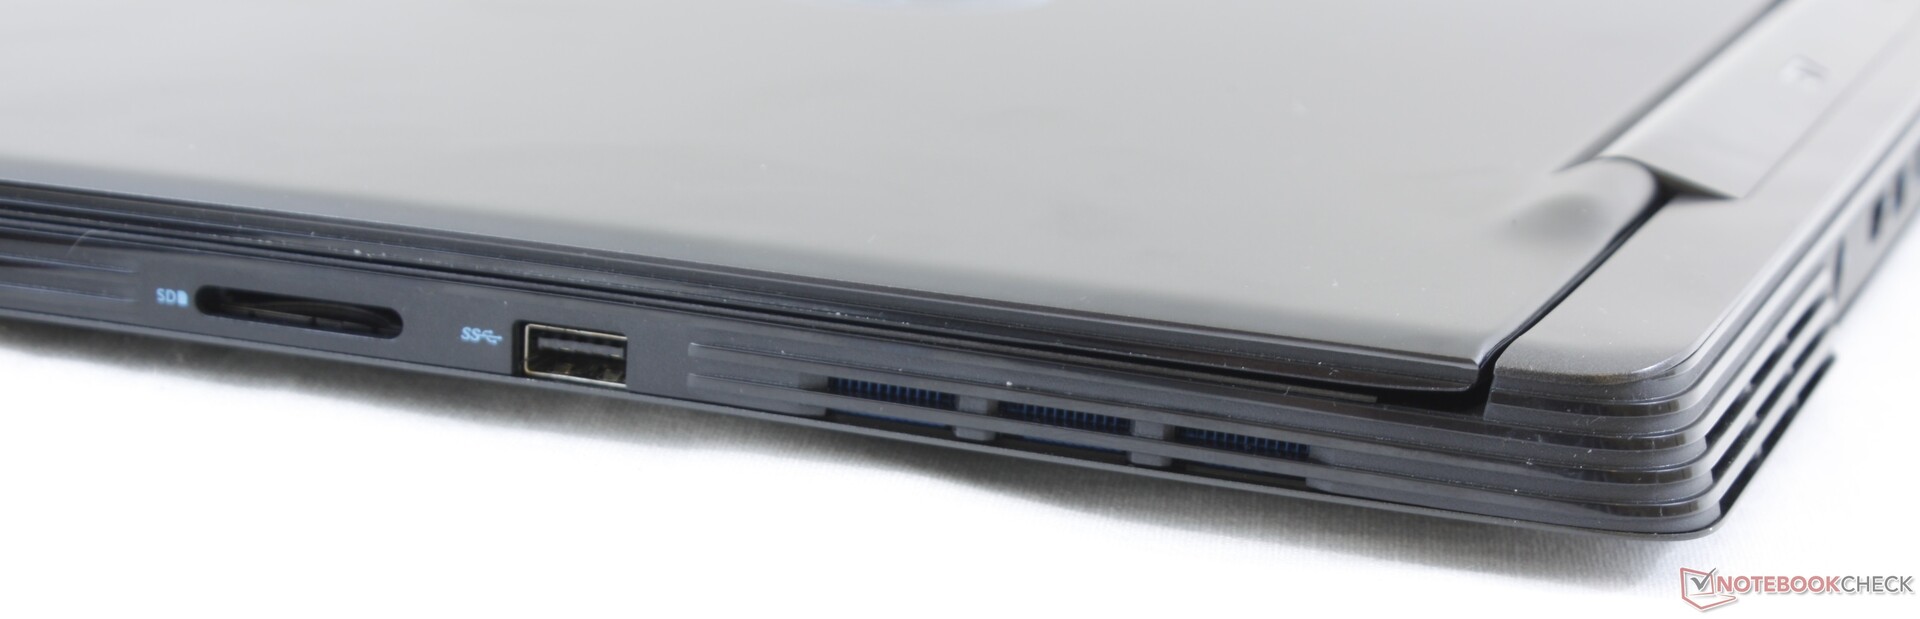

| SD Card Reader | |
| average JPG Copy Test (av. of 3 runs) | |
| Dell XPS 15 7590 i5 iGPU FHD (Toshiba Exceria Pro SDXC 64 GB UHS-II) | |
| Dell XPS 13 7390 2-in-1 Core i7 (Toshiba Exceria Pro M501 64 GB UHS-II) | |
| MSI GL65 9SEK (Toshiba Exceria Pro SDXC 64 GB UHS-II) | |
| Dell G7 7590 (Toshiba Exceria Pro SDXC 64 GB UHS-II) | |
| Dell G3 3590 (Toshiba Exceria Pro SDXC 64 GB UHS-II) | |
| maximum AS SSD Seq Read Test (1GB) | |
| Dell XPS 15 7590 i5 iGPU FHD (Toshiba Exceria Pro SDXC 64 GB UHS-II) | |
| Dell XPS 13 7390 2-in-1 Core i7 (Toshiba Exceria Pro M501 64 GB UHS-II) | |
| Dell G7 7590 (Toshiba Exceria Pro SDXC 64 GB UHS-II) | |
| Dell G3 3590 (Toshiba Exceria Pro SDXC 64 GB UHS-II) | |
| MSI GL65 9SEK (Toshiba Exceria Pro SDXC 64 GB UHS-II) | |
| Networking | |
| iperf3 transmit AX12 | |
| Lenovo Legion Y740-15ICHg | |
| Asus Strix Scar III G531GW-AZ062T | |
| Alienware m15 R2 P87F | |
| Dell G7 7590 | |
| Dell G3 3590 | |
| iperf3 receive AX12 | |
| Dell G7 7590 | |
| Alienware m15 R2 P87F | |
| Asus Strix Scar III G531GW-AZ062T | |
| Lenovo Legion Y740-15ICHg | |
| Dell G3 3590 | |
| |||||||||||||||||||||||||
Distribution av ljusstyrkan: 91 %
Mitt på batteriet: 330.5 cd/m²
Kontrast: 465:1 (Svärta: 0.71 cd/m²)
ΔE ColorChecker Calman: 5.33 | ∀{0.5-29.43 Ø4.72}
calibrated: 3.63
ΔE Greyscale Calman: 6.7 | ∀{0.09-98 Ø4.97}
89.5% sRGB (Argyll 1.6.3 3D)
58.3% AdobeRGB 1998 (Argyll 1.6.3 3D)
65.3% AdobeRGB 1998 (Argyll 3D)
90% sRGB (Argyll 3D)
64.4% Display P3 (Argyll 3D)
Gamma: 2.24
CCT: 8035 K
| Dell G7 7590 AU Optronics B156HAN, IPS, 15.6", 1920x1080 | Lenovo Legion Y740-15ICHg LP156WFG-SPB2, IPS, 15.6", 1920x1080 | HP Omen X 2S 15-dg0075cl AU Optronics AUO82ED, IPS, 15.6", 1920x1080 | Asus Strix Scar III G531GW-AZ062T Sharp LQ156M1JW09 (SHP14D3), IPS, 15.6", 1920x1080 | Dell G3 3590 BOE NV15N3D, IPS, 15.6", 1920x1080 | Alienware m15 R2 P87F Sharp LQ156M1, IPS, 15.6", 1920x1080 | Dell G7 15-7588 LG Philips LGD053F, IPS, 15.6", 1920x1080 | |
|---|---|---|---|---|---|---|---|
| Display | 0% | 3% | 5% | -36% | 3% | -40% | |
| Display P3 Coverage (%) | 64.4 | 63.5 -1% | 66.2 3% | 66.2 3% | 40.13 -38% | 65.3 1% | 37.82 -41% |
| sRGB Coverage (%) | 90 | 92.4 3% | 92.3 3% | 97.1 8% | 59.8 -34% | 95.1 6% | 56.2 -38% |
| AdobeRGB 1998 Coverage (%) | 65.3 | 64.7 -1% | 67.2 3% | 67.6 4% | 41.47 -36% | 65.9 1% | 39.2 -40% |
| Response Times | -26% | -3% | 7% | -209% | 2% | -158% | |
| Response Time Grey 50% / Grey 80% * (ms) | 14 ? | 18.8 ? -34% | 15.2 ? -9% | 15 ? -7% | 46 ? -229% | 16.4 ? -17% | 38.8 ? -177% |
| Response Time Black / White * (ms) | 11.2 ? | 13.2 ? -18% | 10.8 ? 4% | 9 ? 20% | 32.4 ? -189% | 8.8 ? 21% | 26.8 ? -139% |
| PWM Frequency (Hz) | 250 ? | 200 ? | 23810 ? | ||||
| Screen | 24% | 26% | 21% | 0% | 14% | -21% | |
| Brightness middle (cd/m²) | 330.5 | 320.4 -3% | 324.8 -2% | 309 -7% | 276.2 -16% | 324.2 -2% | 250.9 -24% |
| Brightness (cd/m²) | 324 | 298 -8% | 316 -2% | 284 -12% | 261 -19% | 304 -6% | 246 -24% |
| Brightness Distribution (%) | 91 | 85 -7% | 84 -8% | 88 -3% | 86 -5% | 90 -1% | 89 -2% |
| Black Level * (cd/m²) | 0.71 | 0.42 41% | 0.26 63% | 0.42 41% | 0.24 66% | 0.38 46% | 0.34 52% |
| Contrast (:1) | 465 | 763 64% | 1249 169% | 736 58% | 1151 148% | 853 83% | 738 59% |
| Colorchecker dE 2000 * | 5.33 | 3.21 40% | 4.96 7% | 3.99 25% | 5.56 -4% | 5.01 6% | 7.34 -38% |
| Colorchecker dE 2000 max. * | 11.08 | 5.54 50% | 8.95 19% | 8.3 25% | 23.45 -112% | 12.7 -15% | 28.66 -159% |
| Colorchecker dE 2000 calibrated * | 3.63 | 2.36 35% | 3.23 11% | 1.12 69% | 5.23 -44% | 1.64 55% | 4.42 -22% |
| Greyscale dE 2000 * | 6.7 | 3.6 46% | 5 25% | 5.43 19% | 2.8 58% | 7.9 -18% | 6.8 -1% |
| Gamma | 2.24 98% | 2.27 97% | 2.21 100% | 2.57 86% | 2.37 93% | 2.35 94% | 2.164 102% |
| CCT | 8035 81% | 6503 100% | 7742 84% | 7767 84% | 6710 97% | 8455 77% | 6780 96% |
| Color Space (Percent of AdobeRGB 1998) (%) | 58.3 | 59 1% | 59.8 3% | 63 8% | 37.8 -35% | 60.8 4% | 36 -38% |
| Color Space (Percent of sRGB) (%) | 89.5 | 92 3% | 91.8 3% | 97 8% | 59 -34% | 95.5 7% | 56 -37% |
| Totalt genomsnitt (program/inställningar) | -1% /
13% | 9% /
18% | 11% /
16% | -82% /
-33% | 6% /
11% | -73% /
-42% |
* ... mindre är bättre
Visa svarstider
| ↔ Svarstid svart till vitt | ||
|---|---|---|
| 11.2 ms ... stiga ↗ och falla ↘ kombinerat | ↗ 6 ms stiga | 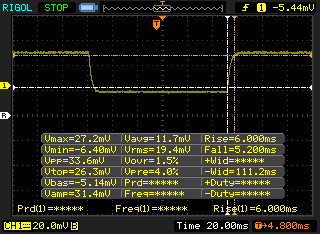 |
| ↘ 5.2 ms hösten | ||
| Skärmen visar bra svarsfrekvens i våra tester, men kan vara för långsam för konkurrenskraftiga spelare. I jämförelse sträcker sig alla testade enheter från 0.1 (minst) till 240 (maximalt) ms. » 30 % av alla enheter är bättre. Det betyder att den uppmätta svarstiden är bättre än genomsnittet av alla testade enheter (19.8 ms). | ||
| ↔ Svarstid 50 % grått till 80 % grått | ||
| 14 ms ... stiga ↗ och falla ↘ kombinerat | ↗ 7.2 ms stiga | 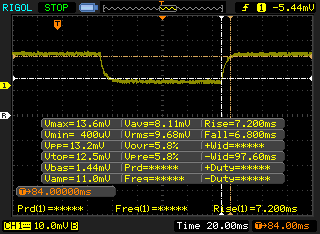 |
| ↘ 6.8 ms hösten | ||
| Skärmen visar bra svarsfrekvens i våra tester, men kan vara för långsam för konkurrenskraftiga spelare. I jämförelse sträcker sig alla testade enheter från 0.165 (minst) till 636 (maximalt) ms. » 28 % av alla enheter är bättre. Det betyder att den uppmätta svarstiden är bättre än genomsnittet av alla testade enheter (31 ms). | ||
Skärmflimmer / PWM (Puls-Width Modulation)
| Skärmflimmer / PWM upptäcktes inte | 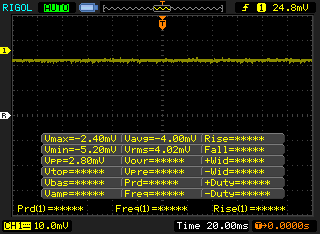 | ||
Som jämförelse: 52 % av alla testade enheter använder inte PWM för att dämpa skärmen. Om PWM upptäcktes mättes ett medelvärde av 7769 (minst: 5 - maximum: 343500) Hz. | |||
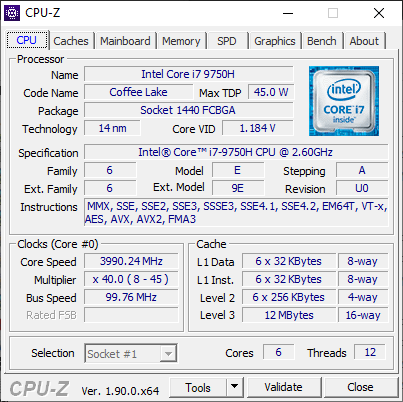
| PCMark 8 Home Score Accelerated v2 | 4317 poäng | |
| PCMark 8 Work Score Accelerated v2 | 5558 poäng | |
| PCMark 10 Score | 5368 poäng | |
Hjälp | ||
| Dell G7 7590 Toshiba BG3 KBG30ZMS256G | Lenovo Legion Y740-15ICHg Samsung SSD PM981 MZVLB256HAHQ | HP Omen X 2S 15-dg0075cl WDC PC SN720 SDAPNTW-1T00 | Asus Strix Scar III G531GW-AZ062T Intel SSD 660p SSDPEKNW512G8 | Dell G3 3590 Toshiba BG4 KBG40ZNS128G | |
|---|---|---|---|---|---|
| AS SSD | 301% | 436% | 118% | -26% | |
| Seq Read (MB/s) | 1013 | 1953 93% | 2105 108% | 1163 15% | 1174 16% |
| Seq Write (MB/s) | 203.8 | 1629 699% | 2493 1123% | 919 351% | 186 -9% |
| 4K Read (MB/s) | 29.57 | 33.2 12% | 25.01 -15% | 48.88 65% | 34.01 15% |
| 4K Write (MB/s) | 71.4 | 88.1 23% | 108.7 52% | 90.1 26% | 69.4 -3% |
| 4K-64 Read (MB/s) | 332.1 | 757 128% | 1604 383% | 323.8 -2% | 424 28% |
| 4K-64 Write (MB/s) | 152.9 | 1501 882% | 1593 942% | 403.8 164% | 68.8 -55% |
| Access Time Read * (ms) | 0.183 | 0.077 58% | 0.046 75% | 0.24 -31% | 0.168 8% |
| Access Time Write * (ms) | 0.248 | 0.043 83% | 0.102 59% | 0.046 81% | 0.94 -279% |
| Score Read (Points) | 463 | 985 113% | 1840 297% | 489 6% | 575 24% |
| Score Write (Points) | 245 | 1752 615% | 1951 696% | 586 139% | 157 -36% |
| Score Total (Points) | 913 | 3230 254% | 4743 419% | 1332 46% | 987 8% |
| Copy ISO MB/s (MB/s) | 263.6 | 1872 610% | 2250 754% | 1269 381% | 215.7 -18% |
| Copy Program MB/s (MB/s) | 213.8 | 478.2 124% | 896 319% | 452.8 112% | 108.2 -49% |
| Copy Game MB/s (MB/s) | 188 | 1165 520% | 1854 886% | 755 302% | 165.9 -12% |
* ... mindre är bättre

| 3DMark 11 Performance | 17814 poäng | |
| 3DMark Cloud Gate Standard Score | 36639 poäng | |
| 3DMark Fire Strike Score | 14249 poäng | |
| 3DMark Time Spy Score | 6192 poäng | |
Hjälp | ||
| Shadow of the Tomb Raider - 1920x1080 Highest Preset AA:T | |
| MSI RTX 2060 Gaming Z 6G | |
| Alienware m15 R2 P87F | |
| Alienware m15 P79F | |
| Asus Strix Scar III G531GW-AZ062T | |
| MSI GL65 9SEK | |
| Dell G7 7590 | |
| Genomsnitt NVIDIA GeForce RTX 2060 Mobile (54 - 86, n=22) | |
| Razer Blade 15 GTX 1660 Ti | |
| Asus ROG Zephyrus G15 GA502DU | |
| Asus Zephyrus S GX531GM | |
| låg | med. | hög | ultra | |
|---|---|---|---|---|
| BioShock Infinite (2013) | 323.1 | 285.3 | 266.3 | 141.5 |
| The Witcher 3 (2015) | 288 | 185.7 | 113.4 | 62.4 |
| Shadow of the Tomb Raider (2018) | 126 | 91 | 84 | 75 |
| Dell G7 7590 GeForce RTX 2060 Mobile, i7-9750H, Toshiba BG3 KBG30ZMS256G | Lenovo Legion Y740-15ICHg GeForce RTX 2070 Max-Q, i7-8750H, Samsung SSD PM981 MZVLB256HAHQ | HP Omen X 2S 15-dg0075cl GeForce RTX 2070 Max-Q, i7-9750H, WDC PC SN720 SDAPNTW-1T00 | Asus Strix Scar III G531GW-AZ062T GeForce RTX 2070 Mobile, i7-9750H, Intel SSD 660p SSDPEKNW512G8 | Dell G3 3590 GeForce GTX 1650 Mobile, i5-9300H, Toshiba BG4 KBG40ZNS128G | Alienware m15 R2 P87F GeForce RTX 2080 Max-Q, i7-9750H, 2x Toshiba XG6 KXG60ZNV512G (RAID 0) | |
|---|---|---|---|---|---|---|
| Noise | 4% | -1% | -2% | 4% | -10% | |
| av / miljö * (dB) | 28.4 | 28 1% | 29 -2% | 30 -6% | 28.4 -0% | 28.3 -0% |
| Idle Minimum * (dB) | 29.5 | 32.6 -11% | 30.5 -3% | 30.6 -4% | 29.2 1% | 28.5 3% |
| Idle Average * (dB) | 29.6 | 32.7 -10% | 31.5 -6% | 30.6 -3% | 29.4 1% | 28.5 4% |
| Idle Maximum * (dB) | 29.6 | 32.7 -10% | 31.5 -6% | 37.7 -27% | 29.4 1% | 49 -66% |
| Load Average * (dB) | 45 | 33.3 26% | 40.6 10% | 36.5 19% | 39 13% | 49 -9% |
| Witcher 3 ultra * (dB) | 51.5 | 41.6 19% | 49.5 4% | 52.1 -1% | 49.5 4% | 49 5% |
| Load Maximum * (dB) | 53 | 45.2 15% | 53.4 -1% | 48.1 9% | 49.7 6% | 55 -4% |
* ... mindre är bättre
Ljudnivå
| Låg belastning |
| 29.5 / 29.6 / 29.6 dB(A) |
| Hög belastning |
| 45 / 53 dB(A) |
 | ||
30 dB tyst 40 dB(A) hörbar 50 dB(A) högt ljud |
||
min: | ||
(-) Den maximala temperaturen på ovansidan är 52 °C / 126 F, jämfört med genomsnittet av 40.4 °C / 105 F , allt från 21.2 till 68.8 °C för klassen Gaming.
(-) Botten värms upp till maximalt 48.8 °C / 120 F, jämfört med genomsnittet av 43.2 °C / 110 F
(+) Vid tomgångsbruk är medeltemperaturen för ovansidan 30.7 °C / 87 F, jämfört med enhetsgenomsnittet på 33.9 °C / ### class_avg_f### F.
(-) När du spelar The Witcher 3 är medeltemperaturen för ovansidan 39.5 °C / 103 F, jämfört med enhetsgenomsnittet på 33.9 °C / ## #class_avg_f### F.
(+) Handledsstöden och pekplattan når maximal hudtemperatur (35.4 °C / 95.7 F) och är därför inte varma.
(-) Medeltemperaturen för handledsstödsområdet på liknande enheter var 28.8 °C / 83.8 F (-6.6 °C / -11.9 F).
Dell G7 7590 ljudanalys
(+) | högtalare kan spela relativt högt (89.8 dB)
Bas 100 - 315 Hz
(-) | nästan ingen bas - i genomsnitt 22.8% lägre än medianen
(±) | linjäriteten för basen är genomsnittlig (8.6% delta till föregående frekvens)
Mellan 400 - 2000 Hz
(±) | högre mellan - i genomsnitt 5.7% högre än median
(±) | linjäriteten för mids är genomsnittlig (7.3% delta till föregående frekvens)
Högsta 2 - 16 kHz
(+) | balanserade toppar - endast 4.6% från medianen
(±) | linjäriteten för toppar är genomsnittlig (9.3% delta till föregående frekvens)
Totalt 100 - 16 000 Hz
(±) | linjäriteten för det totala ljudet är genomsnittlig (21.9% skillnad mot median)
Jämfört med samma klass
» 79% av alla testade enheter i den här klassen var bättre, 6% liknande, 16% sämre
» Den bästa hade ett delta på 6%, genomsnittet var 18%, sämst var 132%
Jämfört med alla testade enheter
» 63% av alla testade enheter var bättre, 7% liknande, 31% sämre
» Den bästa hade ett delta på 4%, genomsnittet var 24%, sämst var 134%
Apple MacBook 12 (Early 2016) 1.1 GHz ljudanalys
(+) | högtalare kan spela relativt högt (83.6 dB)
Bas 100 - 315 Hz
(±) | reducerad bas - i genomsnitt 11.3% lägre än medianen
(±) | linjäriteten för basen är genomsnittlig (14.2% delta till föregående frekvens)
Mellan 400 - 2000 Hz
(+) | balanserad mellan - endast 2.4% från medianen
(+) | mids är linjära (5.5% delta till föregående frekvens)
Högsta 2 - 16 kHz
(+) | balanserade toppar - endast 2% från medianen
(+) | toppar är linjära (4.5% delta till föregående frekvens)
Totalt 100 - 16 000 Hz
(+) | det totala ljudet är linjärt (10.2% skillnad mot median)
Jämfört med samma klass
» 7% av alla testade enheter i den här klassen var bättre, 2% liknande, 91% sämre
» Den bästa hade ett delta på 5%, genomsnittet var 18%, sämst var 53%
Jämfört med alla testade enheter
» 5% av alla testade enheter var bättre, 1% liknande, 94% sämre
» Den bästa hade ett delta på 4%, genomsnittet var 24%, sämst var 134%
| Av/Standby | |
| Låg belastning | |
| Hög belastning |
|
Förklaring:
min: | |
| Dell G7 7590 i7-9750H, GeForce RTX 2060 Mobile, Toshiba BG3 KBG30ZMS256G, IPS, 1920x1080, 15.6" | Alienware m15 R2 P87F i7-9750H, GeForce RTX 2080 Max-Q, 2x Toshiba XG6 KXG60ZNV512G (RAID 0), IPS, 1920x1080, 15.6" | Razer Blade 15 GTX 1660 Ti i7-9750H, GeForce GTX 1660 Ti Mobile, Samsung SSD PM981 MZVLB256HAHQ, IPS, 1920x1080, 15.6" | Alienware 15 R3 Max-Q i7-7820HK, GeForce GTX 1080 Max-Q, LiteOn CX2-8B256, IPS, 1920x1080, 15.6" | Lenovo Legion Y7000P-1060 i7-8750H, GeForce GTX 1060 Mobile, Samsung SSD PM981 MZVLB256HAHQ, IPS, 1920x1080, 15.6" | MSI GL65 9SEK i7-9750H, GeForce RTX 2060 Mobile, WDC PC SN520 SDAPNUW-512G, IPS, 1920x1080, 15.6" | |
|---|---|---|---|---|---|---|
| Power Consumption | -49% | -22% | -22% | 32% | -75% | |
| Idle Minimum * (Watt) | 11.2 | 19 -70% | 18.7 -67% | 22 -96% | 4.9 56% | 41 -266% |
| Idle Average * (Watt) | 16.3 | 40.5 -148% | 30.7 -88% | 26 -60% | 8.1 50% | 45.3 -178% |
| Idle Maximum * (Watt) | 46.2 | 52 -13% | 33.9 27% | 33 29% | 16.5 64% | 47.1 -2% |
| Load Average * (Watt) | 123.3 | 132.3 -7% | 93.4 24% | 86 30% | 109.2 11% | 94.9 23% |
| Witcher 3 ultra * (Watt) | 135.6 | 183.3 -35% | 158.9 -17% | 159 -17% | 124.6 8% | 149.4 -10% |
| Load Maximum * (Watt) | 181.5 | 217.2 -20% | 195.3 -8% | 215 -18% | 175.2 3% | 214.2 -18% |
* ... mindre är bättre
| Dell G7 7590 i7-9750H, GeForce RTX 2060 Mobile, 60 Wh | Lenovo Legion Y740-15ICHg i7-8750H, GeForce RTX 2070 Max-Q, 57 Wh | HP Omen X 2S 15-dg0075cl i7-9750H, GeForce RTX 2070 Max-Q, 72 Wh | Asus Strix Scar III G531GW-AZ062T i7-9750H, GeForce RTX 2070 Mobile, 66 Wh | Dell G3 3590 i5-9300H, GeForce GTX 1650 Mobile, 51 Wh | Alienware m15 R2 P87F i7-9750H, GeForce RTX 2080 Max-Q, 76 Wh | |
|---|---|---|---|---|---|---|
| Batteridrifttid | -53% | -49% | 22% | 15% | -19% | |
| Reader / Idle (h) | 11.1 | 3.9 -65% | 3.7 -67% | 13.5 22% | 9.2 -17% | |
| WiFi v1.3 (h) | 4.6 | 2.8 -39% | 2.2 -52% | 5.6 22% | 6.7 46% | 5.5 20% |
| Load (h) | 1.8 | 0.8 -56% | 1.3 -28% | 1.4 -22% | 0.7 -61% |
För
Emot
Läs den fullständiga versionen av den här recensionen på engelska här.
G7 15 7590 befinner sig i ett intressant läge. Den har liknande alternativ för Core i9, GeForce RTX och IPS/OLED som den dyrare Alienware m15 R2 men till ett lägre utgångspris. Om du vill ha kraften från en Alienware-laptop men inte är särskilt förtjust i den skrikiga Alienware-designen kan den opretentiösa och visuellt sett enkla G7 15 7590 hjälpa dig att spara pengar utan att du behöver offra prestanda eller chassikvalitet.
Det finns rum för förbättring. Även om processorns Turbo Boost ligger över genomsnittet och det är lätt att serva datorn är Toshibas SSD långsam för en NVMe-enhet, basåtergivningen är medelmåttig och skärmen var dåligt kalibrerad vid leverans. Dessa brister är lättare att förlåta på instegsmaskiner som i Dells G3- eller G5-serier, men det finns ingen ursäkt för ett system i G7-serien som befinner sig i mittenskiktet. Locket kunde också varit fastare och fläkten låter ganska mycket när man spelar, till och med för en maskin i den här kategorin. Konkurrenter som Lenovo Legion Y740 och HP Pavilion 15 Gaming är märkbart tystare.
Dell G7 15 7590 är ett utmärkt alternativ till Alienware m15 R2, särskilt med tanke på att den har samma CPU-, GPU- och skärmalternativ samt möjligheten att uppgradera RAM. Den är bland de bästa vi sett på att upprätthålla processorns Turbo Boost i den här kategorin och storleksklassen; var bara redo på att fläktarna kommer låta mycket när man spelar.
Dell G7 7590
- 05/15/2020 v7 (old)
Allen Ngo
Price comparison
