Test: Lenovo ThinkPad L13 Yoga - Välutrustad omvandlingsbar för företaget (Sammanfattning)
Gradering | Datum | Modell | Vikt | Höjd | Storlek | Upplösning | Pris |
|---|---|---|---|---|---|---|---|
| 88.2 % v7 (old) | 04/2020 | Lenovo ThinkPad L13 Yoga 20R6S00800 i5-10210U, UHD Graphics 620 | 1.4 kg | 17.6 mm | 13.30" | 1920x1080 | |
| 86.3 % v6 (old) | 04/2019 | Lenovo ThinkPad L390 Yoga-20NT000XGE i5-8265U, UHD Graphics 620 | 1.5 kg | 18.8 mm | 13.30" | 1920x1080 | |
| 84.3 % v6 (old) | 07/2019 | HP Envy x360 13-ar0601ng R7 3700U, Vega 10 | 1.3 kg | 14.7 mm | 13.30" | 1920x1080 | |
| 81 % v7 (old) | 02/2020 | HP Pavilion x360 14-dh1153ng i5-10210U, UHD Graphics 620 | 1.6 kg | 20.5 mm | 14.00" | 1920x1080 | |
| 84.3 % v7 (old) | 03/2020 | Lenovo Yoga C740-14IML i5-10210U, UHD Graphics 620 | 1.4 kg | 16.9 mm | 14.00" | 1920x1080 |


| SD Card Reader | |
| average JPG Copy Test (av. of 3 runs) | |
| HP Envy x360 13-ar0601ng (Toshiba Exceria Pro M501 microSDXC 64GB) | |
| HP Pavilion x360 14-dh1153ng (Toshiba Exceria Pro SDXC 64 GB UHS-II) | |
| Lenovo ThinkPad L13 Yoga 20R6S00800 | |
| Lenovo ThinkPad L390 Yoga-20NT000XGE (Toshiba Exceria Pro M501 UHS-II) | |
| Genomsnitt av klass Convertible (28.1 - 197, n=23, senaste 2 åren) | |
| maximum AS SSD Seq Read Test (1GB) | |
| Genomsnitt av klass Convertible (28.9 - 254, n=22, senaste 2 åren) | |
| HP Envy x360 13-ar0601ng (Toshiba Exceria Pro M501 microSDXC 64GB) | |
| Lenovo ThinkPad L13 Yoga 20R6S00800 (Toshiba Exceria Pro M501 64 GB UHS-II) | |
| HP Pavilion x360 14-dh1153ng (Toshiba Exceria Pro SDXC 64 GB UHS-II) | |
| Lenovo ThinkPad L390 Yoga-20NT000XGE (Toshiba Exceria Pro M501 UHS-II) | |
| |||||||||||||||||||||||||
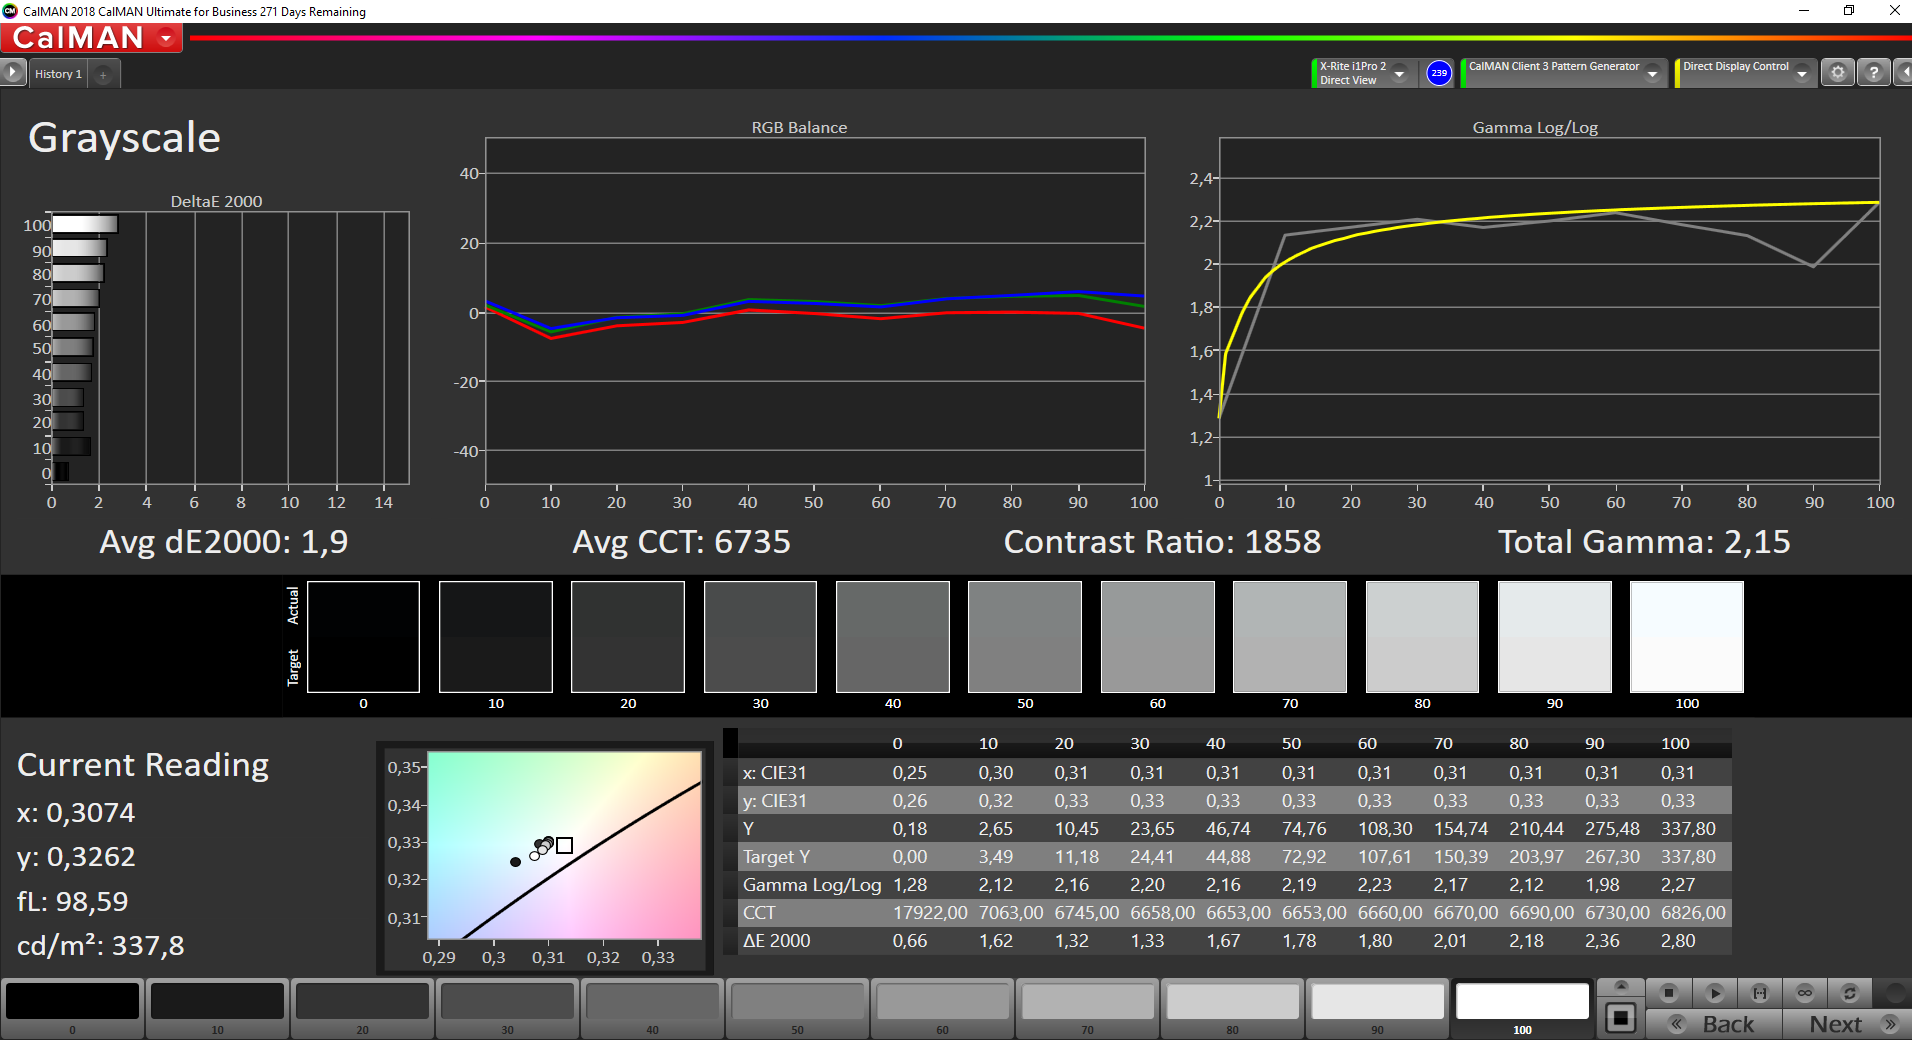
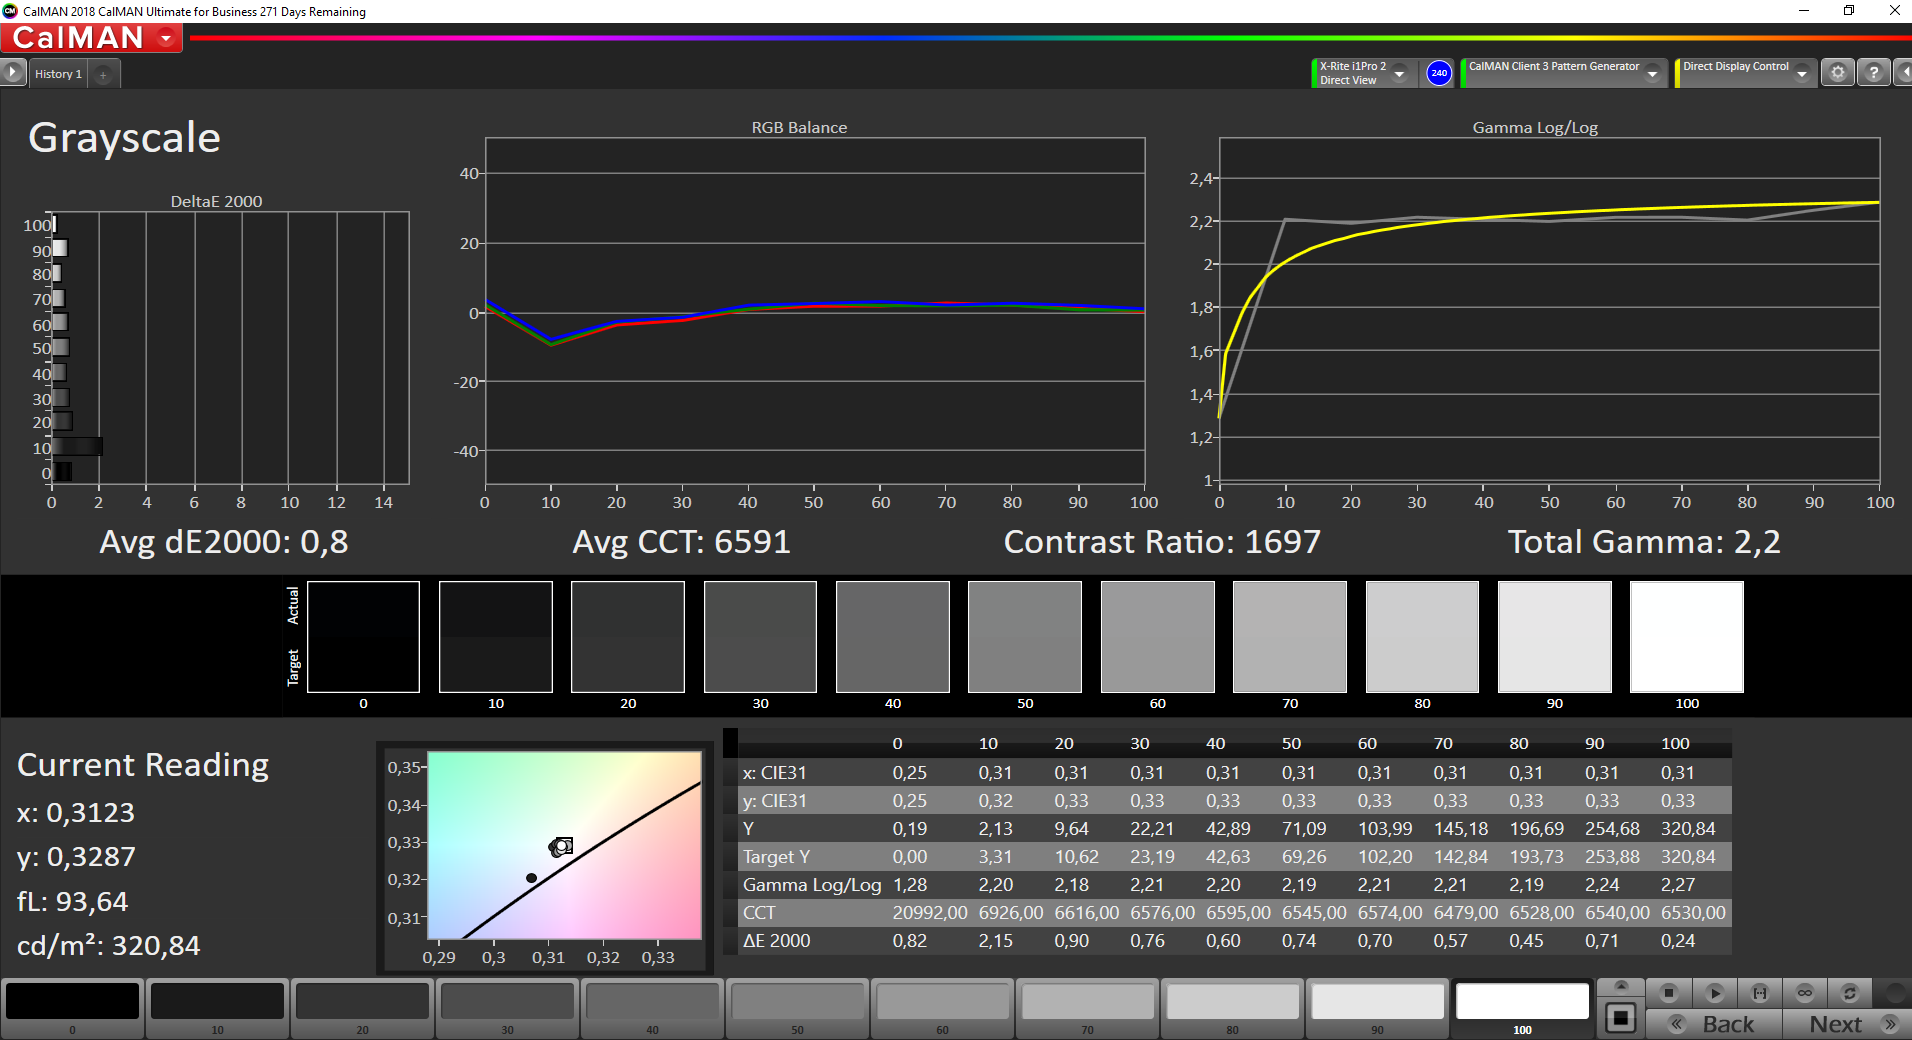
Distribution av ljusstyrkan: 90 %
Mitt på batteriet: 338 cd/m²
Kontrast: 1889:1 (Svärta: 0.18 cd/m²)
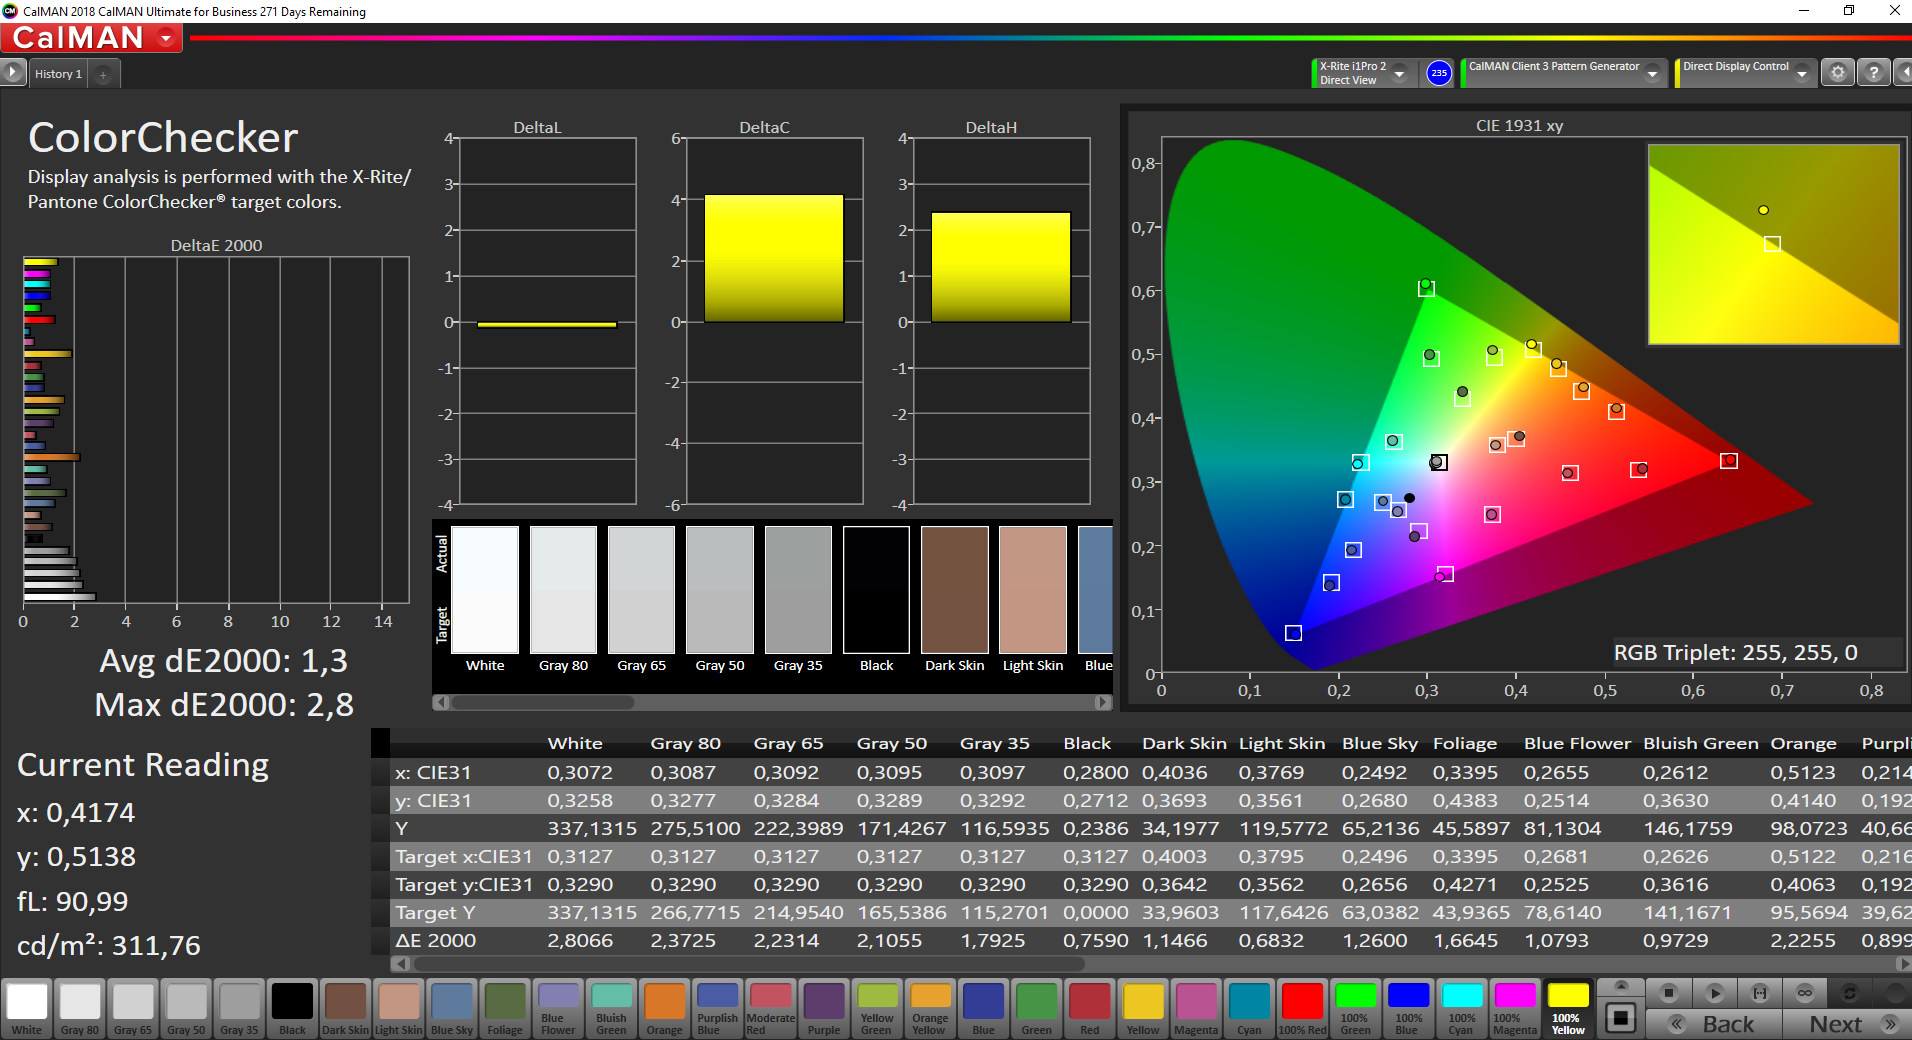
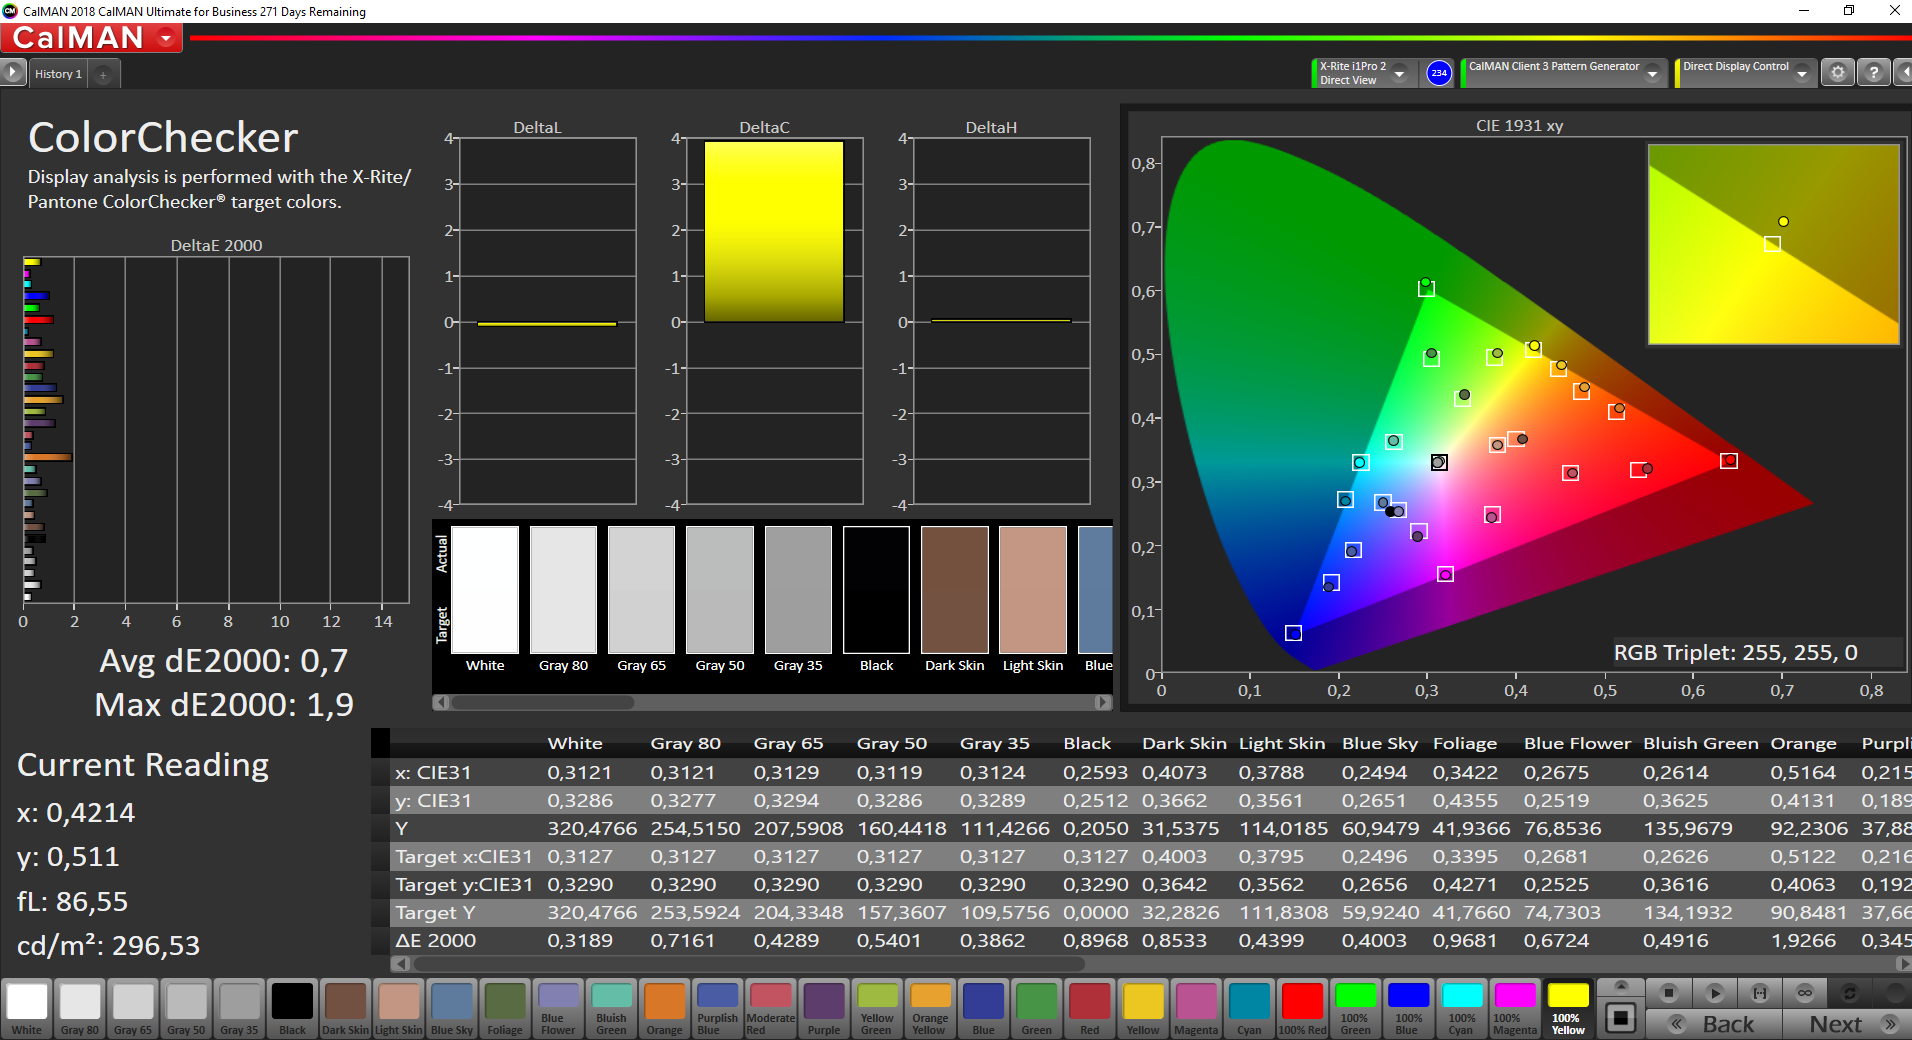
ΔE ColorChecker Calman: 1.3 | ∀{0.5-29.43 Ø4.73}
calibrated: 0.7
ΔE Greyscale Calman: 1.9 | ∀{0.09-98 Ø4.97}
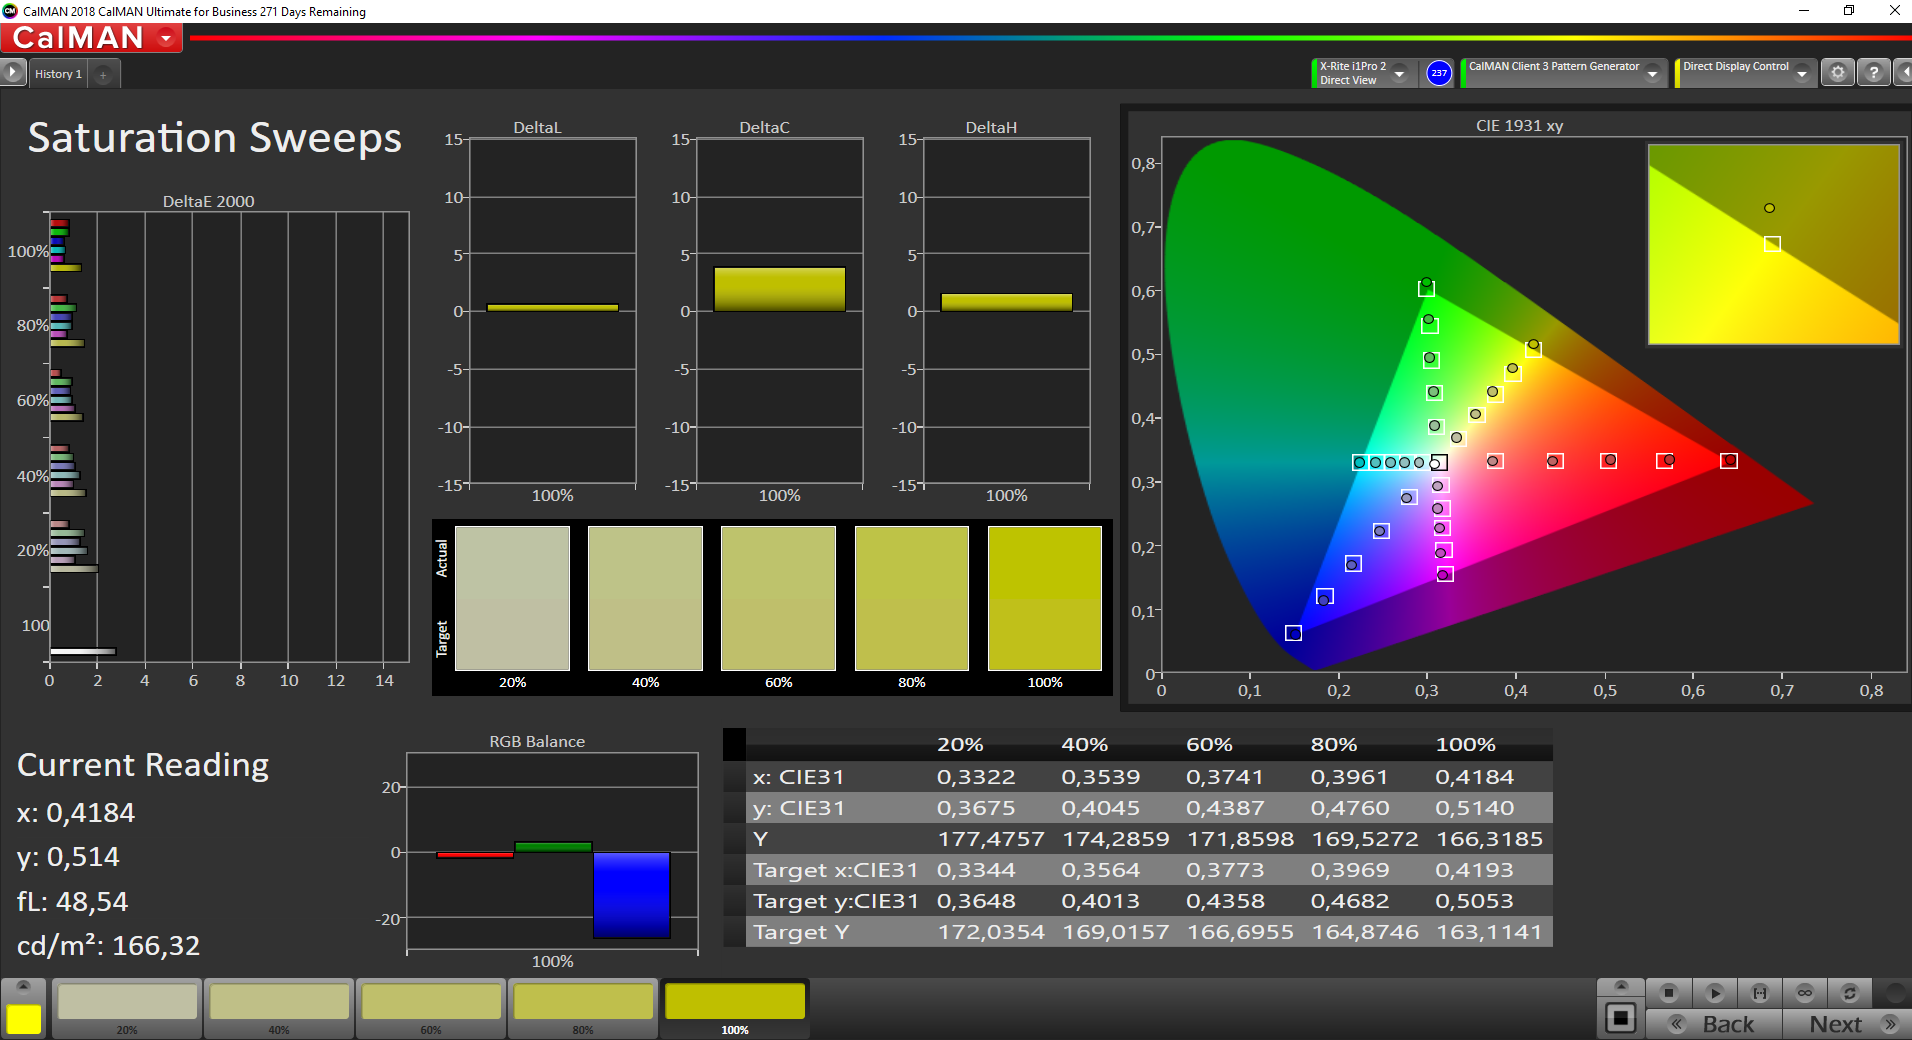
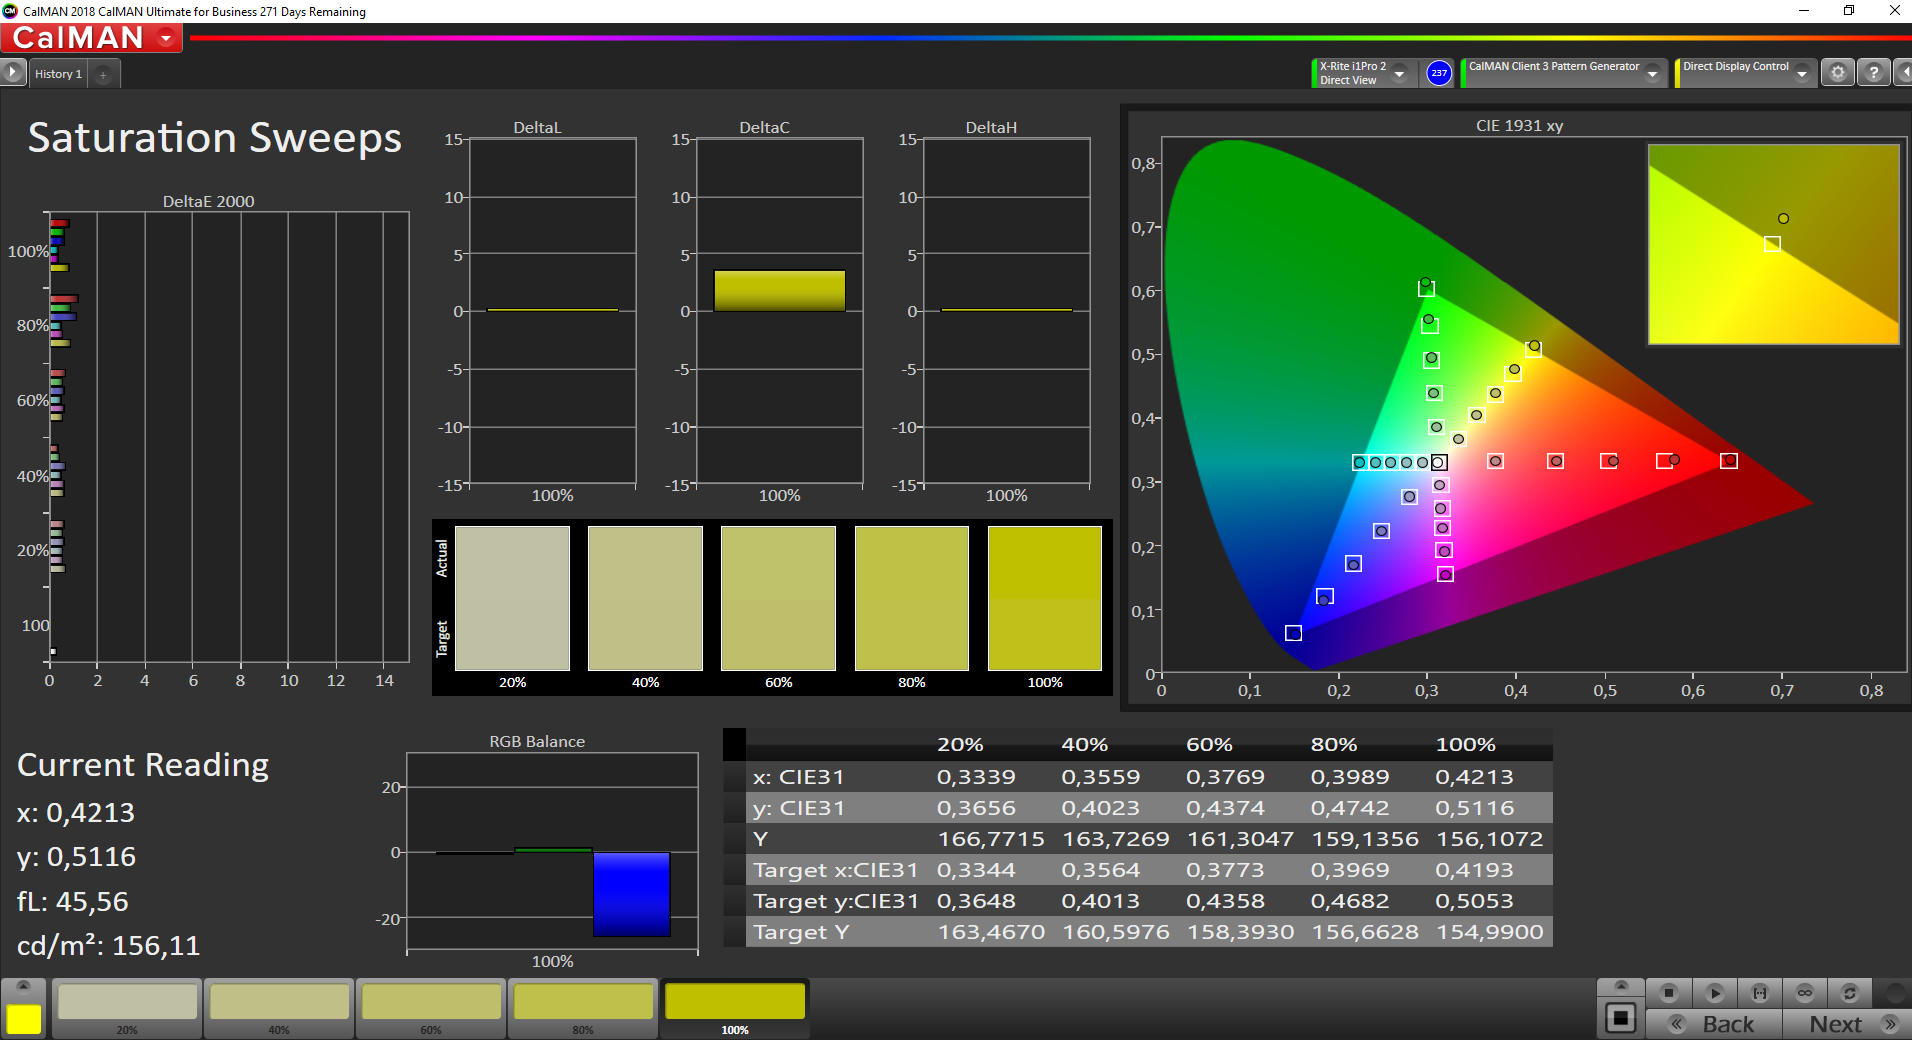
99.6% sRGB (Argyll 1.6.3 3D)
64.1% AdobeRGB 1998 (Argyll 1.6.3 3D)
70.2% AdobeRGB 1998 (Argyll 3D)
94.7% sRGB (Argyll 3D)
68.1% Display P3 (Argyll 3D)
Gamma: 2.15
CCT: 6735 K
| Lenovo ThinkPad L13 Yoga 20R6S00800 N133HCE-EP2, IPS, 1920x1080, 13.3" | Lenovo ThinkPad L390 Yoga-20NT000XGE LEN4094, NV133FHM-N5A, IPS LED, 1920x1080, 13.3" | HP Envy x360 13-ar0601ng InfoVision, M133NVF3 R2, IPS, 120 Hz, 1920x1080, 13.3" | HP Pavilion x360 14-dh1153ng BOE NV140FHM-N4K, IPS, 1920x1080, 14" | Lenovo Yoga C740-14IML CMN N140HCE-ET2, IPS, 1920x1080, 14" | |
|---|---|---|---|---|---|
| Display | -3% | -7% | -41% | 1% | |
| Display P3 Coverage (%) | 68.1 | 69.2 2% | 63 -7% | 39.35 -42% | 67.9 0% |
| sRGB Coverage (%) | 94.7 | 90.6 -4% | 90.8 -4% | 58.8 -38% | 98.3 4% |
| AdobeRGB 1998 Coverage (%) | 70.2 | 66.3 -6% | 63.8 -9% | 40.65 -42% | 70.1 0% |
| Response Times | -30% | 17% | -14% | -10% | |
| Response Time Grey 50% / Grey 80% * (ms) | 40 ? | 51.2 ? -28% | 35 ? 12% | 44 ? -10% | 35.6 ? 11% |
| Response Time Black / White * (ms) | 28 ? | 36.8 ? -31% | 22 ? 21% | 33 ? -18% | 36.8 ? -31% |
| PWM Frequency (Hz) | 25000 ? | 1000 ? | 4065 ? | 192 ? | 27030 ? |
| Screen | -120% | -57% | -170% | -72% | |
| Brightness middle (cd/m²) | 340 | 313 -8% | 633 86% | 248 -27% | 329.9 -3% |
| Brightness (cd/m²) | 336 | 295 -12% | 675 101% | 238 -29% | 315 -6% |
| Brightness Distribution (%) | 90 | 90 0% | 75 -17% | 74 -18% | 90 0% |
| Black Level * (cd/m²) | 0.18 | 0.22 -22% | 0.55 -206% | 0.235 -31% | 0.29 -61% |
| Contrast (:1) | 1889 | 1423 -25% | 1151 -39% | 1055 -44% | 1138 -40% |
| Colorchecker dE 2000 * | 1.3 | 6.2 -377% | 3.12 -140% | 5.43 -318% | 3.68 -183% |
| Colorchecker dE 2000 max. * | 2.8 | 10.7 -282% | 6.37 -128% | 17.96 -541% | 8.64 -209% |
| Colorchecker dE 2000 calibrated * | 0.7 | 2.5 -257% | 1.83 -161% | 5.7 -714% | 1.03 -47% |
| Greyscale dE 2000 * | 1.9 | 8 -321% | 3.89 -105% | 3.18 -67% | 6.4 -237% |
| Gamma | 2.15 102% | 2.38 92% | 2.39 92% | 2.56 86% | 2.17 101% |
| CCT | 6735 97% | 7100 92% | 6476 100% | 6642 98% | 6195 105% |
| Color Space (Percent of AdobeRGB 1998) (%) | 64.1 | 59.1 -8% | 59 -8% | 37.3 -42% | 63.6 -1% |
| Color Space (Percent of sRGB) (%) | 99.6 | 90.6 -9% | 91 -9% | 58.4 -41% | 98.4 -1% |
| Totalt genomsnitt (program/inställningar) | -51% /
-87% | -16% /
-38% | -75% /
-126% | -27% /
-50% |
* ... mindre är bättre
Visa svarstider
| ↔ Svarstid svart till vitt | ||
|---|---|---|
| 28 ms ... stiga ↗ och falla ↘ kombinerat | ↗ 15.6 ms stiga | 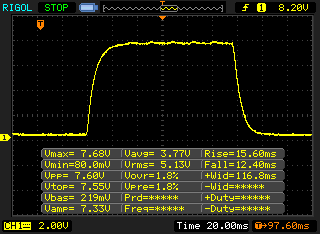 |
| ↘ 12.4 ms hösten | ||
| Skärmen visar relativt långsamma svarsfrekvenser i våra tester och kan vara för långsam för spelare. I jämförelse sträcker sig alla testade enheter från 0.1 (minst) till 240 (maximalt) ms. » 71 % av alla enheter är bättre. Detta innebär att den uppmätta svarstiden är sämre än genomsnittet av alla testade enheter (19.9 ms). | ||
| ↔ Svarstid 50 % grått till 80 % grått | ||
| 40 ms ... stiga ↗ och falla ↘ kombinerat | ↗ 21.6 ms stiga | 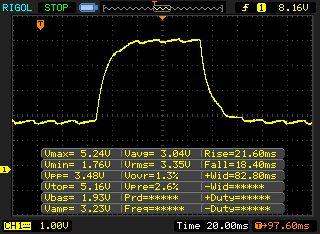 |
| ↘ 18.4 ms hösten | ||
| Skärmen visar långsamma svarsfrekvenser i våra tester och kommer att vara otillfredsställande för spelare. I jämförelse sträcker sig alla testade enheter från 0.165 (minst) till 636 (maximalt) ms. » 61 % av alla enheter är bättre. Detta innebär att den uppmätta svarstiden är sämre än genomsnittet av alla testade enheter (31.1 ms). | ||
Skärmflimmer / PWM (Puls-Width Modulation)
| Skärmflimmer / PWM upptäckt | 25000 Hz | ≤ 50 % ljusstyrka inställning | 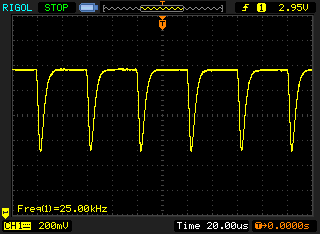 |
Displayens bakgrundsbelysning flimrar vid 25000 Hz (i värsta fall, t.ex. med PWM) Flimrande upptäckt vid en ljusstyrkeinställning på 50 % och lägre. Det ska inte finnas något flimmer eller PWM över denna ljusstyrkeinställning. Frekvensen för 25000 Hz är ganska hög, så de flesta användare som är känsliga för PWM bör inte märka något flimmer. Som jämförelse: 52 % av alla testade enheter använder inte PWM för att dämpa skärmen. Om PWM upptäcktes mättes ett medelvärde av 7798 (minst: 5 - maximum: 343500) Hz. | |||
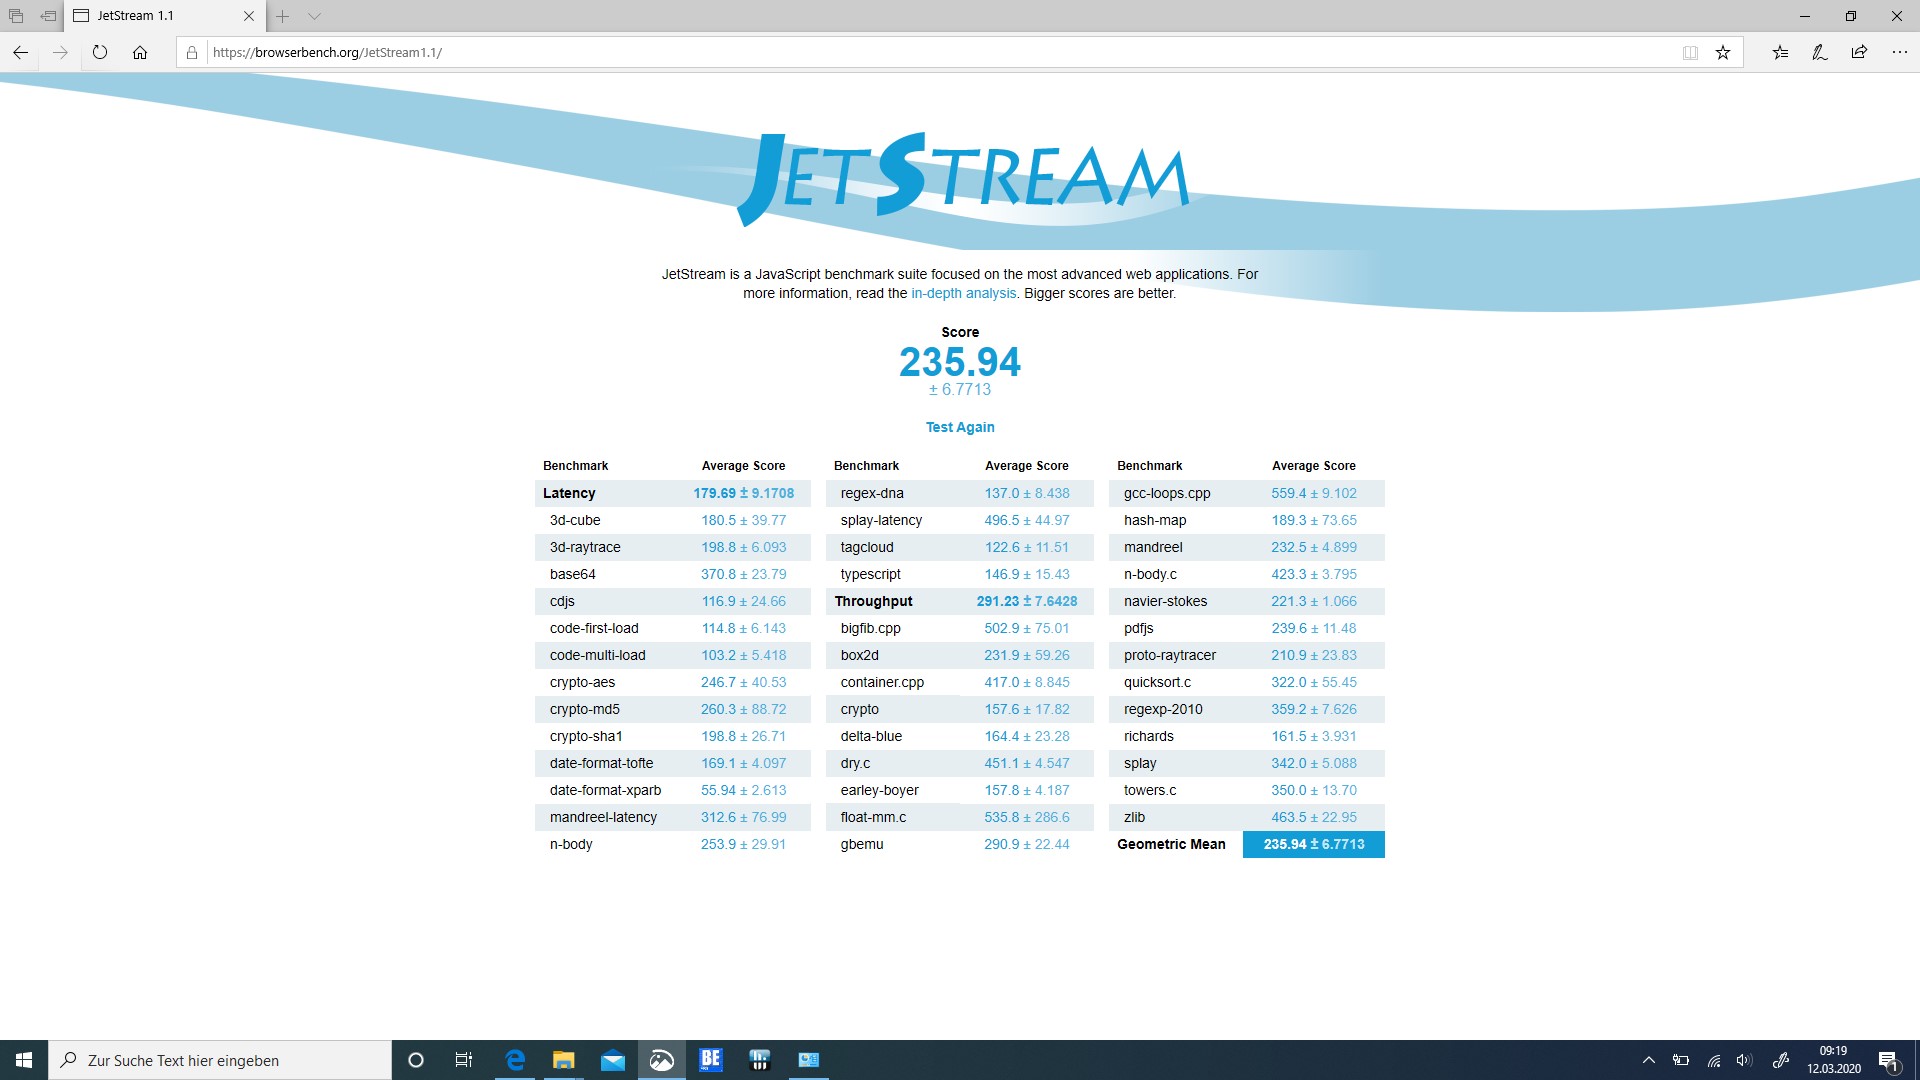
| JetStream 1.1 - 1.1 Total | |
| Lenovo Yoga C740-14IML | |
| Genomsnitt Intel Core i5-10210U (191.3 - 252, n=14) | |
| Lenovo ThinkPad L13 Yoga 20R6S00800 | |
| Lenovo ThinkPad L390 Yoga-20NT000XGE | |
| HP Pavilion x360 14-dh1153ng | |
* ... mindre är bättre
| PCMark 8 Home Score Accelerated v2 | 4284 poäng | |
| PCMark 8 Creative Score Accelerated v2 | 5440 poäng | |
| PCMark 8 Work Score Accelerated v2 | 5063 poäng | |
| PCMark 10 Score | 4353 poäng | |
Hjälp | ||
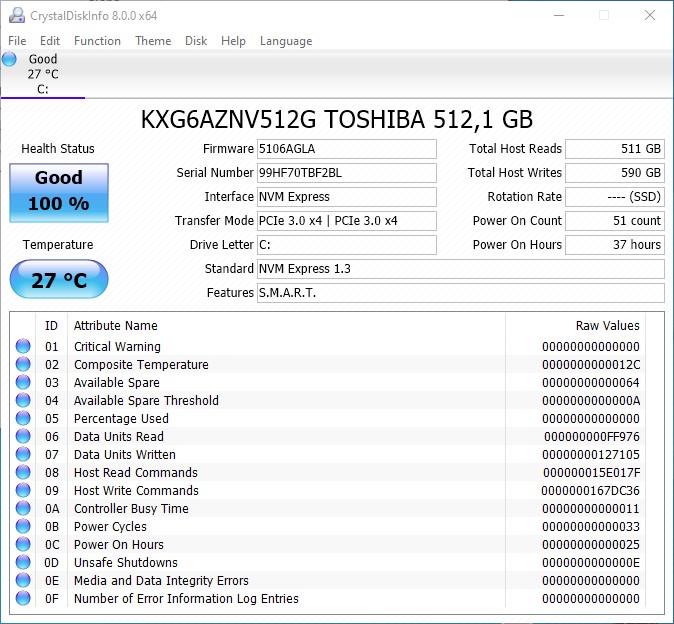
| Lenovo ThinkPad L13 Yoga 20R6S00800 Toshiba XG6 KXG6AZNV512G | Lenovo ThinkPad L390 Yoga-20NT000XGE Samsung SSD PM981 MZVLB256HAHQ | HP Envy x360 13-ar0601ng SK Hynix BC501 HFM512GDJTNG | HP Pavilion x360 14-dh1153ng Intel Optane Memory H10 with Solid State Storage 32GB + 512GB HBRPEKNX0202A(L/H) | Lenovo Yoga C740-14IML Samsung SSD PM981a MZVLB256HBHQ | Genomsnitt Toshiba XG6 KXG6AZNV512G | |
|---|---|---|---|---|---|---|
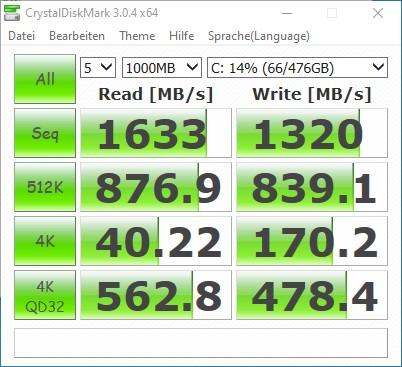
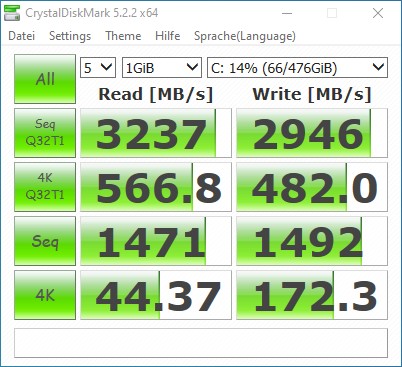
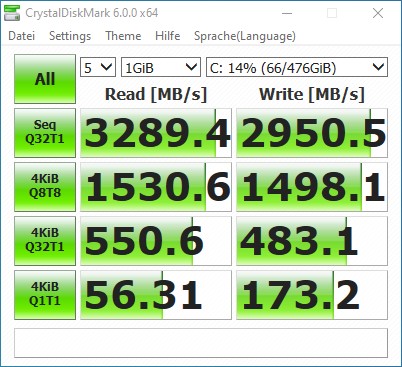
| CrystalDiskMark 5.2 / 6 | -15% | -50% | 13% | -4% | -7% | |
| Write 4K (MB/s) | 172.3 | 126.3 -27% | 88.3 -49% | 162.7 -6% | 125.6 -27% | 139 ? -19% |
| Read 4K (MB/s) | 44.37 | 41.58 -6% | 34.84 -21% | 190.5 329% | 43.46 -2% | 45.8 ? 3% |
| Write Seq (MB/s) | 1492 | 1383 -7% | 740 -50% | 450.1 -70% | 2011 35% | 1628 ? 9% |
| Read Seq (MB/s) | 1471 | 2012 37% | 985 -33% | 1624 10% | 2046 39% | 1647 ? 12% |
| Write 4K Q32T1 (MB/s) | 483.1 | 543 12% | 313.7 -35% | 353.5 -27% | 375.8 -22% | 547 ? 13% |
| Read 4K Q32T1 (MB/s) | 551 | 411 -25% | 243.1 -56% | 397.7 -28% | 338.1 -39% | 436 ? -21% |
| Write Seq Q32T1 (MB/s) | 2951 | 1712 -42% | 846 -71% | 937 -68% | 2346 -21% | 2522 ? -15% |
| Read Seq Q32T1 (MB/s) | 3289 | 3423 4% | 1783 -46% | 2145 -35% | 3562 8% | 2739 ? -17% |
| Write 4K Q8T8 (MB/s) | 1498 | 1031 -31% | 305.7 -80% | 1266 ? -15% | ||
| Read 4K Q8T8 (MB/s) | 1531 | 572 -63% | 698 -54% | 1212 ? -21% | ||
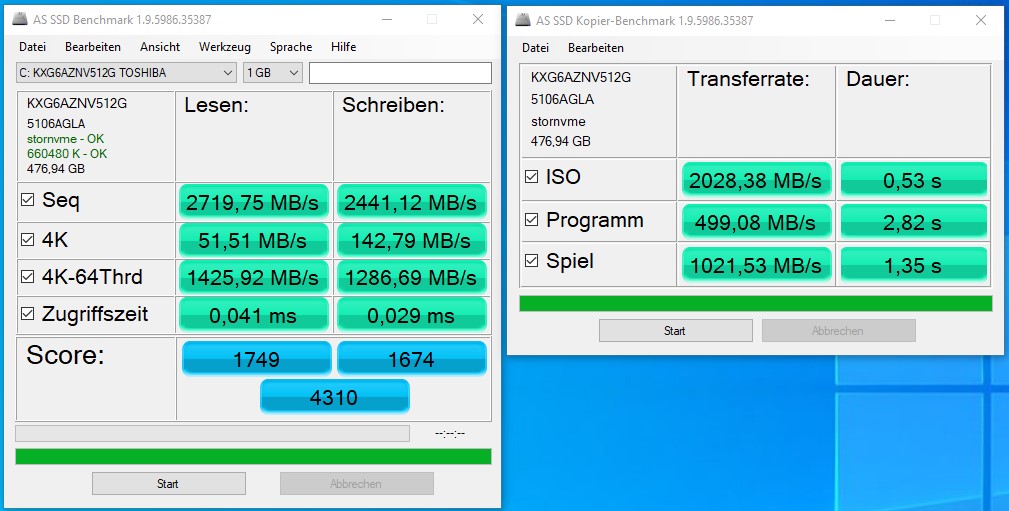
| AS SSD | -26% | -54% | -60% | -36% | -19% | |
| Seq Read (MB/s) | 2719 | 1724 -37% | 1412 -48% | 1241 -54% | 1719 -37% | 2383 ? -12% |
| Seq Write (MB/s) | 2441 | 1123 -54% | 540 -78% | 372.5 -85% | 1211 -50% | 1459 ? -40% |
| 4K Read (MB/s) | 51.5 | 51.8 1% | 32.24 -37% | 65.4 27% | 53.1 3% | 46.8 ? -9% |
| 4K Write (MB/s) | 142.8 | 133.8 -6% | 74.7 -48% | 114.8 -20% | 131.4 -8% | 125.1 ? -12% |
| 4K-64 Read (MB/s) | 1426 | 745 -48% | 567 -60% | 416.9 -71% | 508 -64% | 1294 ? -9% |
| 4K-64 Write (MB/s) | 1287 | 1193 -7% | 700 -46% | 516 -60% | 883 -31% | 1276 ? -1% |
| Access Time Read * (ms) | 0.041 | 0.041 -0% | 0.049 -20% | 0.097 -137% | 0.05 -22% | 0.0825 ? -101% |
| Access Time Write * (ms) | 0.029 | 0.028 3% | 0.048 -66% | 0.045 -55% | 0.085 -193% | 0.0335 ? -16% |
| Score Read (Points) | 1749 | 969 -45% | 741 -58% | 606 -65% | 733 -58% | 1580 ? -10% |
| Score Write (Points) | 1674 | 1440 -14% | 829 -50% | 668 -60% | 1135 -32% | 1547 ? -8% |
| Score Total (Points) | 4310 | 2889 -33% | 1913 -56% | 1567 -64% | 2235 -48% | 3893 ? -10% |
| Copy ISO MB/s (MB/s) | 2028 | 1025 -49% | 521 -74% | 504 -75% | 1636 -19% | 1645 ? -19% |
| Copy Program MB/s (MB/s) | 499.1 | 322.1 -35% | 253.1 -49% | 222.6 -55% | 698 40% | 425 ? -15% |
| Copy Game MB/s (MB/s) | 1022 | 637 -38% | 392.9 -62% | 421.2 -59% | 1246 22% | 933 ? -9% |
| Totalt genomsnitt (program/inställningar) | -21% /
-21% | -52% /
-52% | -24% /
-33% | -20% /
-24% | -13% /
-14% |
* ... mindre är bättre

| 3DMark 11 Performance | 2073 poäng | |
| 3DMark Ice Storm Standard Score | 64237 poäng | |
| 3DMark Cloud Gate Standard Score | 8834 poäng | |
| 3DMark Fire Strike Score | 1206 poäng | |
| 3DMark Fire Strike Extreme Score | 588 poäng | |
| 3DMark Time Spy Score | 472 poäng | |
Hjälp | ||
| låg | med. | hög | ultra | |
|---|---|---|---|---|
| BioShock Infinite (2013) | 73 | 40 | 35 | 11 |
| Dota 2 Reborn (2015) | 82 | 52.5 | 20.4 | 17.8 |
| Rise of the Tomb Raider (2016) | 22.8 | 14.6 | 7.48 | |
| X-Plane 11.11 (2018) | 23.6 | 14.8 | 13.5 |
Ljudnivå
| Låg belastning |
| 29.3 / 29.3 / 29.3 dB(A) |
| Hög belastning |
| 32.7 / 32.7 dB(A) |
 | ||
30 dB tyst 40 dB(A) hörbar 50 dB(A) högt ljud |
||
min: | ||
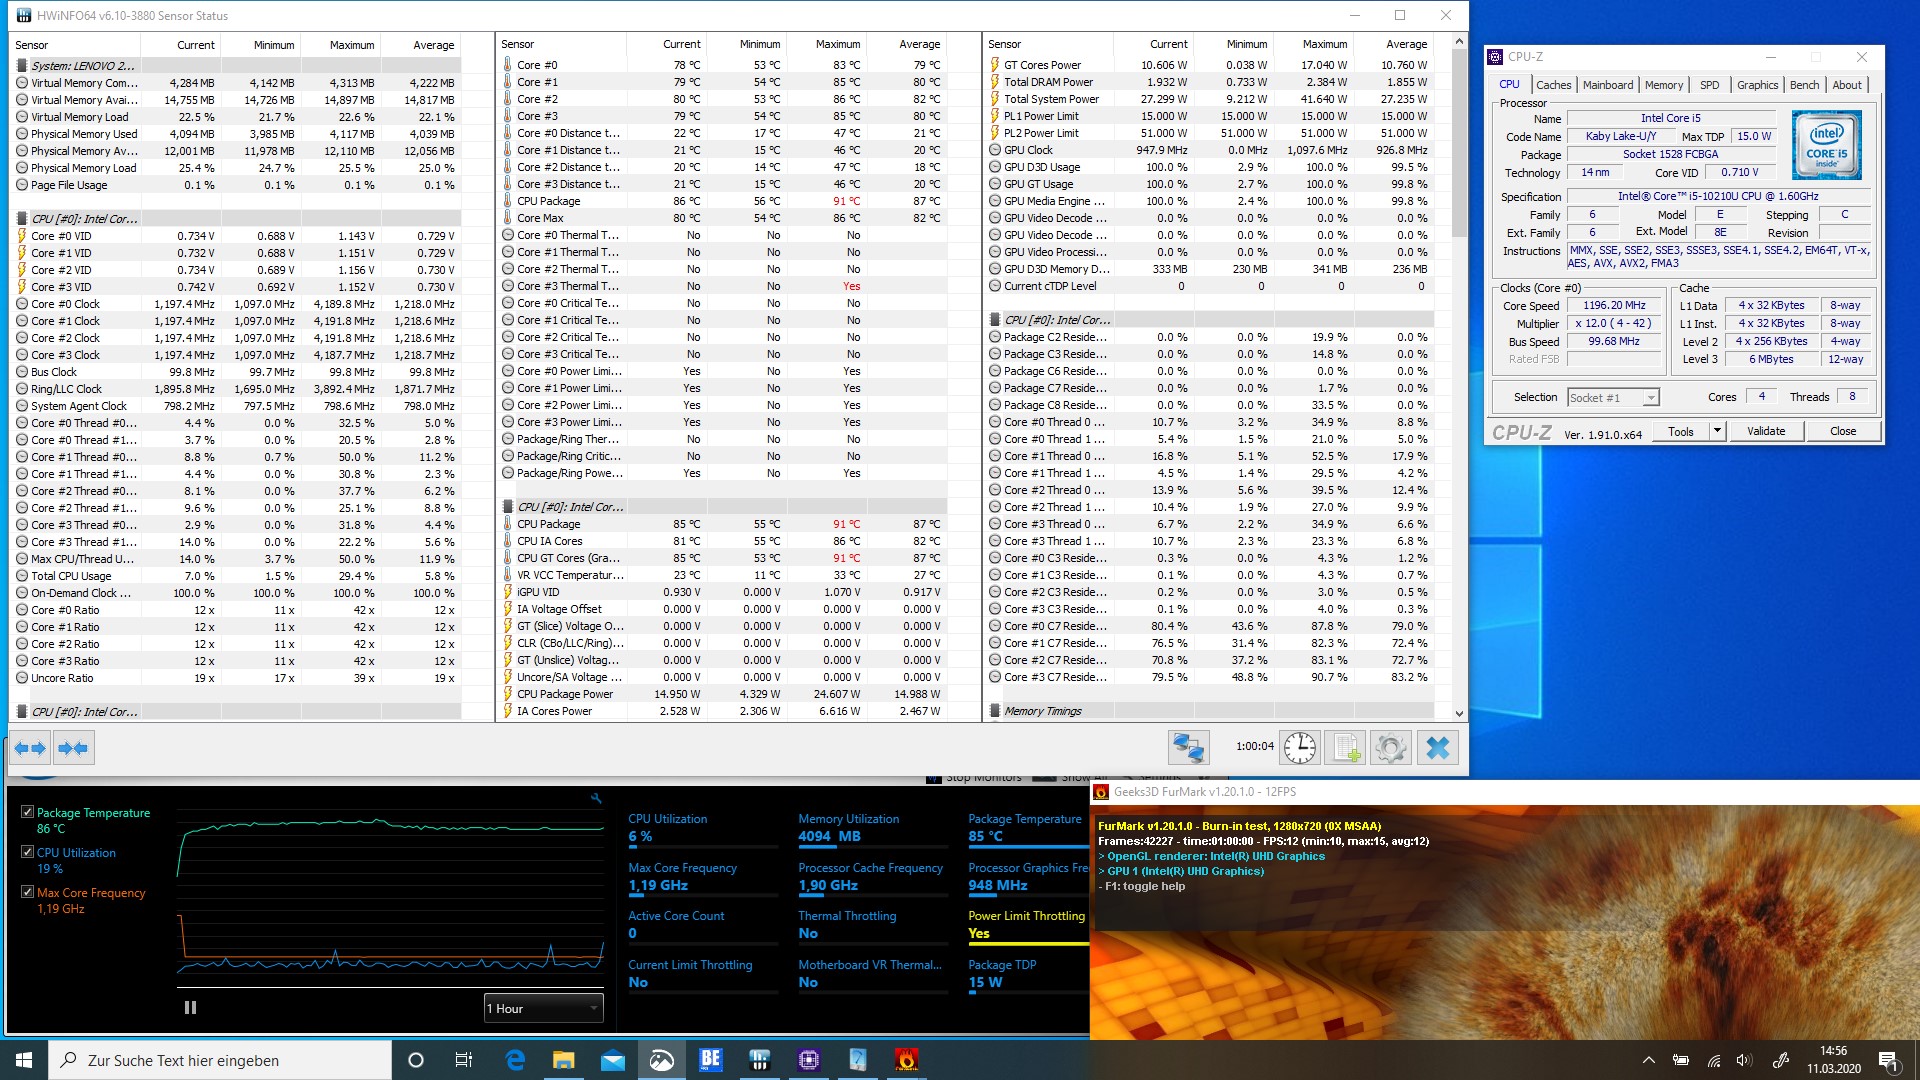
(-) Den maximala temperaturen på ovansidan är 49.3 °C / 121 F, jämfört med genomsnittet av 35.4 °C / 96 F , allt från 19.6 till 60 °C för klassen Convertible.
(-) Botten värms upp till maximalt 62.9 °C / 145 F, jämfört med genomsnittet av 36.9 °C / 98 F
(+) Vid tomgångsbruk är medeltemperaturen för ovansidan 23.4 °C / 74 F, jämfört med enhetsgenomsnittet på 30.3 °C / ### class_avg_f### F.
(+) Handledsstöden och pekplattan är kallare än hudtemperaturen med maximalt 24.3 °C / 75.7 F och är därför svala att ta på.
(+) Medeltemperaturen för handledsstödsområdet på liknande enheter var 28 °C / 82.4 F (+3.7 °C / 6.7 F).
Lenovo ThinkPad L13 Yoga 20R6S00800 ljudanalys
(±) | högtalarljudstyrkan är genomsnittlig men bra (75.8 dB)
Bas 100 - 315 Hz
(-) | nästan ingen bas - i genomsnitt 21.2% lägre än medianen
(±) | linjäriteten för basen är genomsnittlig (14.7% delta till föregående frekvens)
Mellan 400 - 2000 Hz
(±) | högre mellan - i genomsnitt 5.1% högre än median
(+) | mids är linjära (5.7% delta till föregående frekvens)
Högsta 2 - 16 kHz
(±) | reducerade toppar - i genomsnitt 8.1% lägre än medianen
(±) | linjäriteten för toppar är genomsnittlig (8.6% delta till föregående frekvens)
Totalt 100 - 16 000 Hz
(±) | linjäriteten för det totala ljudet är genomsnittlig (29.1% skillnad mot median)
Jämfört med samma klass
» 87% av alla testade enheter i den här klassen var bättre, 3% liknande, 10% sämre
» Den bästa hade ett delta på 6%, genomsnittet var 20%, sämst var 57%
Jämfört med alla testade enheter
» 87% av alla testade enheter var bättre, 2% liknande, 11% sämre
» Den bästa hade ett delta på 4%, genomsnittet var 24%, sämst var 134%
Lenovo ThinkPad L390 Yoga-20NT000XGE ljudanalys
(±) | högtalarljudstyrkan är genomsnittlig men bra (76.3 dB)
Bas 100 - 315 Hz
(-) | nästan ingen bas - i genomsnitt 17.9% lägre än medianen
(±) | linjäriteten för basen är genomsnittlig (12.9% delta till föregående frekvens)
Mellan 400 - 2000 Hz
(+) | balanserad mellan - endast 2.1% från medianen
(+) | mids är linjära (6.1% delta till föregående frekvens)
Högsta 2 - 16 kHz
(±) | högre toppar - i genomsnitt 7.5% högre än medianen
(±) | linjäriteten för toppar är genomsnittlig (9.1% delta till föregående frekvens)
Totalt 100 - 16 000 Hz
(±) | linjäriteten för det totala ljudet är genomsnittlig (23% skillnad mot median)
Jämfört med samma klass
» 69% av alla testade enheter i den här klassen var bättre, 5% liknande, 26% sämre
» Den bästa hade ett delta på 6%, genomsnittet var 20%, sämst var 57%
Jämfört med alla testade enheter
» 69% av alla testade enheter var bättre, 5% liknande, 26% sämre
» Den bästa hade ett delta på 4%, genomsnittet var 24%, sämst var 134%
| Av/Standby | |
| Låg belastning | |
| Hög belastning |
|
Förklaring:
min: | |
| Lenovo ThinkPad L13 Yoga 20R6S00800 i5-10210U, UHD Graphics 620, Toshiba XG6 KXG6AZNV512G, IPS, 1920x1080, 13.3" | Lenovo ThinkPad L390 Yoga-20NT000XGE i5-8265U, UHD Graphics 620, Samsung SSD PM981 MZVLB256HAHQ, IPS LED, 1920x1080, 13.3" | HP Envy x360 13-ar0601ng R7 3700U, Vega 10, SK Hynix BC501 HFM512GDJTNG, IPS, 120 Hz, 1920x1080, 13.3" | HP Pavilion x360 14-dh1153ng i5-10210U, UHD Graphics 620, Intel Optane Memory H10 with Solid State Storage 32GB + 512GB HBRPEKNX0202A(L/H), IPS, 1920x1080, 14" | Lenovo Yoga C740-14IML i5-10210U, UHD Graphics 620, Samsung SSD PM981a MZVLB256HBHQ, IPS, 1920x1080, 14" | Genomsnitt Intel UHD Graphics 620 | Genomsnitt av klass Convertible | |
|---|---|---|---|---|---|---|---|
| Power Consumption | 6% | 25% | 26% | 19% | 11% | -2% | |
| Idle Minimum * (Watt) | 3.7 | 4 -8% | 3.2 14% | 3.3 11% | 3 19% | 3.81 ? -3% | 4.29 ? -16% |
| Idle Average * (Watt) | 6.2 | 7.1 -15% | 2.8 55% | 5.8 6% | 3.9 37% | 6.94 ? -12% | 7.08 ? -14% |
| Idle Maximum * (Watt) | 11.2 | 10.7 4% | 12.4 -11% | 7.9 29% | 7.3 35% | 8.75 ? 22% | 8.68 ? 22% |
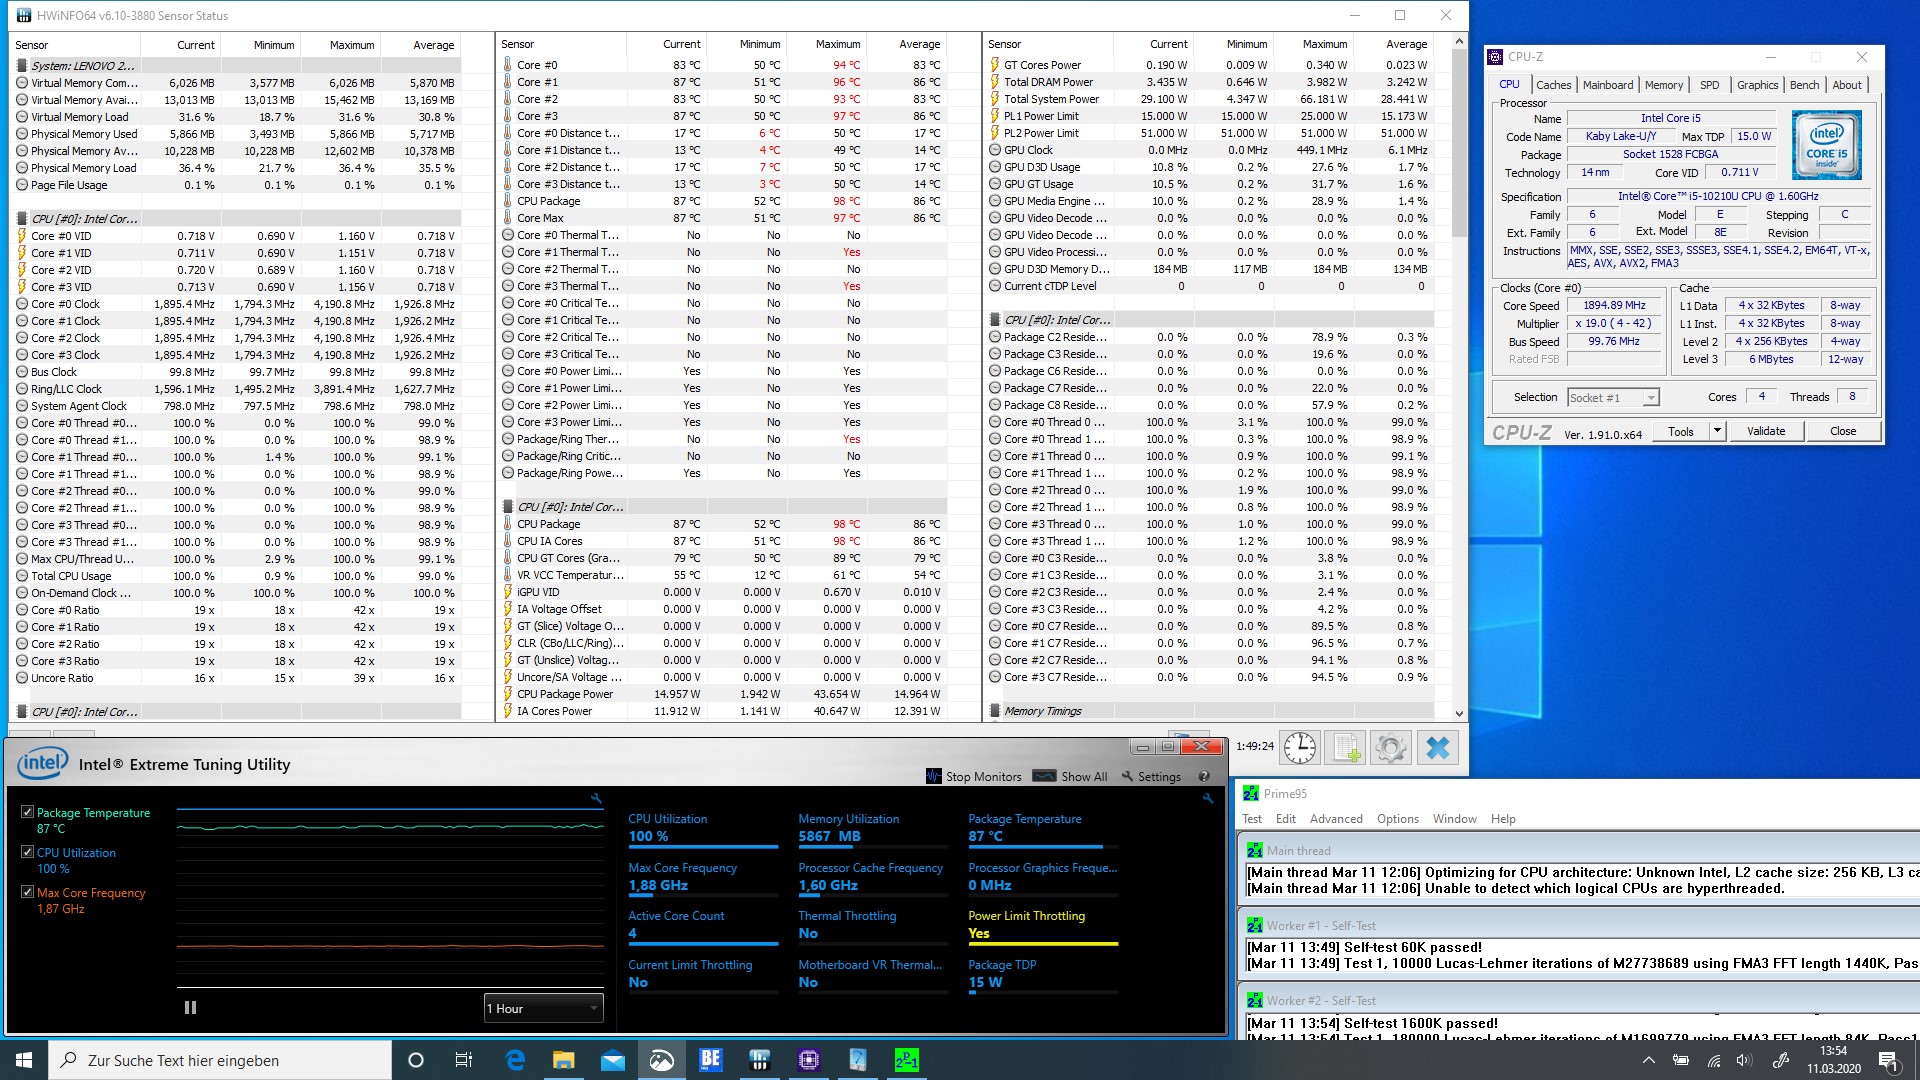
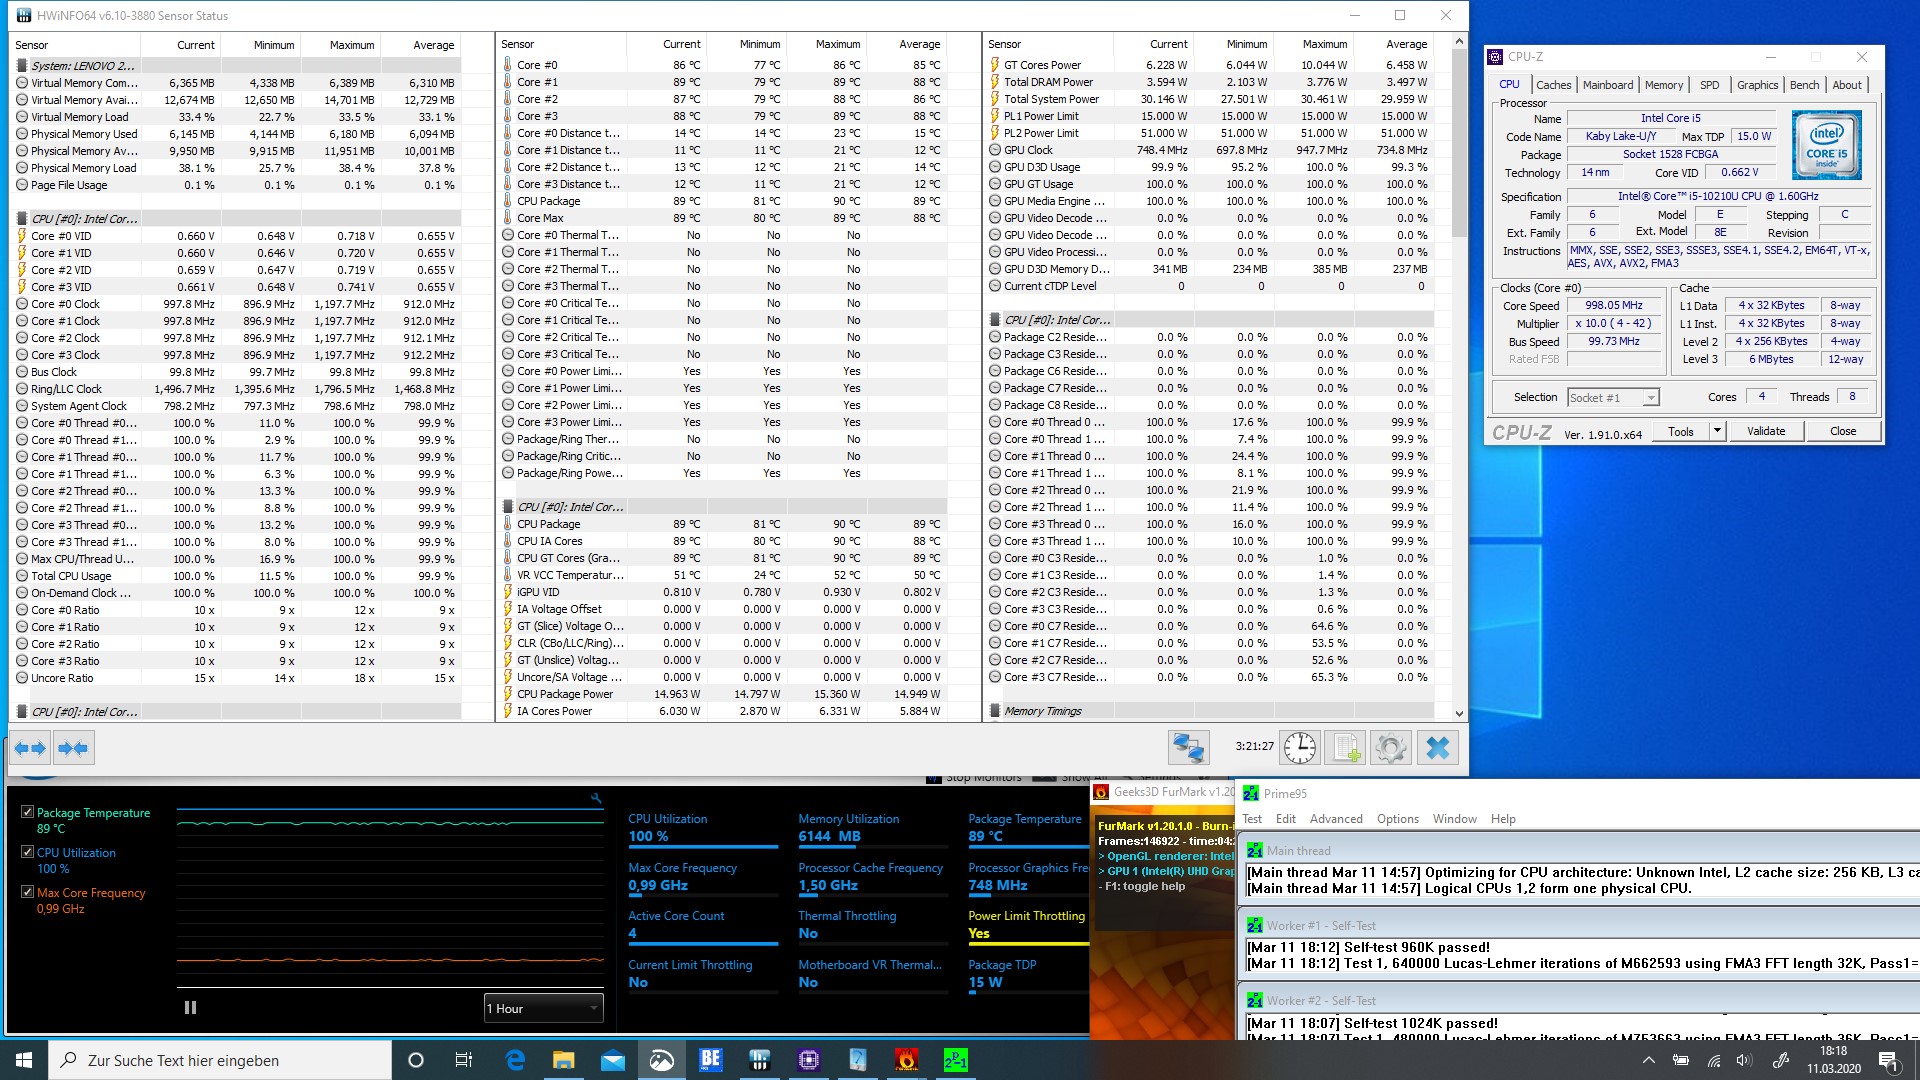
| Load Average * (Watt) | 44.3 | 33.8 24% | 24.2 45% | 27 39% | 42.5 4% | 35 ? 21% | 44 ? 1% |
| Load Maximum * (Watt) | 65 | 48.8 25% | 50 23% | 37 43% | 65.5 -1% | 47.5 ? 27% | 67.3 ? -4% |
* ... mindre är bättre
| Lenovo ThinkPad L13 Yoga 20R6S00800 i5-10210U, UHD Graphics 620, 46 Wh | Lenovo ThinkPad L390 Yoga-20NT000XGE i5-8265U, UHD Graphics 620, 45 Wh | HP Envy x360 13-ar0601ng R7 3700U, Vega 10, 53 Wh | HP Pavilion x360 14-dh1153ng i5-10210U, UHD Graphics 620, 41 Wh | Lenovo Yoga C740-14IML i5-10210U, UHD Graphics 620, 51 Wh | Genomsnitt av klass Convertible | |
|---|---|---|---|---|---|---|
| Batteridrifttid | -5% | -8% | -5% | 7% | 64% | |
| Reader / Idle (h) | 15.2 | 15.8 4% | 10.5 -31% | 14.3 -6% | 18.6 22% | 27.7 ? 82% |
| H.264 (h) | 6.6 | 7.4 12% | 6.5 -2% | 8.8 33% | 15.3 ? 132% | |
| WiFi v1.3 (h) | 7.7 | 7.2 -6% | 7.3 -5% | 6.3 -18% | 9.2 19% | 11.9 ? 55% |
| Load (h) | 2.1 | 1.5 -29% | 2.2 5% | 1.5 -29% | 1.7 -19% | 1.779 ? -15% |


För
Emot
Omdöme - Prisvärd

Läs den fullständiga versionen av den här recensionen på engelska här.
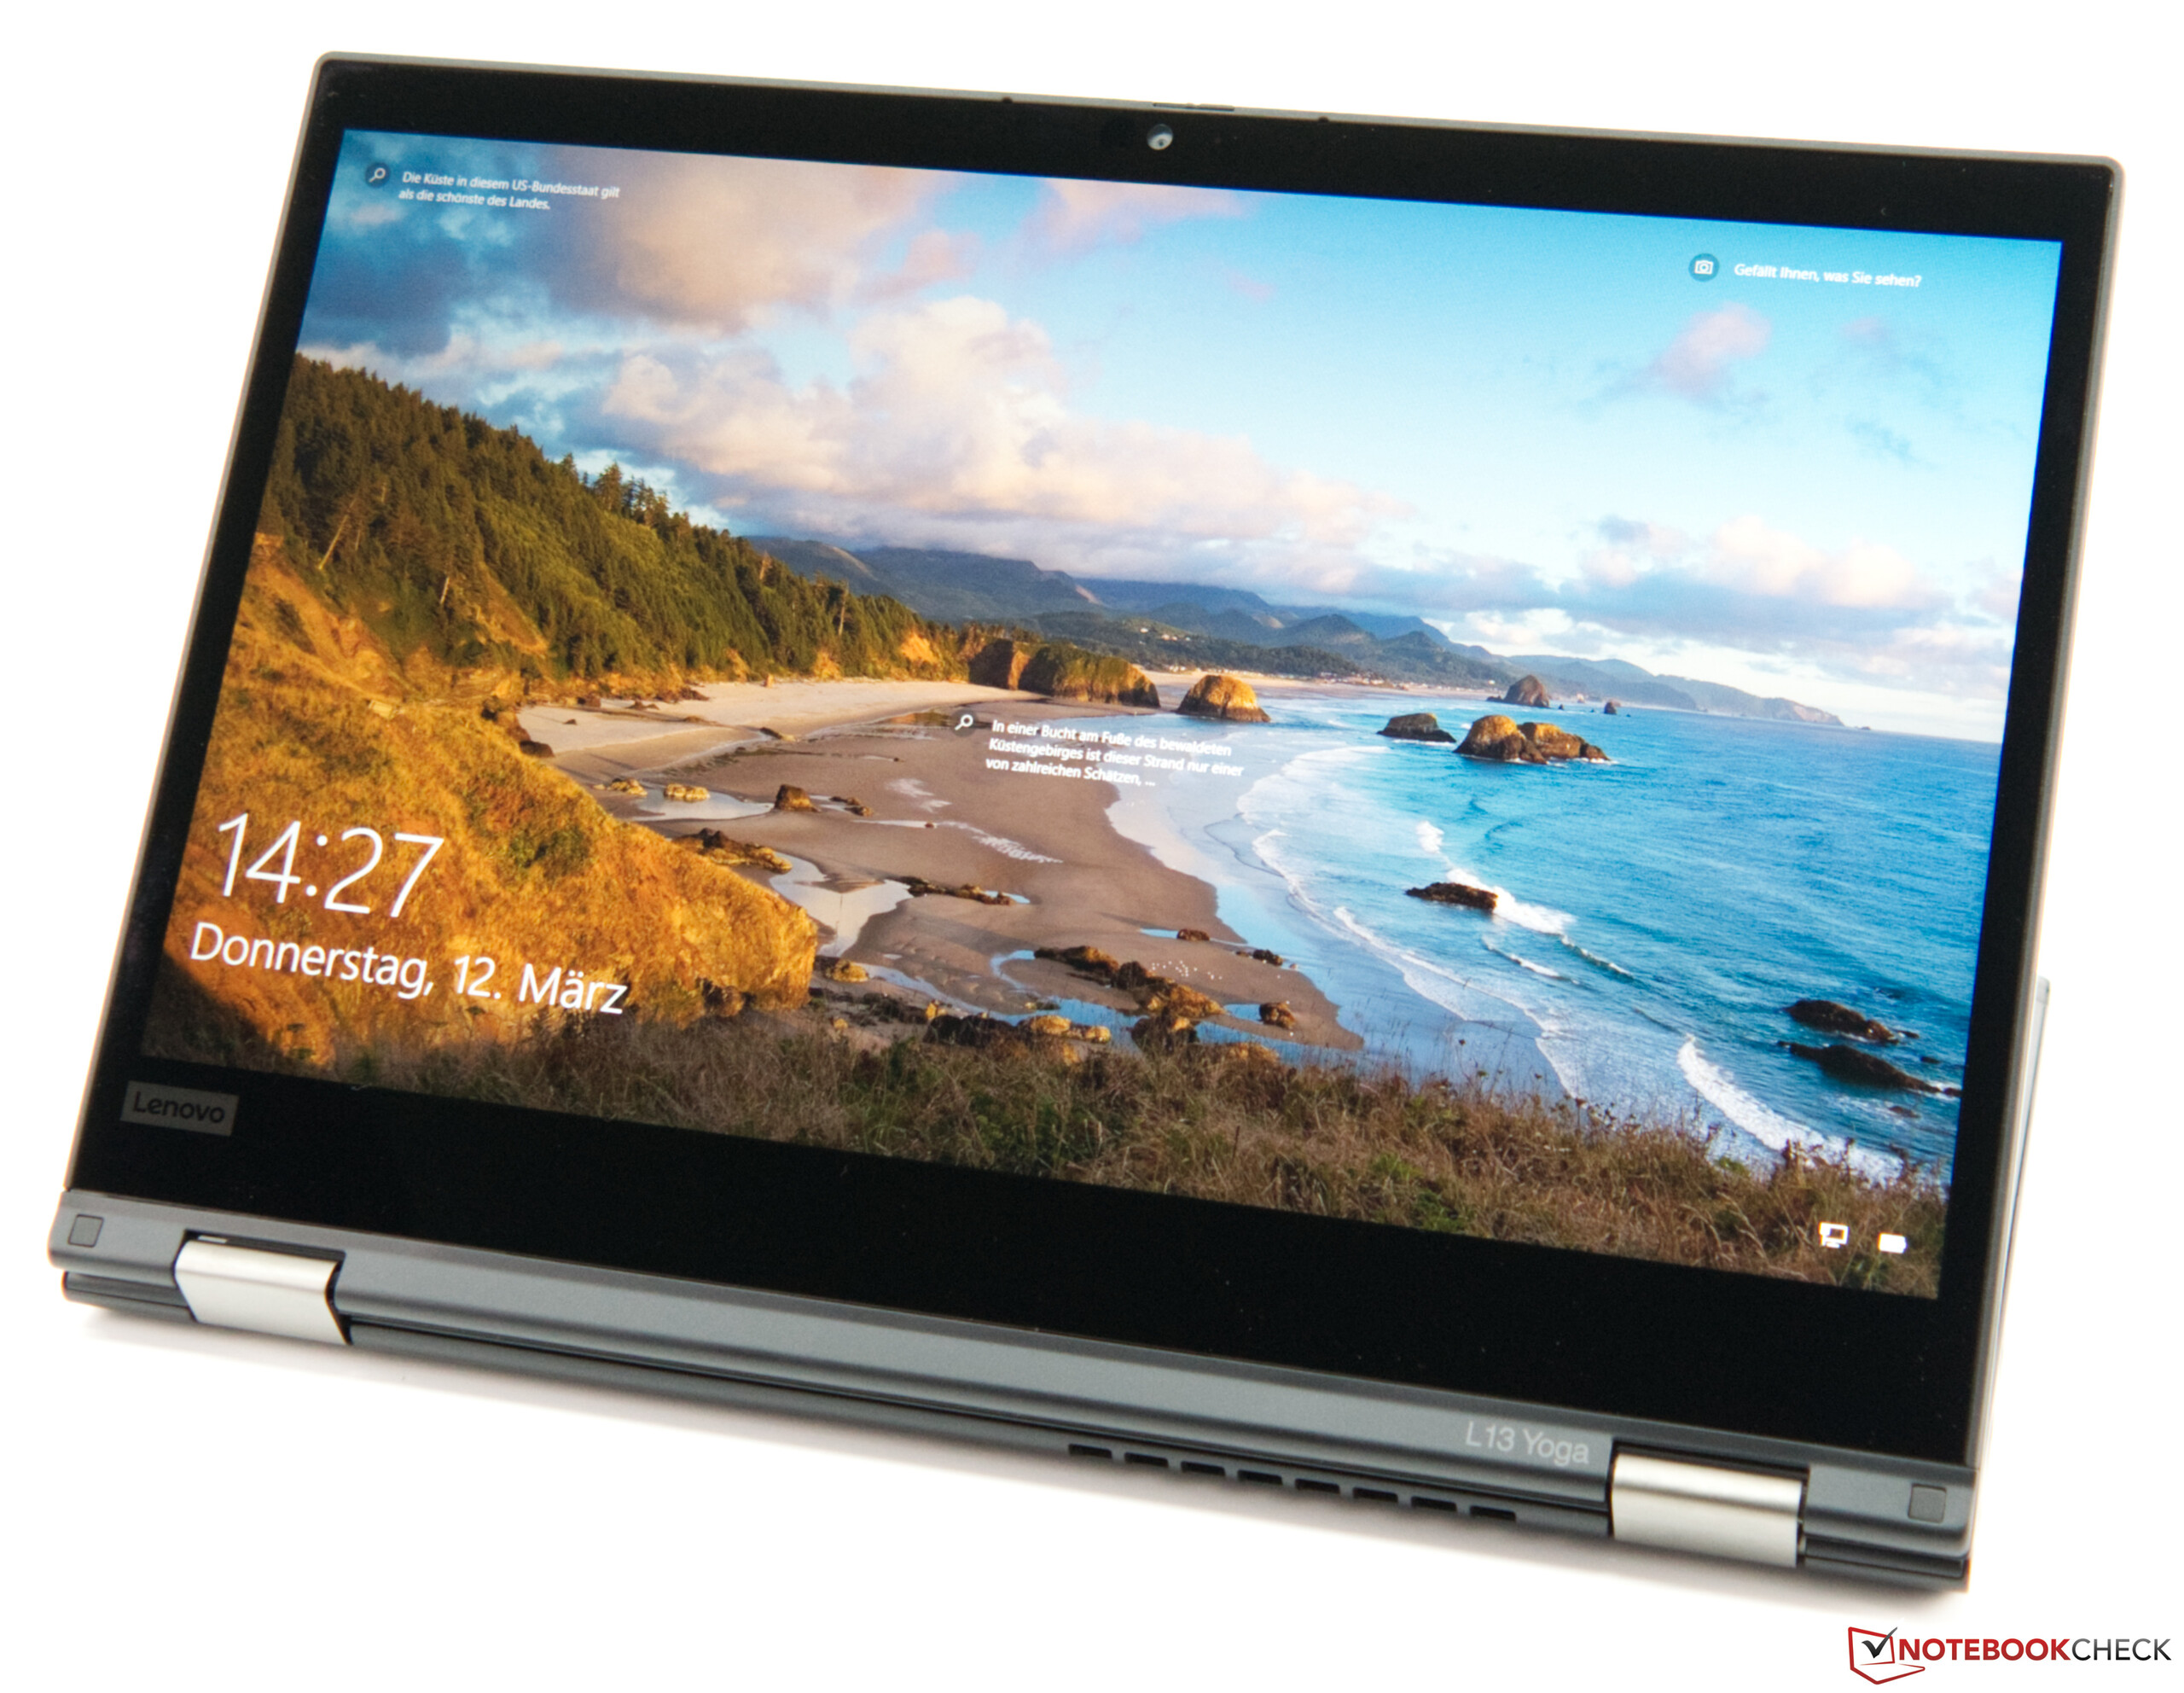
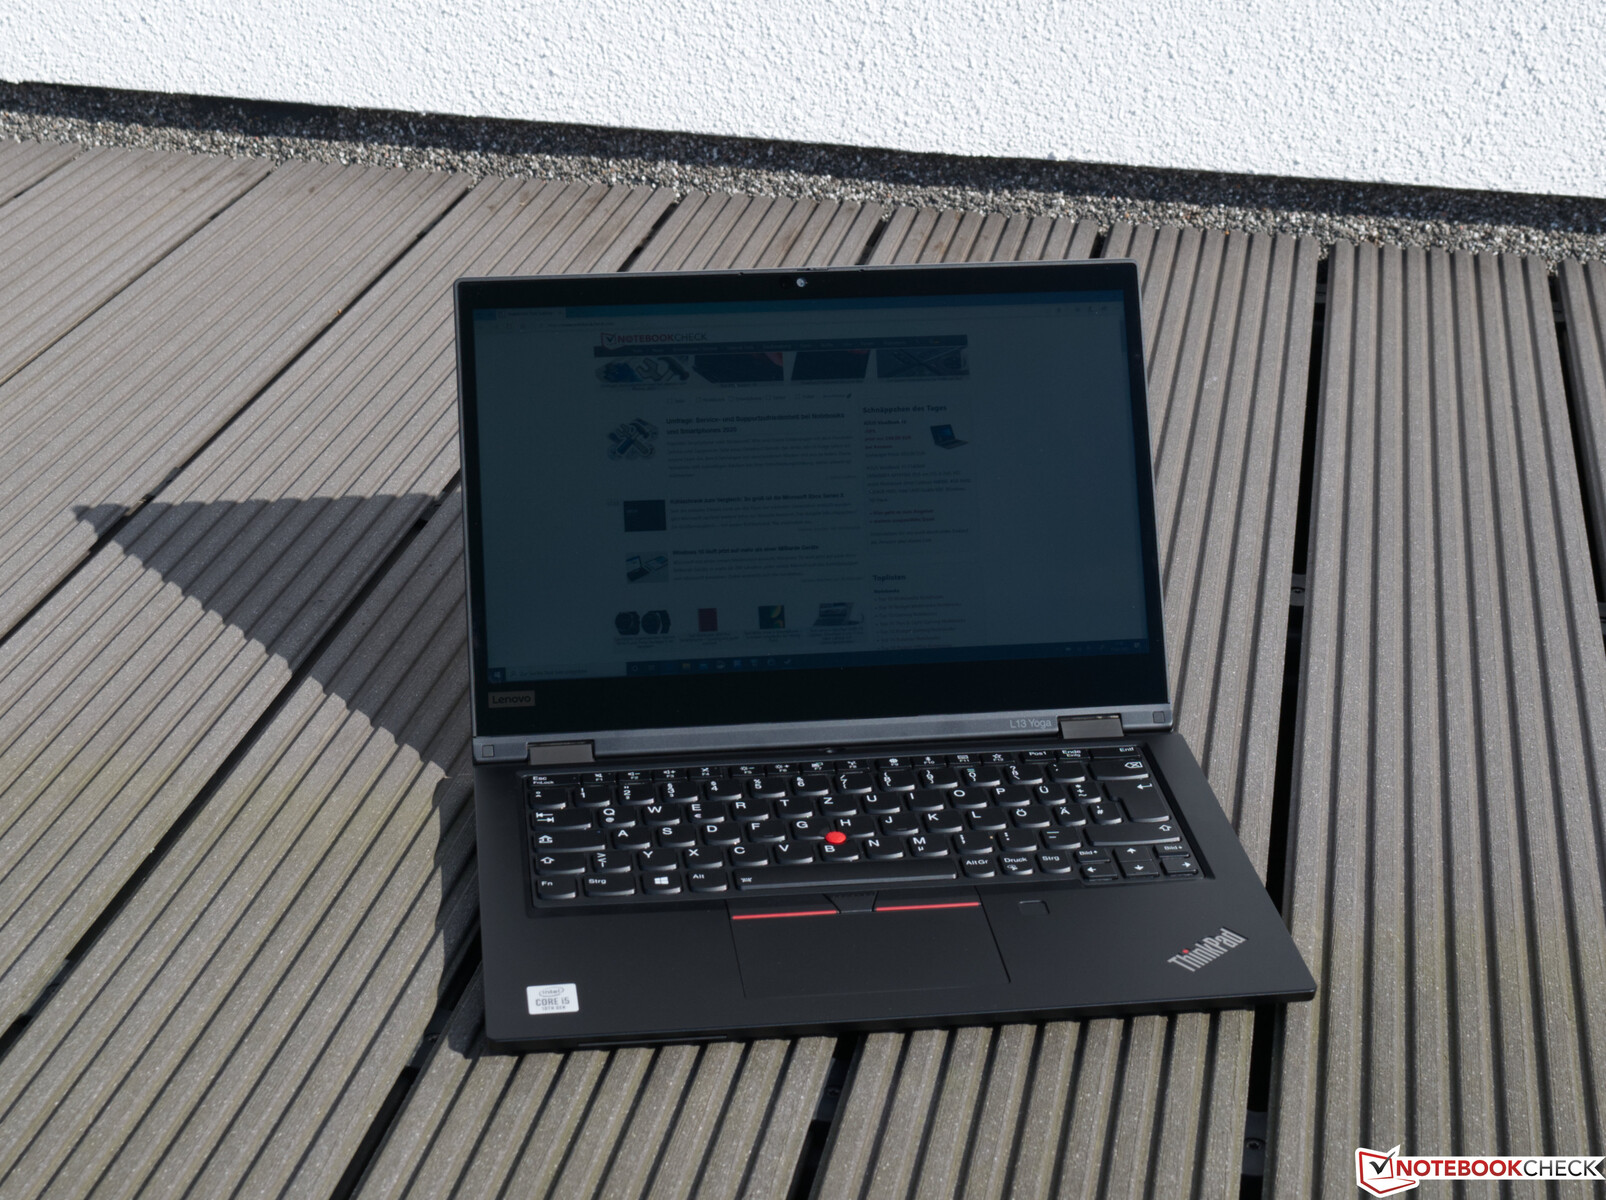
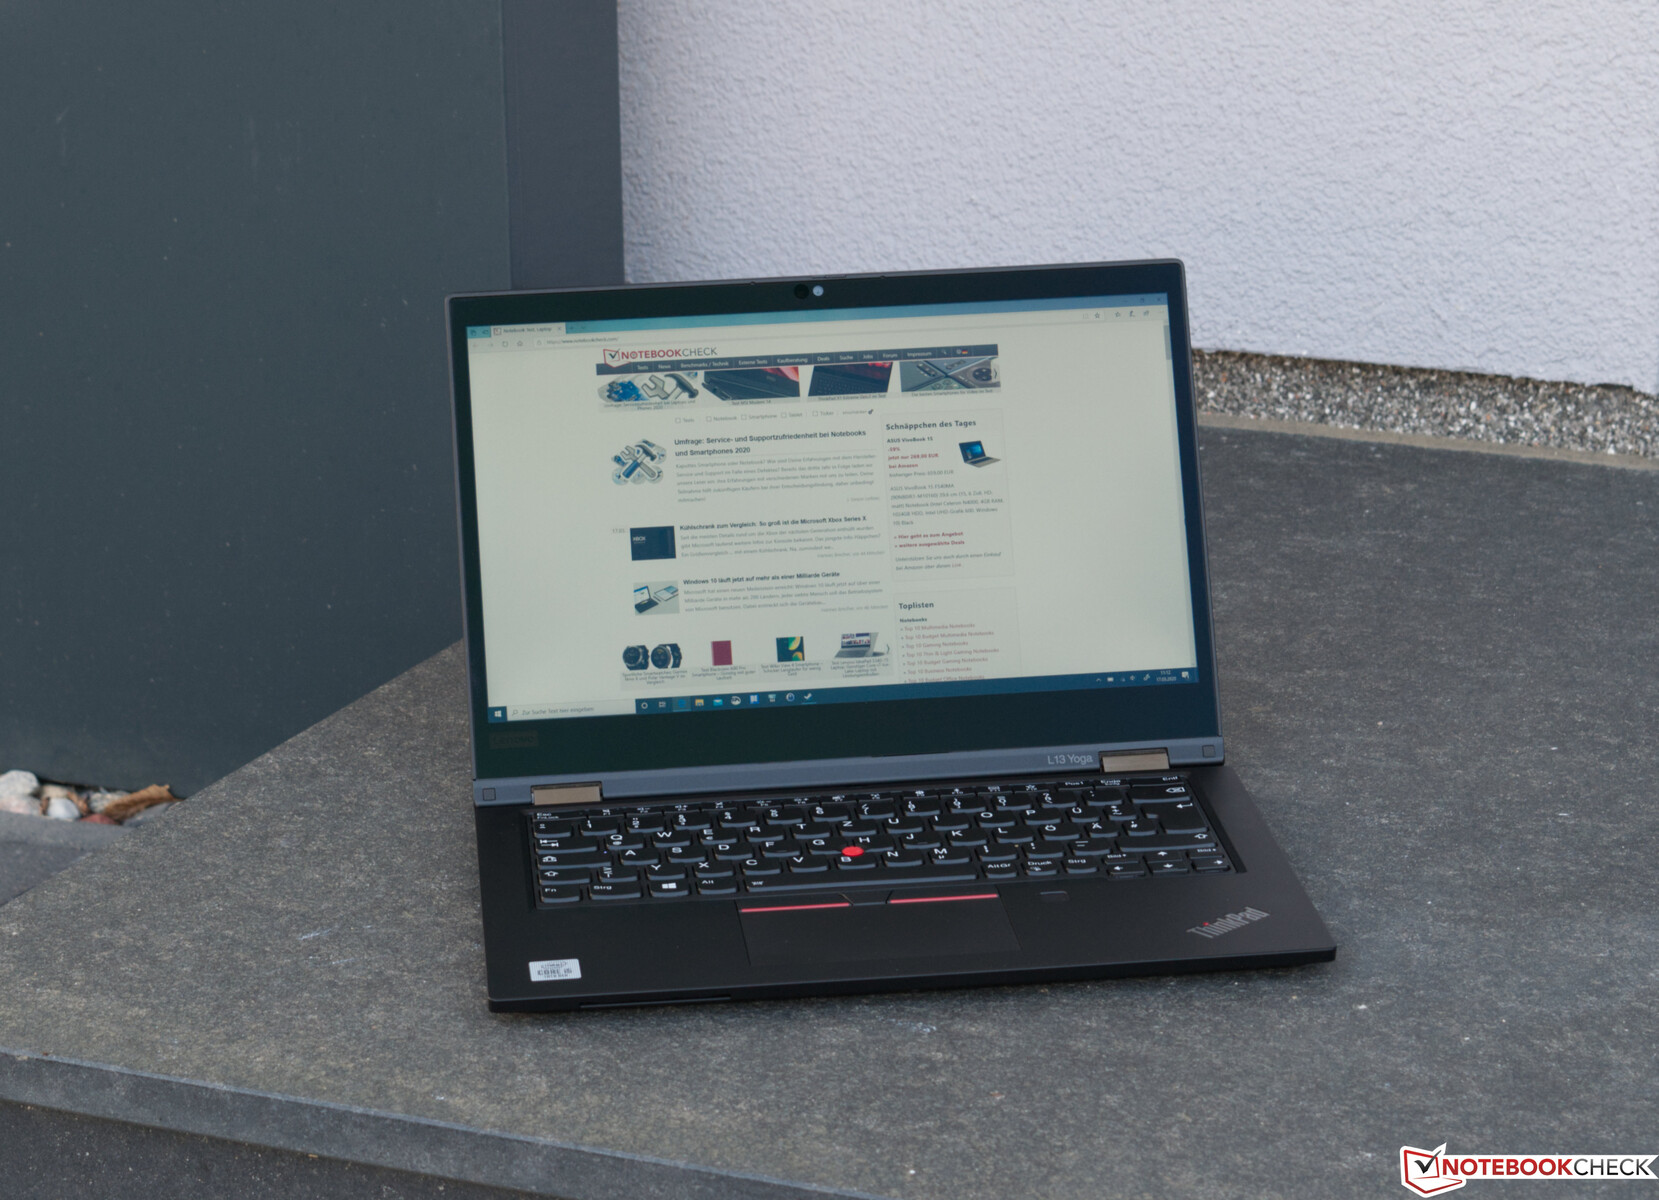
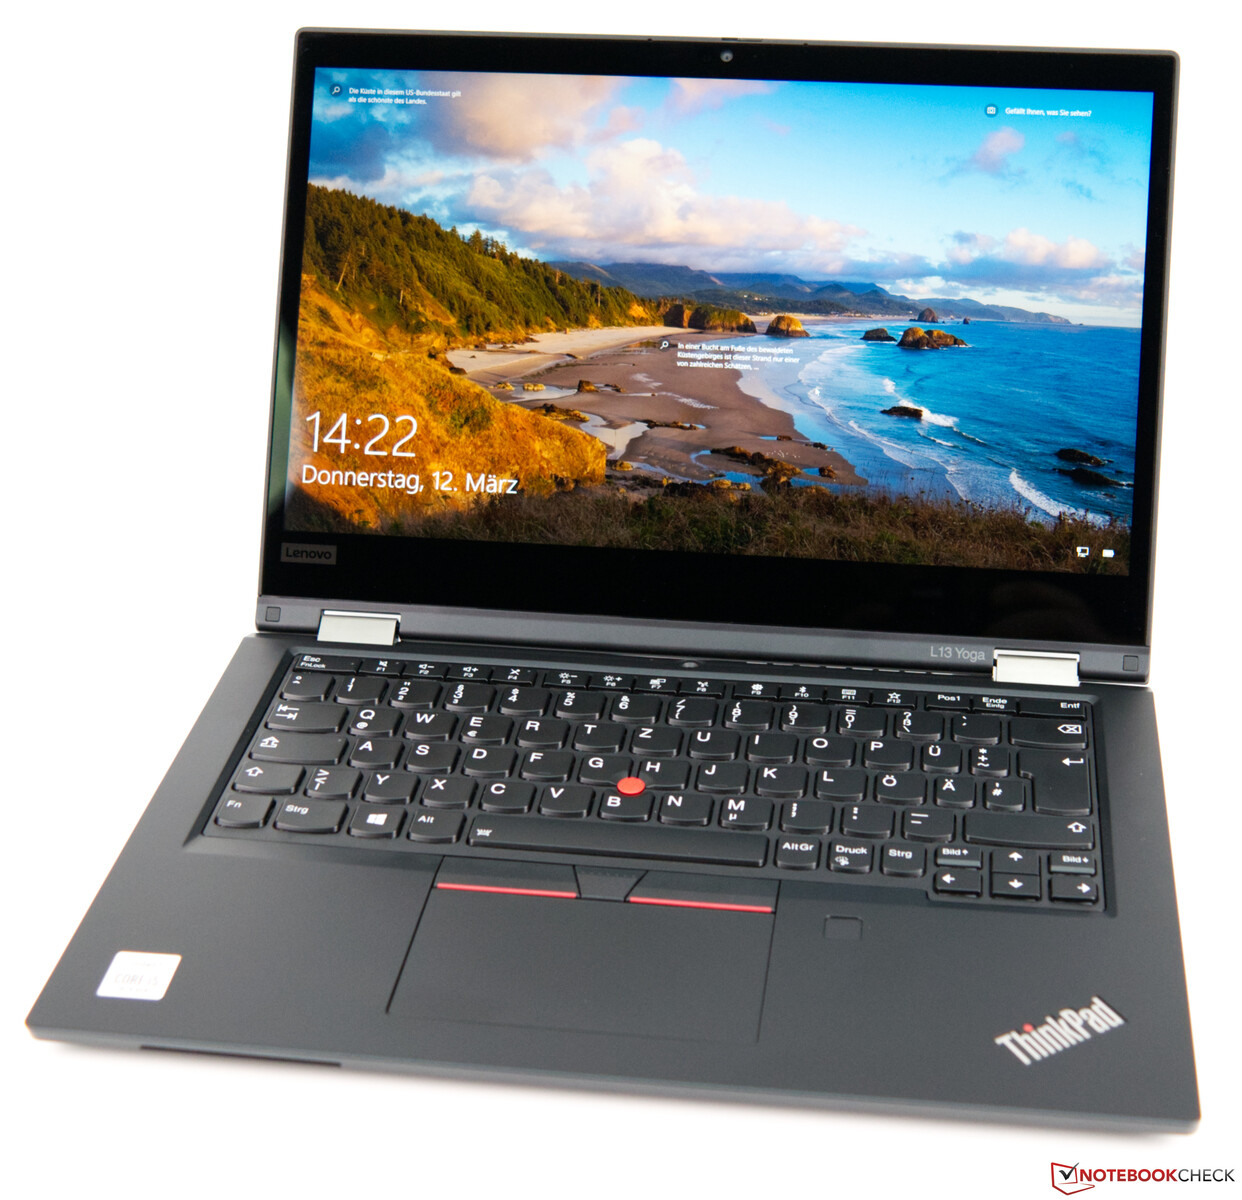
Lenovo ThinkPad L13 Yoga ärver sina drag från Lenovo ThinkPad L390. Men den nya Comet Lake-processorn kunde inte uppnå några märkbara ökningar i prestanda i vårt test. Den nya enheten har däremot en fördel när det kommer till batteritid, även om ökningen bara ligger i spannet under 10%.
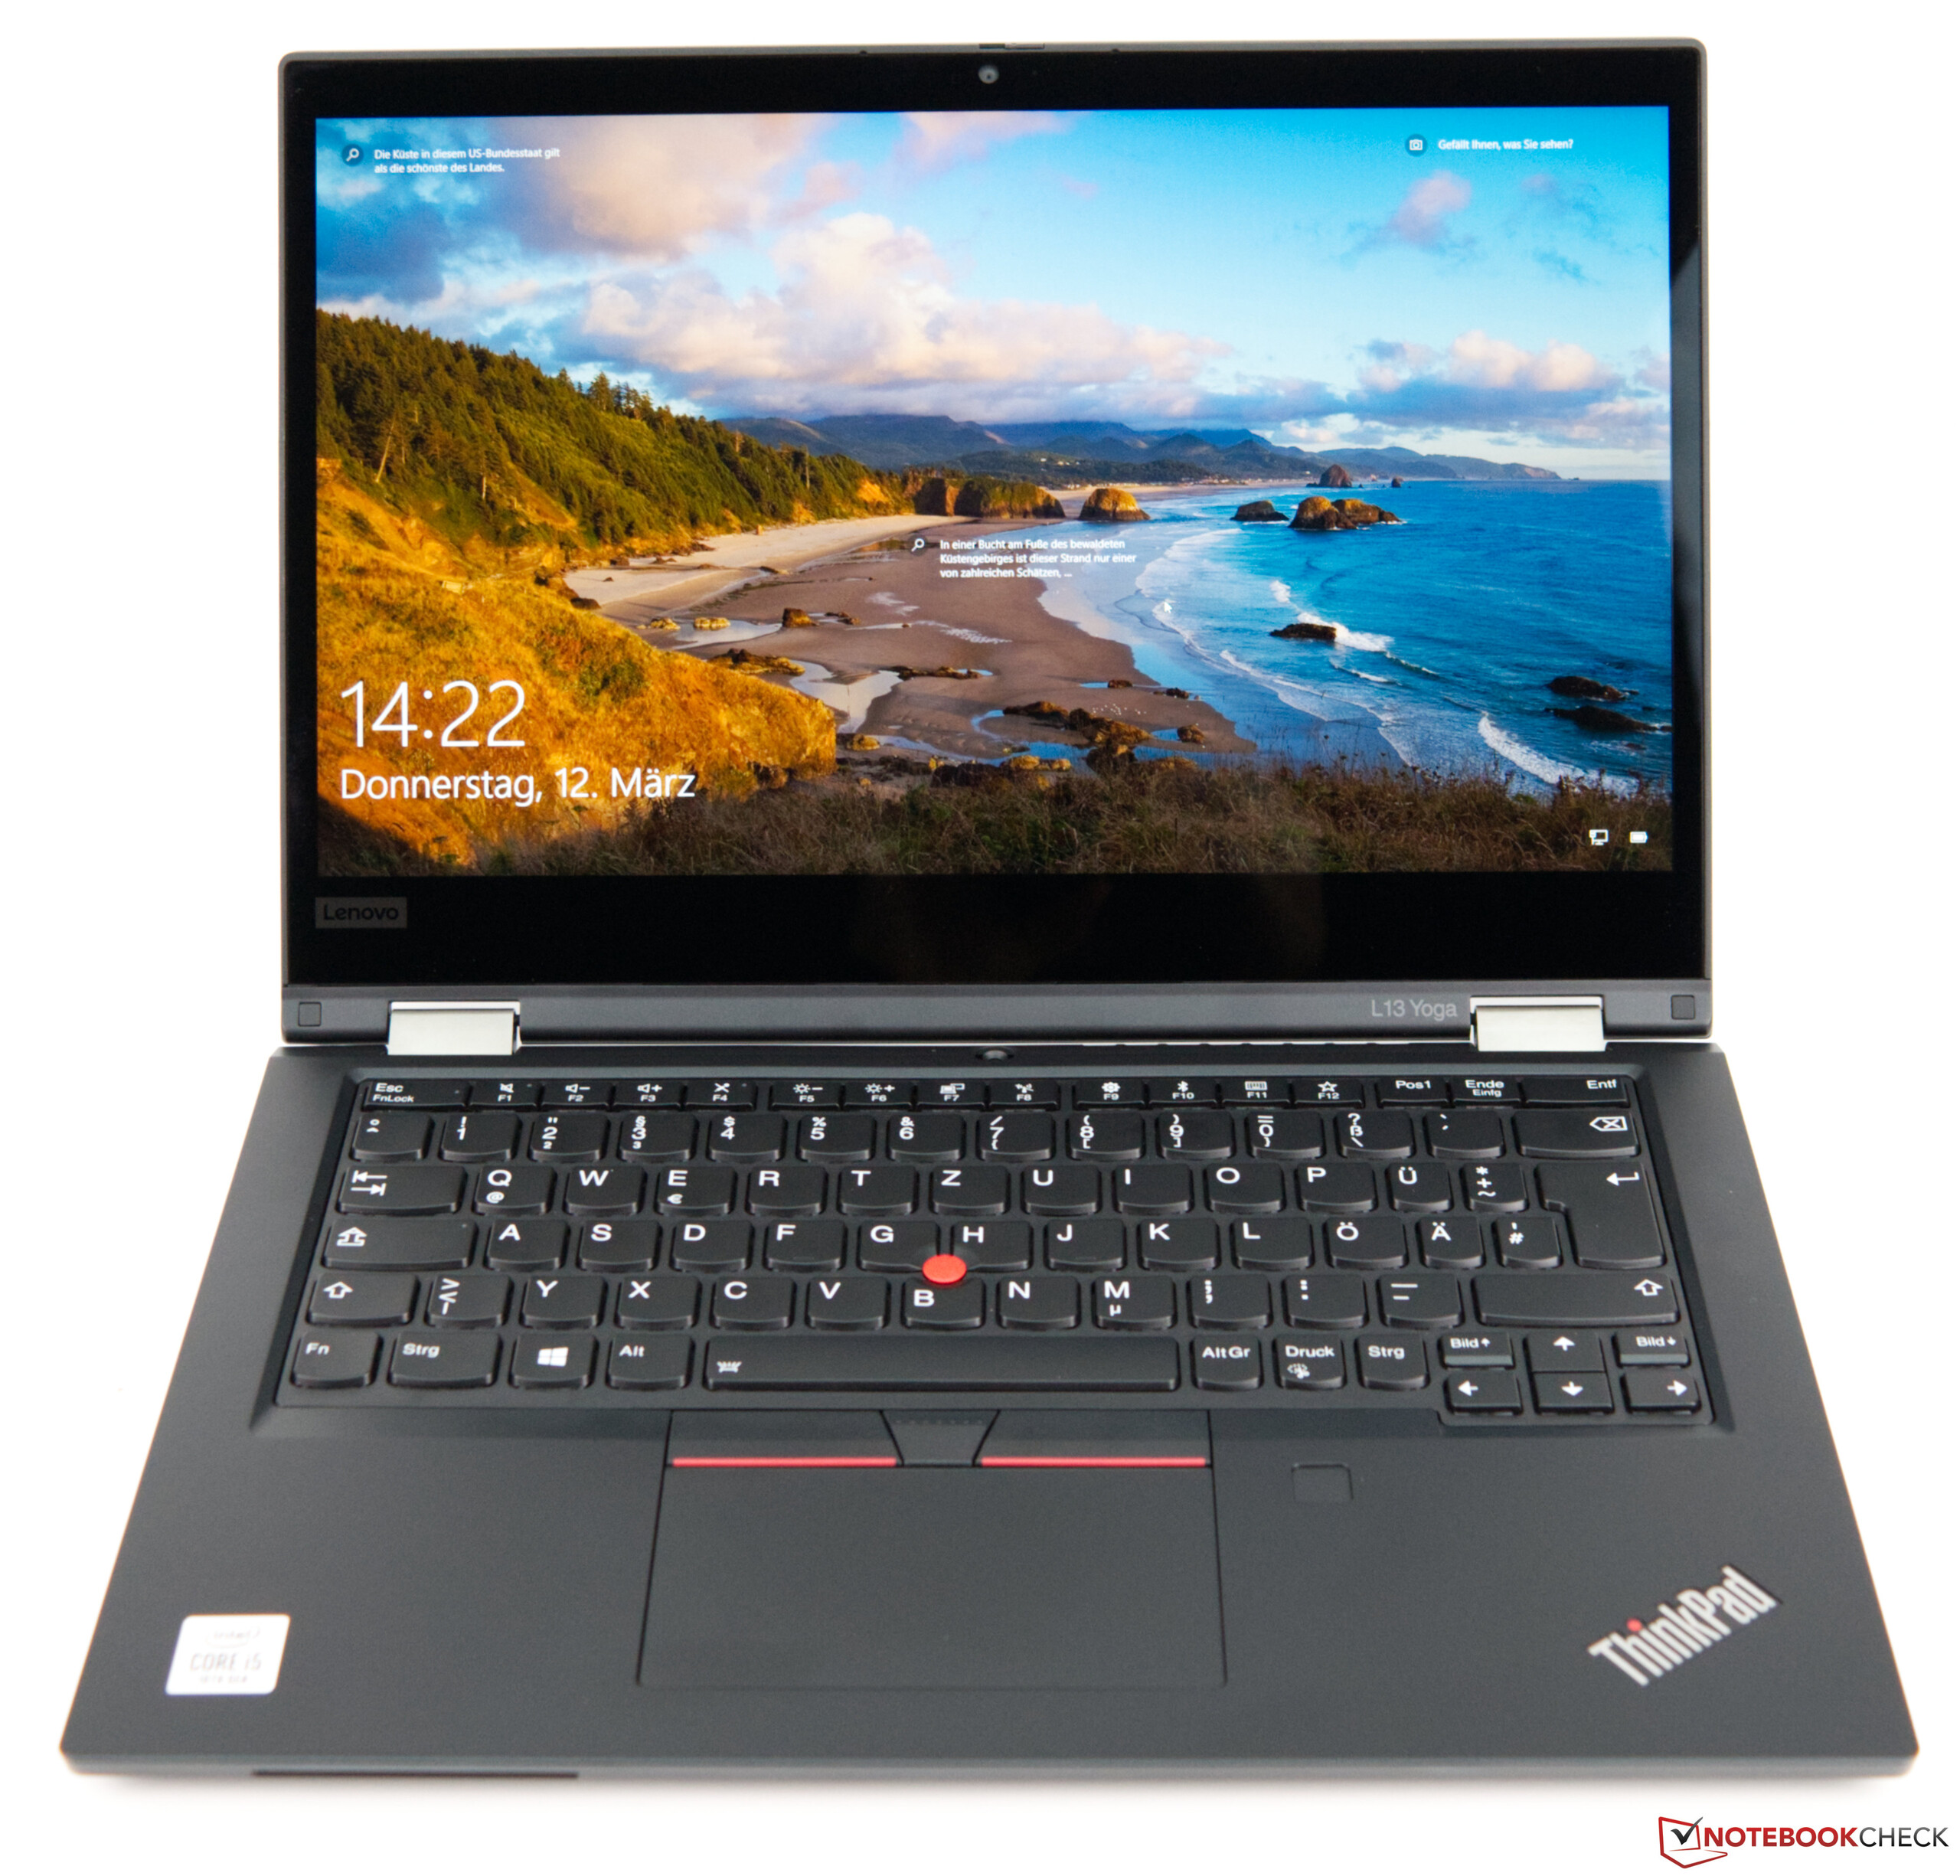
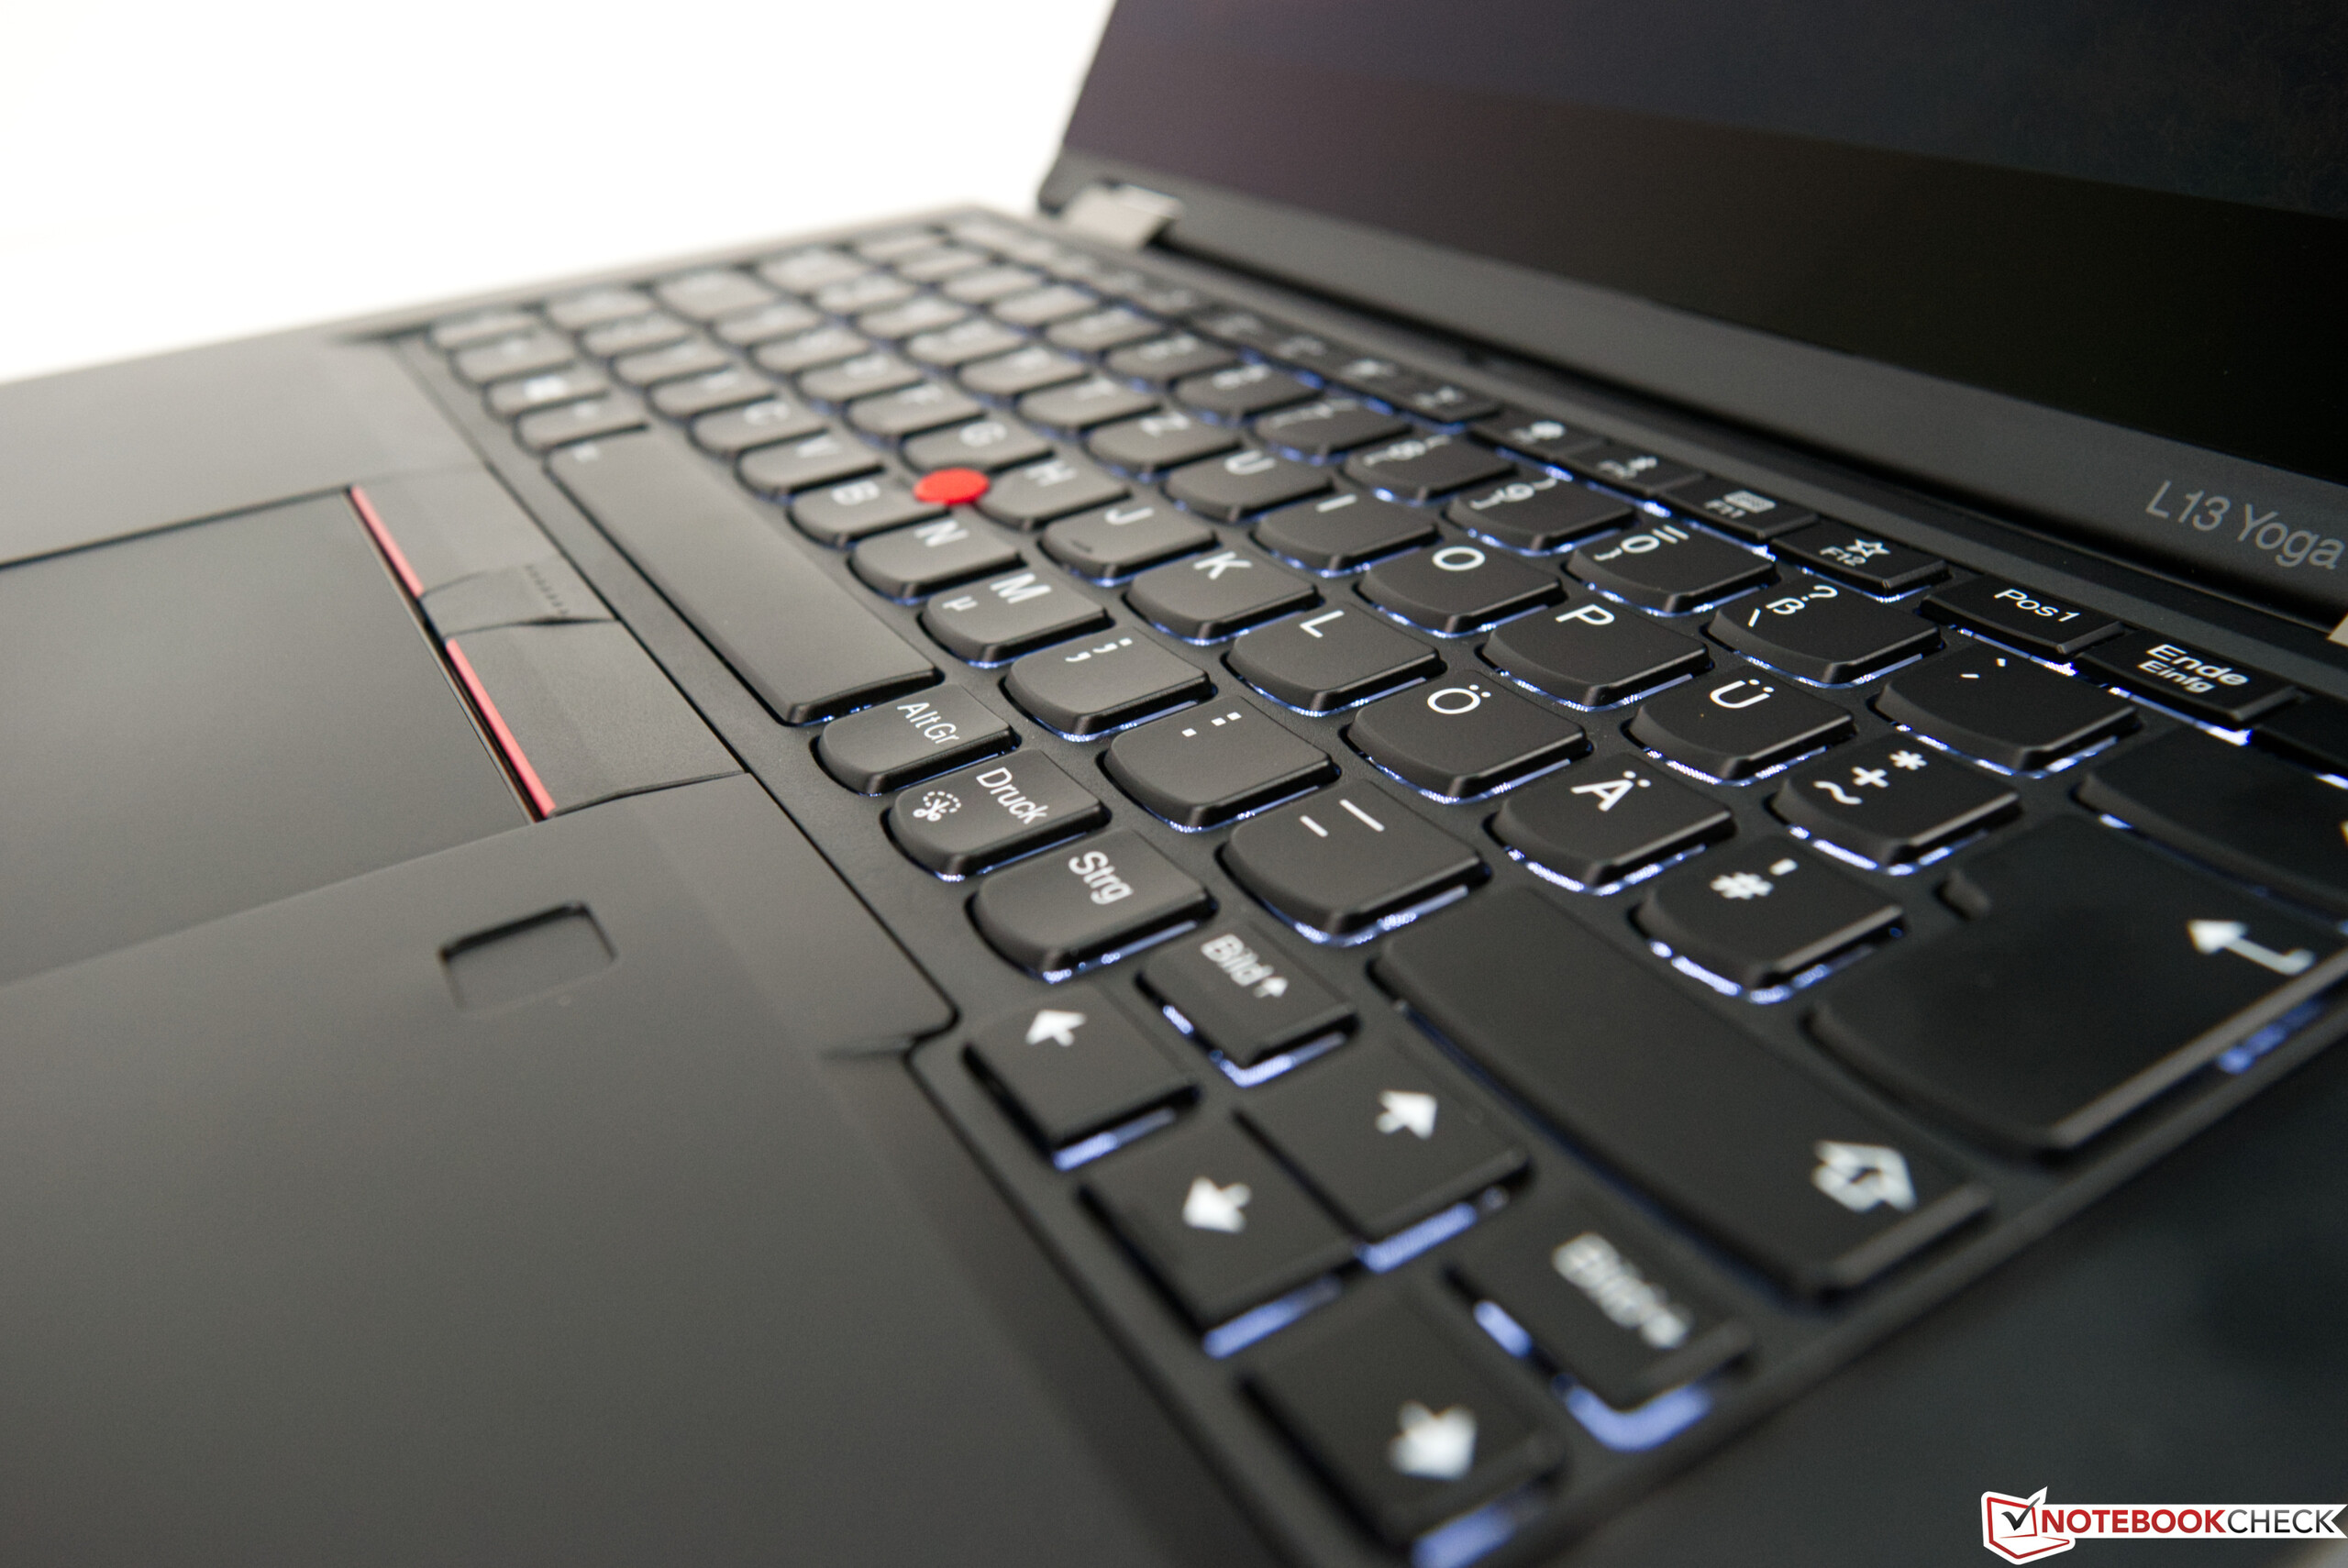
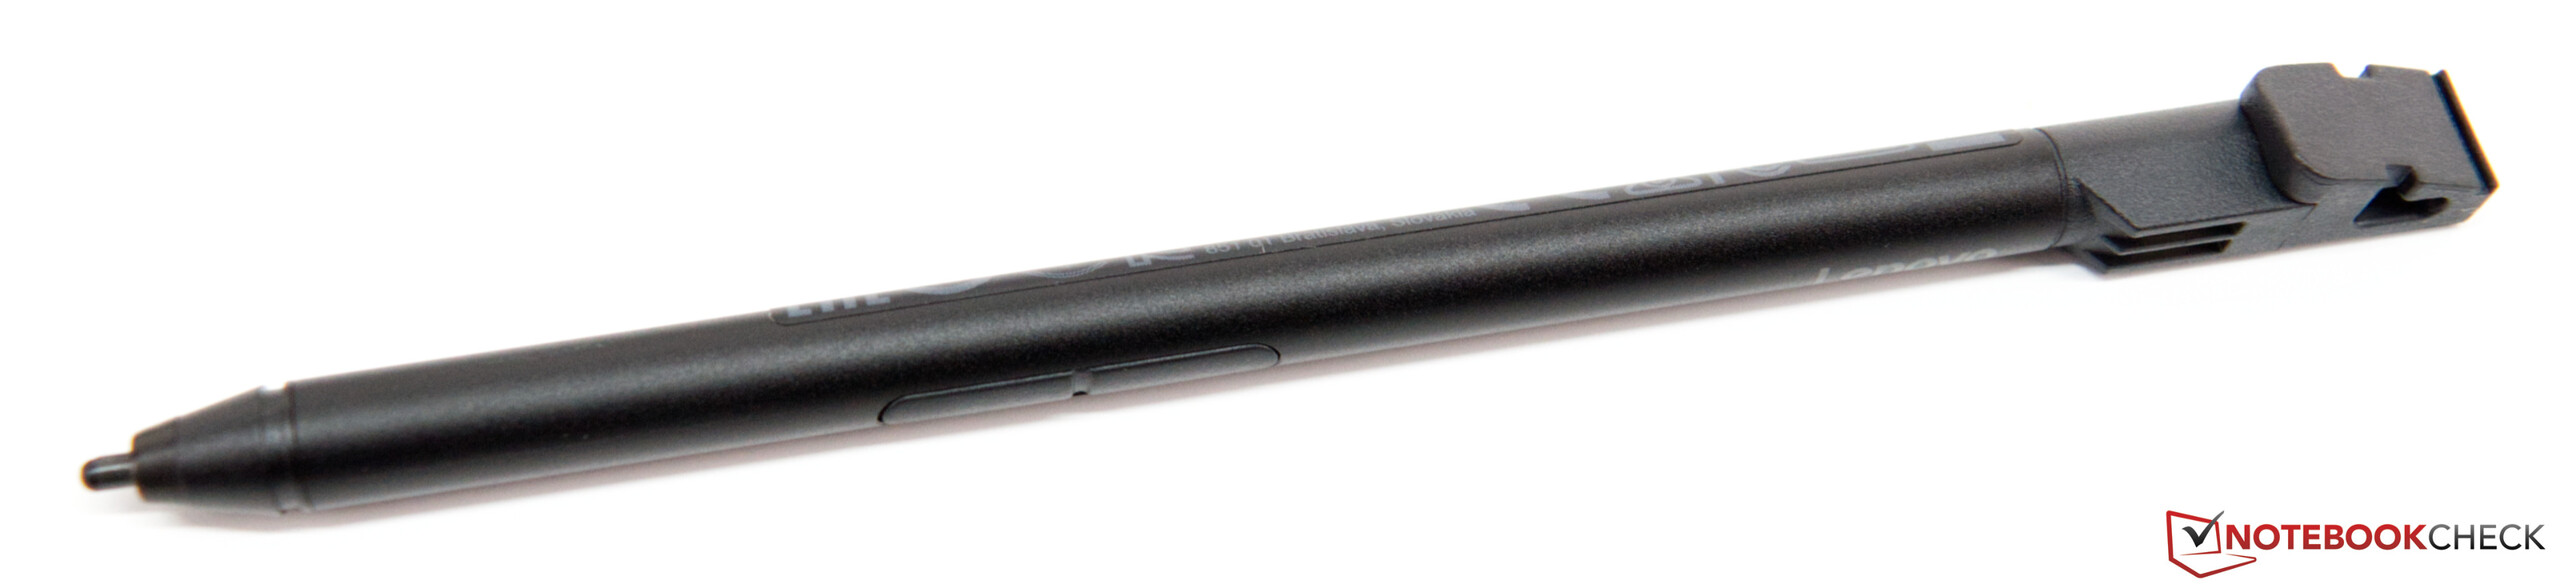
Lenovo ThinkPad L13 Yoga är en i huvudsak välgjord omvandlingsbar för företagsbruk som har många funktioner. IR-kamera, fingeravtrycksläsare och smart card-läsare är viktigt för en företagsenhet. ThinkPad L13 Yoga har allt detta och kombinerar dem med ett kompakt och stabilt hölje. Som bekant har L13 Yoga också ett riktigt framgångsrikt tangentbord. Dessutom ingår ThinkPad Pen Pro som kan användas för inmatning, och glöm heller inte den långa garantiperioden på 36 månader.
Lenovo ThinkPad L13 Yoga har bra specifikationer till ett acceptabelt pris.
Trots bra mätvärden kan åsikterna om skärmen gå isär, för PWM-frekvensen kan bli ett problem för en del användare. Men om du inte har problem med det är Lenovo ThinkPad L13 Yoga en modern omvandlingsbar som även går att använda för fotoredigering.
Lenovo ThinkPad L13 Yoga 20R6S00800
- 03/19/2020 v7 (old)
Sebastian Bade
Price comparison
