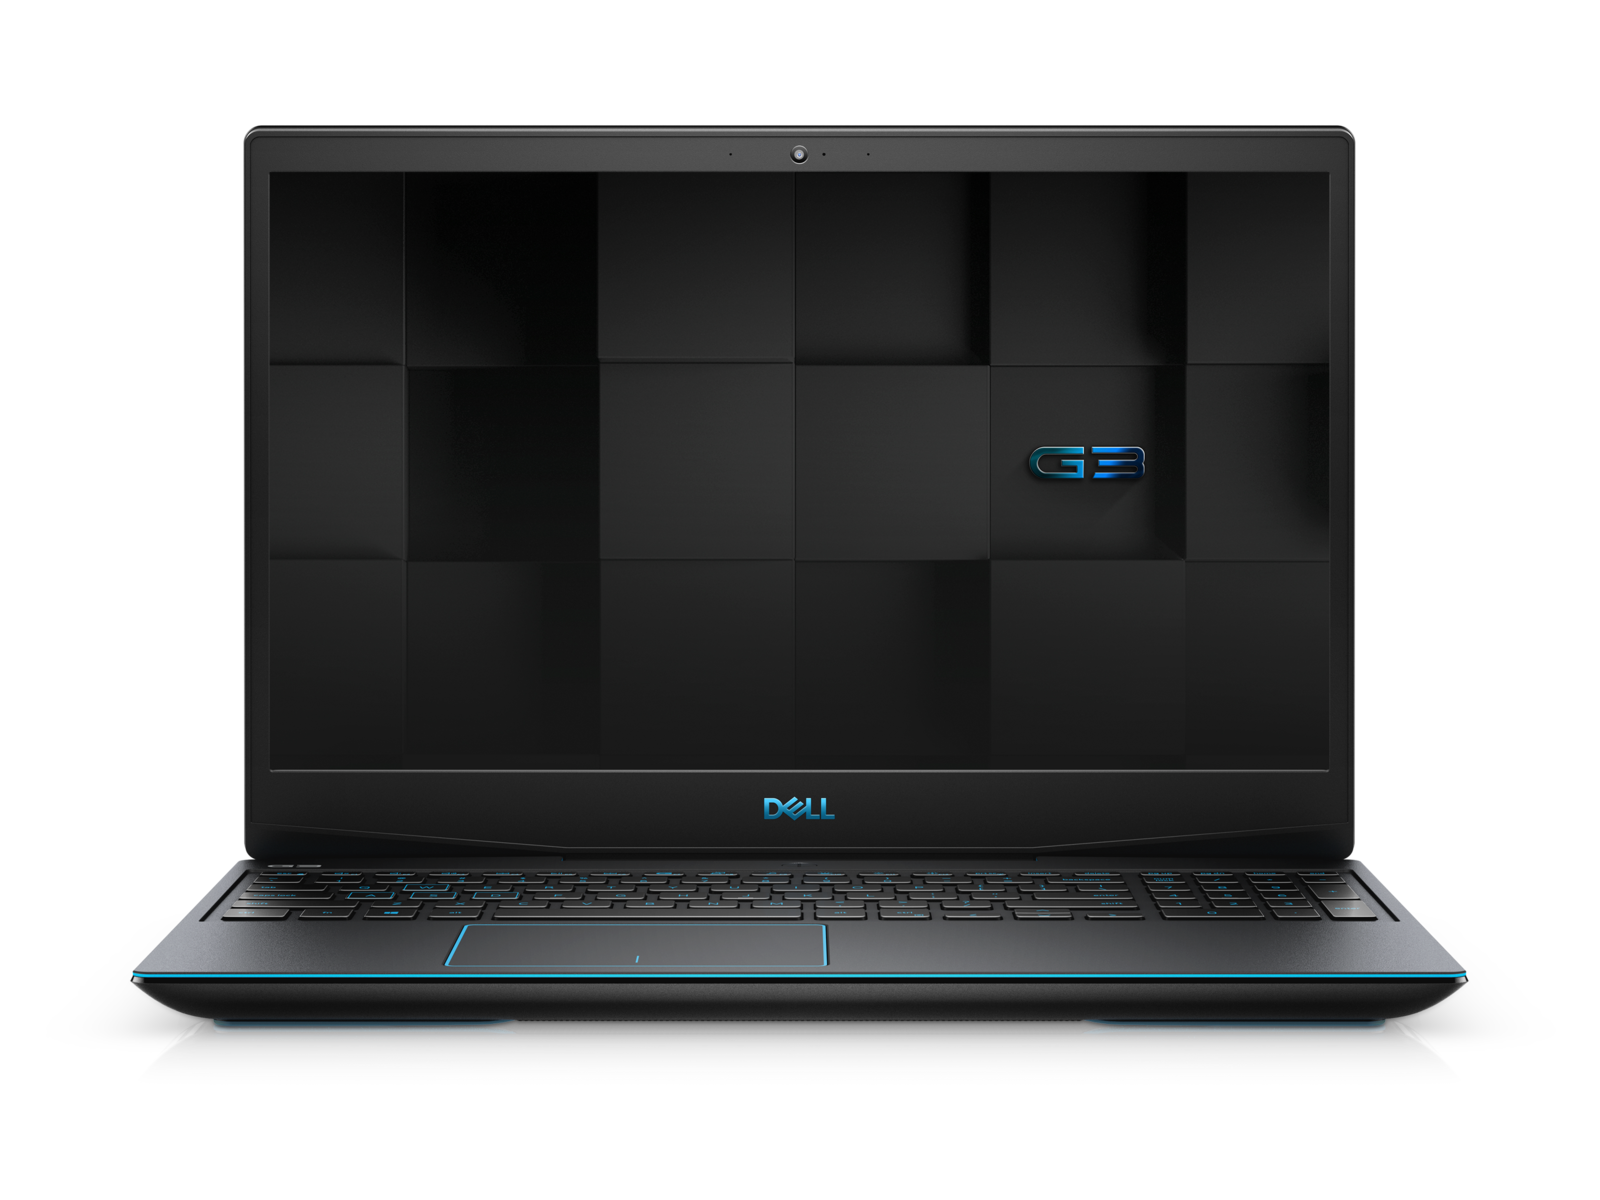
Test: Dell G3 15 3590 - Billig och lätt att uppgradera (Sammanfattning)
Gradering | Datum | Modell | Vikt | Höjd | Storlek | Upplösning | Pris |
|---|---|---|---|---|---|---|---|
| 79.3 % v7 (old) | 10/2019 | Dell G3 3590 i5-9300H, GeForce GTX 1650 Mobile | 2.5 kg | 21.6 mm | 15.60" | 1920x1080 | |
| 85.5 % v6 (old) | 08/2019 | Aorus 15-SA i7-9750H, GeForce GTX 1660 Ti Mobile | 2.1 kg | 24.4 mm | 15.60" | 1920x1080 | |
| 83.9 % v7 (old) | 08/2019 | HP Gaming Pavilion 15-dk0009ng i7-9750H, GeForce GTX 1660 Ti Max-Q | 2.4 kg | 23.4 mm | 15.60" | 1920x1080 | |
| 83.3 % v6 (old) | 06/2019 | Asus ROG Zephyrus G15 GA502DU R7 3750H, GeForce GTX 1660 Ti Max-Q | 2.1 kg | 20.4 mm | 15.60" | 1920x1080 |
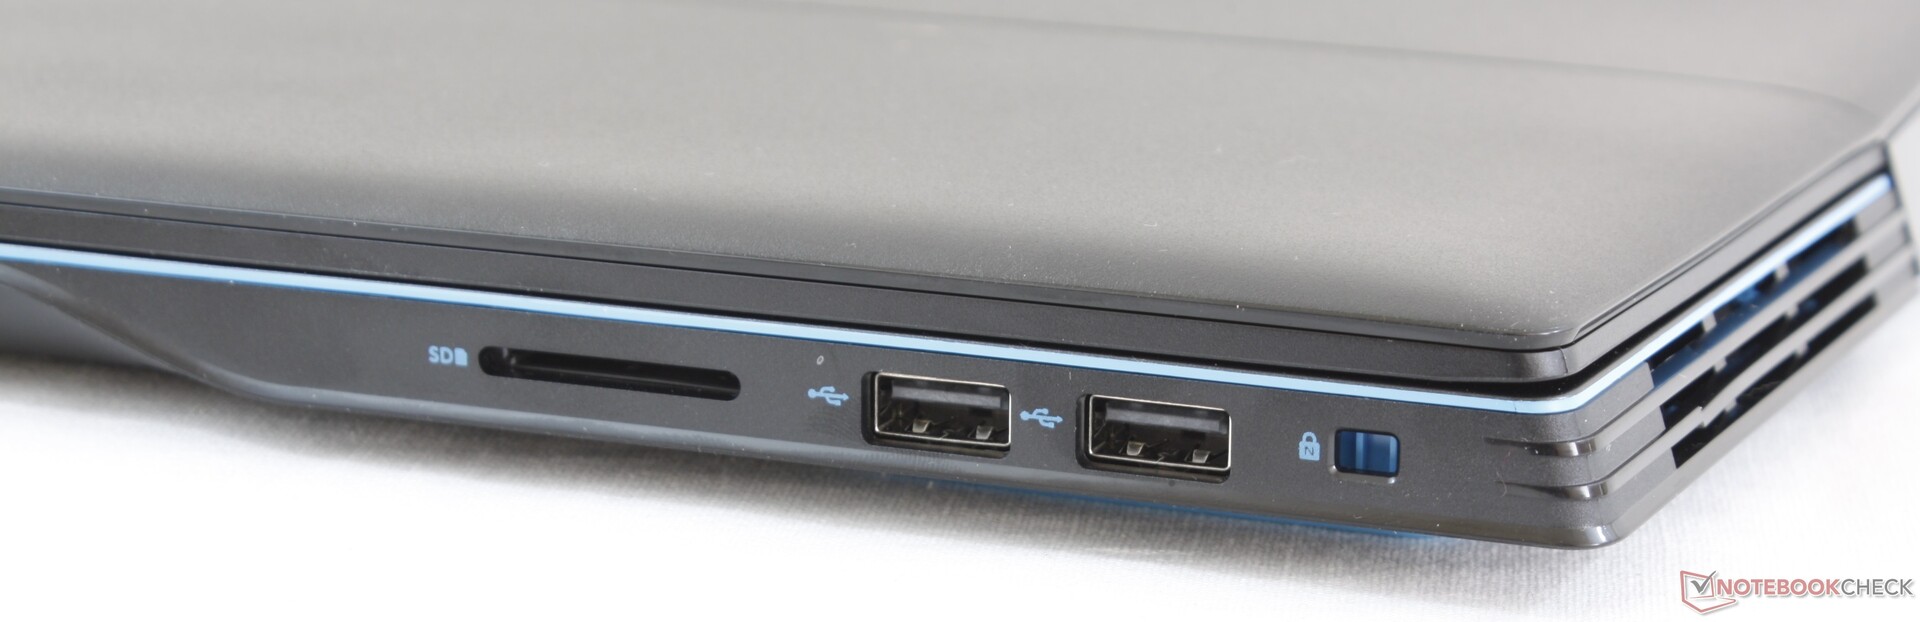
| SD Card Reader | |
| average JPG Copy Test (av. of 3 runs) | |
| HP Gaming Pavilion 15-dk0009ng (Toshiba Exceria Pro SDXC 64 GB UHS-II) | |
| Dell G3 15 3579 (Toshiba Exceria Pro SDXC 64 GB UHS-II) | |
| Dell G3 3590 (Toshiba Exceria Pro SDXC 64 GB UHS-II) | |
| maximum AS SSD Seq Read Test (1GB) | |
| HP Gaming Pavilion 15-dk0009ng (Toshiba Exceria Pro SDXC 64 GB UHS-II) | |
| Dell G3 3590 (Toshiba Exceria Pro SDXC 64 GB UHS-II) | |
| Dell G3 15 3579 (Toshiba Exceria Pro SDXC 64 GB UHS-II) | |
| Networking | |
| iperf3 transmit AX12 | |
| Aorus 15-SA | |
| Lenovo Legion Y540-15IRH-81SX00B2GE | |
| Alienware m15 R2 P87F | |
| Dell G3 15 3579 | |
| Dell G3 3590 | |
| iperf3 receive AX12 | |
| Aorus 15-SA | |
| Alienware m15 R2 P87F | |
| Lenovo Legion Y540-15IRH-81SX00B2GE | |
| Dell G3 3590 | |
| Dell G3 15 3579 | |
| |||||||||||||||||||||||||
Distribution av ljusstyrkan: 86 %
Mitt på batteriet: 172 cd/m²
Kontrast: 1151:1 (Svärta: 0.24 cd/m²)
ΔE ColorChecker Calman: 5.56 | ∀{0.5-29.43 Ø4.71}
calibrated: 5.23
ΔE Greyscale Calman: 2.8 | ∀{0.09-98 Ø4.96}
59% sRGB (Argyll 1.6.3 3D)
37.8% AdobeRGB 1998 (Argyll 1.6.3 3D)
41.47% AdobeRGB 1998 (Argyll 3D)
59.8% sRGB (Argyll 3D)
40.13% Display P3 (Argyll 3D)
Gamma: 2.37
CCT: 6710 K
| Dell G3 3590 BOE NV15N3D, IPS, 15.6", 1920x1080 | Dell G3 15 3579 LG Philips LP156WF6, IPS, 15.6", 1920x1080 | Lenovo Legion Y540-15IRH-81SX00B2GE BOE 084D, IPS, 15.6", 1920x1080 | Aorus 15-SA LG Philips LP156WFG-SPB2 (LGD05E8), IPS, 15.6", 1920x1080 | Alienware m15 R2 P87F Sharp LQ156M1, IPS, 15.6", 1920x1080 | HP Gaming Pavilion 15-dk0009ng LG Philips LGD05FE, IPS, 15.6", 1920x1080 | |
|---|---|---|---|---|---|---|
| Display | -4% | 56% | 58% | 60% | 59% | |
| Display P3 Coverage (%) | 40.13 | 38.48 -4% | 63.6 58% | 64.3 60% | 65.3 63% | 64.2 60% |
| sRGB Coverage (%) | 59.8 | 57.9 -3% | 91.7 53% | 93.6 57% | 95.1 59% | 95.1 59% |
| AdobeRGB 1998 Coverage (%) | 41.47 | 39.75 -4% | 65.2 57% | 65.6 58% | 65.9 59% | 65.8 59% |
| Response Times | 29% | 72% | 63% | 69% | 66% | |
| Response Time Grey 50% / Grey 80% * (ms) | 46 ? | 32.4 ? 30% | 8.8 ? 81% | 15.6 ? 66% | 16.4 ? 64% | 16.4 ? 64% |
| Response Time Black / White * (ms) | 32.4 ? | 23.2 ? 28% | 12 ? 63% | 12.8 ? 60% | 8.8 ? 73% | 10.4 ? 68% |
| PWM Frequency (Hz) | 200 ? | 23810 ? | ||||
| Screen | -11% | 20% | 21% | 2% | 33% | |
| Brightness middle (cd/m²) | 276.2 | 208.2 -25% | 299 8% | 266 -4% | 324.2 17% | 345 25% |
| Brightness (cd/m²) | 261 | 203 -22% | 290 11% | 254 -3% | 304 16% | 324 24% |
| Brightness Distribution (%) | 86 | 81 -6% | 89 3% | 90 5% | 90 5% | 86 0% |
| Black Level * (cd/m²) | 0.24 | 0.34 -42% | 0.29 -21% | 0.28 -17% | 0.38 -58% | 0.42 -75% |
| Contrast (:1) | 1151 | 612 -47% | 1031 -10% | 950 -17% | 853 -26% | 821 -29% |
| Colorchecker dE 2000 * | 5.56 | 4.65 16% | 3.7 33% | 3.11 44% | 5.01 10% | 1.3 77% |
| Colorchecker dE 2000 max. * | 23.45 | 15.99 32% | 7 70% | 5.84 75% | 12.7 46% | 2.8 88% |
| Colorchecker dE 2000 calibrated * | 5.23 | 3.84 27% | 2 62% | 1.37 74% | 1.64 69% | 1.1 79% |
| Greyscale dE 2000 * | 2.8 | 4.1 -46% | 4.1 -46% | 3.94 -41% | 7.9 -182% | 1.2 57% |
| Gamma | 2.37 93% | 2.3 96% | 2.19 100% | 2.53 87% | 2.35 94% | 2.31 95% |
| CCT | 6710 97% | 7352 88% | 7166 91% | 6210 105% | 8455 77% | 6476 100% |
| Color Space (Percent of AdobeRGB 1998) (%) | 37.8 | 36.7 -3% | 59.3 57% | 60 59% | 60.8 61% | 60.5 60% |
| Color Space (Percent of sRGB) (%) | 59 | 57.9 -2% | 91.5 55% | 93 58% | 95.5 62% | 94.9 61% |
| Totalt genomsnitt (program/inställningar) | 5% /
-4% | 49% /
33% | 47% /
33% | 44% /
21% | 53% /
42% |
* ... mindre är bättre
Visa svarstider
| ↔ Svarstid svart till vitt | ||
|---|---|---|
| 32.4 ms ... stiga ↗ och falla ↘ kombinerat | ↗ 18.4 ms stiga | 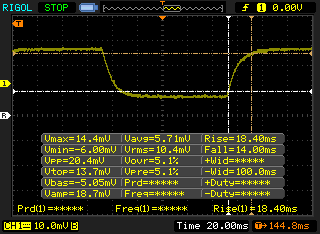 |
| ↘ 14 ms hösten | ||
| Skärmen visar långsamma svarsfrekvenser i våra tester och kommer att vara otillfredsställande för spelare. I jämförelse sträcker sig alla testade enheter från 0.1 (minst) till 240 (maximalt) ms. » 88 % av alla enheter är bättre. Detta innebär att den uppmätta svarstiden är sämre än genomsnittet av alla testade enheter (19.8 ms). | ||
| ↔ Svarstid 50 % grått till 80 % grått | ||
| 46 ms ... stiga ↗ och falla ↘ kombinerat | ↗ 22 ms stiga | 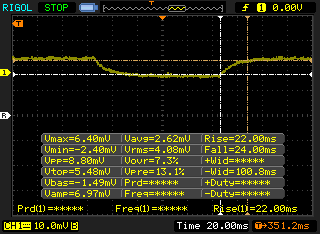 |
| ↘ 24 ms hösten | ||
| Skärmen visar långsamma svarsfrekvenser i våra tester och kommer att vara otillfredsställande för spelare. I jämförelse sträcker sig alla testade enheter från 0.165 (minst) till 636 (maximalt) ms. » 79 % av alla enheter är bättre. Detta innebär att den uppmätta svarstiden är sämre än genomsnittet av alla testade enheter (30.9 ms). | ||
Skärmflimmer / PWM (Puls-Width Modulation)
| Skärmflimmer / PWM upptäckt | 200 Hz | ≤ 98 % ljusstyrka inställning | 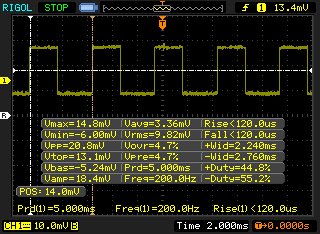 |
Displayens bakgrundsbelysning flimrar vid 200 Hz (i värsta fall, t.ex. med PWM) Flimrande upptäckt vid en ljusstyrkeinställning på 98 % och lägre. Det ska inte finnas något flimmer eller PWM över denna ljusstyrkeinställning. Frekvensen för 200 Hz är relativt låg, så känsliga användare kommer sannolikt att märka flimmer och uppleva ansträngda ögon vid den angivna ljusstyrkeinställningen och nedan. Som jämförelse: 52 % av alla testade enheter använder inte PWM för att dämpa skärmen. Om PWM upptäcktes mättes ett medelvärde av 7744 (minst: 5 - maximum: 343500) Hz. | |||
| Cinebench R11.5 | |
| CPU Single 64Bit | |
| Dell Inspiron 15 7000 7577 4K | |
| Asus ROG Zephyrus G15 GA502DU | |
| CPU Multi 64Bit | |
| Asus ROG Zephyrus G15 GA502DU | |
| Dell Inspiron 15 7000 7577 4K | |
| Cinebench R10 | |
| Rendering Multiple CPUs 32Bit | |
| Genomsnitt Intel Core i5-9300H (21798 - 25656, n=5) | |
| Dell Inspiron 15 7000 7577 4K | |
| Asus ROG Zephyrus G15 GA502DU | |
| Rendering Single 32Bit | |
| Genomsnitt Intel Core i5-9300H (6421 - 6677, n=5) | |
| Dell Inspiron 15 7000 7577 4K | |
| Asus ROG Zephyrus G15 GA502DU | |
| wPrime 2.10 - 1024m | |
| Dell Inspiron 15 7000 7577 4K | |
| Asus ROG Zephyrus G15 GA502DU | |
* ... mindre är bättre
| PCMark 8 Home Score Accelerated v2 | 3792 poäng | |
| PCMark 8 Work Score Accelerated v2 | 5088 poäng | |
| PCMark 10 Score | 4798 poäng | |
Hjälp | ||
| Dell G3 3590 Toshiba BG4 KBG40ZNS128G | Dell G7 17 7790 Toshiba BG3 KBG30ZMS256G | Aorus 15-SA Intel SSD 760p SSDPEKKW512G8 | Razer Blade 15 GTX 1660 Ti Samsung SSD PM981 MZVLB256HAHQ | Dell XPS 15 7590 i5 iGPU FHD Toshiba XG6 KXG60ZNV512G | Asus ROG Zephyrus G15 GA502DU Intel SSD 660p SSDPEKNW512G8 | |
|---|---|---|---|---|---|---|
| AS SSD | 26% | 361% | 387% | 466% | 226% | |
| Seq Read (MB/s) | 1174 | 1033 -12% | 2601 122% | 1829 56% | 2357 101% | 907 -23% |
| Seq Write (MB/s) | 186 | 218.3 17% | 1507 710% | 1315 607% | 1235 564% | 926 398% |
| 4K Read (MB/s) | 34.01 | 24.12 -29% | 56.3 66% | 51.3 51% | 43.29 27% | 47.26 39% |
| 4K Write (MB/s) | 69.4 | 55 -21% | 110.3 59% | 106 53% | 99.7 44% | 98.7 42% |
| 4K-64 Read (MB/s) | 424 | 330.3 -22% | 877 107% | 917 116% | 1020 141% | 321.5 -24% |
| 4K-64 Write (MB/s) | 68.8 | 155.8 126% | 914 1228% | 1212 1662% | 1502 2083% | 736 970% |
| Access Time Read * (ms) | 0.168 | 0.18 -7% | 0.05 70% | 0.063 62% | 0.07 58% | 0.064 62% |
| Access Time Write * (ms) | 0.94 | 0.314 67% | 0.034 96% | 0.104 89% | 0.039 96% | 0.045 95% |
| Score Read (Points) | 575 | 458 -20% | 1193 107% | 1152 100% | 1299 126% | 459 -20% |
| Score Write (Points) | 157 | 233 48% | 1175 648% | 1450 824% | 1726 999% | 927 490% |
| Score Total (Points) | 987 | 891 -10% | 2938 198% | 3177 222% | 3640 269% | 1641 66% |
| Copy ISO MB/s (MB/s) | 215.7 | 382.9 78% | 2104 875% | 1539 613% | 2145 894% | 905 320% |
| Copy Program MB/s (MB/s) | 108.2 | 234.9 117% | 387.7 258% | 513 374% | 565 422% | 496.9 359% |
| Copy Game MB/s (MB/s) | 165.9 | 218.7 32% | 1021 515% | 1150 593% | 1320 696% | 819 394% |
* ... mindre är bättre

| 3DMark 11 Performance | 11845 poäng | |
| 3DMark Cloud Gate Standard Score | 24291 poäng | |
| 3DMark Fire Strike Score | 8081 poäng | |
| 3DMark Time Spy Score | 3608 poäng | |
Hjälp | ||
| Shadow of the Tomb Raider - 1920x1080 High Preset AA:SM | |
| Alienware Area-51m i9-9900K RTX 2080 | |
| Alienware m15 R2 P87F | |
| Alienware m15 P79F | |
| Razer Blade 15 GTX 1660 Ti | |
| HP Pavilion Gaming 17-cd0085cl | |
| Asus TUF FX705GM | |
| Asus ROG Zephyrus G15 GA502DU | |
| MSI GF75 Thin 9SC | |
| Dell G3 3590 | |
| Gainward GeForce GTX 1650 4 GB | |
| Genomsnitt NVIDIA GeForce GTX 1650 Mobile (38 - 53, n=15) | |
| Asus TUF FX705GE-EW096T | |
| Asus GL753VD | |
| låg | med. | hög | ultra | |
|---|---|---|---|---|
| BioShock Infinite (2013) | 259.9 | 221.8 | 193.6 | 85.6 |
| The Witcher 3 (2015) | 175.1 | 115.8 | 65.9 | 36.2 |
| Rocket League (2017) | 247 | 188.7 | 137.2 | |
| Shadow of the Tomb Raider (2018) | 102 | 61 | 51 |
| Dell G3 3590 GeForce GTX 1650 Mobile, i5-9300H, Toshiba BG4 KBG40ZNS128G | Dell G3 15 3579 GeForce GTX 1050 Mobile, i5-8300H, Seagate Mobile HDD 1TB ST1000LX015-1U7172 | Lenovo Legion Y540-15IRH-81SX00B2GE GeForce GTX 1660 Ti Mobile, i7-9750H, WDC PC SN720 SDAPNTW-512G | Aorus 15-SA GeForce GTX 1660 Ti Mobile, i7-9750H, Intel SSD 760p SSDPEKKW512G8 | Alienware m15 R2 P87F GeForce RTX 2080 Max-Q, i7-9750H, 2x Toshiba XG6 KXG60ZNV512G (RAID 0) | HP Gaming Pavilion 15-dk0009ng GeForce GTX 1660 Ti Max-Q, i7-9750H, Samsung SSD PM981 MZVLB256HAHQ | |
|---|---|---|---|---|---|---|
| Noise | 0% | 3% | -18% | -14% | 9% | |
| av / miljö * (dB) | 28.4 | 28 1% | 29.3 -3% | 29 -2% | 28.3 -0% | 28.2 1% |
| Idle Minimum * (dB) | 29.2 | 29.8 -2% | 29.3 -0% | 32 -10% | 28.5 2% | 29.3 -0% |
| Idle Average * (dB) | 29.4 | 29.8 -1% | 29.3 -0% | 35 -19% | 28.5 3% | 29.3 -0% |
| Idle Maximum * (dB) | 29.4 | 30 -2% | 29.3 -0% | 41 -39% | 49 -67% | 29.3 -0% |
| Load Average * (dB) | 39 | 38.6 1% | 35.7 8% | 54 -38% | 49 -26% | 32.3 17% |
| Witcher 3 ultra * (dB) | 49.5 | 46.9 5% | 44.2 11% | 52 -5% | 49 1% | 34 31% |
| Load Maximum * (dB) | 49.7 | 49.4 1% | 45.6 8% | 56 -13% | 55 -11% | 41.2 17% |
* ... mindre är bättre
Ljudnivå
| Låg belastning |
| 29.2 / 29.4 / 29.4 dB(A) |
| Hög belastning |
| 39 / 49.7 dB(A) |
 | ||
30 dB tyst 40 dB(A) hörbar 50 dB(A) högt ljud |
||
min: | ||
(-) Den maximala temperaturen på ovansidan är 49 °C / 120 F, jämfört med genomsnittet av 40.4 °C / 105 F , allt från 21.2 till 68.8 °C för klassen Gaming.
(-) Botten värms upp till maximalt 49.8 °C / 122 F, jämfört med genomsnittet av 43.2 °C / 110 F
(+) Vid tomgångsbruk är medeltemperaturen för ovansidan 28.8 °C / 84 F, jämfört med enhetsgenomsnittet på 33.9 °C / ### class_avg_f### F.
(±) När du spelar The Witcher 3 är medeltemperaturen för ovansidan 37.3 °C / 99 F, jämfört med enhetsgenomsnittet på 33.9 °C / ## #class_avg_f### F.
(+) Handledsstöden och pekplattan är kallare än hudtemperaturen med maximalt 31.2 °C / 88.2 F och är därför svala att ta på.
(-) Medeltemperaturen för handledsstödsområdet på liknande enheter var 28.8 °C / 83.8 F (-2.4 °C / -4.4 F).
Dell G3 3590 ljudanalys
(+) | högtalare kan spela relativt högt (84.1 dB)
Bas 100 - 315 Hz
(-) | nästan ingen bas - i genomsnitt 16.9% lägre än medianen
(±) | linjäriteten för basen är genomsnittlig (10.9% delta till föregående frekvens)
Mellan 400 - 2000 Hz
(±) | högre mellan - i genomsnitt 6.5% högre än median
(+) | mids är linjära (5.9% delta till föregående frekvens)
Högsta 2 - 16 kHz
(+) | balanserade toppar - endast 3.5% från medianen
(±) | linjäriteten för toppar är genomsnittlig (9.4% delta till föregående frekvens)
Totalt 100 - 16 000 Hz
(±) | linjäriteten för det totala ljudet är genomsnittlig (22.8% skillnad mot median)
Jämfört med samma klass
» 82% av alla testade enheter i den här klassen var bättre, 5% liknande, 13% sämre
» Den bästa hade ett delta på 6%, genomsnittet var 18%, sämst var 132%
Jämfört med alla testade enheter
» 68% av alla testade enheter var bättre, 5% liknande, 27% sämre
» Den bästa hade ett delta på 4%, genomsnittet var 23%, sämst var 134%
Apple MacBook 12 (Early 2016) 1.1 GHz ljudanalys
(+) | högtalare kan spela relativt högt (83.6 dB)
Bas 100 - 315 Hz
(±) | reducerad bas - i genomsnitt 11.3% lägre än medianen
(±) | linjäriteten för basen är genomsnittlig (14.2% delta till föregående frekvens)
Mellan 400 - 2000 Hz
(+) | balanserad mellan - endast 2.4% från medianen
(+) | mids är linjära (5.5% delta till föregående frekvens)
Högsta 2 - 16 kHz
(+) | balanserade toppar - endast 2% från medianen
(+) | toppar är linjära (4.5% delta till föregående frekvens)
Totalt 100 - 16 000 Hz
(+) | det totala ljudet är linjärt (10.2% skillnad mot median)
Jämfört med samma klass
» 7% av alla testade enheter i den här klassen var bättre, 2% liknande, 90% sämre
» Den bästa hade ett delta på 5%, genomsnittet var 18%, sämst var 53%
Jämfört med alla testade enheter
» 5% av alla testade enheter var bättre, 1% liknande, 94% sämre
» Den bästa hade ett delta på 4%, genomsnittet var 23%, sämst var 134%
| Av/Standby | |
| Låg belastning | |
| Hög belastning |
|
Förklaring:
min: | |
| Dell G3 3590 i5-9300H, GeForce GTX 1650 Mobile, Toshiba BG4 KBG40ZNS128G, IPS, 1920x1080, 15.6" | Dell G3 15 3579 i5-8300H, GeForce GTX 1050 Mobile, Seagate Mobile HDD 1TB ST1000LX015-1U7172, IPS, 1920x1080, 15.6" | Aorus 15-SA i7-9750H, GeForce GTX 1660 Ti Mobile, Intel SSD 760p SSDPEKKW512G8, IPS, 1920x1080, 15.6" | Alienware m15 R2 P87F i7-9750H, GeForce RTX 2080 Max-Q, 2x Toshiba XG6 KXG60ZNV512G (RAID 0), IPS, 1920x1080, 15.6" | HP Gaming Pavilion 15-dk0009ng i7-9750H, GeForce GTX 1660 Ti Max-Q, Samsung SSD PM981 MZVLB256HAHQ, IPS, 1920x1080, 15.6" | MSI GS65 Stealth Thin 8RE-051US i7-8750H, GeForce GTX 1060 Mobile, Samsung SSD PM981 MZVLB256HAHQ, IPS, 1920x1080, 15.6" | |
|---|---|---|---|---|---|---|
| Power Consumption | 0% | -79% | -147% | -9% | -20% | |
| Idle Minimum * (Watt) | 6.2 | 7.9 -27% | 20 -223% | 19 -206% | 6.8 -10% | 8.7 -40% |
| Idle Average * (Watt) | 8.4 | 9.6 -14% | 23 -174% | 40.5 -382% | 10.7 -27% | 13 -55% |
| Idle Maximum * (Watt) | 27.7 | 13 53% | 29 -5% | 52 -88% | 12.5 55% | 14.3 48% |
| Load Average * (Watt) | 91 | 93 -2% | 87 4% | 132.3 -45% | 87.2 4% | 107.4 -18% |
| Witcher 3 ultra * (Watt) | 94.4 | 100.6 -7% | 136 -44% | 183.3 -94% | 121 -28% | 129 -37% |
| Load Maximum * (Watt) | 131.5 | 132.7 -1% | 173 -32% | 217.2 -65% | 191.4 -46% | 151.5 -15% |
* ... mindre är bättre
| Dell G3 3590 i5-9300H, GeForce GTX 1650 Mobile, 51 Wh | Dell G3 15 3579 i5-8300H, GeForce GTX 1050 Mobile, 56 Wh | Lenovo Legion Y540-15IRH-81SX00B2GE i7-9750H, GeForce GTX 1660 Ti Mobile, 57 Wh | Aorus 15-SA i7-9750H, GeForce GTX 1660 Ti Mobile, 62 Wh | Alienware m15 R2 P87F i7-9750H, GeForce RTX 2080 Max-Q, 76 Wh | HP Gaming Pavilion 15-dk0009ng i7-9750H, GeForce GTX 1660 Ti Max-Q, 52.5 Wh | |
|---|---|---|---|---|---|---|
| Batteridrifttid | 27% | -47% | -30% | -33% | -24% | |
| Reader / Idle (h) | 13.5 | 4 -70% | 3.5 -74% | 9.2 -32% | 8.7 -36% | |
| WiFi v1.3 (h) | 6.7 | 6.5 -3% | 2.4 -64% | 2.8 -58% | 5.5 -18% | 4.8 -28% |
| Load (h) | 1.4 | 2.2 57% | 1.3 -7% | 2 43% | 0.7 -50% | 1.3 -7% |
| Witcher 3 ultra (h) | 1 |
För
Emot
Läs den fullständiga versionen av den här recensionen på engelska här.
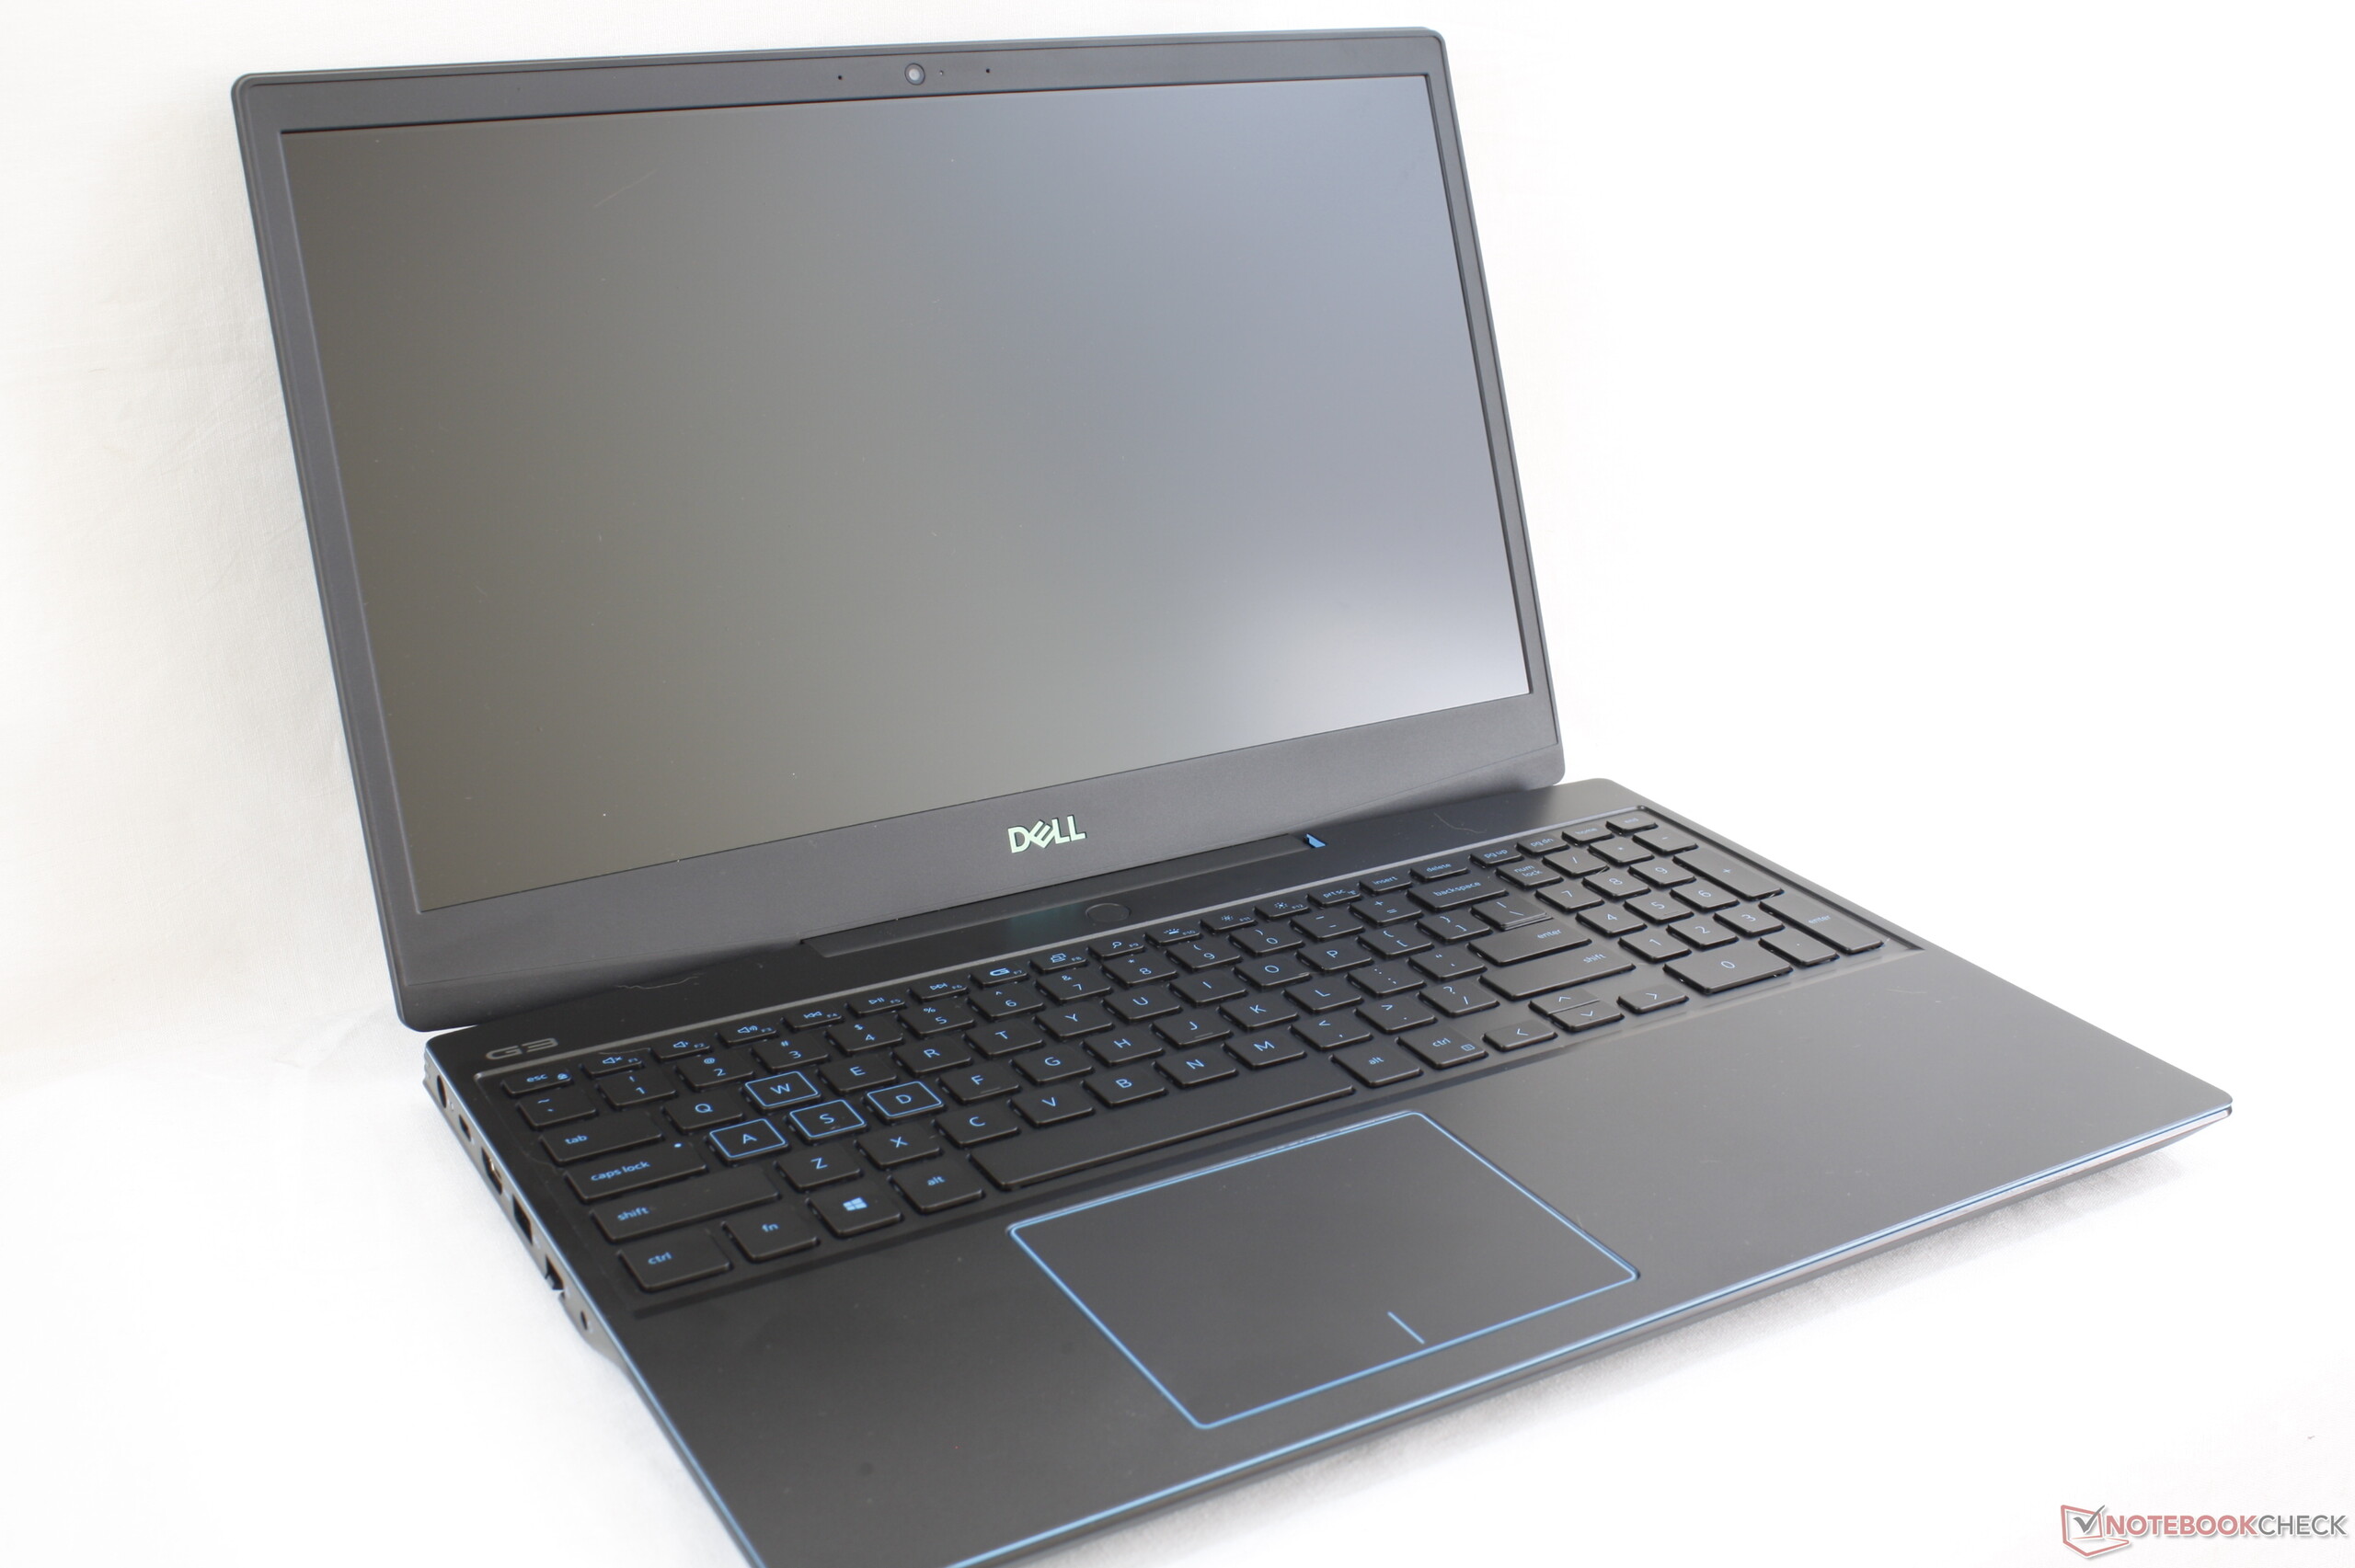
Det bästa med Dell G3 3590 är servicemöjligheterna. Jämfört med HP Pavilion Gaming 15 eller MSI GP65 är Dells system lättare att uppgradera och man behöver inte avlägsna några garantiförseglingar. Prestandan ligger på den nivå vi förväntat oss med tanke på hårdvaran och det låga priset gör att den tilltalar användare som vill ha en skapligt kraftfull spelmaskin utan krusiduller.
Listan över svagheter är längre än vi hade önskat. I synnerhet lider skärmen av lite för många nedskärningar och har svaga färger, måttlig till kraftig blödning från bakgrundsbelysningen, långsamma responstider, ett grynigt matt överdrag och mörk bakgrundsbelysning. Även om den nog är fullt tillräcklig för de flesta gamers har både HP Gaming Pavilion 15 och Lenovo Legion Y540 betydligt bättre skärmar som i större utsträckning passar snabb gameplay. G3 3590 har inte har några ytterligare skärmalternativ så du får uppgradera till en modell från Dells G7-serie om du vill ha en bättre visuell upplevelse.
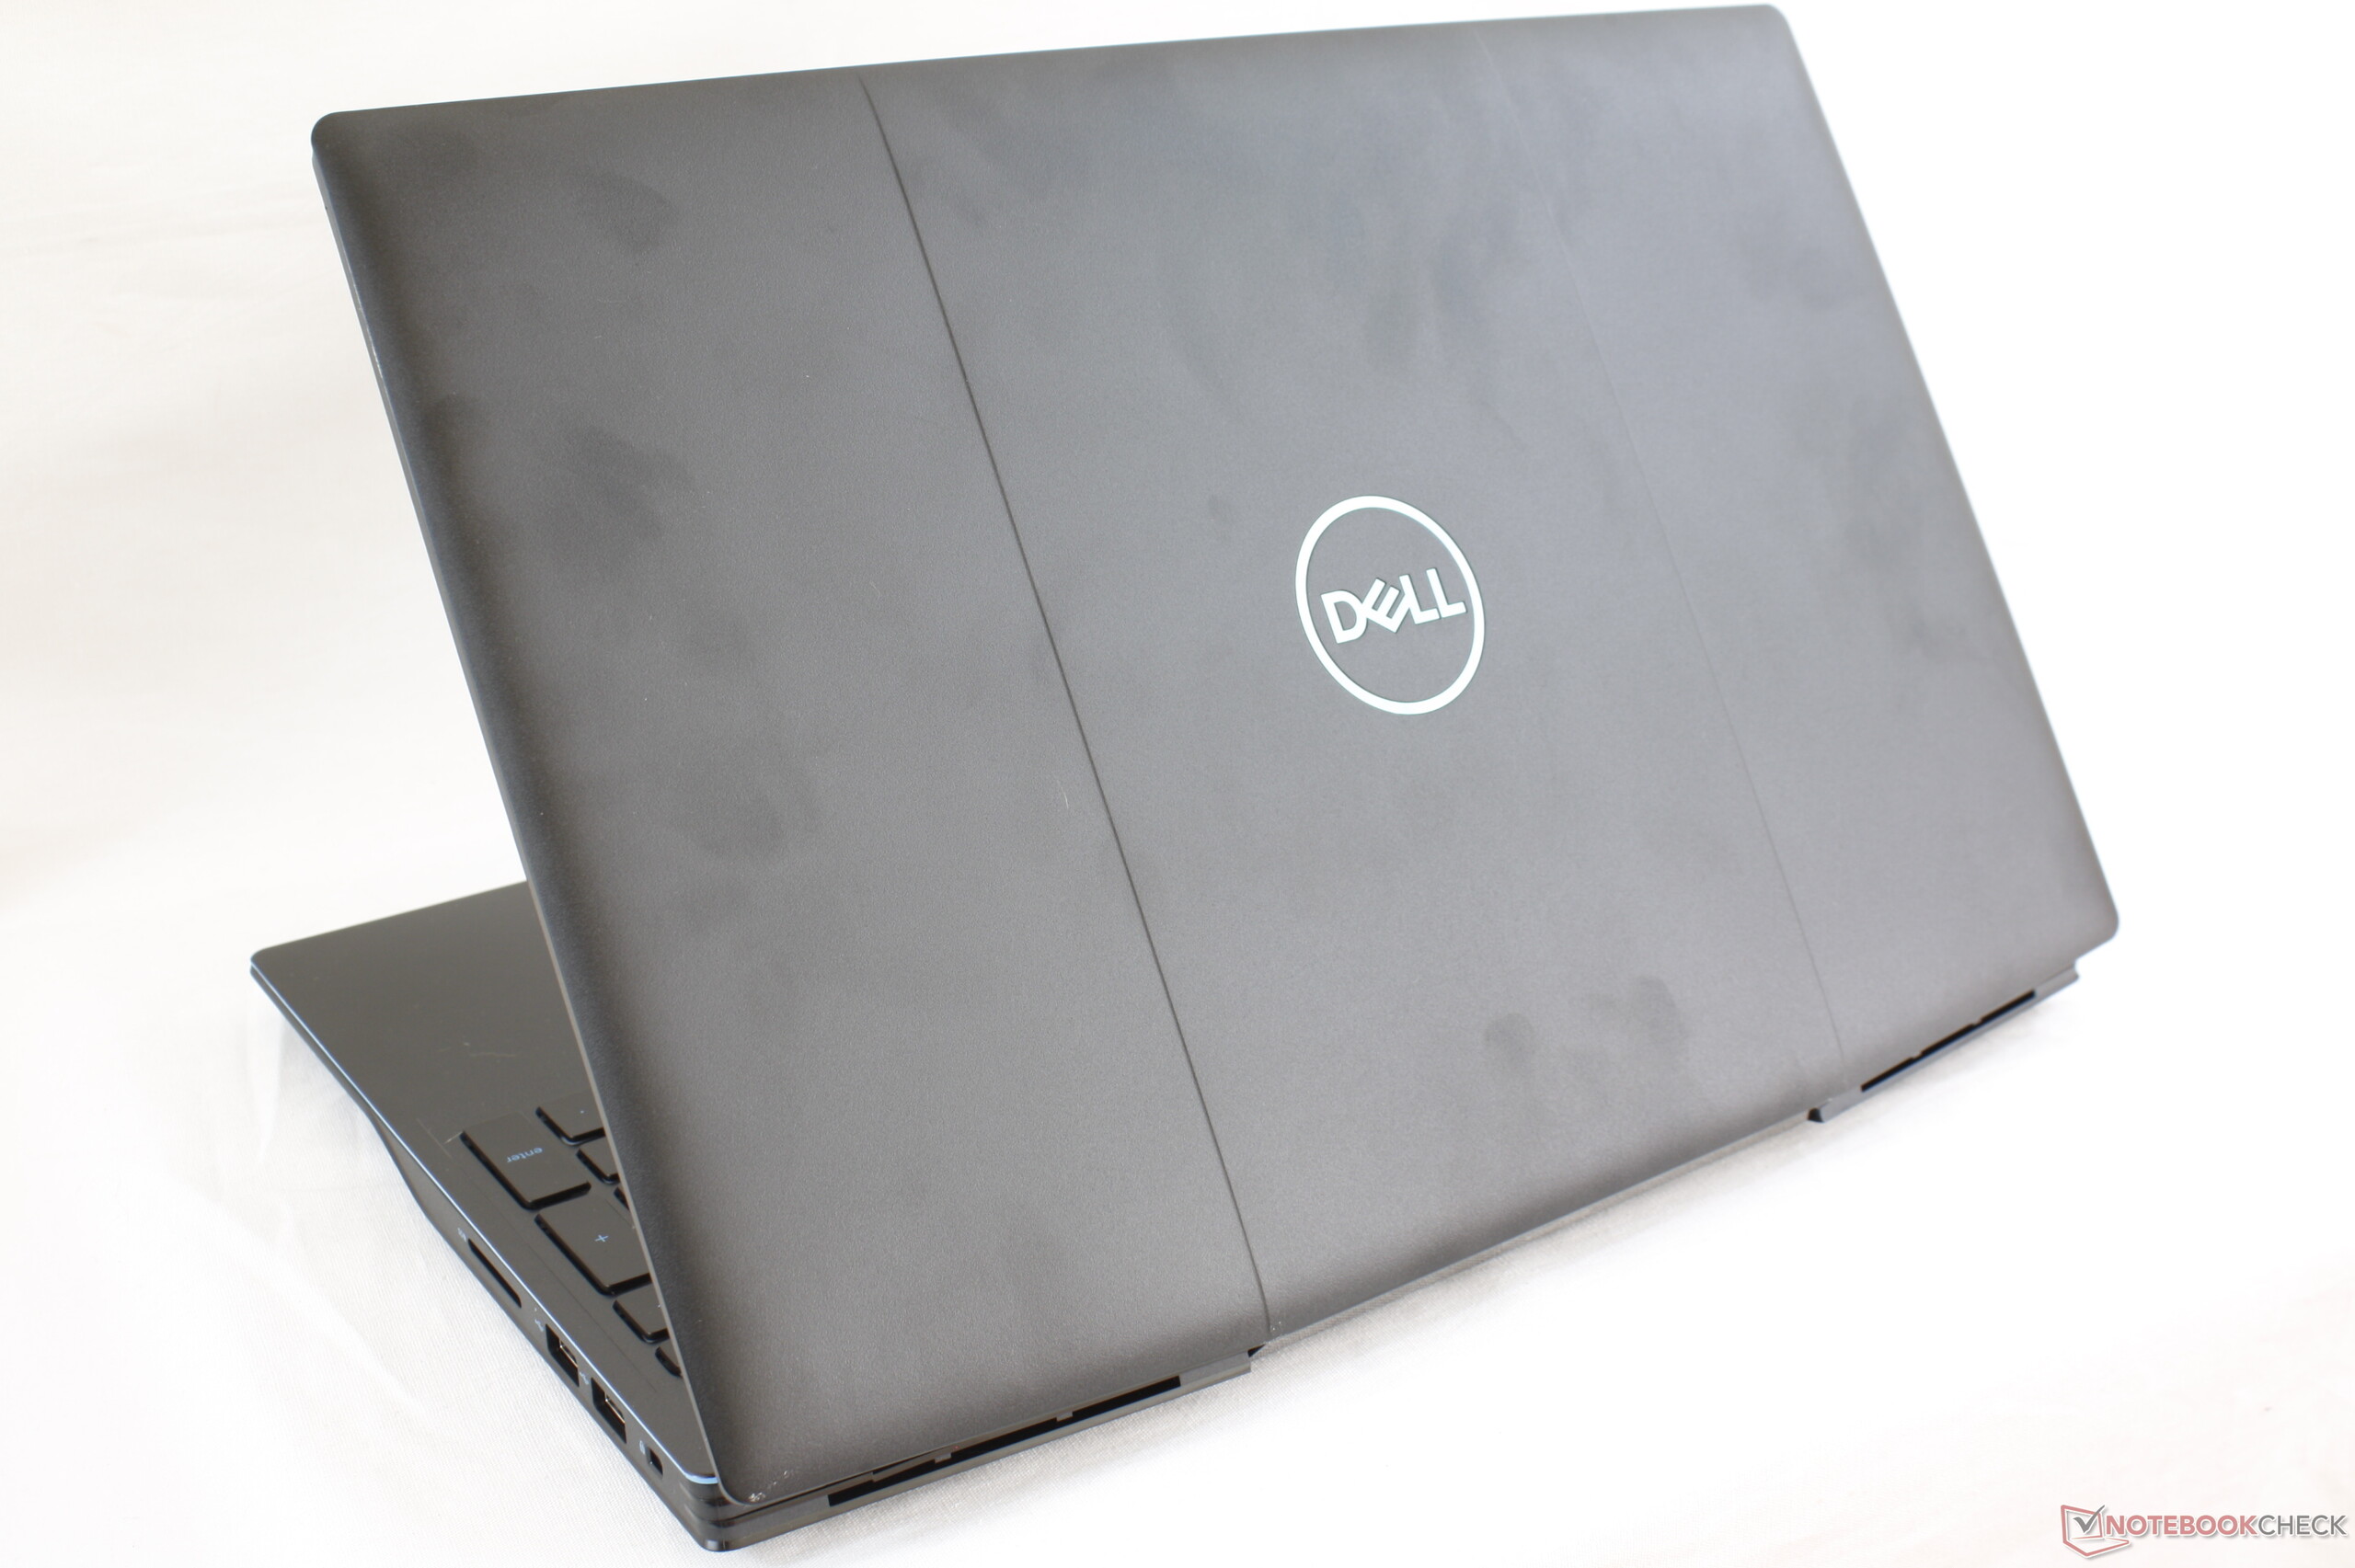
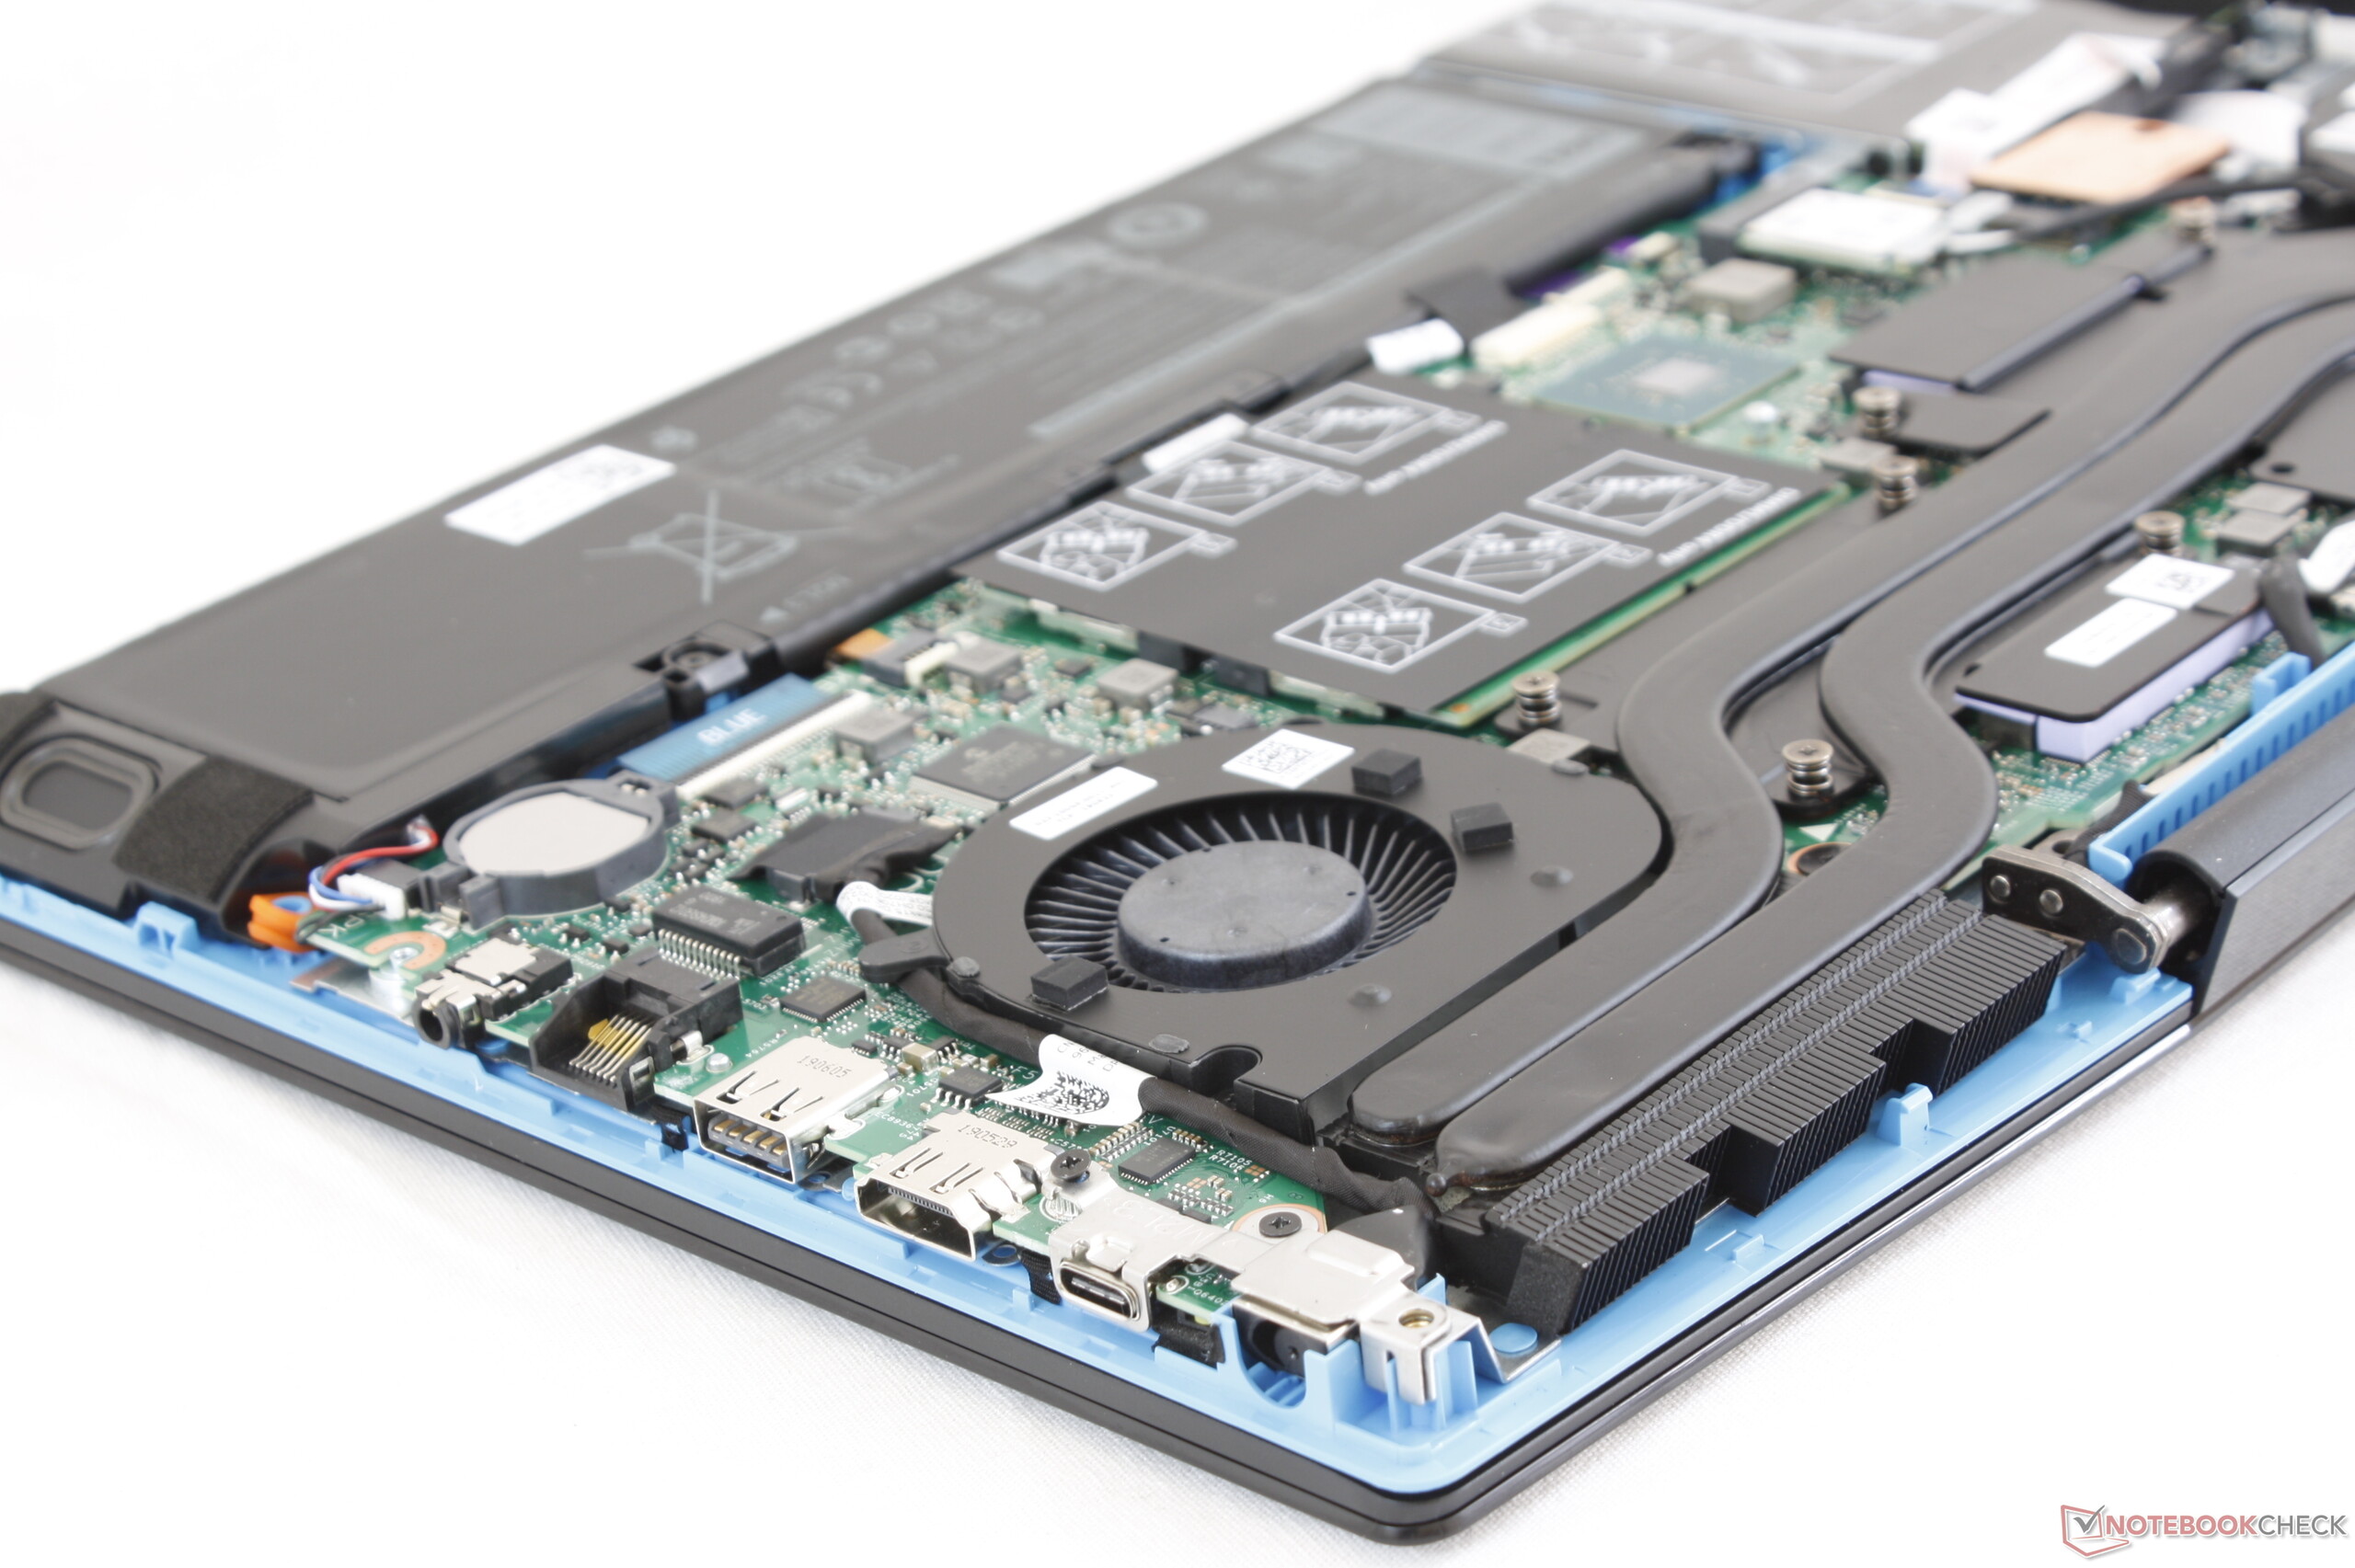
Resten av systemet är typiskt för det här prisskiktet. Ett plasthölje, diskant-tunga högtalare, en långsam SD-kortläsare, 1x1 WLAN och en billig NVMe SSD-enhet är alla vanliga att se på billiga spellaptops.
Om du har 10.000 kronor att spendera på en spellaptop kan du vilja överväga den tystare HP Pavilion Gaming 15 eller den smidigare AMD-drivna Asus Zephyrus G GA502-serien. Dell G3 3590 må vara en aning billigare, men högljudda fläktar och en sämre skärm gör den svår att rekommendera.
Dell G3 3590
- 10/11/2019 v7 (old)
Allen Ngo
Price comparison
