Test: Asus ZenBook 15 UX534F - Ser ut som en Ultrabook, spelar som en Gamer (Sammanfattning)
| SD Card Reader | |
| average JPG Copy Test (av. of 3 runs) | |
| Dell XPS 15 7590 9980HK GTX 1650 (Toshiba Exceria Pro SDXC 64 GB UHS-II) | |
| HP Spectre x360 15-df0126ng (Toshiba Exceria Pro M501 microSDXC 64GB) | |
| Asus ZenBook 15 UX534FT-DB77 (Toshiba Exceria Pro SDXC 64 GB UHS-II) | |
| maximum AS SSD Seq Read Test (1GB) | |
| HP Spectre x360 15-df0126ng (Toshiba Exceria Pro M501 microSDXC 64GB) | |
| Dell XPS 15 7590 9980HK GTX 1650 (Toshiba Exceria Pro SDXC 64 GB UHS-II) | |
| Asus ZenBook 15 UX534FT-DB77 (Toshiba Exceria Pro SDXC 64 GB UHS-II) | |
| |||||||||||||||||||||||||
Distribution av ljusstyrkan: 85 %
Mitt på batteriet: 312.6 cd/m²
Kontrast: 1008:1 (Svärta: 0.31 cd/m²)
ΔE ColorChecker Calman: 5.78 | ∀{0.5-29.43 Ø4.73}
calibrated: 3.78
ΔE Greyscale Calman: 5.4 | ∀{0.09-98 Ø4.97}
87.4% sRGB (Argyll 1.6.3 3D)
57.1% AdobeRGB 1998 (Argyll 1.6.3 3D)
64.1% AdobeRGB 1998 (Argyll 3D)
87.7% sRGB (Argyll 3D)
66.6% Display P3 (Argyll 3D)
Gamma: 2.21
CCT: 7864 K
| Asus ZenBook 15 UX534FT-DB77 BOE NV156FHM-N63, IPS, 15.6", 1920x1080 | Dell XPS 15 7590 9980HK GTX 1650 Samsung 156WR04, SDCA029, OLED, 15.6", 3840x2160 | HP Spectre x360 15-df0126ng AU Optronics AUO30EB, IPS, 15.6", 3840x2160 | Lenovo Yoga 730-15IKB BOE HF NV156QUM-N51, IPS, 15.6", 3840x2160 | Razer Blade 15 GTX 1660 Ti BOE NV156FHM-N4K, IPS, 15.6", 1920x1080 | Apple MacBook Pro 15 2018 (2.6 GHz, 560X) APPA040, IPS, 15.4", 2880x1800 | |
|---|---|---|---|---|---|---|
| Display | 30% | 5% | 3% | 2% | 32% | |
| Display P3 Coverage (%) | 66.6 | 88.1 32% | 68.1 2% | 68.7 3% | 65.3 -2% | 98.7 48% |
| sRGB Coverage (%) | 87.7 | 99.6 14% | 94.2 7% | 90 3% | 91.8 5% | 99.9 14% |
| AdobeRGB 1998 Coverage (%) | 64.1 | 91.8 43% | 68.4 7% | 65.8 3% | 66.5 4% | 86.6 35% |
| Response Times | 94% | -16% | 21% | 69% | 1% | |
| Response Time Grey 50% / Grey 80% * (ms) | 41.2 ? | 2.3 ? 94% | 57 ? -38% | 34 ? 17% | 13.6 ? 67% | 43.2 ? -5% |
| Response Time Black / White * (ms) | 33.2 ? | 2.4 ? 93% | 31 ? 7% | 25 ? 25% | 10 ? 70% | 31.2 ? 6% |
| PWM Frequency (Hz) | 59.5 ? | 961 ? | 200 ? | 117000 ? | ||
| Screen | 19% | 11% | 5% | 12% | 47% | |
| Brightness middle (cd/m²) | 312.6 | 421.2 35% | 330 6% | 309 -1% | 312.7 0% | 520 66% |
| Brightness (cd/m²) | 290 | 417 44% | 310 7% | 299 3% | 305 5% | 492 70% |
| Brightness Distribution (%) | 85 | 94 11% | 87 2% | 84 -1% | 90 6% | 88 4% |
| Black Level * (cd/m²) | 0.31 | 0.37 -19% | 0.29 6% | 0.27 13% | 0.39 -26% | |
| Contrast (:1) | 1008 | 892 -12% | 1066 6% | 1158 15% | 1333 32% | |
| Colorchecker dE 2000 * | 5.78 | 6.06 -5% | 4.03 30% | 3.9 33% | 4.57 21% | 1.2 79% |
| Colorchecker dE 2000 max. * | 8.86 | 11.89 -34% | 6.74 24% | 7.5 15% | 6.81 23% | 2.3 74% |
| Colorchecker dE 2000 calibrated * | 3.78 | 1.96 48% | 2.91 23% | |||
| Greyscale dE 2000 * | 5.4 | 2.8 48% | 4.49 17% | 4.58 15% | 4.3 20% | 1.3 76% |
| Gamma | 2.21 100% | 2.15 102% | 2.57 86% | 2.43 91% | 2.29 96% | 2.18 101% |
| CCT | 7864 83% | 6235 104% | 6744 96% | 7344 89% | 7098 92% | 6738 96% |
| Color Space (Percent of AdobeRGB 1998) (%) | 57.1 | 81 42% | 61 7% | 39 -32% | 59.4 4% | |
| Color Space (Percent of sRGB) (%) | 87.4 | 99.6 14% | 94 8% | 90 3% | 91.3 4% | |
| Totalt genomsnitt (program/inställningar) | 48% /
33% | 0% /
6% | 10% /
7% | 28% /
17% | 27% /
36% |
* ... mindre är bättre
Visa svarstider
| ↔ Svarstid svart till vitt | ||
|---|---|---|
| 33.2 ms ... stiga ↗ och falla ↘ kombinerat | ↗ 19.6 ms stiga | 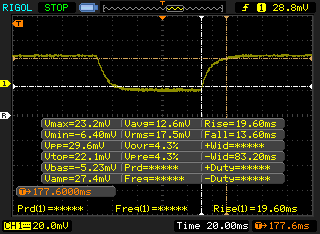 |
| ↘ 13.6 ms hösten | ||
| Skärmen visar långsamma svarsfrekvenser i våra tester och kommer att vara otillfredsställande för spelare. I jämförelse sträcker sig alla testade enheter från 0.1 (minst) till 240 (maximalt) ms. » 90 % av alla enheter är bättre. Detta innebär att den uppmätta svarstiden är sämre än genomsnittet av alla testade enheter (19.9 ms). | ||
| ↔ Svarstid 50 % grått till 80 % grått | ||
| 41.2 ms ... stiga ↗ och falla ↘ kombinerat | ↗ 22 ms stiga | 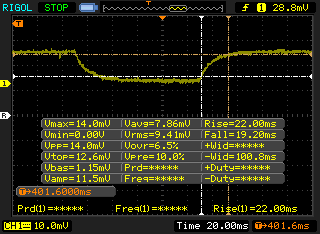 |
| ↘ 19.2 ms hösten | ||
| Skärmen visar långsamma svarsfrekvenser i våra tester och kommer att vara otillfredsställande för spelare. I jämförelse sträcker sig alla testade enheter från 0.165 (minst) till 636 (maximalt) ms. » 66 % av alla enheter är bättre. Detta innebär att den uppmätta svarstiden är sämre än genomsnittet av alla testade enheter (31.1 ms). | ||
Skärmflimmer / PWM (Puls-Width Modulation)
| Skärmflimmer / PWM upptäcktes inte | 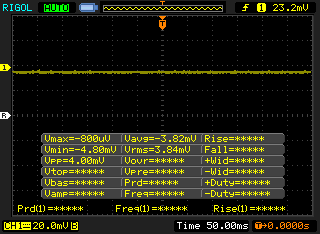 | ||
Som jämförelse: 52 % av alla testade enheter använder inte PWM för att dämpa skärmen. Om PWM upptäcktes mättes ett medelvärde av 7801 (minst: 5 - maximum: 343500) Hz. | |||

| Cinebench R15 | |
| CPU Single 64Bit | |
| Asus ZenBook 15 UX534FT-DB77 | |
| Asus Strix Hero III G731GV | |
| Genomsnitt Intel Core i7-8565U (138.3 - 193, n=51) | |
| Asus VivoBook S15 S530UN-BQ097T | |
| Lenovo Ideapad L340-17IRH 81LL001YGE | |
| Asus VivoBook 14 X412FJ-EB023T | |
| Acer Nitro 5 AN515-42-R6V0 | |
| Asus VivoBook 15 X542UF-DM143T | |
| Asus ROG Zephyrus G15 GA502DU | |
| Asus ZenBook Flip 14 UM462DA-AI023T | |
| Asus ZenBook UX530UX-FY070T | |
| CPU Multi 64Bit | |
| Asus Strix Hero III G731GV | |
| Asus ROG Zephyrus G15 GA502DU | |
| Asus VivoBook 15 X542UF-DM143T | |
| Asus VivoBook S15 S530UN-BQ097T | |
| Lenovo Ideapad L340-17IRH 81LL001YGE | |
| Asus ZenBook 15 UX534FT-DB77 | |
| Asus VivoBook 14 X412FJ-EB023T | |
| Acer Nitro 5 AN515-42-R6V0 | |
| Asus ZenBook Flip 14 UM462DA-AI023T | |
| Genomsnitt Intel Core i7-8565U (452 - 815, n=52) | |
| Asus ZenBook UX530UX-FY070T | |
| PCMark 8 Home Score Accelerated v2 | 3764 poäng | |
| PCMark 8 Work Score Accelerated v2 | 5132 poäng | |
| PCMark 10 Score | 4828 poäng | |
Hjälp | ||
| Asus ZenBook 15 UX534FT-DB77 Samsung SSD PM981 MZVLB1T0HALR | Dell XPS 15 7590 9980HK GTX 1650 Toshiba XG6 KXG60ZNV1T02 | HP Spectre x360 15-df0126ng Toshiba XG5-P KXG50PNV2T04 | Lenovo Yoga 730-15IKB SK Hynix PC401 512GB M.2 (HFS512GD9TNG) | Asus ZenBook Pro Duo UX581GV Samsung SSD PM981 MZVLB1T0HALR | Razer Blade 15 GTX 1660 Ti Samsung SSD PM981 MZVLB256HAHQ | |
|---|---|---|---|---|---|---|
| AS SSD | 18% | -43% | -25% | 7% | -14% | |
| Seq Read (MB/s) | 1887 | 1723 -9% | 2018 7% | 2158 14% | 1409 -25% | 1829 -3% |
| Seq Write (MB/s) | 1432 | 1386 -3% | 773 -46% | 680 -53% | 1316 -8% | 1315 -8% |
| 4K Read (MB/s) | 52.3 | 43.25 -17% | 24.62 -53% | 44.74 -14% | 44.99 -14% | 51.3 -2% |
| 4K Write (MB/s) | 146 | 98.3 -33% | 92.8 -36% | 123 -16% | 93 -36% | 106 -27% |
| 4K-64 Read (MB/s) | 969 | 1078 11% | 845 -13% | 623 -36% | 1092 13% | 917 -5% |
| 4K-64 Write (MB/s) | 1375 | 1456 6% | 957 -30% | 486 -65% | 1810 32% | 1212 -12% |
| Access Time Read * (ms) | 0.034 | 0.05 -47% | 0.147 -332% | 0.044 -29% | 0.041 -21% | 0.063 -85% |
| Access Time Write * (ms) | 0.075 | 0.039 48% | 0.057 24% | 0.051 32% | 0.118 -57% | 0.104 -39% |
| Score Read (Points) | 1210 | 1294 7% | 1071 -11% | 884 -27% | 1278 6% | 1152 -5% |
| Score Write (Points) | 1664 | 1693 2% | 1127 -32% | 677 -59% | 2034 22% | 1450 -13% |
| Score Total (Points) | 3483 | 3638 4% | 2684 -23% | 1951 -44% | 3970 14% | 3177 -9% |
| Copy ISO MB/s (MB/s) | 1375 | 3182 131% | 1652 20% | 1641 19% | 2112 54% | 1539 12% |
| Copy Program MB/s (MB/s) | 468 | 984 110% | 328.5 -30% | 390 -17% | 874 87% | 513 10% |
| Copy Game MB/s (MB/s) | 1287 | 1824 42% | 700 -46% | 574 -55% | 1677 30% | 1150 -11% |
* ... mindre är bättre

| 3DMark 11 | |
| 1280x720 Performance GPU | |
| Asus Strix Hero III G731GV | |
| Razer Blade 15 GTX 1660 Ti | |
| HP Omen 15-dc0015ng | |
| HP Omen X 2S 15-dg0075cl | |
| Gainward GeForce GTX 1650 4 GB | |
| Acer Aspire 7 A715-74G-50U5 | |
| Asus Zephyrus S GX531GM | |
| Genomsnitt NVIDIA GeForce GTX 1650 Max-Q (10248 - 12259, n=14) | |
| Asus ZenBook 15 UX534FT-DB77 | |
| Asus TUF FX705GE-EW096T | |
| Lenovo Yoga 730-15IKB | |
| Asus Zenbook UX510UW-CN044T | |
| Asus VivoBook 15 X512FL-EJ205T | |
| Asus Zenbook 14 UX433FN-A6023T | |
| 1280x720 Performance Combined | |
| HP Omen X 2S 15-dg0075cl | |
| Asus Strix Hero III G731GV | |
| HP Omen 15-dc0015ng | |
| Gainward GeForce GTX 1650 4 GB | |
| Razer Blade 15 GTX 1660 Ti | |
| Acer Aspire 7 A715-74G-50U5 | |
| Genomsnitt NVIDIA GeForce GTX 1650 Max-Q (6409 - 10846, n=13) | |
| Asus ZenBook 15 UX534FT-DB77 | |
| Asus TUF FX705GE-EW096T | |
| Asus Zephyrus S GX531GM | |
| Asus Zenbook UX510UW-CN044T | |
| Lenovo Yoga 730-15IKB | |
| Asus VivoBook 15 X512FL-EJ205T | |
| Asus Zenbook 14 UX433FN-A6023T | |
| 3DMark 11 Performance | 10217 poäng | |
| 3DMark Cloud Gate Standard Score | 21547 poäng | |
| 3DMark Fire Strike Score | 6698 poäng | |
| 3DMark Time Spy Score | 2949 poäng | |
Hjälp | ||
| låg | med. | hög | ultra | |
|---|---|---|---|---|
| BioShock Infinite (2013) | 259.1 | 196.1 | 172.2 | 72 |
| The Witcher 3 (2015) | 156.1 | 93.6 | 54.3 | 30.7 |
| Rocket League (2017) | 216.1 | 138.1 | 97.8 | |
| Shadow of the Tomb Raider (2018) | 92 | 48 | 39 | 34 |
| Asus ZenBook 15 UX534FT-DB77 GeForce GTX 1650 Max-Q, i7-8565U, Samsung SSD PM981 MZVLB1T0HALR | Dell XPS 15 7590 9980HK GTX 1650 GeForce GTX 1650 Mobile, i9-9980HK, Toshiba XG6 KXG60ZNV1T02 | Asus ZenBook Pro Duo UX581GV GeForce RTX 2060 Mobile, i9-9980HK, Samsung SSD PM981 MZVLB1T0HALR | Razer Blade 15 GTX 1660 Ti GeForce GTX 1660 Ti Mobile, i7-9750H, Samsung SSD PM981 MZVLB256HAHQ | HP Spectre x360 15-df0126ng GeForce GTX 1050 Ti Max-Q, i7-8750H, Toshiba XG5-P KXG50PNV2T04 | Lenovo Yoga 730-15IKB GeForce GTX 1050 Mobile, i5-8550U, SK Hynix PC401 512GB M.2 (HFS512GD9TNG) | |
|---|---|---|---|---|---|---|
| Noise | -10% | -6% | -13% | -9% | -5% | |
| av / miljö * (dB) | 28.4 | 28.2 1% | 28.4 -0% | 28.5 -0% | 30.4 -7% | 30.5 -7% |
| Idle Minimum * (dB) | 28.4 | 28.2 1% | 29 -2% | 30.3 -7% | 30.4 -7% | 30.5 -7% |
| Idle Average * (dB) | 28.4 | 28.2 1% | 29 -2% | 30.5 -7% | 30.4 -7% | 30.5 -7% |
| Idle Maximum * (dB) | 28.4 | 30.4 -7% | 29 -2% | 30.5 -7% | 31.6 -11% | 30.5 -7% |
| Load Average * (dB) | 33.9 | 43.8 -29% | 35.4 -4% | 41 -21% | 43.2 -27% | 37.5 -11% |
| Witcher 3 ultra * (dB) | 39.8 | 47.2 -19% | 42 -6% | 48 -21% | ||
| Load Maximum * (dB) | 40.2 | 47.2 -17% | 50 -24% | 51.9 -29% | 38.3 5% | 37.5 7% |
* ... mindre är bättre
Ljudnivå
| Låg belastning |
| 28.4 / 28.4 / 28.4 dB(A) |
| Hög belastning |
| 33.9 / 40.2 dB(A) |
 | ||
30 dB tyst 40 dB(A) hörbar 50 dB(A) högt ljud |
||
min: | ||
(-) Den maximala temperaturen på ovansidan är 45.4 °C / 114 F, jämfört med genomsnittet av 36.8 °C / 98 F , allt från 21 till 71 °C för klassen Multimedia.
(-) Botten värms upp till maximalt 51.6 °C / 125 F, jämfört med genomsnittet av 39.1 °C / 102 F
(+) Vid tomgångsbruk är medeltemperaturen för ovansidan 31.6 °C / 89 F, jämfört med enhetsgenomsnittet på 31.3 °C / ### class_avg_f### F.
(±) När du spelar The Witcher 3 är medeltemperaturen för ovansidan 34.7 °C / 94 F, jämfört med enhetsgenomsnittet på 31.3 °C / ## #class_avg_f### F.
(+) Handledsstöden och pekplattan når maximal hudtemperatur (35 °C / 95 F) och är därför inte varma.
(-) Medeltemperaturen för handledsstödsområdet på liknande enheter var 28.7 °C / 83.7 F (-6.3 °C / -11.3 F).
Asus ZenBook 15 UX534FT-DB77 ljudanalys
(±) | högtalarljudstyrkan är genomsnittlig men bra (77.5 dB)
Bas 100 - 315 Hz
(±) | reducerad bas - i genomsnitt 12.4% lägre än medianen
(±) | linjäriteten för basen är genomsnittlig (14.9% delta till föregående frekvens)
Mellan 400 - 2000 Hz
(+) | balanserad mellan - endast 4.5% från medianen
(+) | mids är linjära (5.8% delta till föregående frekvens)
Högsta 2 - 16 kHz
(+) | balanserade toppar - endast 2.6% från medianen
(±) | linjäriteten för toppar är genomsnittlig (7.4% delta till föregående frekvens)
Totalt 100 - 16 000 Hz
(±) | linjäriteten för det totala ljudet är genomsnittlig (19% skillnad mot median)
Jämfört med samma klass
» 60% av alla testade enheter i den här klassen var bättre, 7% liknande, 32% sämre
» Den bästa hade ett delta på 5%, genomsnittet var 17%, sämst var 45%
Jämfört med alla testade enheter
» 45% av alla testade enheter var bättre, 7% liknande, 48% sämre
» Den bästa hade ett delta på 4%, genomsnittet var 24%, sämst var 134%
Apple MacBook 12 (Early 2016) 1.1 GHz ljudanalys
(+) | högtalare kan spela relativt högt (83.6 dB)
Bas 100 - 315 Hz
(±) | reducerad bas - i genomsnitt 11.3% lägre än medianen
(±) | linjäriteten för basen är genomsnittlig (14.2% delta till föregående frekvens)
Mellan 400 - 2000 Hz
(+) | balanserad mellan - endast 2.4% från medianen
(+) | mids är linjära (5.5% delta till föregående frekvens)
Högsta 2 - 16 kHz
(+) | balanserade toppar - endast 2% från medianen
(+) | toppar är linjära (4.5% delta till föregående frekvens)
Totalt 100 - 16 000 Hz
(+) | det totala ljudet är linjärt (10.2% skillnad mot median)
Jämfört med samma klass
» 7% av alla testade enheter i den här klassen var bättre, 2% liknande, 91% sämre
» Den bästa hade ett delta på 5%, genomsnittet var 18%, sämst var 53%
Jämfört med alla testade enheter
» 5% av alla testade enheter var bättre, 1% liknande, 94% sämre
» Den bästa hade ett delta på 4%, genomsnittet var 24%, sämst var 134%
| Av/Standby | |
| Låg belastning | |
| Hög belastning |
|
Förklaring:
min: | |
| Asus ZenBook 15 UX534FT-DB77 i7-8565U, GeForce GTX 1650 Max-Q, Samsung SSD PM981 MZVLB1T0HALR, IPS, 1920x1080, 15.6" | Dell XPS 15 7590 9980HK GTX 1650 i9-9980HK, GeForce GTX 1650 Mobile, Toshiba XG6 KXG60ZNV1T02, OLED, 3840x2160, 15.6" | Asus ZenBook Pro Duo UX581GV i9-9980HK, GeForce RTX 2060 Mobile, Samsung SSD PM981 MZVLB1T0HALR, OLED, 3840x2160, 15.6" | Razer Blade 15 GTX 1660 Ti i7-9750H, GeForce GTX 1660 Ti Mobile, Samsung SSD PM981 MZVLB256HAHQ, IPS, 1920x1080, 15.6" | Apple MacBook Pro 15 2018 (2.6 GHz, 560X) i7-8850H, Radeon Pro 560X, Apple SSD AP0512, IPS, 2880x1800, 15.4" | Lenovo Yoga 730-15IKB i5-8550U, GeForce GTX 1050 Mobile, SK Hynix PC401 512GB M.2 (HFS512GD9TNG), IPS, 3840x2160, 15.6" | HP Spectre x360 15-df0126ng i7-8750H, GeForce GTX 1050 Ti Max-Q, Toshiba XG5-P KXG50PNV2T04, IPS, 3840x2160, 15.6" | |
|---|---|---|---|---|---|---|---|
| Power Consumption | -16% | -108% | -117% | 19% | 27% | 27% | |
| Idle Minimum * (Watt) | 5 | 6.2 -24% | 19.3 -286% | 18.7 -274% | 3.4 32% | 4.8 4% | 2.1 58% |
| Idle Average * (Watt) | 13.2 | 9.6 27% | 24.2 -83% | 30.7 -133% | 11 17% | 10.1 23% | 6.7 49% |
| Idle Maximum * (Watt) | 24 | 21.2 12% | 24.5 -2% | 33.9 -41% | 14.9 38% | 10.7 55% | 11.4 52% |
| Load Average * (Watt) | 70 | 104.3 -49% | 122.3 -75% | 93.4 -33% | 78.9 -13% | 44 37% | 77.7 -11% |
| Witcher 3 ultra * (Watt) | 63.3 | 91.7 -45% | 137 -116% | 158.9 -151% | |||
| Load Maximum * (Watt) | 114 | 135.3 -19% | 208.4 -83% | 195.3 -71% | 91.2 20% | 94.7 17% | 131.5 -15% |
* ... mindre är bättre
| Asus ZenBook 15 UX534FT-DB77 i7-8565U, GeForce GTX 1650 Max-Q, 71 Wh | Dell XPS 15 7590 9980HK GTX 1650 i9-9980HK, GeForce GTX 1650 Mobile, 97 Wh | HP Spectre x360 15-df0126ng i7-8750H, GeForce GTX 1050 Ti Max-Q, 84 Wh | Lenovo Yoga 730-15IKB i5-8550U, GeForce GTX 1050 Mobile, 51.5 Wh | Asus ZenBook Pro Duo UX581GV i9-9980HK, GeForce RTX 2060 Mobile, 71 Wh | Razer Blade 15 GTX 1660 Ti i7-9750H, GeForce GTX 1660 Ti Mobile, 65 Wh | |
|---|---|---|---|---|---|---|
| Batteridrifttid | -7% | -10% | -48% | -47% | -35% | |
| Reader / Idle (h) | 21.5 | 15.2 -29% | 18.8 -13% | 11.6 -46% | 13.1 -39% | |
| WiFi v1.3 (h) | 8.4 | 7.8 -7% | 8.8 5% | 6.2 -26% | 4.1 -51% | 5.5 -35% |
| Load (h) | 2.9 | 3.3 14% | 2.3 -21% | 0.8 -72% | 1.4 -52% |
För
Emot

Läs den fullständiga versionen av den här recensionen på engelska här.
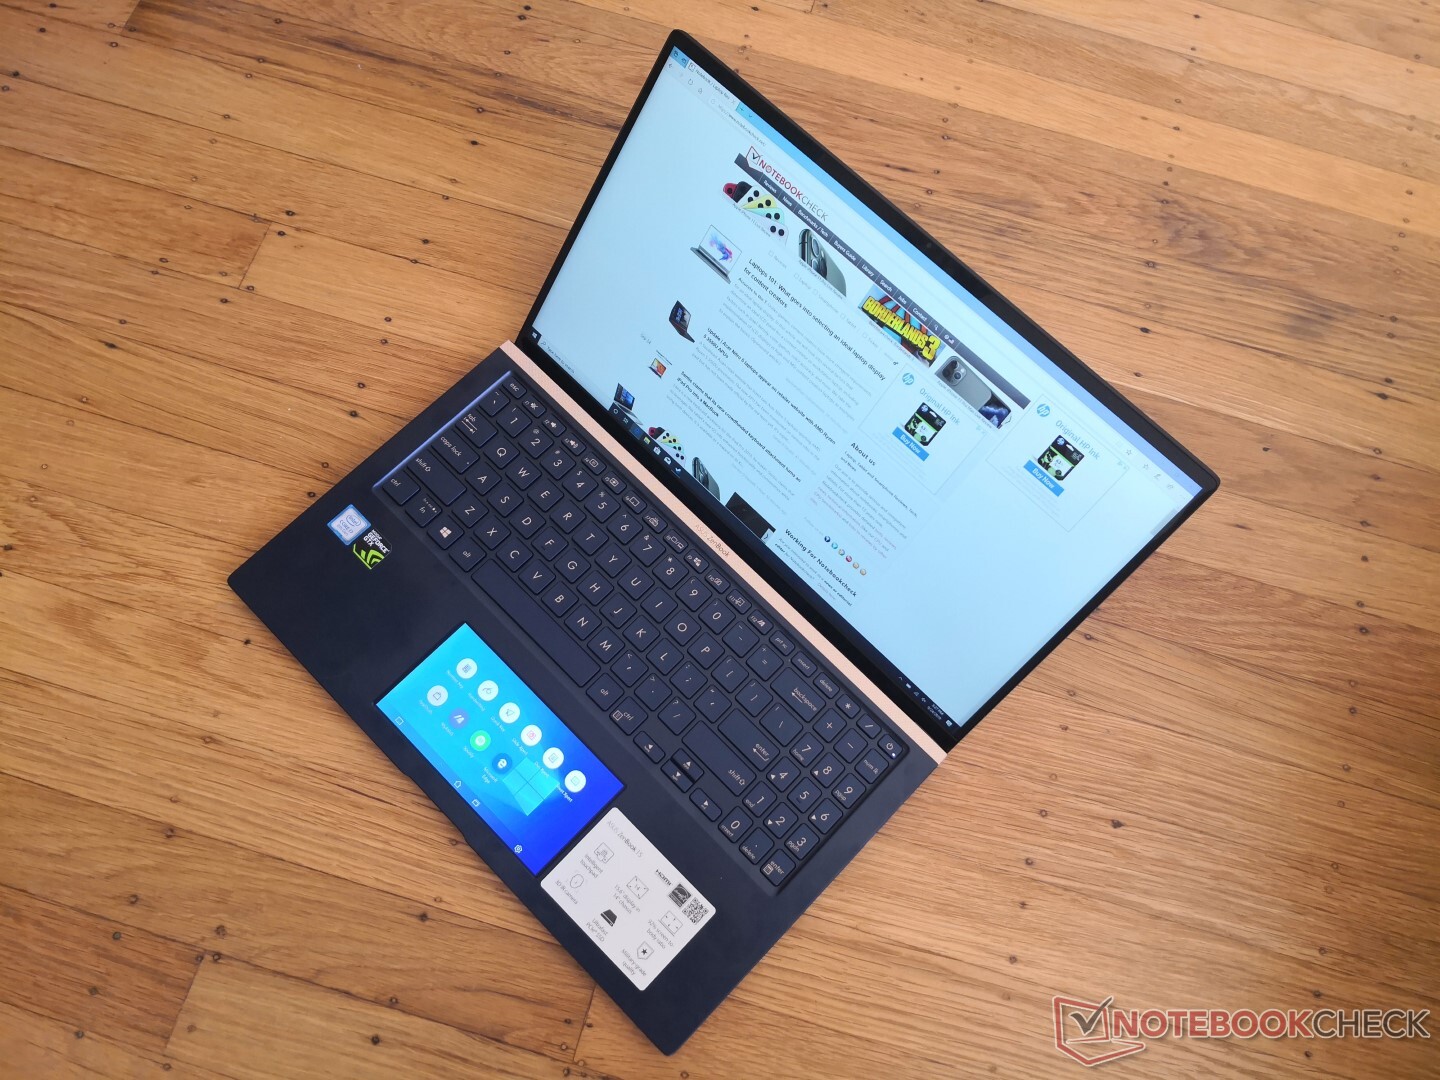
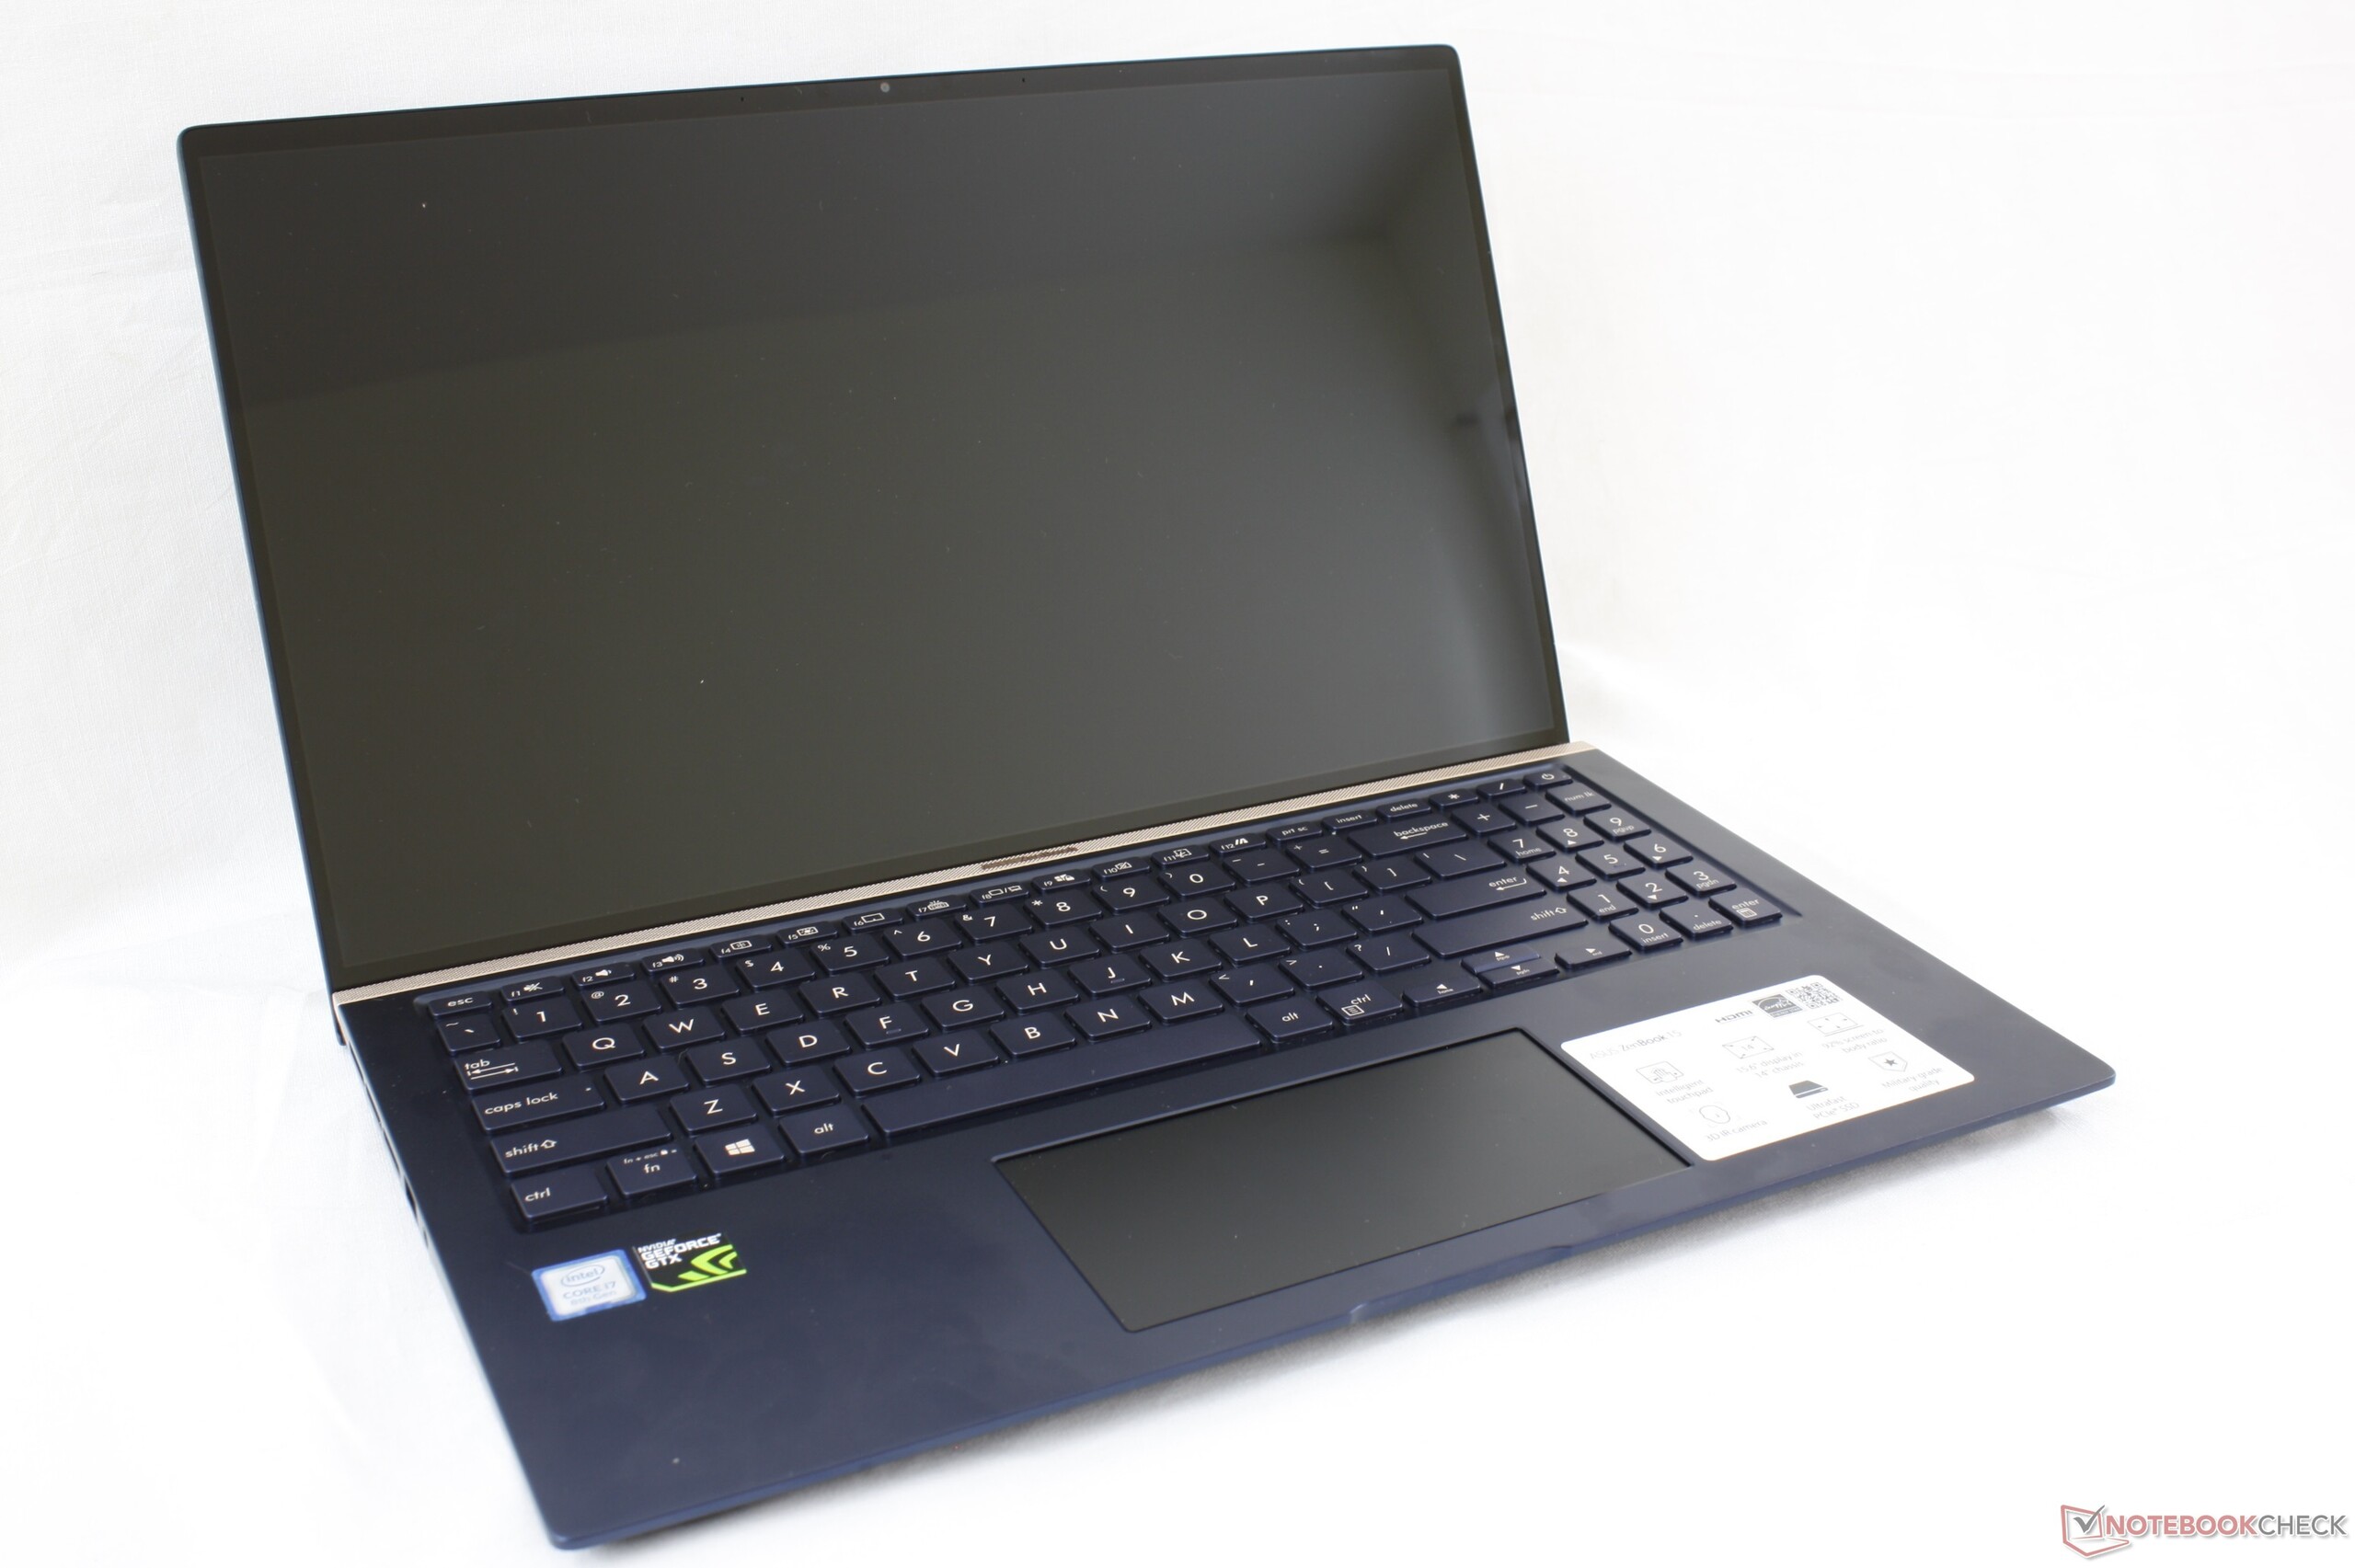
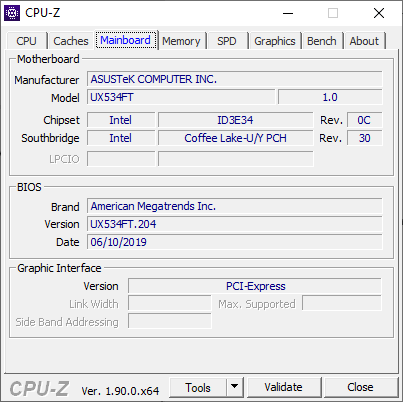
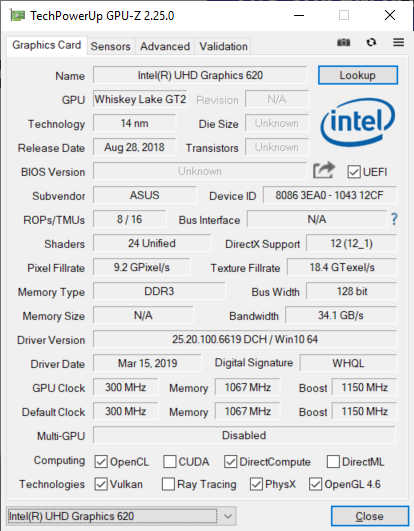
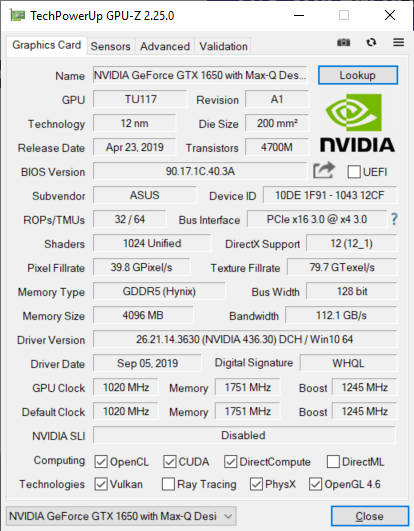
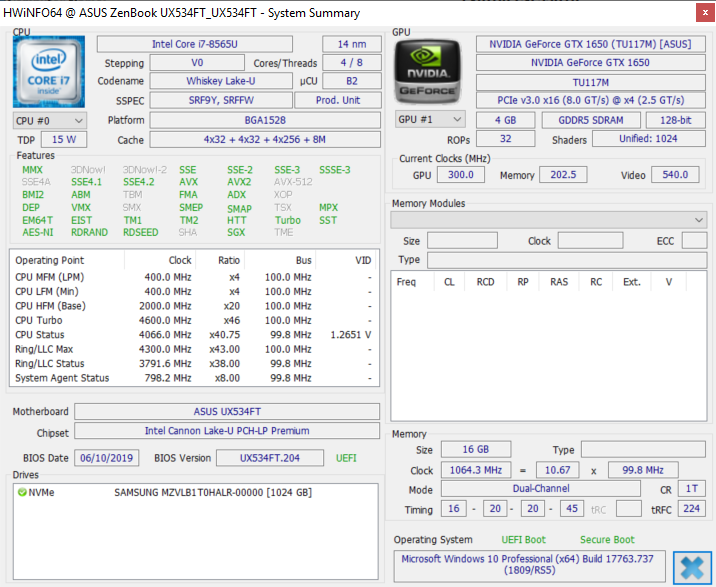
ZenBook 15 UX533 och UX534 har något som de flesta andra Ultrabook-modeller på 15.6 tum inte har: En ULV-CPU från Intel tillsammans med en GeForce GTX 1650 Max-Q GPU. Konkurrenter som Dell XPS 15 eller HP Spectre x360 15 har snabbare processorer från Core H-serien med GTX 1650 som tillval och de är således större och tyngre än ZenBook. Dessa processorer passar bäst för innehållsskapare och digitala artister och är därför oftast mer våld än nöden kräver för surfande, filmströmning och ordbehandling. ZenBook 15 UX533/UX534 är en mittemellanlösning som passar för multimediabruk till vardags samtidigt som den har nästan samma spelförmåga som tidigare nämnda system från Dell och HP, allt i ett mer energieffektivt paket. Då det finns en risk att traditionella bärbara speldatorer hotas av Google Stadia och liknande går ZenBook 15 UX534 istället en bekväm väg mellan Ultrabook och instegsspelmaskin.
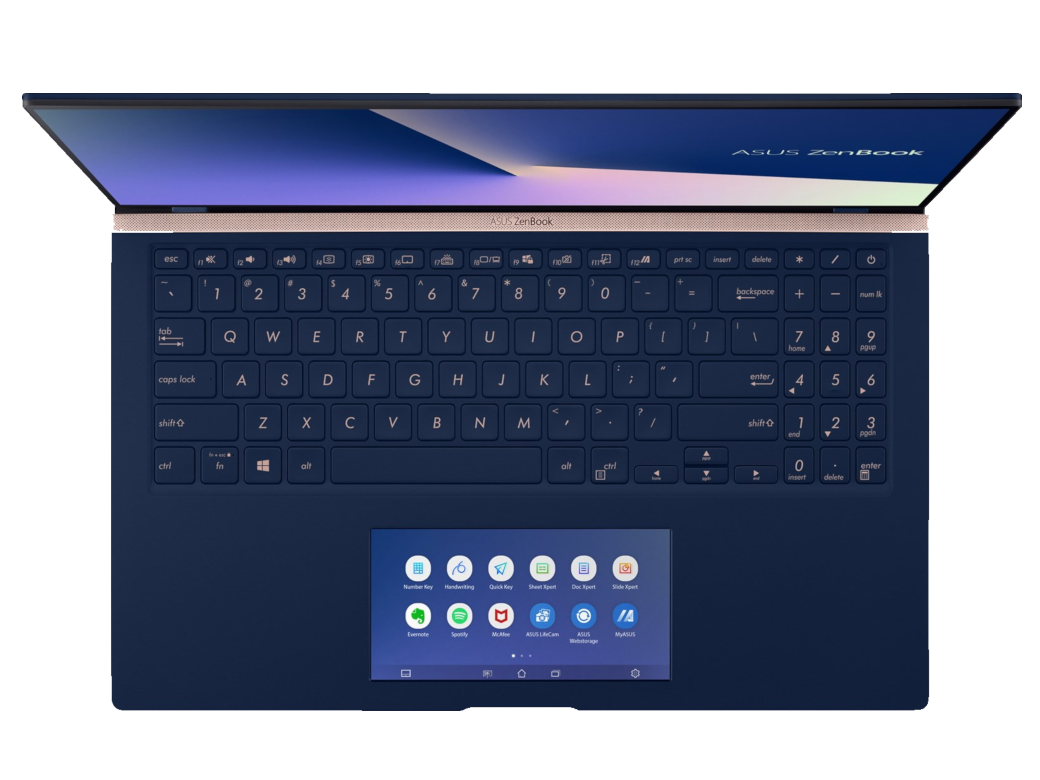
Asus joker är ScreenPad, som kostar 2.000 kronor extra. Om din ZenBook i huvudsak kommer sitta fast hemma eller på ett skrivbord är det istället bättre du investerar de 2.000 kronorna i en extern monitor. Men om du ofta sitter på caféer, flygplatser eller andra ställen utanför kontoret och arbetar med många flikar och fönster samtidigt kan det vara riktigt värt att ha en extra skärm oavsett situation. Kom bara ihåg att ta med dig en extern mus så du kan använda den extra skärmen fullt ut.
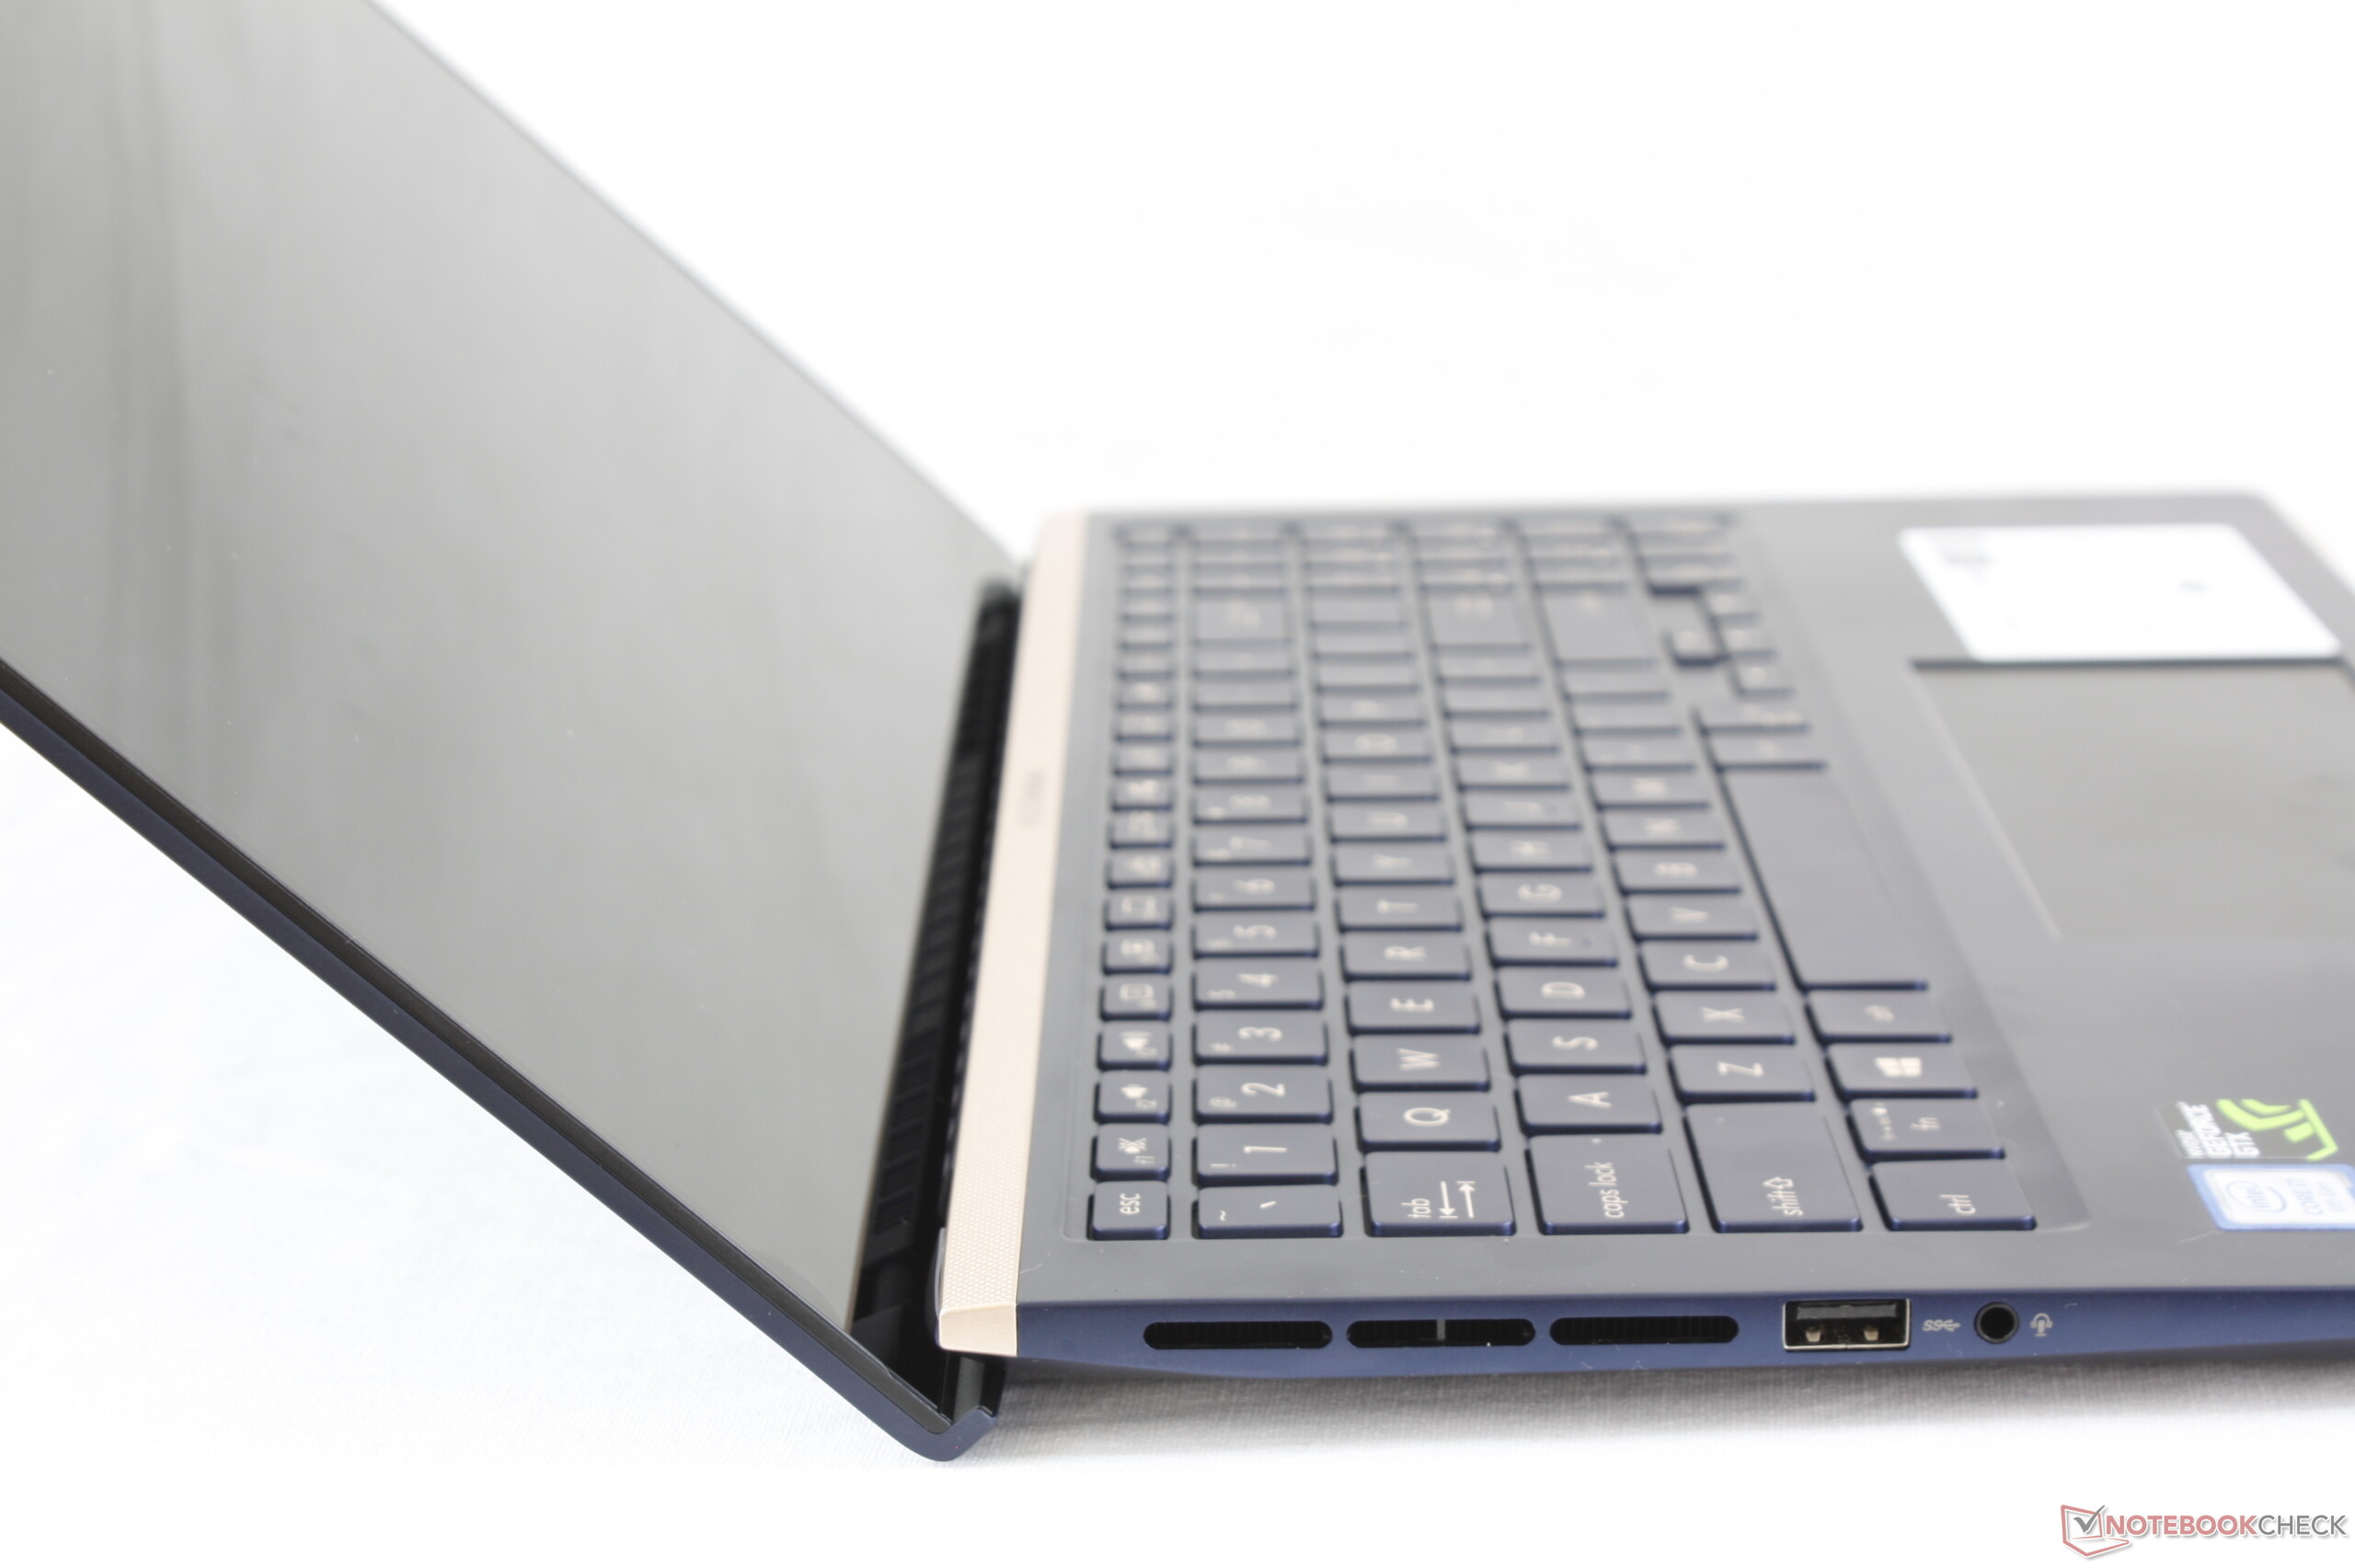
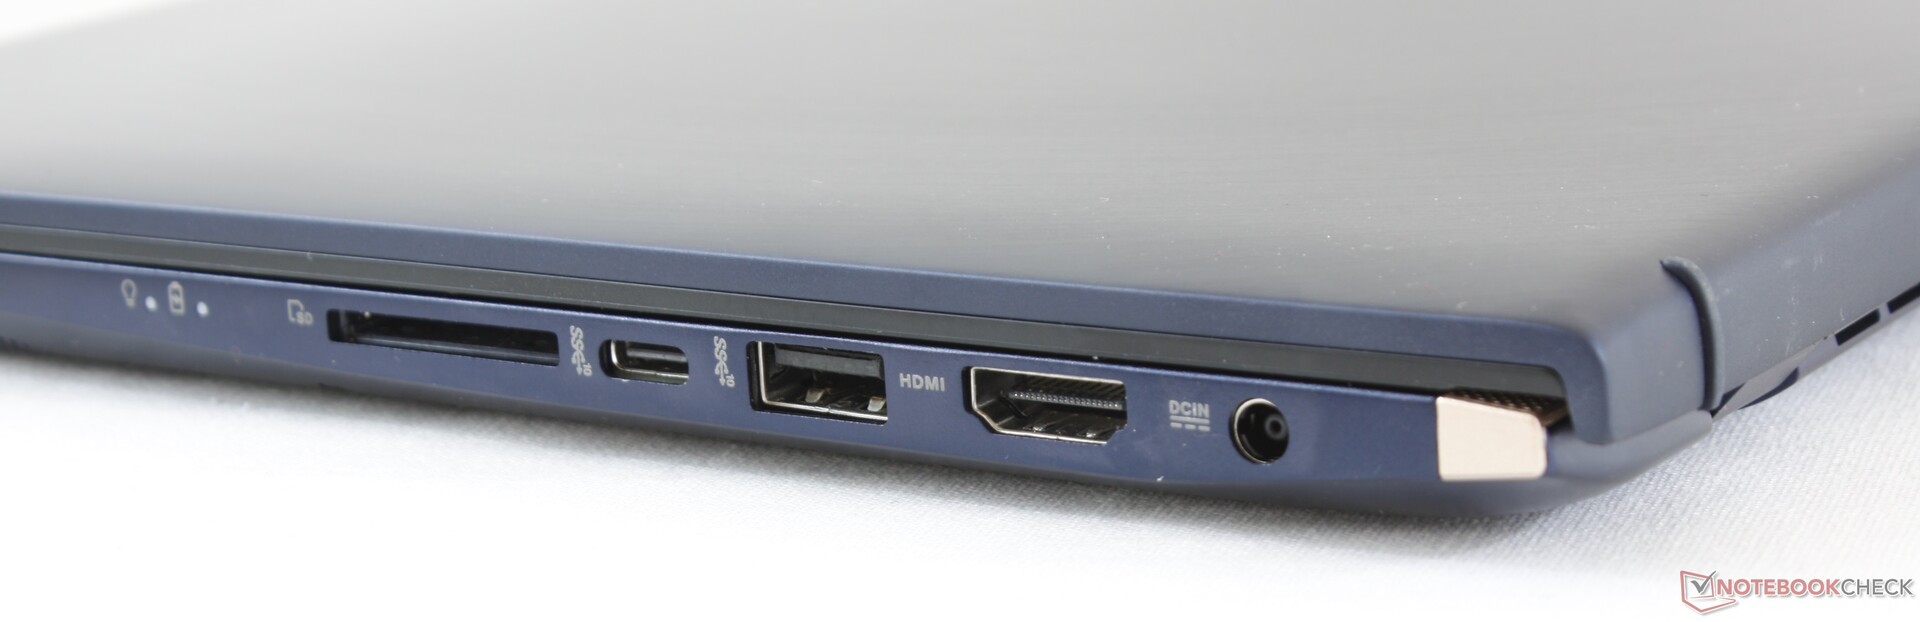
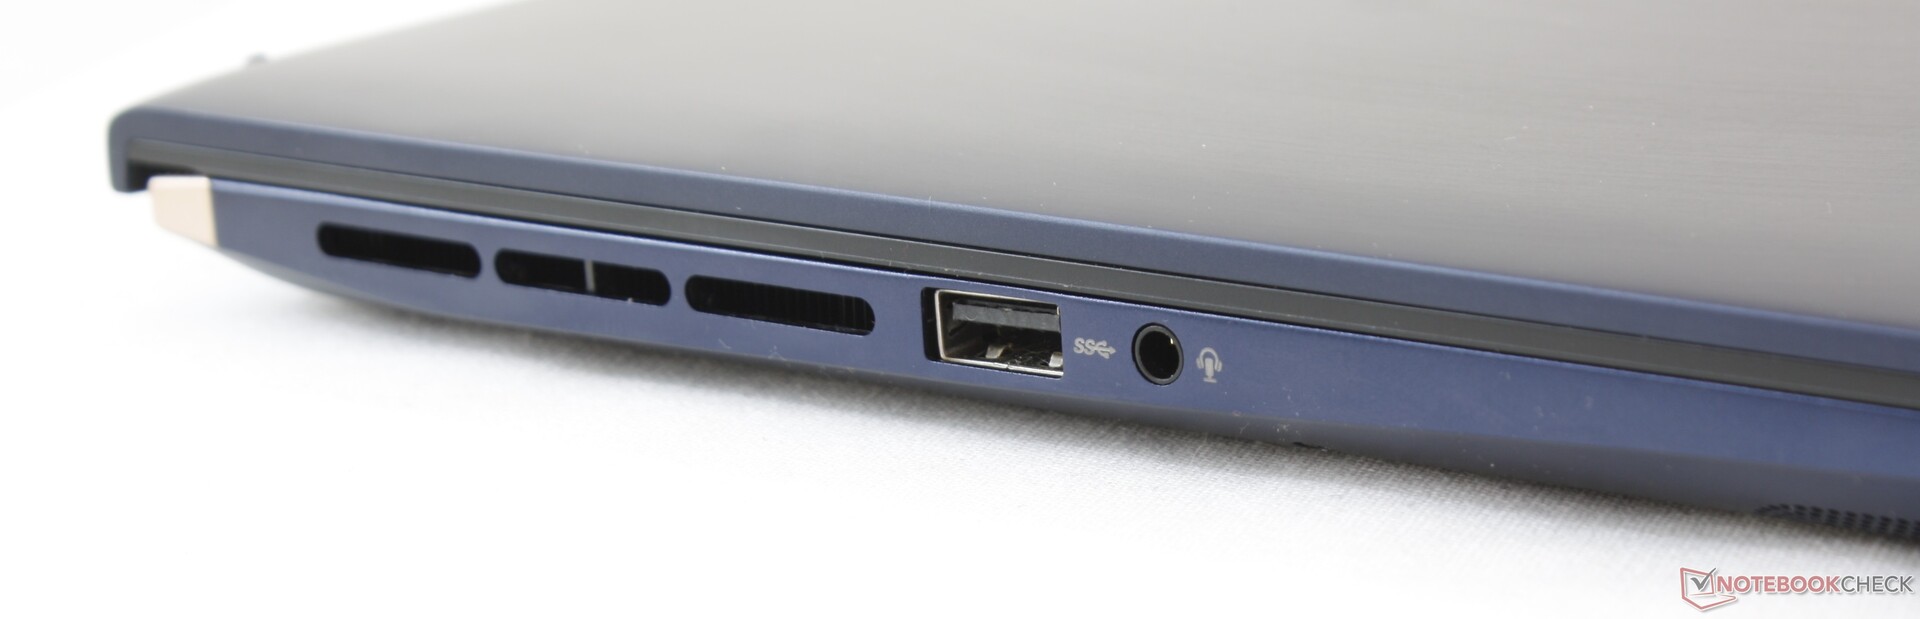
När det kommer till spel är ZenBook 15 UX534 effektivare än de flesta andra Ultrabook-modellerna i sin storleksklass. Du blir utan Thunderbolt 3 och processor från Core H-serien, men om du i huvudsak ska använda din ZenBook till multimediauppspelning, spel eller ordbehandling på resande fot är det möjligt att du inte ens märker detta.
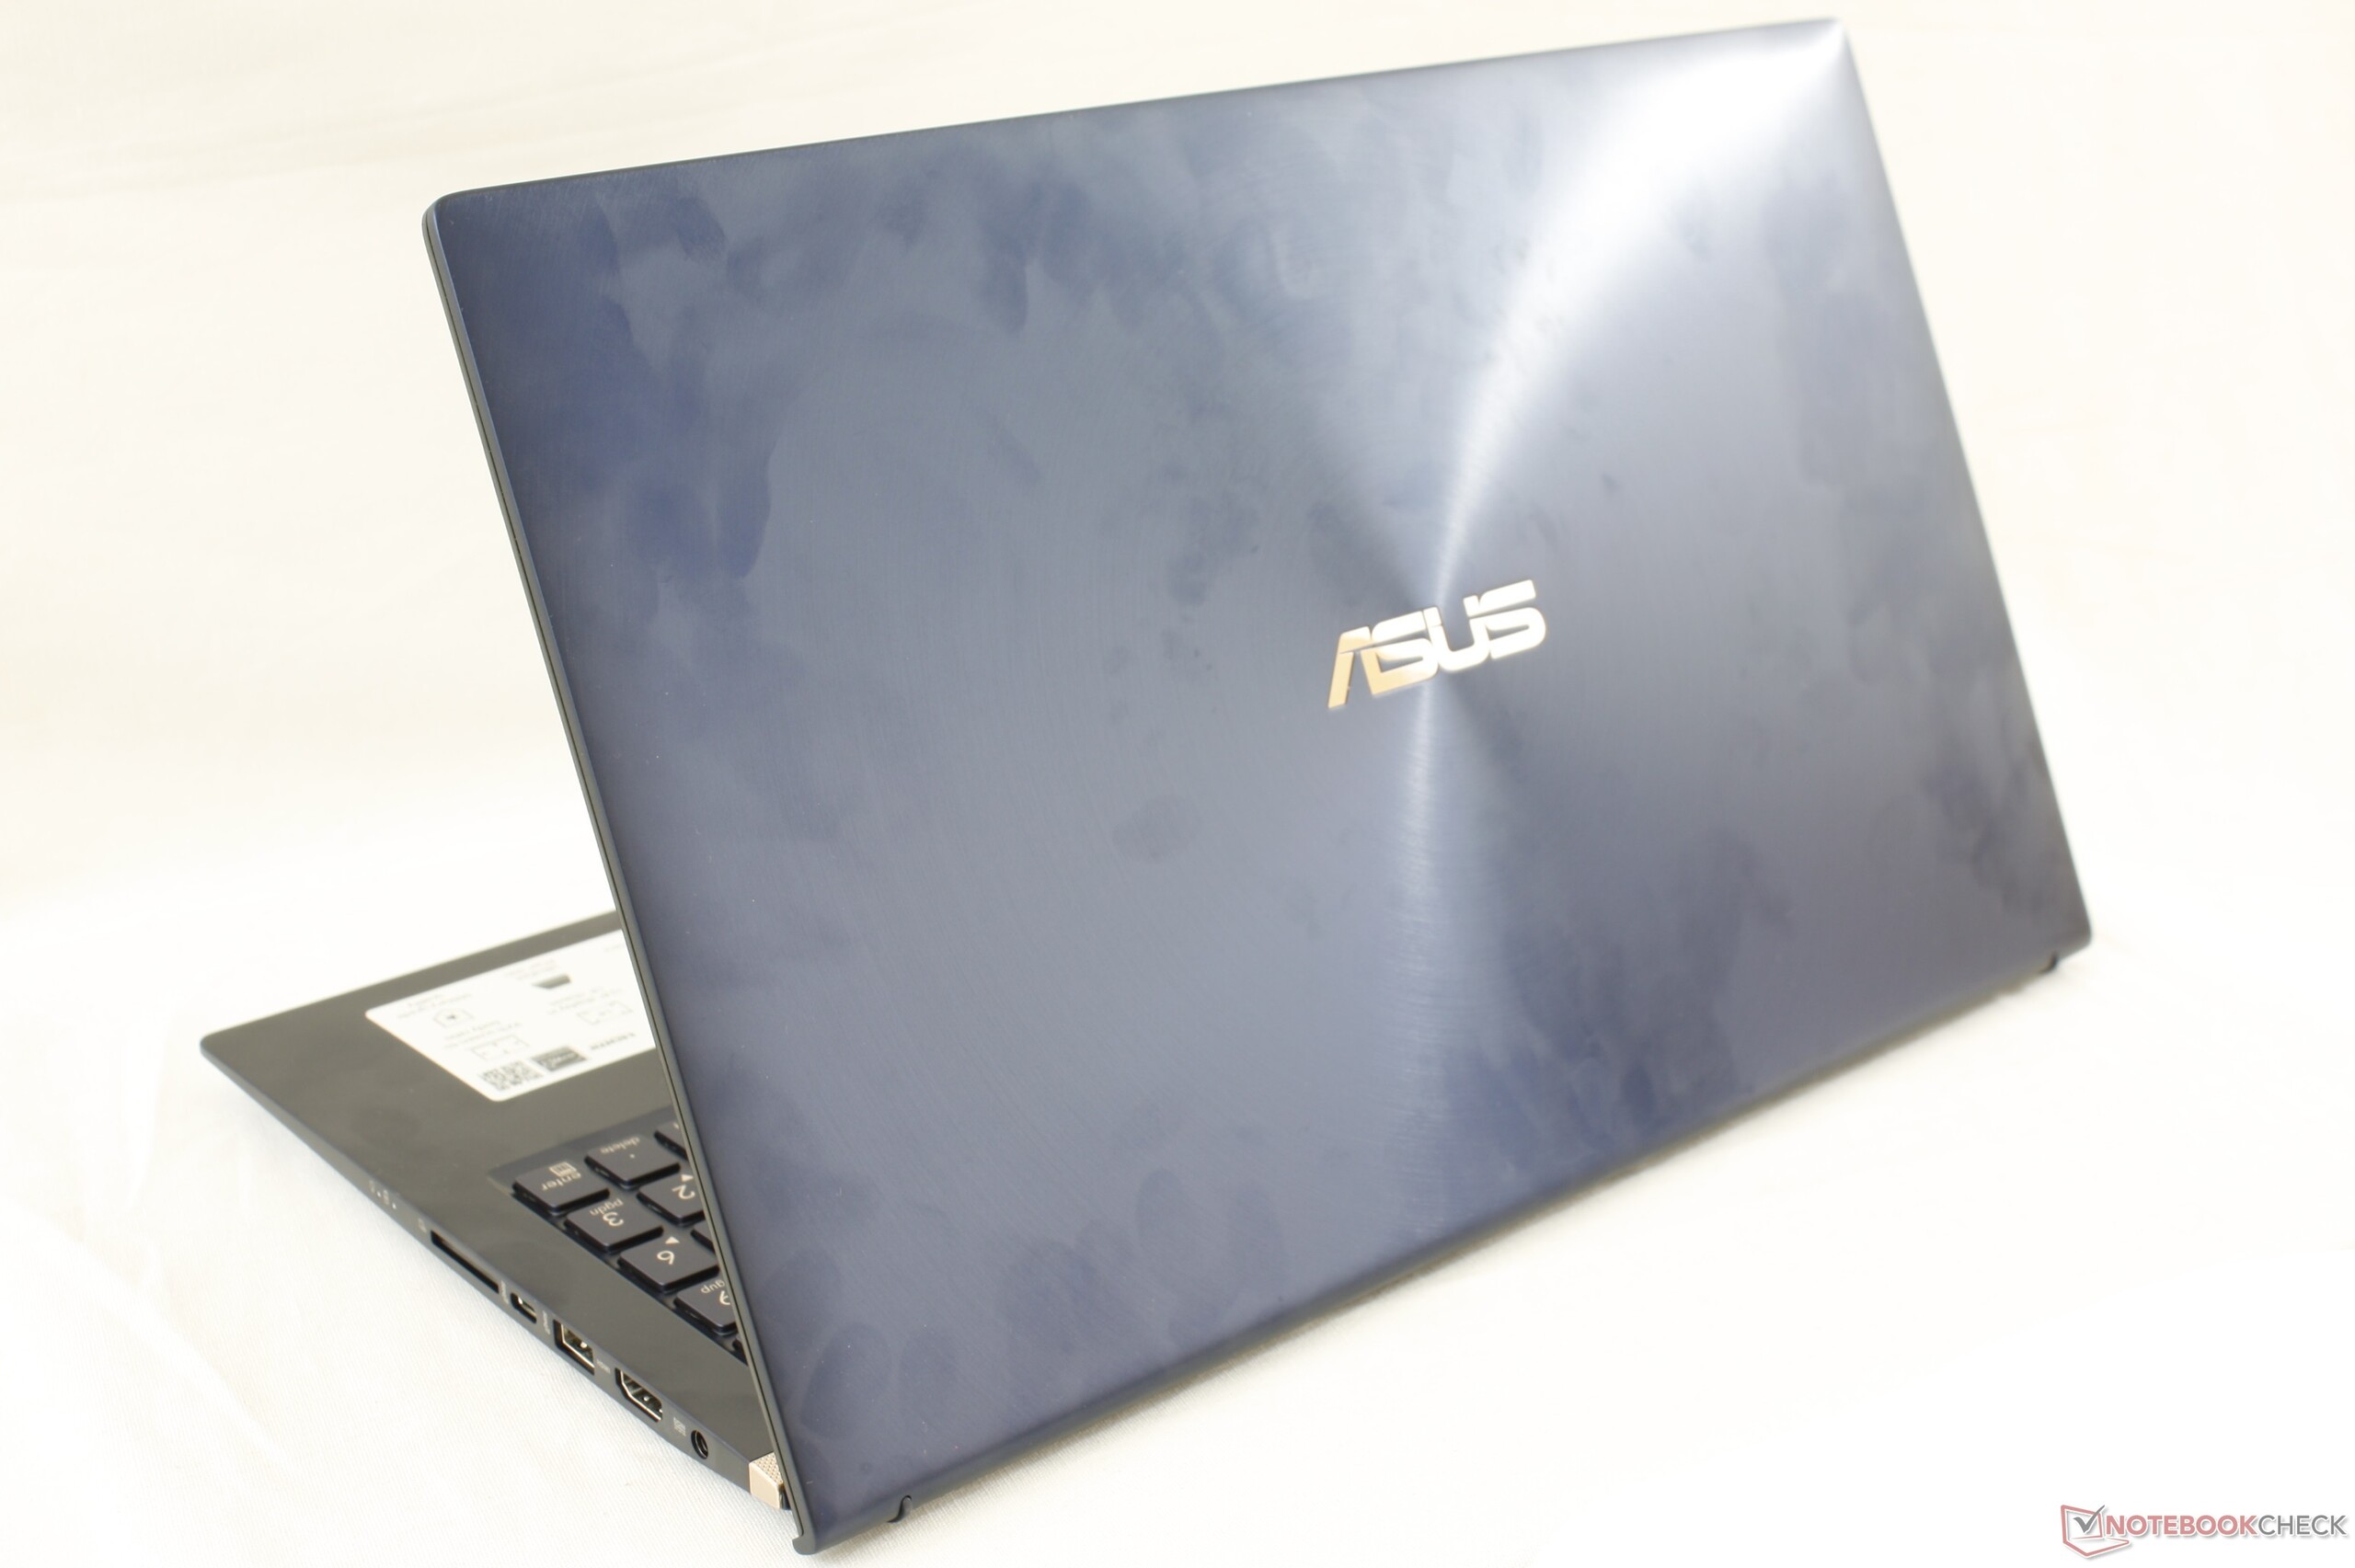
Asus ZenBook 15 UX534FT-DB77
- 09/29/2019 v7 (old)
Allen Ngo
Price comparison
