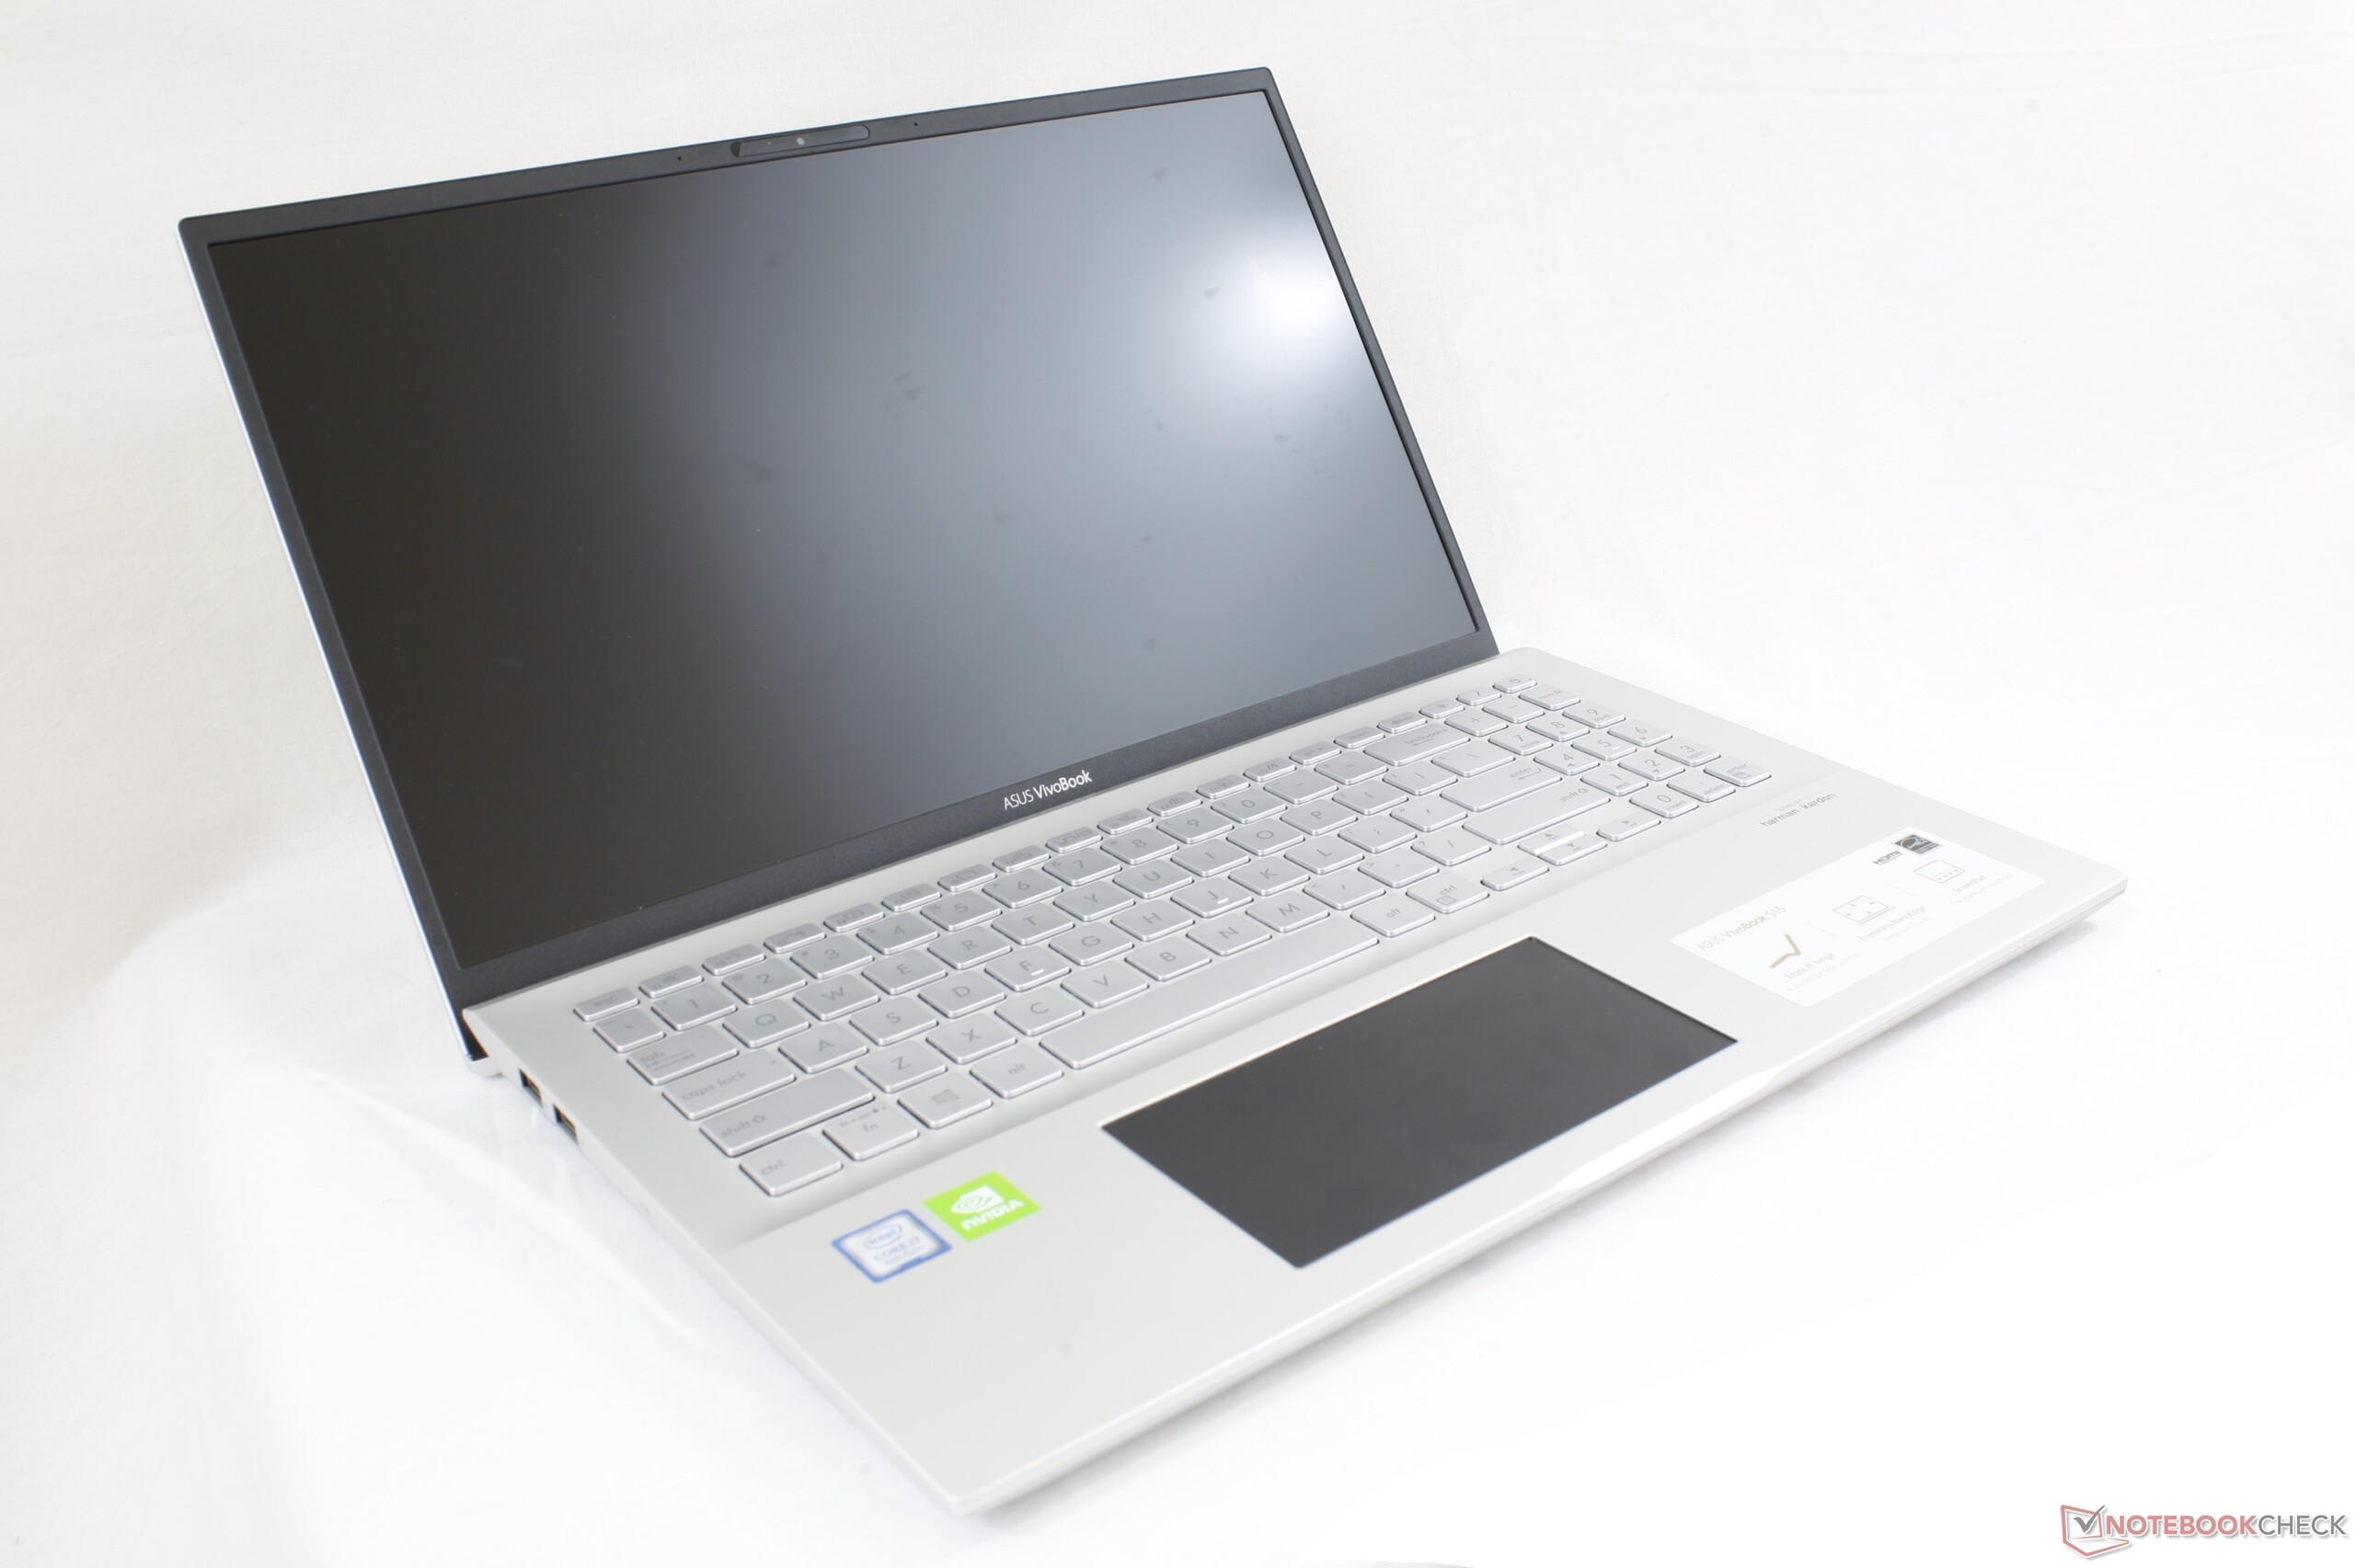
Debut för ScreenPad 2.0: Recension av Asus VivoBook S15 S532FL (Sammanfattning)
| SD Card Reader | |
| average JPG Copy Test (av. of 3 runs) | |
| Dell XPS 15 9570 Core i9 UHD (Toshiba Exceria Pro SDXC 64 GB UHS-II) | |
| Lenovo IdeaPad S540-14API (Toshiba Exceria Pro SDXC 64 GB UHS-II) | |
| Lenovo Ideapad S340-14IWL-81N70056GE (Toshiba Exceria Pro SDXC 64 GB UHS-II) | |
| Asus ZenBook 15 UX533FD (Toshiba Exceria Pro SDXC 64 GB UHS-II) | |
| Lenovo Yoga 530-14ARR-81H9000VGE (Toshiba Exceria Pro SDXC 64 GB UHS-II) | |
| Asus VivoBook S15 S532F (Toshiba Exceria Pro UHS-II) | |
| maximum AS SSD Seq Read Test (1GB) | |
| Dell XPS 15 9570 Core i9 UHD (Toshiba Exceria Pro SDXC 64 GB UHS-II) | |
| Lenovo IdeaPad S540-14API (Toshiba Exceria Pro SDXC 64 GB UHS-II) | |
| Lenovo Ideapad S340-14IWL-81N70056GE (Toshiba Exceria Pro SDXC 64 GB UHS-II) | |
| Asus ZenBook 15 UX533FD (Toshiba Exceria Pro SDXC 64 GB UHS-II) | |
| Lenovo Yoga 530-14ARR-81H9000VGE (Toshiba Exceria Pro SDXC 64 GB UHS-II) | |
| Asus VivoBook S15 S532F (Toshiba Exceria Pro UHS-II) | |
| Networking | |
| iperf3 transmit AX12 | |
| Acer Aspire 5 A515-52G-723L | |
| Asus ZenBook 15 UX533FD | |
| Razer Blade Stealth i7-8565U | |
| Lenovo Ideapad 720S-15IKB 81AC001AGE | |
| Asus VivoBook S15 S532F | |
| iperf3 receive AX12 | |
| Asus ZenBook 15 UX533FD | |
| Razer Blade Stealth i7-8565U | |
| Asus VivoBook S15 S532F | |
| Acer Aspire 5 A515-52G-723L | |
| Lenovo Ideapad 720S-15IKB 81AC001AGE | |
| |||||||||||||||||||||||||
Distribution av ljusstyrkan: 89 %
Mitt på batteriet: 262.3 cd/m²
Kontrast: 610:1 (Svärta: 0.43 cd/m²)
ΔE ColorChecker Calman: 5.81 | ∀{0.5-29.43 Ø4.72}
calibrated: 5.36
ΔE Greyscale Calman: 2.8 | ∀{0.09-98 Ø4.97}
55.6% sRGB (Argyll 1.6.3 3D)
35.2% AdobeRGB 1998 (Argyll 1.6.3 3D)
38.35% AdobeRGB 1998 (Argyll 3D)
55.9% sRGB (Argyll 3D)
37.12% Display P3 (Argyll 3D)
Gamma: 2.15
CCT: 7016 K
| Asus VivoBook S15 S532F LG Philips LP156WFC-SPD1, IPS, 15.6", 1920x1080 | Dell XPS 15 9570 Core i9 UHD LQ156D1, IPS, 15.6", 3840x2160 | HP Envy x360 15-bq102ng Chi Mei CM15E9, IPS, 15.6", 1920x1080 | Asus ZenBook 15 UX533FD BOE07D8, IPS, 15.6", 1920x1080 | Acer Aspire 5 A515-52G-723L BOE NV156FHM-N48, IPS, 15.6", 1920x1080 | Asus VivoBook S15 S530UN-BQ097T LP156WFC-SPD1, IPS LED, 15.6", 1920x1080 | |
|---|---|---|---|---|---|---|
| Display | 99% | 11% | 69% | 7% | 4% | |
| Display P3 Coverage (%) | 37.12 | 79.6 114% | 41.36 11% | 67.2 81% | 40.02 8% | 38.51 4% |
| sRGB Coverage (%) | 55.9 | 98.4 76% | 62.2 11% | 88.4 58% | 58.5 5% | 57.9 4% |
| AdobeRGB 1998 Coverage (%) | 38.35 | 79.7 108% | 42.74 11% | 64.6 68% | 41.34 8% | 39.79 4% |
| Response Times | -72% | -35% | -68% | -60% | -34% | |
| Response Time Grey 50% / Grey 80% * (ms) | 24.8 ? | 52.4 ? -111% | 40 ? -61% | 45 ? -81% | 45 ? -81% | 38.8 ? -56% |
| Response Time Black / White * (ms) | 24 ? | 31.6 ? -32% | 26 ? -8% | 37 ? -54% | 33 ? -38% | 26.8 ? -12% |
| PWM Frequency (Hz) | 1000 ? | 25000 ? | 250 ? | |||
| Screen | 28% | 34% | 31% | 19% | 18% | |
| Brightness middle (cd/m²) | 262.3 | 451.9 72% | 221 -16% | 311 19% | 278 6% | 262 0% |
| Brightness (cd/m²) | 250 | 414 66% | 207 -17% | 303 21% | 271 8% | 256 2% |
| Brightness Distribution (%) | 89 | 81 -9% | 87 -2% | 81 -9% | 89 0% | 90 1% |
| Black Level * (cd/m²) | 0.43 | 0.36 16% | 0.15 65% | 0.24 44% | 0.26 40% | 0.21 51% |
| Contrast (:1) | 610 | 1255 106% | 1473 141% | 1296 112% | 1069 75% | 1248 105% |
| Colorchecker dE 2000 * | 5.81 | 5.62 3% | 4.35 25% | 5.1 12% | 4.73 19% | 5.8 -0% |
| Colorchecker dE 2000 max. * | 14.7 | 19.1 -30% | 8.98 39% | 8.91 39% | 8.38 43% | 14.3 3% |
| Colorchecker dE 2000 calibrated * | 5.36 | 2.69 50% | 2.48 54% | 5.17 4% | 4.6 14% | |
| Greyscale dE 2000 * | 2.8 | 6.9 -146% | 3.09 -10% | 4.93 -76% | 2.59 7% | 2.5 11% |
| Gamma | 2.15 102% | 2.2 100% | 2.23 99% | 2.44 90% | 2.38 92% | 1.99 111% |
| CCT | 7016 93% | 6254 104% | 6068 107% | 7641 85% | 6160 106% | 6528 100% |
| Color Space (Percent of AdobeRGB 1998) (%) | 35.2 | 71.8 104% | 56 59% | 58 65% | 36 2% | 36.6 4% |
| Color Space (Percent of sRGB) (%) | 55.6 | 98.5 77% | 86 55% | 88 58% | 58 4% | 57.6 4% |
| Totalt genomsnitt (program/inställningar) | 18% /
29% | 3% /
20% | 11% /
26% | -11% /
7% | -4% /
9% |
* ... mindre är bättre
Visa svarstider
| ↔ Svarstid svart till vitt | ||
|---|---|---|
| 24 ms ... stiga ↗ och falla ↘ kombinerat | ↗ 14 ms stiga | 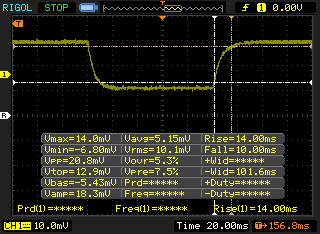 |
| ↘ 10 ms hösten | ||
| Skärmen visar bra svarsfrekvens i våra tester, men kan vara för långsam för konkurrenskraftiga spelare. I jämförelse sträcker sig alla testade enheter från 0.1 (minst) till 240 (maximalt) ms. » 54 % av alla enheter är bättre. Detta innebär att den uppmätta svarstiden är sämre än genomsnittet av alla testade enheter (19.8 ms). | ||
| ↔ Svarstid 50 % grått till 80 % grått | ||
| 24.8 ms ... stiga ↗ och falla ↘ kombinerat | ↗ 12.8 ms stiga | 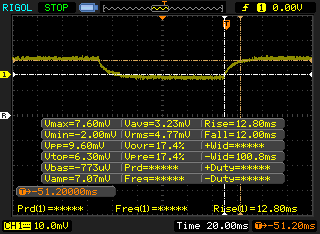 |
| ↘ 12 ms hösten | ||
| Skärmen visar bra svarsfrekvens i våra tester, men kan vara för långsam för konkurrenskraftiga spelare. I jämförelse sträcker sig alla testade enheter från 0.165 (minst) till 636 (maximalt) ms. » 35 % av alla enheter är bättre. Det betyder att den uppmätta svarstiden är bättre än genomsnittet av alla testade enheter (31 ms). | ||
Skärmflimmer / PWM (Puls-Width Modulation)
| Skärmflimmer / PWM upptäcktes inte |  | ||
Som jämförelse: 52 % av alla testade enheter använder inte PWM för att dämpa skärmen. Om PWM upptäcktes mättes ett medelvärde av 7781 (minst: 5 - maximum: 343500) Hz. | |||
| Cinebench R15 | |
| CPU Single 64Bit | |
| Asus ZenBook 15 UX533FD | |
| Genomsnitt Intel Core i7-8565U (138.3 - 193, n=51) | |
| HP Omen 15-dc1020ng | |
| Lenovo Yoga C930-13IKB 81C4 | |
| Asus VivoBook S15 S532F | |
| Lenovo ThinkPad 13 20J1005TPB | |
| Lenovo IdeaPad S540-14API | |
| Lenovo Yoga C930-13IKB | |
| Lenovo Yoga 530-14ARR-81H9000VGE | |
| CPU Multi 64Bit | |
| Asus ZenBook 15 UX533FD | |
| HP Omen 15-dc1020ng | |
| Asus VivoBook S15 S532F | |
| Lenovo IdeaPad S540-14API | |
| Lenovo Yoga 530-14ARR-81H9000VGE | |
| Lenovo Yoga C930-13IKB 81C4 | |
| Lenovo Yoga C930-13IKB | |
| Genomsnitt Intel Core i7-8565U (452 - 815, n=52) | |
| Lenovo ThinkPad 13 20J1005TPB | |
| PCMark 10 | |
| Score | |
| Dell XPS 15 9570 Core i9 UHD | |
| Asus ZenBook 15 UX533FD | |
| Acer Aspire 5 A515-52G-723L | |
| Asus VivoBook S15 S532F | |
| Lenovo Yoga C930-13IKB 81C4 | |
| Asus VivoBook S15 S530UN-BQ097T | |
| Essentials | |
| Lenovo Yoga C930-13IKB 81C4 | |
| Dell XPS 15 9570 Core i9 UHD | |
| Asus VivoBook S15 S532F | |
| Asus ZenBook 15 UX533FD | |
| Acer Aspire 5 A515-52G-723L | |
| Asus VivoBook S15 S530UN-BQ097T | |
| Productivity | |
| Dell XPS 15 9570 Core i9 UHD | |
| Acer Aspire 5 A515-52G-723L | |
| Asus ZenBook 15 UX533FD | |
| Lenovo Yoga C930-13IKB 81C4 | |
| Asus VivoBook S15 S532F | |
| Asus VivoBook S15 S530UN-BQ097T | |
| Digital Content Creation | |
| Dell XPS 15 9570 Core i9 UHD | |
| Asus ZenBook 15 UX533FD | |
| Asus VivoBook S15 S532F | |
| Acer Aspire 5 A515-52G-723L | |
| Asus VivoBook S15 S530UN-BQ097T | |
| Lenovo Yoga C930-13IKB 81C4 | |
| PCMark 8 | |
| Home Score Accelerated v2 | |
| Acer Aspire 5 A515-52G-723L | |
| Asus ZenBook 15 UX533FD | |
| Dell XPS 15 9570 Core i9 UHD | |
| Asus VivoBook S15 S530UN-BQ097T | |
| Lenovo Yoga C930-13IKB 81C4 | |
| Asus VivoBook S15 S532F | |
| Work Score Accelerated v2 | |
| Asus ZenBook 15 UX533FD | |
| Acer Aspire 5 A515-52G-723L | |
| Lenovo Yoga C930-13IKB 81C4 | |
| Asus VivoBook S15 S530UN-BQ097T | |
| Asus VivoBook S15 S532F | |
| Dell XPS 15 9570 Core i9 UHD | |
| PCMark 8 Home Score Accelerated v2 | 3575 poäng | |
| PCMark 8 Work Score Accelerated v2 | 4946 poäng | |
| PCMark 10 Score | 4148 poäng | |
Hjälp | ||
| Asus VivoBook S15 S532F WDC PC SN520 SDAPNUW-256G | Dell XPS 15 9570 Core i9 UHD Samsung SSD PM981 MZVLB1T0HALR | HP Envy x360 15-bq102ng Samsung PM961 MZVLW256HEHP | Lenovo Ideapad 720S-15IKB 81AC001AGE Samsung SSD PM981 MZVLB512HAJQ | Acer Aspire 5 A515-52G-723L WDC PC SN520 SDAPNUW-512G | |
|---|---|---|---|---|---|
| AS SSD | 71% | 1% | 102% | 34% | |
| Seq Read (MB/s) | 1147 | 1320 15% | 2465 115% | 2469 115% | 1557 36% |
| Seq Write (MB/s) | 752 | 1500 99% | 1318 75% | 1991 165% | 1237 64% |
| 4K Read (MB/s) | 41.52 | 30.73 -26% | 42.97 3% | 54.3 31% | 42.56 3% |
| 4K Write (MB/s) | 149.7 | 94.4 -37% | 81.9 -45% | 99.8 -33% | 127.2 -15% |
| 4K-64 Read (MB/s) | 605 | 1453 140% | 1025 69% | 1823 201% | 1034 71% |
| 4K-64 Write (MB/s) | 453.2 | 1815 300% | 338.6 -25% | 1282 183% | 1186 162% |
| Access Time Read * (ms) | 0.073 | 0.061 16% | 0.077 -5% | 0.042 42% | 0.077 -5% |
| Access Time Write * (ms) | 0.025 | 0.044 -76% | 0.046 -84% | 0.039 -56% | 0.028 -12% |
| Score Read (Points) | 761 | 1616 112% | 1314 73% | 2125 179% | 1233 62% |
| Score Write (Points) | 678 | 2059 204% | 552 -19% | 1581 133% | 1437 112% |
| Score Total (Points) | 1821 | 4507 148% | 2488 37% | 4771 162% | 3291 81% |
| Copy ISO MB/s (MB/s) | 1093 | 2577 136% | 700 -36% | 1313 20% | |
| Copy Program MB/s (MB/s) | 775 | 515 -34% | 167.2 -78% | 334.6 -57% | |
| Copy Game MB/s (MB/s) | 1196 | 1120 -6% | 370.4 -69% | 684 -43% |
* ... mindre är bättre

| 3DMark | |
| 1920x1080 Fire Strike Graphics | |
| HP Omen 15-dc1020ng | |
| Dell XPS 15 9570 Core i9 UHD | |
| Asus ZenBook 15 UX533FD | |
| Asus Zenbook UX510UW-CN044T | |
| Razer Blade Stealth i7-8565U | |
| Asus VivoBook S15 S532F | |
| Genomsnitt NVIDIA GeForce MX250 (2939 - 3885, n=29) | |
| Acer Swift 3 SF314-55G-768V | |
| Lenovo Ideapad S340-14IWL-81N70056GE | |
| HP Pavilion 15-cs0003ng | |
| HP Envy x360 15-bq102ng | |
| Lenovo Yoga C930-13IKB | |
| 2560x1440 Time Spy Graphics | |
| HP Omen 15-dc1020ng | |
| Razer Blade Stealth i7-8565U | |
| Asus Zenbook UX510UW-CN044T | |
| Asus VivoBook S15 S532F | |
| Genomsnitt NVIDIA GeForce MX250 (881 - 1169, n=22) | |
| HP Envy x360 15-bq102ng | |
| Lenovo Yoga C930-13IKB | |
| 1920x1080 Fire Strike Score | |
| HP Omen 15-dc1020ng | |
| Dell XPS 15 9570 Core i9 UHD | |
| Asus ZenBook 15 UX533FD | |
| Asus Zenbook UX510UW-CN044T | |
| Razer Blade Stealth i7-8565U | |
| Asus VivoBook S15 S532F | |
| Genomsnitt NVIDIA GeForce MX250 (2726 - 3567, n=28) | |
| Acer Swift 3 SF314-55G-768V | |
| Lenovo Ideapad S340-14IWL-81N70056GE | |
| HP Pavilion 15-cs0003ng | |
| HP Envy x360 15-bq102ng | |
| Lenovo Yoga C930-13IKB | |
| 3DMark 11 | |
| 1280x720 Performance GPU | |
| HP Omen 15-dc1020ng | |
| Dell XPS 15 9570 Core i9 UHD | |
| Asus ZenBook 15 UX533FD | |
| Razer Blade Stealth i7-8565U | |
| Asus Zenbook UX510UW-CN044T | |
| Asus VivoBook S15 S532F | |
| Genomsnitt NVIDIA GeForce MX250 (3585 - 4942, n=29) | |
| Acer Swift 3 SF314-55G-768V | |
| Lenovo Ideapad S340-14IWL-81N70056GE | |
| HP Envy x360 15-bq102ng | |
| HP Pavilion 15-cs0003ng | |
| Lenovo Yoga C930-13IKB 81C4 | |
| Lenovo Yoga C930-13IKB | |
| 1280x720 Performance Combined | |
| Dell XPS 15 9570 Core i9 UHD | |
| HP Omen 15-dc1020ng | |
| Asus ZenBook 15 UX533FD | |
| Asus Zenbook UX510UW-CN044T | |
| Razer Blade Stealth i7-8565U | |
| Asus VivoBook S15 S532F | |
| Genomsnitt NVIDIA GeForce MX250 (3532 - 4638, n=29) | |
| Acer Swift 3 SF314-55G-768V | |
| Lenovo Ideapad S340-14IWL-81N70056GE | |
| HP Pavilion 15-cs0003ng | |
| HP Envy x360 15-bq102ng | |
| Lenovo Yoga C930-13IKB 81C4 | |
| Lenovo Yoga C930-13IKB | |
| 3DMark 11 Performance | 4946 poäng | |
| 3DMark Cloud Gate Standard Score | 12992 poäng | |
| 3DMark Fire Strike Score | 3308 poäng | |
| 3DMark Time Spy Score | 1223 poäng | |
Hjälp | ||
| The Witcher 3 - 1920x1080 High Graphics & Postprocessing (Nvidia HairWorks Off) | |
| HP Omen 15-dc1020ng | |
| Dell XPS 15 9570 Core i9 UHD | |
| Asus ZenBook 15 UX533FD | |
| Razer Blade Stealth i7-8565U | |
| Asus GL552VW-DK725T | |
| Genomsnitt NVIDIA GeForce MX250 (16.3 - 23.1, n=27) | |
| Asus VivoBook S15 S532F | |
| Lenovo IdeaPad S540-14API | |
| Lenovo Yoga 530-14ARR-81H9000VGE | |
| låg | med. | hög | ultra | |
|---|---|---|---|---|
| BioShock Infinite (2013) | 191.8 | 109.2 | 88.3 | 33.7 |
| The Witcher 3 (2015) | 66.9 | 36.8 | 19.1 | 10.7 |
| Shadow of the Tomb Raider (2018) | 24 | 7 |
| Asus VivoBook S15 S532F GeForce MX250, i7-8565U, WDC PC SN520 SDAPNUW-256G | Dell XPS 15 9570 Core i9 UHD GeForce GTX 1050 Ti Max-Q, i9-8950HK, Samsung SSD PM981 MZVLB1T0HALR | HP Envy x360 15-bq102ng Vega 8, R5 2500U, Samsung PM961 MZVLW256HEHP | Lenovo Ideapad 720S-15IKB 81AC001AGE GeForce GTX 1050 Ti Max-Q, i7-7700HQ, Samsung SSD PM981 MZVLB512HAJQ | Asus ZenBook 15 UX533FD GeForce GTX 1050 Max-Q, i7-8565U, WDC PC SN520 SDAPNUW-512G | Acer Aspire 5 A515-52G-723L GeForce MX250, i7-8565U, WDC PC SN520 SDAPNUW-512G | |
|---|---|---|---|---|---|---|
| Noise | -3% | -2% | -3% | -5% | -4% | |
| av / miljö * (dB) | 28 | 28.2 -1% | 30.13 -8% | 30.3 -8% | 30.5 -9% | 29.9 -7% |
| Idle Minimum * (dB) | 28 | 28.5 -2% | 30.13 -8% | 30.3 -8% | 30.5 -9% | 29.9 -7% |
| Idle Average * (dB) | 28 | 28.6 -2% | 30.13 -8% | 30.3 -8% | 30.5 -9% | 29.9 -7% |
| Idle Maximum * (dB) | 30 | 28.8 4% | 30.13 -0% | 30.3 -1% | 30.5 -2% | 29.9 -0% |
| Load Average * (dB) | 41.4 | 36.2 13% | 38.8 6% | 39.3 5% | 40.8 1% | 41.7 -1% |
| Witcher 3 ultra * (dB) | 41.5 | 47.6 -15% | ||||
| Load Maximum * (dB) | 41.5 | 47.6 -15% | 38.8 7% | 39.6 5% | 41.8 -1% | 41.7 -0% |
* ... mindre är bättre
Ljudnivå
| Låg belastning |
| 28 / 28 / 30 dB(A) |
| Hög belastning |
| 41.4 / 41.5 dB(A) |
 | ||
30 dB tyst 40 dB(A) hörbar 50 dB(A) högt ljud |
||
min: | ||
(-) Den maximala temperaturen på ovansidan är 45.4 °C / 114 F, jämfört med genomsnittet av 36.8 °C / 98 F , allt från 21 till 71 °C för klassen Multimedia.
(±) Botten värms upp till maximalt 40.8 °C / 105 F, jämfört med genomsnittet av 39.1 °C / 102 F
(+) Vid tomgångsbruk är medeltemperaturen för ovansidan 28.6 °C / 83 F, jämfört med enhetsgenomsnittet på 31.3 °C / ### class_avg_f### F.
(±) När du spelar The Witcher 3 är medeltemperaturen för ovansidan 35.6 °C / 96 F, jämfört med enhetsgenomsnittet på 31.3 °C / ## #class_avg_f### F.
(+) Handledsstöden och pekplattan når maximal hudtemperatur (32 °C / 89.6 F) och är därför inte varma.
(-) Medeltemperaturen för handledsstödsområdet på liknande enheter var 28.7 °C / 83.7 F (-3.3 °C / -5.9 F).
Asus VivoBook S15 S532F ljudanalys
(±) | högtalarljudstyrkan är genomsnittlig men bra (78.7 dB)
Bas 100 - 315 Hz
(±) | reducerad bas - i genomsnitt 12.3% lägre än medianen
(±) | linjäriteten för basen är genomsnittlig (11.9% delta till föregående frekvens)
Mellan 400 - 2000 Hz
(+) | balanserad mellan - endast 3.2% från medianen
(±) | linjäriteten för mids är genomsnittlig (8% delta till föregående frekvens)
Högsta 2 - 16 kHz
(+) | balanserade toppar - endast 2.5% från medianen
(±) | linjäriteten för toppar är genomsnittlig (9.4% delta till föregående frekvens)
Totalt 100 - 16 000 Hz
(±) | linjäriteten för det totala ljudet är genomsnittlig (18.9% skillnad mot median)
Jämfört med samma klass
» 59% av alla testade enheter i den här klassen var bättre, 7% liknande, 33% sämre
» Den bästa hade ett delta på 5%, genomsnittet var 17%, sämst var 45%
Jämfört med alla testade enheter
» 44% av alla testade enheter var bättre, 8% liknande, 48% sämre
» Den bästa hade ett delta på 4%, genomsnittet var 24%, sämst var 134%
Apple MacBook 12 (Early 2016) 1.1 GHz ljudanalys
(+) | högtalare kan spela relativt högt (83.6 dB)
Bas 100 - 315 Hz
(±) | reducerad bas - i genomsnitt 11.3% lägre än medianen
(±) | linjäriteten för basen är genomsnittlig (14.2% delta till föregående frekvens)
Mellan 400 - 2000 Hz
(+) | balanserad mellan - endast 2.4% från medianen
(+) | mids är linjära (5.5% delta till föregående frekvens)
Högsta 2 - 16 kHz
(+) | balanserade toppar - endast 2% från medianen
(+) | toppar är linjära (4.5% delta till föregående frekvens)
Totalt 100 - 16 000 Hz
(+) | det totala ljudet är linjärt (10.2% skillnad mot median)
Jämfört med samma klass
» 7% av alla testade enheter i den här klassen var bättre, 2% liknande, 91% sämre
» Den bästa hade ett delta på 5%, genomsnittet var 18%, sämst var 53%
Jämfört med alla testade enheter
» 5% av alla testade enheter var bättre, 1% liknande, 94% sämre
» Den bästa hade ett delta på 4%, genomsnittet var 24%, sämst var 134%
| Av/Standby | |
| Låg belastning | |
| Hög belastning |
|
Förklaring:
min: | |
| Asus VivoBook S15 S532F i7-8565U, GeForce MX250, WDC PC SN520 SDAPNUW-256G, IPS, 1920x1080, 15.6" | Dell XPS 15 9570 Core i9 UHD i9-8950HK, GeForce GTX 1050 Ti Max-Q, Samsung SSD PM981 MZVLB1T0HALR, IPS, 3840x2160, 15.6" | HP Envy x360 15-bq102ng R5 2500U, Vega 8, Samsung PM961 MZVLW256HEHP, IPS, 1920x1080, 15.6" | Lenovo Ideapad 720S-15IKB 81AC001AGE i7-7700HQ, GeForce GTX 1050 Ti Max-Q, Samsung SSD PM981 MZVLB512HAJQ, IPS, 1920x1080, 15.6" | Asus ZenBook 15 UX533FD i7-8565U, GeForce GTX 1050 Max-Q, WDC PC SN520 SDAPNUW-512G, IPS, 1920x1080, 15.6" | Acer Aspire 5 A515-52G-723L i7-8565U, GeForce MX250, WDC PC SN520 SDAPNUW-512G, IPS, 1920x1080, 15.6" | |
|---|---|---|---|---|---|---|
| Power Consumption | -44% | 31% | 8% | 14% | 23% | |
| Idle Minimum * (Watt) | 6 | 7.1 -18% | 4.8 20% | 3.7 38% | 2.7 55% | 4.4 27% |
| Idle Average * (Watt) | 10.3 | 13.6 -32% | 7 32% | 8 22% | 8 22% | 6.9 33% |
| Idle Maximum * (Watt) | 10.5 | 14.1 -34% | 9.5 10% | 9.8 7% | 10.6 -1% | 9.9 6% |
| Load Average * (Watt) | 69.1 | 103.9 -50% | 40.8 41% | 85 -23% | 74 -7% | 55 20% |
| Witcher 3 ultra * (Watt) | 57.8 | 103 -78% | ||||
| Load Maximum * (Watt) | 88 | 130.9 -49% | 44.3 50% | 92.4 -5% | 89 -1% | 63.4 28% |
* ... mindre är bättre
| Asus VivoBook S15 S532F i7-8565U, GeForce MX250, 42 Wh | Dell XPS 15 9570 Core i9 UHD i9-8950HK, GeForce GTX 1050 Ti Max-Q, 97 Wh | HP Envy x360 15-bq102ng R5 2500U, Vega 8, 55.8 Wh | Lenovo Ideapad 720S-15IKB 81AC001AGE i7-7700HQ, GeForce GTX 1050 Ti Max-Q, 79 Wh | Asus ZenBook 15 UX533FD i7-8565U, GeForce GTX 1050 Max-Q, 73 Wh | Acer Aspire 5 A515-52G-723L i7-8565U, GeForce MX250, 48 Wh | Asus VivoBook S15 S530UN-BQ097T i5-8550U, GeForce MX150, 42 Wh | |
|---|---|---|---|---|---|---|---|
| Batteridrifttid | 26% | 39% | 73% | 107% | 32% | 27% | |
| Reader / Idle (h) | 10.9 | 15 38% | 22.6 107% | 26.5 143% | 12.9 18% | ||
| WiFi v1.3 (h) | 5.1 | 8.6 69% | 7.1 39% | 9.8 92% | 8.7 71% | 6.9 35% | 6.5 27% |
| Load (h) | 1.4 | 1 -29% | 1.7 21% | 2.9 107% | 2 43% |
För
Emot
Läs den fullständiga versionen av den här recensionen på engelska här.
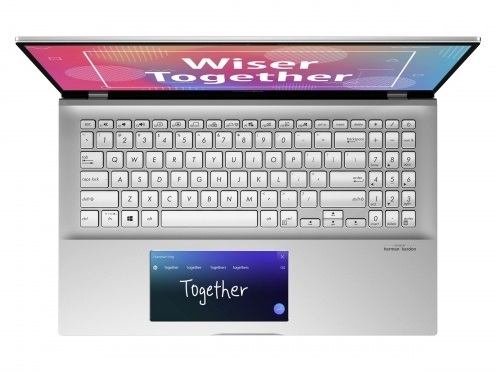
I vår recension av den första ZenBook Pro 15 med ScreenPad 1.0 kallade vi den för en av sin natur användbar innovation som dock led av ett flertal förstagenerationsproblem som hög inlärningskurva, klumpigt gränssnitt, en riktigt grynig skärm och reducerad batteritid. ScreenPad 2.0 åtgärdar många av dessa klagomål med en större storlek, en mer ljusstark skärm och ett uppdaterat Android-liknande gränssnitt i en laptop som bara kostar hälften så mycket som ZenBook Pro 15. Det är vanligt att användare hoppar över första generationens produkter då andra generationen nästan alltid är betydligt bättre och billigare. Detta hade inte kunnat vara mer sant för ScreenPad 2.0; Om du tilltalades av Asus teknik men valde att vänta förra året är årets billiga VivoBook läget att ta klivet.
ScreenPad 2.0 är inte på något sätt perfekt. Det matta överdraget är fortfarande en aning grynigt, särskilt när man jämför med de skarpa blanka skärmarna som sitter på telefonerna vi har i våra fickor. Den extra skärmen påverkar fortfarande batteritiden och Windows är inte särskilt optimerat för en skärm med så låg PPI. Kanske hade en ScreenPad med samma upplösning, kontrast och färg som huvudskärmen skapat en bättre synergi mellan de båda.
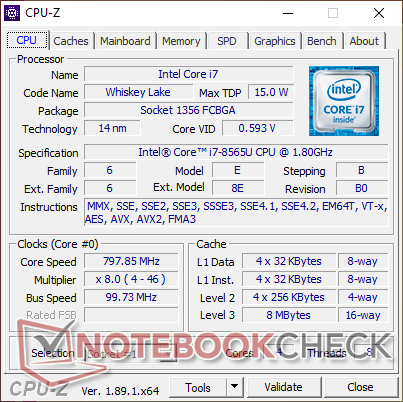
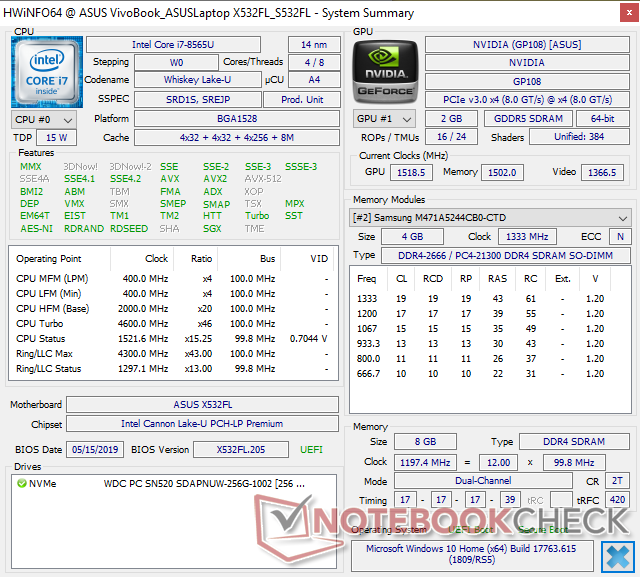
Vad det gäller själva datorn så är processorn långsammare än genomsnittet på grund av sin begränsade förmåga att upprätthålla Turbo Boost. Som tur är påverkar detta inte spelprestandan, vilket gör VivoBook till en bra lösning för både arbete och casual-spelande.
ScreenPad är inte bara en nymodighet som försöker vara annorlunda. Dess bildförhållande och funktion som andra skärm gör den objektivt sett mer användbar än Apples Touch Bar-lösning. Det finns fortfarande en hel del problem att lösa, särskilt när det gäller grynighet, men detta är ett stort steg i rätt riktning jämfört med förra årets ScreenPad 1.0.
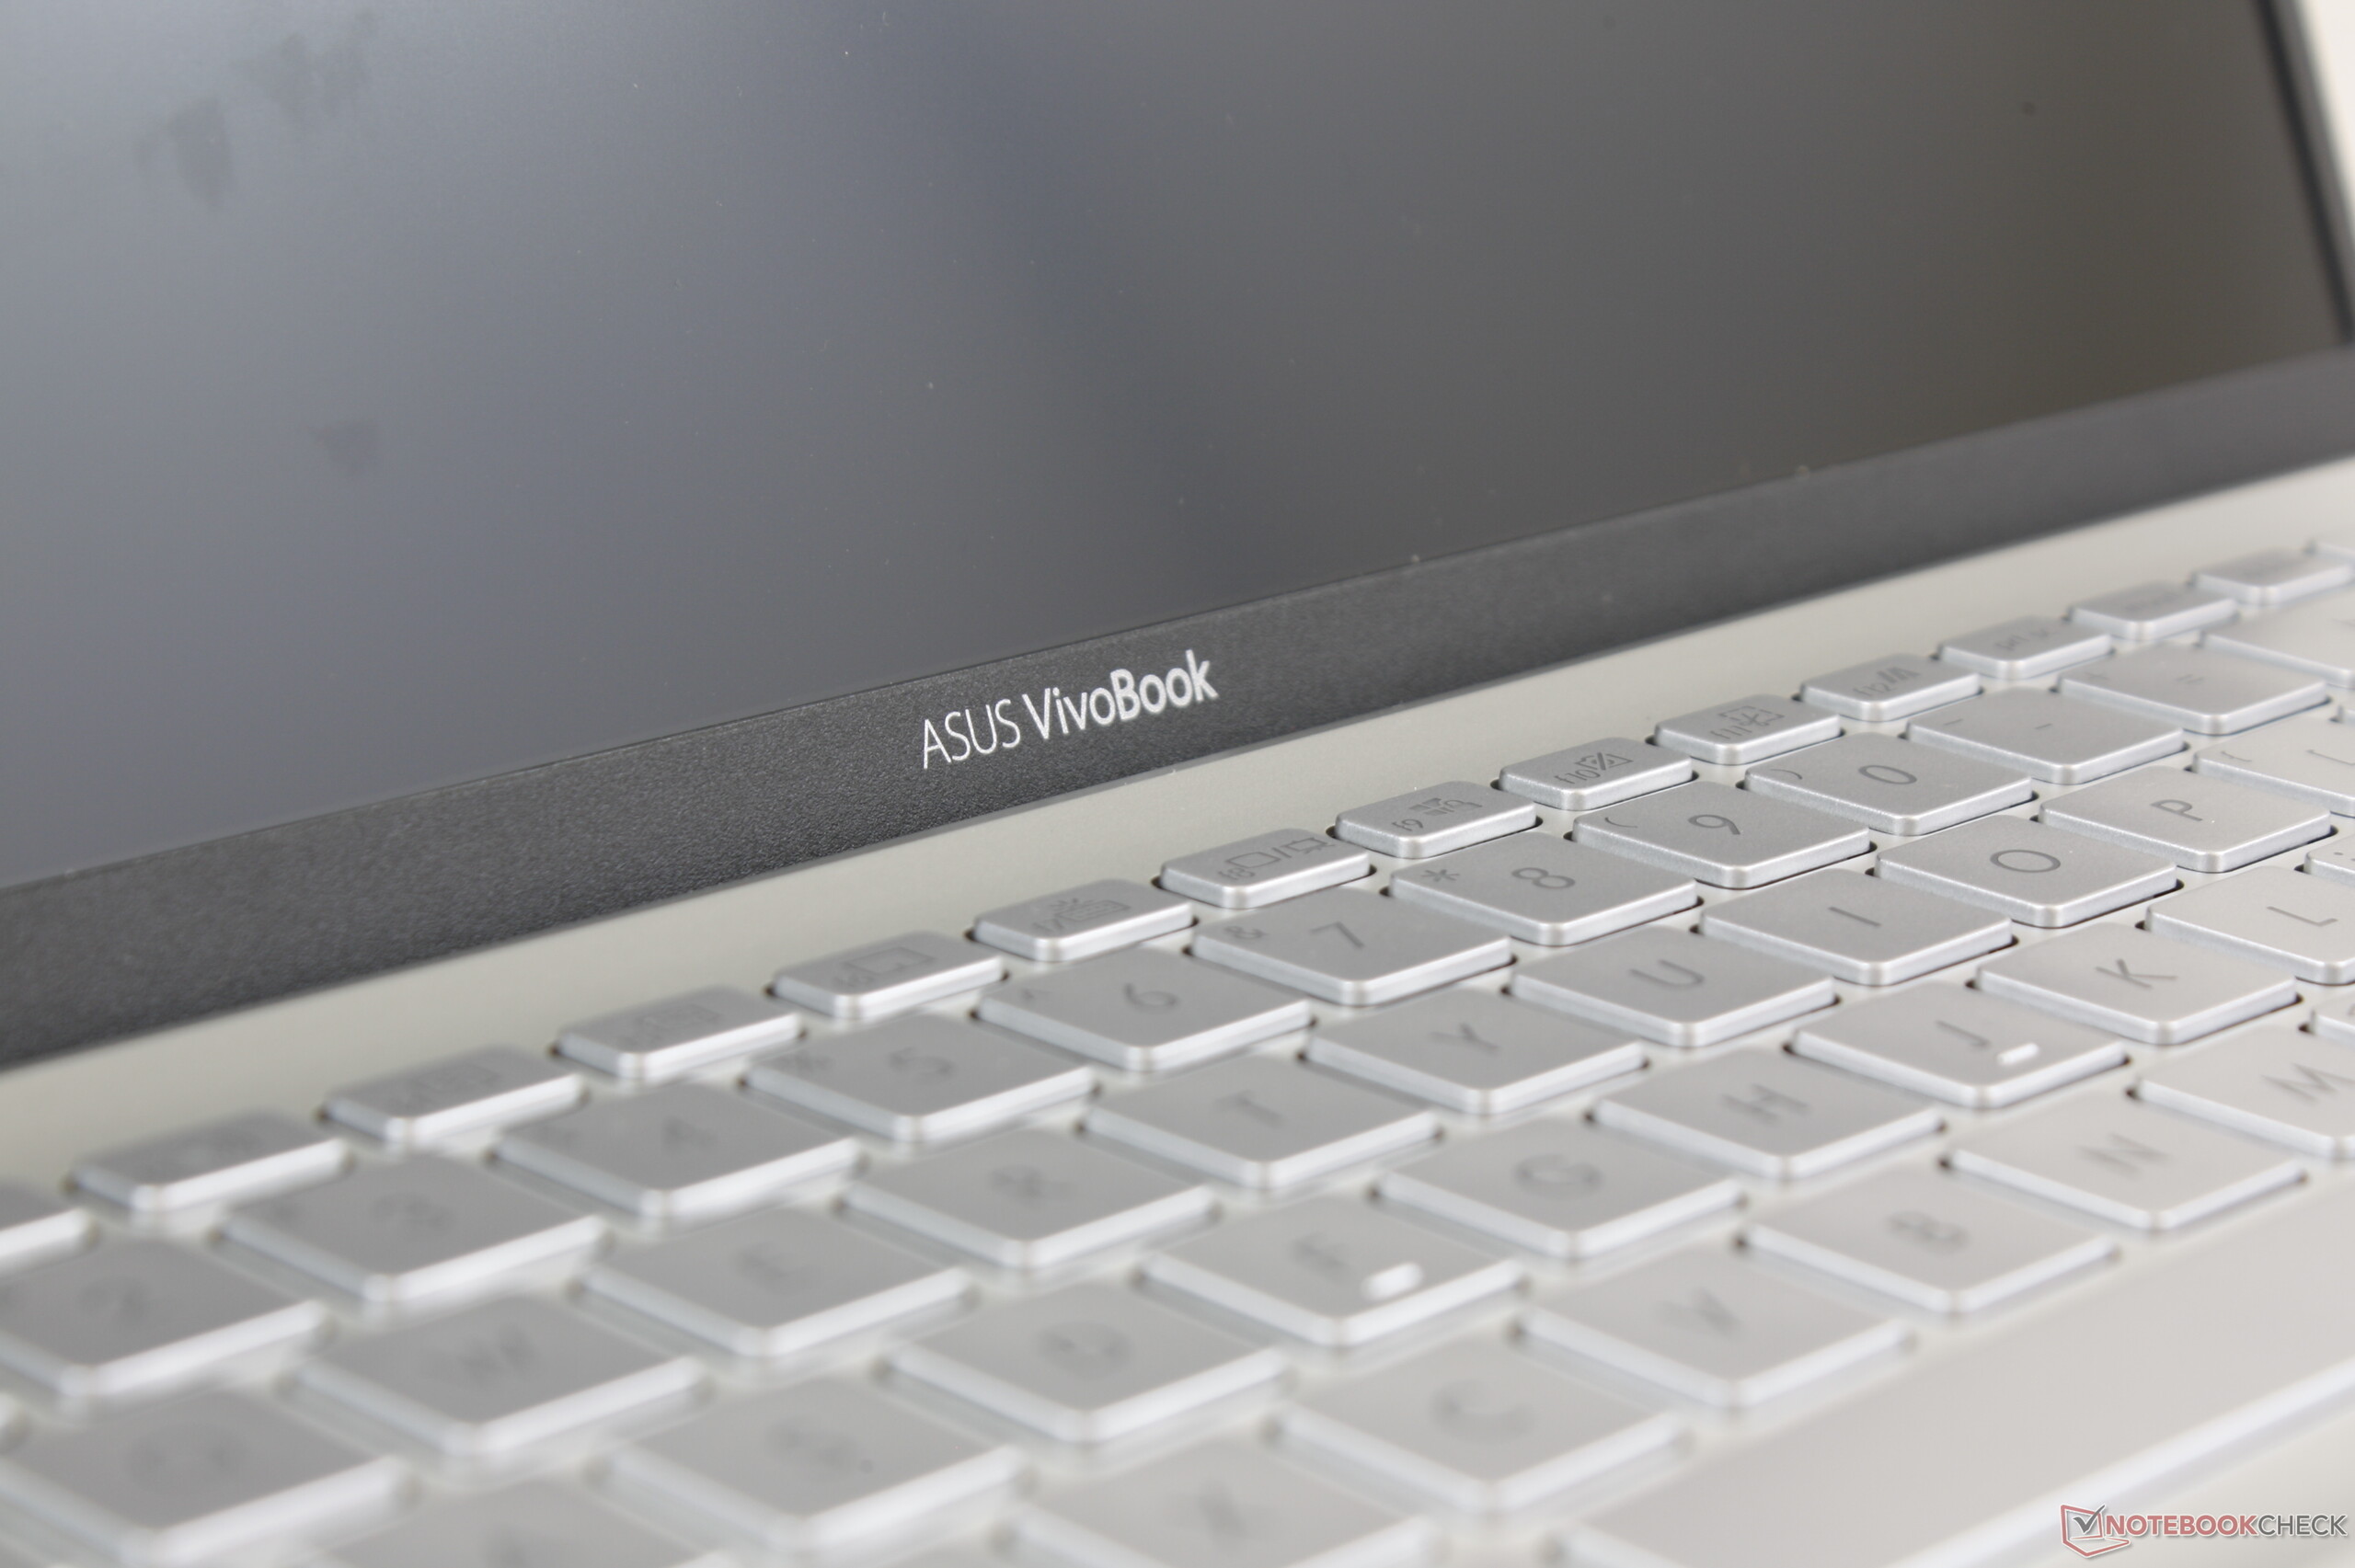
Asus VivoBook S15 S532F
- 07/23/2019 v6 (old)
Allen Ngo
Price comparison
