Test: HP Pavilion x360 15 2019 - Köp inte den här konfigurationen (Sammanfattning)
Gradering | Datum | Modell | Vikt | Höjd | Storlek | Upplösning | Pris |
|---|---|---|---|---|---|---|---|
| 72 % v7 (old) | 02/2020 | HP Pavilion x360 15-dq0065cl i7-8565U, UHD Graphics 620 | 1.9 kg | 20.6 mm | 15.60" | 1366x768 | |
| 78.9 % v6 (old) | 07/2018 | Asus VivoBook Flip 15 TP510UA-E8073T i5-8250U, UHD Graphics 620 | 2.3 kg | 18 mm | 15.60" | 1920x1080 | |
| 82.6 % v7 (old) | 12/2019 | Lenovo Ideapad C340-15IWL-81N5004QGE i5-8265U, GeForce MX230 | 2 kg | 20.5 mm | 15.60" | 1920x1080 | |
| 80.1 % v6 (old) | 04/2018 | HP Envy x360 15-bq102ng R5 2500U, Vega 8 | 2.1 kg | 19.6 mm | 15.60" | 1920x1080 | |
| 77.6 % v6 (old) | 05/2022 | Dell Inspiron 15 3585 (2300U, Vega 6) R3 2300U, Vega 6 | 1.9 kg | 20 mm | 15.60" | 1920x1080 |
| SD Card Reader | |
| average JPG Copy Test (av. of 3 runs) | |
| Dell XPS 15 7590 i5 iGPU FHD (Toshiba Exceria Pro SDXC 64 GB UHS-II) | |
| HP Pavilion x360 15-dq0065cl (Toshiba Exceria Pro SDXC 64 GB UHS-II) | |
| Lenovo Ideapad C340-15IWL-81N5004QGE (Toshiba Exceria Pro SDXC 64 GB UHS-II) | |
| HP Envy x360 15-bq102ng (Toshiba Exceria Pro SDXC 64 GB UHS-II) | |
| Dell Inspiron 15 3585 (2300U, Vega 6) (Toshiba Exceria Pro SDXC 64 GB UHS-II) | |
| Asus VivoBook Flip 15 TP510UA-E8073T (Toshiba Exceria Pro SDXC 64 GB UHS-II) | |
| maximum AS SSD Seq Read Test (1GB) | |
| Dell XPS 15 7590 i5 iGPU FHD (Toshiba Exceria Pro SDXC 64 GB UHS-II) | |
| Lenovo Ideapad C340-15IWL-81N5004QGE (Toshiba Exceria Pro SDXC 64 GB UHS-II) | |
| HP Envy x360 15-bq102ng (Toshiba Exceria Pro SDXC 64 GB UHS-II) | |
| HP Pavilion x360 15-dq0065cl (Toshiba Exceria Pro SDXC 64 GB UHS-II) | |
| Dell Inspiron 15 3585 (2300U, Vega 6) (Toshiba Exceria Pro SDXC 64 GB UHS-II) | |
| Asus VivoBook Flip 15 TP510UA-E8073T (Toshiba Exceria Pro SDXC 64 GB UHS-II) | |
| |||||||||||||||||||||||||
Distribution av ljusstyrkan: 88 %
Mitt på batteriet: 195.7 cd/m²
Kontrast: 288:1 (Svärta: 0.68 cd/m²)
ΔE ColorChecker Calman: 11.99 | ∀{0.5-29.43 Ø4.71}
calibrated: 4.63
ΔE Greyscale Calman: 12.8 | ∀{0.09-98 Ø4.96}
57.8% sRGB (Argyll 1.6.3 3D)
36.7% AdobeRGB 1998 (Argyll 1.6.3 3D)
39.93% AdobeRGB 1998 (Argyll 3D)
58.2% sRGB (Argyll 3D)
38.65% Display P3 (Argyll 3D)
Gamma: 2.15
CCT: 14252 K
| HP Pavilion x360 15-dq0065cl BOE076E, TN LED, 15.6", 1366x768 | Asus VivoBook Flip 15 TP510UA-E8073T AU Optronics B156HAN02.1, IPS, 15.6", 1920x1080 | Lenovo Ideapad C340-15IWL-81N5004QGE BOE CQ NV156FHM-N48, IPS, 15.6", 1920x1080 | HP Envy x360 15-bq102ng Chi Mei CM15E9, IPS, 15.6", 1920x1080 | Dell Inspiron 15 3585 (2300U, Vega 6) BOE0802, TN, 15.6", 1920x1080 | Dell XPS 15 7590 i5 iGPU FHD LQ156M1, IPS, 15.6", 1920x1080 | |
|---|---|---|---|---|---|---|
| Display | 1% | 0% | 7% | 1% | 70% | |
| Display P3 Coverage (%) | 38.65 | 39.19 1% | 39.05 1% | 41.36 7% | 39.22 1% | 66.5 72% |
| sRGB Coverage (%) | 58.2 | 58.9 1% | 57.3 -2% | 62.2 7% | 58.9 1% | 98 68% |
| AdobeRGB 1998 Coverage (%) | 39.93 | 40.49 1% | 40.35 1% | 42.74 7% | 40.52 1% | 68.4 71% |
| Response Times | -25% | -48% | -13% | 33% | -41% | |
| Response Time Grey 50% / Grey 80% * (ms) | 68.8 ? | 44 ? 36% | 57 ? 17% | 40 ? 42% | 39 ? 43% | 52.8 ? 23% |
| Response Time Black / White * (ms) | 15.6 ? | 29 ? -86% | 33 ? -112% | 26 ? -67% | 12 ? 23% | 32 ? -105% |
| PWM Frequency (Hz) | 1000 ? | 352 ? | 25000 ? | 250 ? | 1020 ? | |
| Screen | 71% | 64% | 81% | 13% | 118% | |
| Brightness middle (cd/m²) | 195.7 | 229 17% | 266 36% | 221 13% | 225 15% | 588 200% |
| Brightness (cd/m²) | 186 | 221 19% | 251 35% | 207 11% | 213 15% | 555 198% |
| Brightness Distribution (%) | 88 | 76 -14% | 81 -8% | 87 -1% | 88 0% | 89 1% |
| Black Level * (cd/m²) | 0.68 | 0.15 78% | 0.165 76% | 0.15 78% | 0.535 21% | 0.4 41% |
| Contrast (:1) | 288 | 1527 430% | 1612 460% | 1473 411% | 421 46% | 1470 410% |
| Colorchecker dE 2000 * | 11.99 | 5.03 58% | 6.33 47% | 4.35 64% | 10.37 14% | 2.5 79% |
| Colorchecker dE 2000 max. * | 21.31 | 8.89 58% | 21.03 1% | 8.98 58% | 19.75 7% | 6.3 70% |
| Colorchecker dE 2000 calibrated * | 4.63 | 5.23 -13% | 3.89 16% | 0.6 87% | ||
| Greyscale dE 2000 * | 12.8 | 5.56 57% | 3.81 70% | 3.09 76% | 12.09 6% | 4.5 65% |
| Gamma | 2.15 102% | 2.64 83% | 2.38 92% | 2.23 99% | 2.72 81% | 2.2 100% |
| CCT | 14252 46% | 7015 93% | 6057 107% | 6068 107% | 13335 49% | 6836 95% |
| Color Space (Percent of AdobeRGB 1998) (%) | 36.7 | 37 1% | 37 1% | 56 53% | 37 1% | 63.2 72% |
| Color Space (Percent of sRGB) (%) | 57.8 | 59 2% | 57 -1% | 86 49% | 59 2% | 98 70% |
| Totalt genomsnitt (program/inställningar) | 16% /
44% | 5% /
38% | 25% /
54% | 16% /
13% | 49% /
89% |
* ... mindre är bättre
Visa svarstider
| ↔ Svarstid svart till vitt | ||
|---|---|---|
| 15.6 ms ... stiga ↗ och falla ↘ kombinerat | ↗ 9.2 ms stiga | 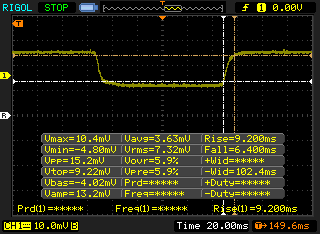 |
| ↘ 6.4 ms hösten | ||
| Skärmen visar bra svarsfrekvens i våra tester, men kan vara för långsam för konkurrenskraftiga spelare. I jämförelse sträcker sig alla testade enheter från 0.1 (minst) till 240 (maximalt) ms. » 37 % av alla enheter är bättre. Det betyder att den uppmätta svarstiden är bättre än genomsnittet av alla testade enheter (19.8 ms). | ||
| ↔ Svarstid 50 % grått till 80 % grått | ||
| 68.8 ms ... stiga ↗ och falla ↘ kombinerat | ↗ 30 ms stiga | 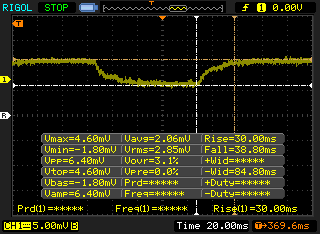 |
| ↘ 38.8 ms hösten | ||
| Skärmen visar långsamma svarsfrekvenser i våra tester och kommer att vara otillfredsställande för spelare. I jämförelse sträcker sig alla testade enheter från 0.165 (minst) till 636 (maximalt) ms. » 98 % av alla enheter är bättre. Detta innebär att den uppmätta svarstiden är sämre än genomsnittet av alla testade enheter (30.9 ms). | ||
Skärmflimmer / PWM (Puls-Width Modulation)
| Skärmflimmer / PWM upptäckt | 1000 Hz | ≤ 99 % ljusstyrka inställning | 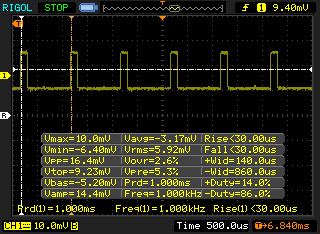 |
Displayens bakgrundsbelysning flimrar vid 1000 Hz (i värsta fall, t.ex. med PWM) Flimrande upptäckt vid en ljusstyrkeinställning på 99 % och lägre. Det ska inte finnas något flimmer eller PWM över denna ljusstyrkeinställning. Frekvensen för 1000 Hz är ganska hög, så de flesta användare som är känsliga för PWM bör inte märka något flimmer. Som jämförelse: 52 % av alla testade enheter använder inte PWM för att dämpa skärmen. Om PWM upptäcktes mättes ett medelvärde av 7741 (minst: 5 - maximum: 343500) Hz. | |||
| Cinebench R10 | |
| Rendering Multiple CPUs 32Bit | |
| Dell XPS 13 7390 Core i7-10710U | |
| Genomsnitt Intel Core i7-8565U (13806 - 23118, n=16) | |
| Dynabook Portege A30-E-174 | |
| Rendering Single 32Bit | |
| Dell XPS 13 7390 Core i7-10710U | |
| Genomsnitt Intel Core i7-8565U (2682 - 8906, n=16) | |
| Dynabook Portege A30-E-174 | |
| wPrime 2.10 - 1024m | |
| Genomsnitt Intel Core i7-8565U (263 - 420, n=7) | |
| Dell XPS 13 7390 Core i7-10710U | |
* ... mindre är bättre
| PCMark 8 Home Score Accelerated v2 | 3335 poäng | |
| PCMark 8 Work Score Accelerated v2 | 5132 poäng | |
| PCMark 10 Score | 3787 poäng | |
Hjälp | ||
| HP Pavilion x360 15-dq0065cl Intel SSD 660p SSDPEKNW512G8 | Asus VivoBook Flip 15 TP510UA-E8073T SanDisk SD8SN8U128G1002 | Lenovo Ideapad C340-15IWL-81N5004QGE SK hynix BC501 HFM128GDJTNG-831 | HP Envy x360 15-bq102ng Samsung PM961 MZVLW256HEHP | Dell Inspiron 15 3585 (2300U, Vega 6) Toshiba BG3 KBG30ZMS256G | Dell XPS 15 7590 i5 iGPU FHD Toshiba XG6 KXG60ZNV512G | |
|---|---|---|---|---|---|---|
| AS SSD | -60% | -35% | 19% | -73% | 70% | |
| Seq Read (MB/s) | 1301 | 474.8 -64% | 1399 8% | 2465 89% | 1291 -1% | 2357 81% |
| Seq Write (MB/s) | 931 | 229.3 -75% | 369.8 -60% | 1318 42% | 688 -26% | 1235 33% |
| 4K Read (MB/s) | 52.8 | 26.42 -50% | 40 -24% | 42.97 -19% | 21.87 -59% | 43.29 -18% |
| 4K Write (MB/s) | 127.5 | 49.85 -61% | 109.2 -14% | 81.9 -36% | 35.62 -72% | 99.7 -22% |
| 4K-64 Read (MB/s) | 323.4 | 364.5 13% | 264.3 -18% | 1025 217% | 632 95% | 1020 215% |
| 4K-64 Write (MB/s) | 667 | 93.2 -86% | 181.9 -73% | 338.6 -49% | 221.2 -67% | 1502 125% |
| Access Time Read * (ms) | 0.048 | 0.13 -171% | 0.07 -46% | 0.077 -60% | 0.33 -588% | 0.07 -46% |
| Access Time Write * (ms) | 0.136 | 0.088 35% | 0.041 70% | 0.046 66% | 0.234 -72% | 0.039 71% |
| Score Read (Points) | 506 | 438 -13% | 444 -12% | 1314 160% | 783 55% | 1299 157% |
| Score Write (Points) | 887 | 166 -81% | 328 -63% | 552 -38% | 326 -63% | 1726 95% |
| Score Total (Points) | 1655 | 825 -50% | 963 -42% | 2488 50% | 1489 -10% | 3640 120% |
| Copy ISO MB/s (MB/s) | 905 | 317.8 -65% | 265.8 -71% | 700 -23% | 432.6 -52% | 2145 137% |
| Copy Program MB/s (MB/s) | 607 | 80.8 -87% | 158.7 -74% | 167.2 -72% | 95.6 -84% | 565 -7% |
| Copy Game MB/s (MB/s) | 911 | 127.1 -86% | 216.8 -76% | 370.4 -59% | 263.4 -71% | 1320 45% |
| CrystalDiskMark 5.2 / 6 | -39% | 4% | -39% | 32% | ||
| Write 4K (MB/s) | 179 | 105 -41% | 116 -35% | 87.3 -51% | 93.6 -48% | |
| Read 4K (MB/s) | 58.7 | 39.72 -32% | 42.73 -27% | 23.54 -60% | 41.87 -29% | |
| Write Seq (MB/s) | 974 | 326.9 -66% | 1222 25% | 824 -15% | 1698 74% | |
| Read Seq (MB/s) | 1614 | 1033 -36% | 1608 0% | 715 -56% | 1978 23% | |
| Write 4K Q32T1 (MB/s) | 445.4 | 269.1 -40% | 280.1 -37% | 147.8 -67% | 383.1 -14% | |
| Read 4K Q32T1 (MB/s) | 338.7 | 284.8 -16% | 333.6 -2% | 256.1 -24% | 326.9 -3% | |
| Write Seq Q32T1 (MB/s) | 986 | 321 -67% | 1291 31% | 733 -26% | 2778 182% | |
| Read Seq Q32T1 (MB/s) | 1824 | 1606 -12% | 3183 75% | 1525 -16% | 3119 71% | |
| Totalt genomsnitt (program/inställningar) | -60% /
-60% | -37% /
-37% | 12% /
14% | -56% /
-60% | 51% /
56% |
* ... mindre är bättre

| 3DMark 11 Performance | 1933 poäng | |
| 3DMark Cloud Gate Standard Score | 7819 poäng | |
| 3DMark Fire Strike Score | 1008 poäng | |
| 3DMark Time Spy Score | 427 poäng | |
Hjälp | ||
| Shadow of the Tomb Raider - 1280x720 Lowest Preset | |
| MSI Modern 14 A10RB-459US | |
| Dell Inspiron 15 5000 5585 | |
| Microsoft Surface Laptop 3 15 i7-1065G7 | |
| Dell Inspiron 15 3585 (2300U, Vega 6) | |
| Dell XPS 13 7390 Core i7-10710U | |
| Genomsnitt Intel UHD Graphics 620 (12 - 21.7, n=13) | |
| låg | med. | hög | ultra | |
|---|---|---|---|---|
| BioShock Infinite (2013) | 49.1 | 30.5 | 24.7 | |
| The Witcher 3 (2015) | 16.8 | 10.5 | ||
| Rocket League (2017) | 62.7 |
| HP Pavilion x360 15-dq0065cl UHD Graphics 620, i7-8565U, Intel SSD 660p SSDPEKNW512G8 | Asus VivoBook Flip 15 TP510UA-E8073T UHD Graphics 620, i5-8250U, SanDisk SD8SN8U128G1002 | Lenovo Ideapad C340-15IWL-81N5004QGE GeForce MX230, i5-8265U, SK hynix BC501 HFM128GDJTNG-831 | HP Envy x360 15-bq102ng Vega 8, R5 2500U, Samsung PM961 MZVLW256HEHP | Dell Inspiron 15 3585 (2300U, Vega 6) Vega 6, R3 2300U, Toshiba BG3 KBG30ZMS256G | Dell XPS 15 7590 i5 iGPU FHD UHD Graphics 630, i5-9300H, Toshiba XG6 KXG60ZNV512G | |
|---|---|---|---|---|---|---|
| Noise | -6% | -8% | -9% | -10% | -3% | |
| av / miljö * (dB) | 28.4 | 30.2 -6% | 30.3 -7% | 30.13 -6% | 30.6 -8% | 29.3 -3% |
| Idle Minimum * (dB) | 28.4 | 30.9 -9% | 30.6 -8% | 30.13 -6% | 30.6 -8% | 29.3 -3% |
| Idle Average * (dB) | 28.4 | 30.9 -9% | 30.6 -8% | 30.13 -6% | 30.6 -8% | 29.3 -3% |
| Idle Maximum * (dB) | 28.4 | 30.9 -9% | 30.6 -8% | 30.13 -6% | 30.6 -8% | 29.8 -5% |
| Load Average * (dB) | 31.5 | 34.2 -9% | 36.4 -16% | 38.8 -23% | 36.7 -17% | 32.4 -3% |
| Load Maximum * (dB) | 37.4 | 34.2 9% | 36.8 2% | 38.8 -4% | 41.1 -10% | 37.2 1% |
* ... mindre är bättre
Ljudnivå
| Låg belastning |
| 28.4 / 28.4 / 28.4 dB(A) |
| Hög belastning |
| 31.5 / 37.4 dB(A) |
 | ||
30 dB tyst 40 dB(A) hörbar 50 dB(A) högt ljud |
||
min: | ||
(+) Den maximala temperaturen på ovansidan är 31.6 °C / 89 F, jämfört med genomsnittet av 36.8 °C / 98 F , allt från 21 till 71 °C för klassen Multimedia.
(±) Botten värms upp till maximalt 41.6 °C / 107 F, jämfört med genomsnittet av 39.1 °C / 102 F
(+) Vid tomgångsbruk är medeltemperaturen för ovansidan 22.9 °C / 73 F, jämfört med enhetsgenomsnittet på 31.3 °C / ### class_avg_f### F.
(+) Handledsstöden och pekplattan är kallare än hudtemperaturen med maximalt 29.8 °C / 85.6 F och är därför svala att ta på.
(±) Medeltemperaturen för handledsstödsområdet på liknande enheter var 28.7 °C / 83.7 F (-1.1 °C / -1.9 F).
HP Pavilion x360 15-dq0065cl ljudanalys
(±) | högtalarljudstyrkan är genomsnittlig men bra (80.3 dB)
Bas 100 - 315 Hz
(±) | reducerad bas - i genomsnitt 12.7% lägre än medianen
(-) | basen är inte linjär (15.3% delta till föregående frekvens)
Mellan 400 - 2000 Hz
(+) | balanserad mellan - endast 3.6% från medianen
(±) | linjäriteten för mids är genomsnittlig (7% delta till föregående frekvens)
Högsta 2 - 16 kHz
(+) | balanserade toppar - endast 3.6% från medianen
(±) | linjäriteten för toppar är genomsnittlig (7% delta till föregående frekvens)
Totalt 100 - 16 000 Hz
(±) | linjäriteten för det totala ljudet är genomsnittlig (20.1% skillnad mot median)
Jämfört med samma klass
» 67% av alla testade enheter i den här klassen var bättre, 8% liknande, 25% sämre
» Den bästa hade ett delta på 5%, genomsnittet var 17%, sämst var 45%
Jämfört med alla testade enheter
» 52% av alla testade enheter var bättre, 8% liknande, 40% sämre
» Den bästa hade ett delta på 4%, genomsnittet var 23%, sämst var 134%
Apple MacBook 12 (Early 2016) 1.1 GHz ljudanalys
(+) | högtalare kan spela relativt högt (83.6 dB)
Bas 100 - 315 Hz
(±) | reducerad bas - i genomsnitt 11.3% lägre än medianen
(±) | linjäriteten för basen är genomsnittlig (14.2% delta till föregående frekvens)
Mellan 400 - 2000 Hz
(+) | balanserad mellan - endast 2.4% från medianen
(+) | mids är linjära (5.5% delta till föregående frekvens)
Högsta 2 - 16 kHz
(+) | balanserade toppar - endast 2% från medianen
(+) | toppar är linjära (4.5% delta till föregående frekvens)
Totalt 100 - 16 000 Hz
(+) | det totala ljudet är linjärt (10.2% skillnad mot median)
Jämfört med samma klass
» 7% av alla testade enheter i den här klassen var bättre, 2% liknande, 90% sämre
» Den bästa hade ett delta på 5%, genomsnittet var 18%, sämst var 53%
Jämfört med alla testade enheter
» 5% av alla testade enheter var bättre, 1% liknande, 94% sämre
» Den bästa hade ett delta på 4%, genomsnittet var 23%, sämst var 134%
| Av/Standby | |
| Låg belastning | |
| Hög belastning |
|
Förklaring:
min: | |
| HP Pavilion x360 15-dq0065cl i7-8565U, UHD Graphics 620, Intel SSD 660p SSDPEKNW512G8, TN LED, 1366x768, 15.6" | Asus VivoBook Flip 15 TP510UA-E8073T i5-8250U, UHD Graphics 620, SanDisk SD8SN8U128G1002, IPS, 1920x1080, 15.6" | Lenovo Ideapad C340-15IWL-81N5004QGE i5-8265U, GeForce MX230, SK hynix BC501 HFM128GDJTNG-831, IPS, 1920x1080, 15.6" | HP Envy x360 15-bq102ng R5 2500U, Vega 8, Samsung PM961 MZVLW256HEHP, IPS, 1920x1080, 15.6" | Dell Inspiron 15 3585 (2300U, Vega 6) R3 2300U, Vega 6, Toshiba BG3 KBG30ZMS256G, TN, 1920x1080, 15.6" | Dell XPS 15 7590 i5 iGPU FHD i5-9300H, UHD Graphics 630, Toshiba XG6 KXG60ZNV512G, IPS, 1920x1080, 15.6" | |
|---|---|---|---|---|---|---|
| Power Consumption | -28% | -48% | -43% | -59% | -96% | |
| Idle Minimum * (Watt) | 3.6 | 3.9 -8% | 3.23 10% | 4.8 -33% | 6.3 -75% | 3.79 -5% |
| Idle Average * (Watt) | 5.4 | 7.2 -33% | 6.3 -17% | 7 -30% | 9.2 -70% | 6.9 -28% |
| Idle Maximum * (Watt) | 6.5 | 9.5 -46% | 8 -23% | 9.5 -46% | 9.6 -48% | 9.2 -42% |
| Load Average * (Watt) | 26.7 | 36.8 -38% | 47 -76% | 40.8 -53% | 38 -42% | 62 -132% |
| Load Maximum * (Watt) | 28.8 | 33.1 -15% | 67.3 -134% | 44.3 -54% | 46 -60% | 108 -275% |
* ... mindre är bättre
| HP Pavilion x360 15-dq0065cl i7-8565U, UHD Graphics 620, 41 Wh | Asus VivoBook Flip 15 TP510UA-E8073T i5-8250U, UHD Graphics 620, 42 Wh | Lenovo Ideapad C340-15IWL-81N5004QGE i5-8265U, GeForce MX230, 52.5 Wh | HP Envy x360 15-bq102ng R5 2500U, Vega 8, 55.8 Wh | Dell Inspiron 15 3585 (2300U, Vega 6) R3 2300U, Vega 6, 42 Wh | Dell XPS 15 7590 i5 iGPU FHD i5-9300H, UHD Graphics 630, 97 Wh | |
|---|---|---|---|---|---|---|
| Batteridrifttid | 40% | 100% | 65% | 4% | 125% | |
| Reader / Idle (h) | 12.3 | 7.3 -41% | ||||
| WiFi v1.3 (h) | 4.3 | 6 40% | 8.6 100% | 7.1 65% | 5.3 23% | 14.1 228% |
| Load (h) | 1.4 | 1.8 29% | 1.7 21% |
För
Emot
Läs den fullständiga versionen av den här recensionen på engelska här.
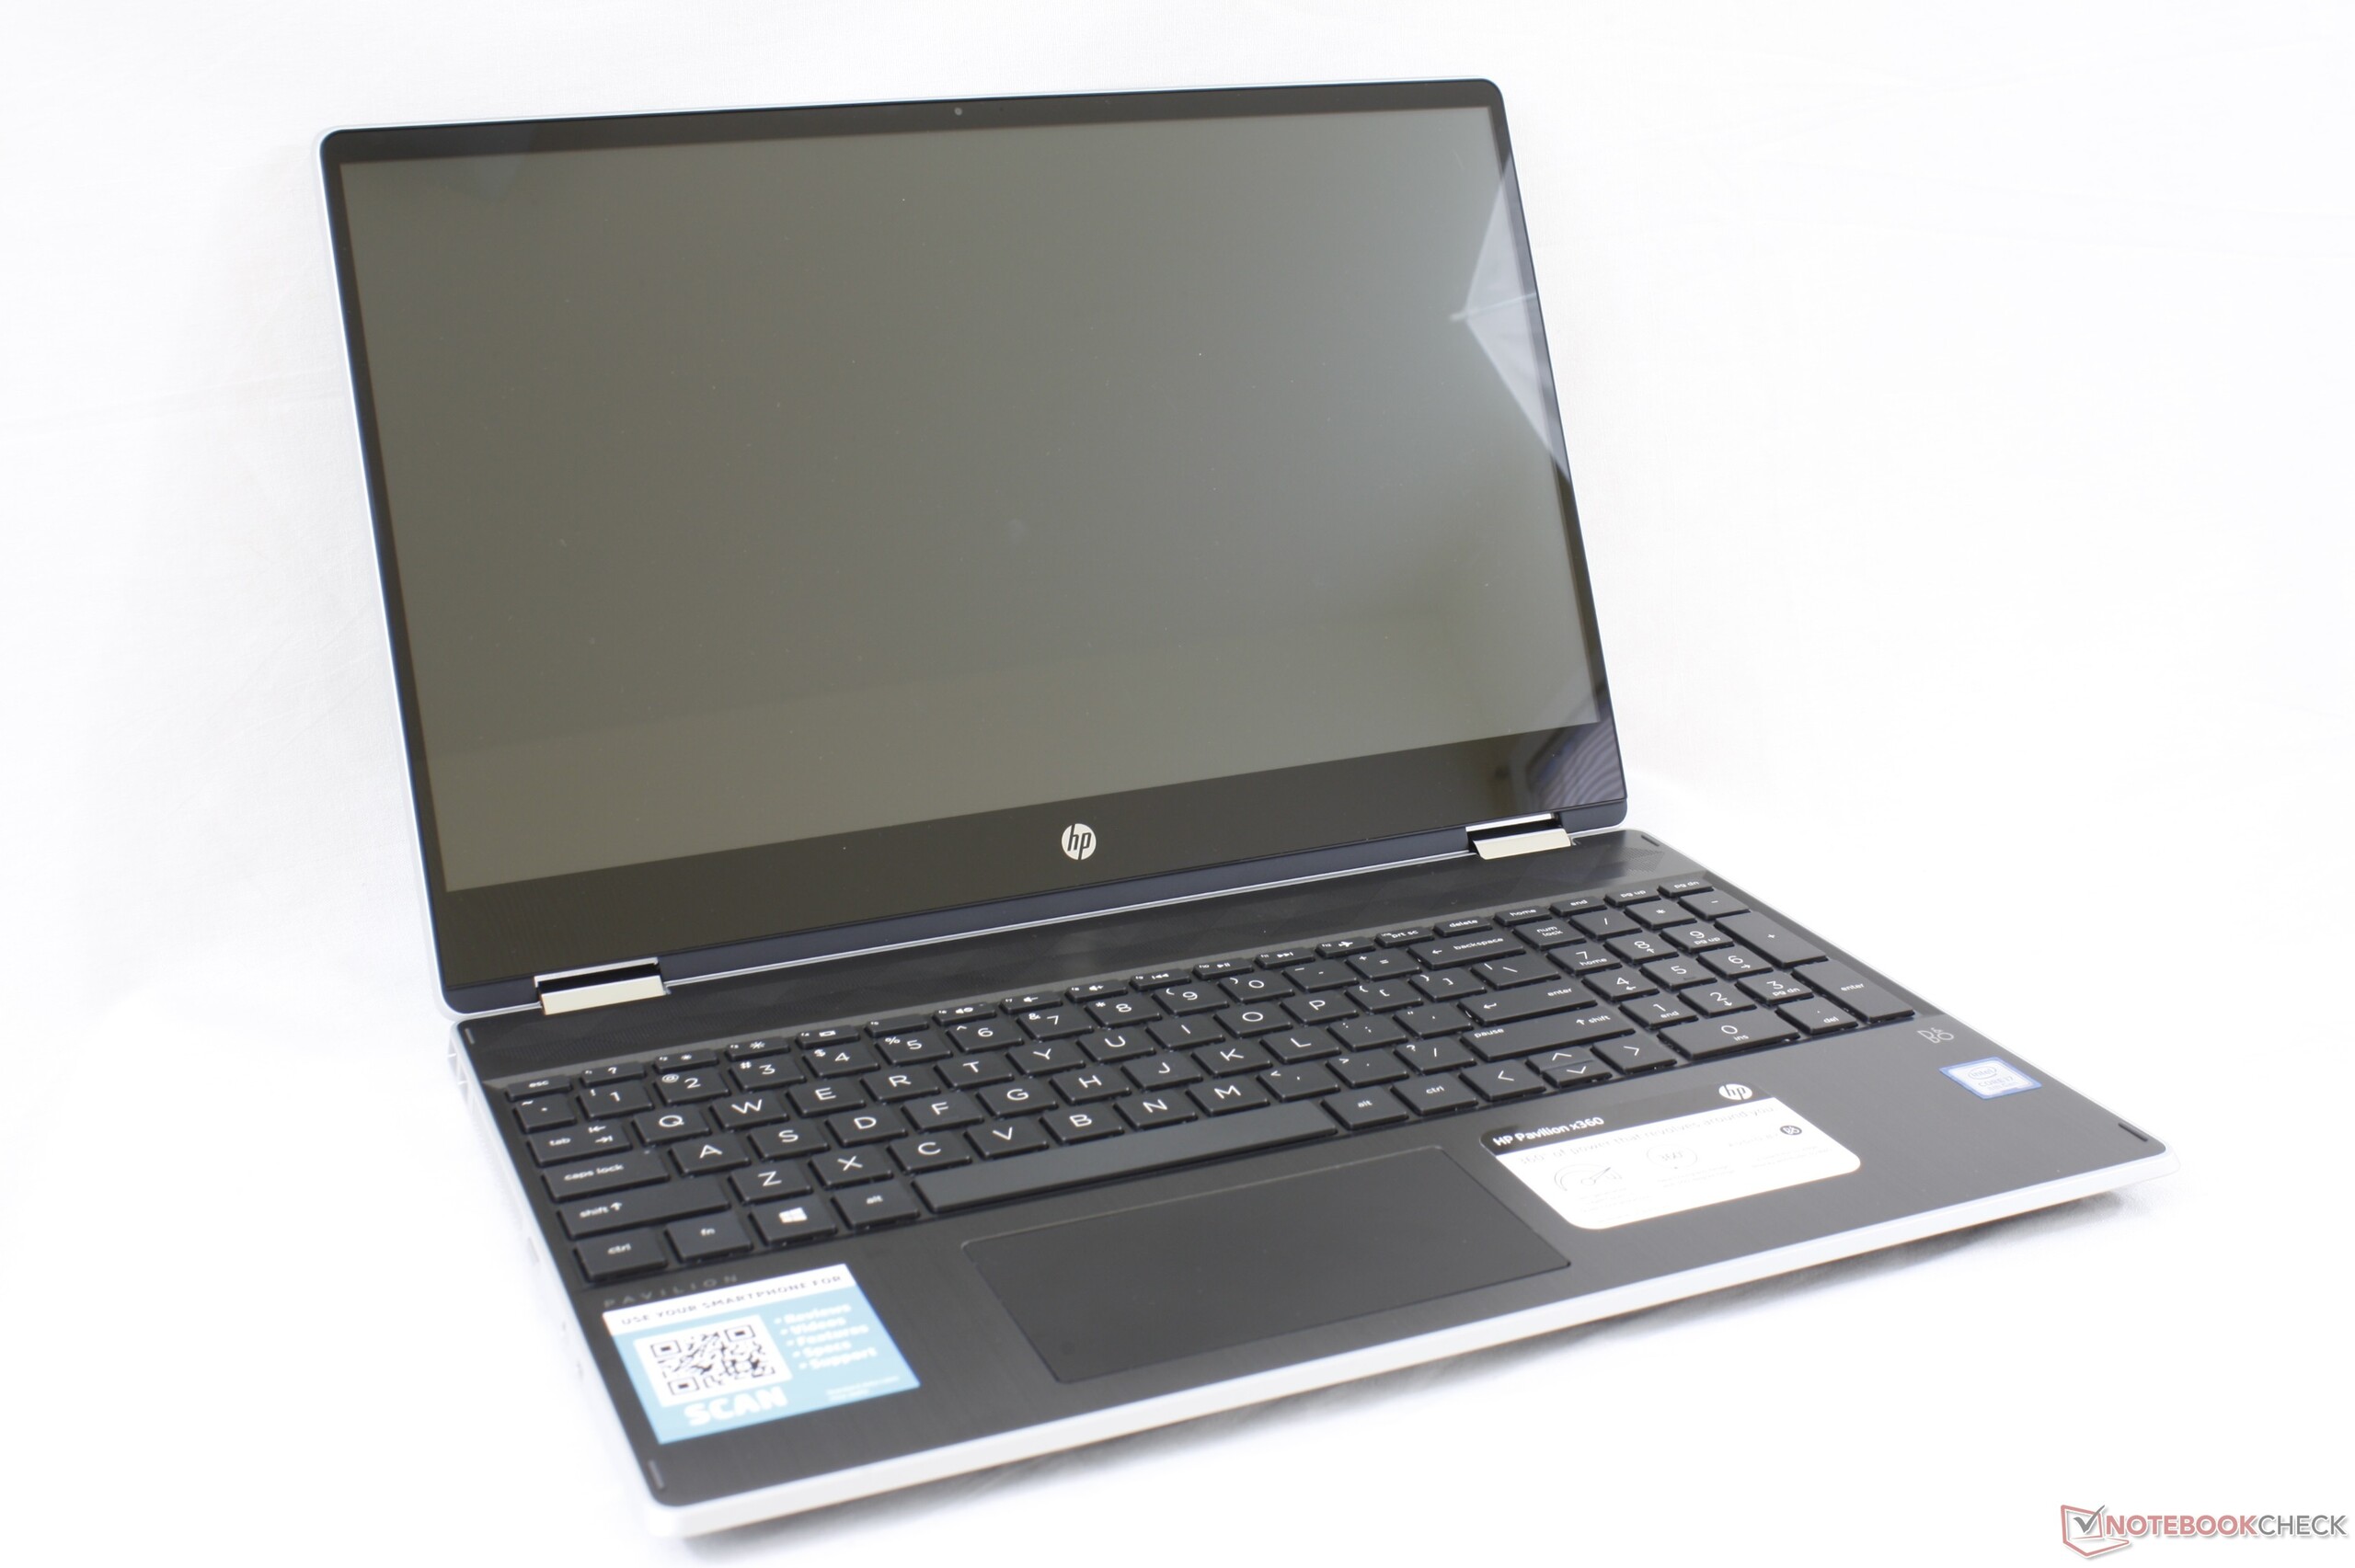
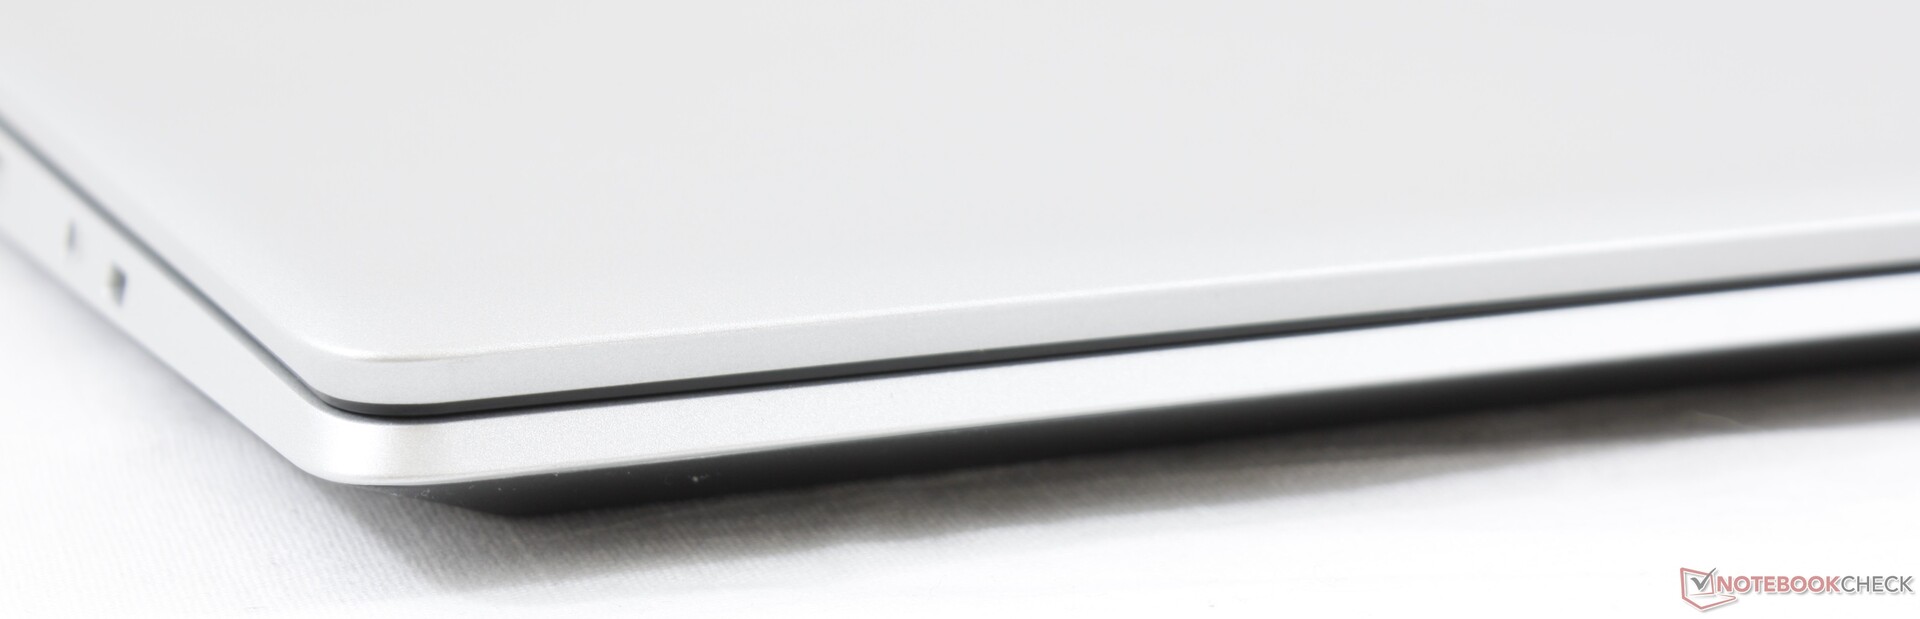
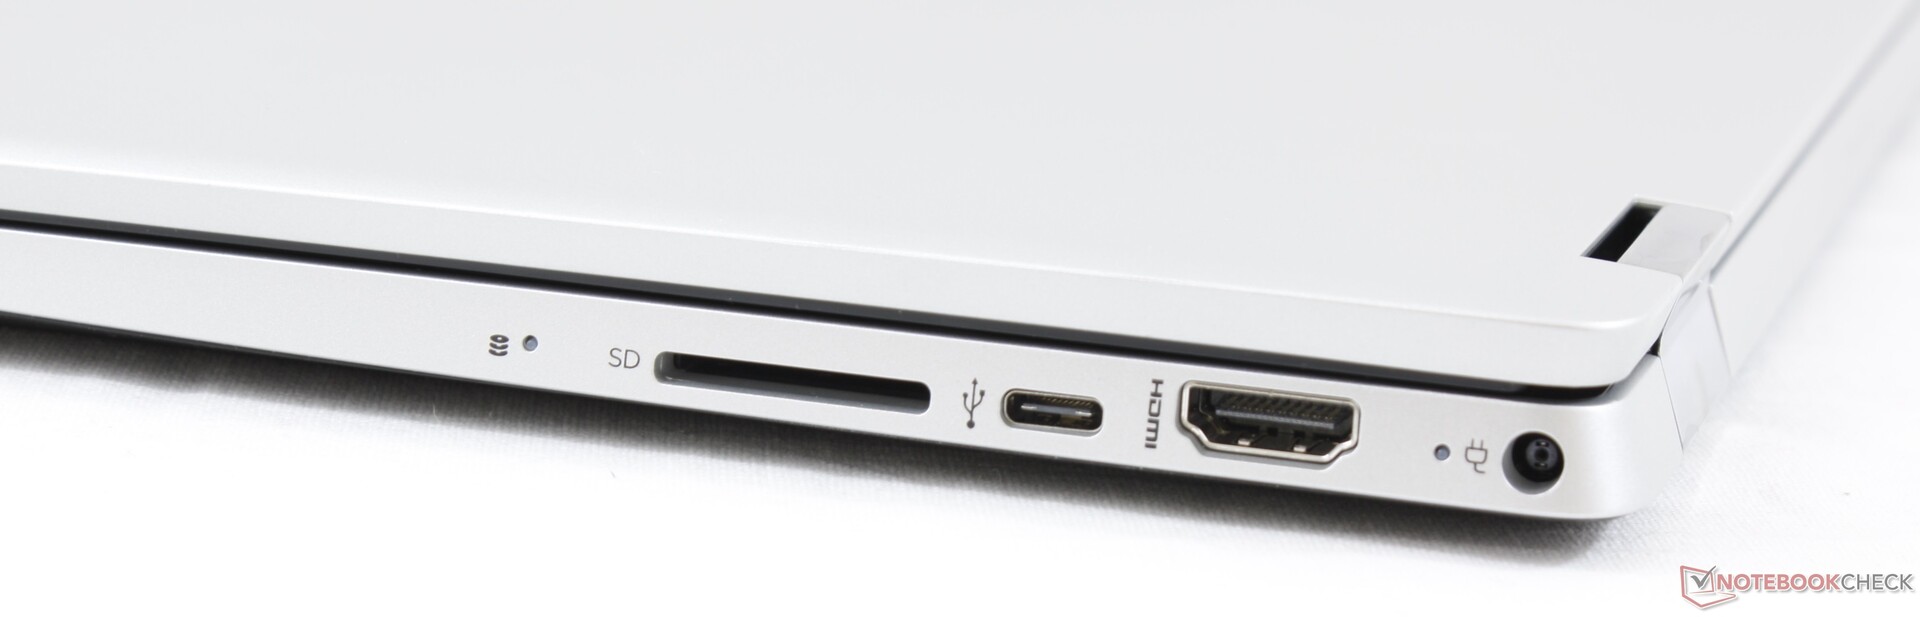
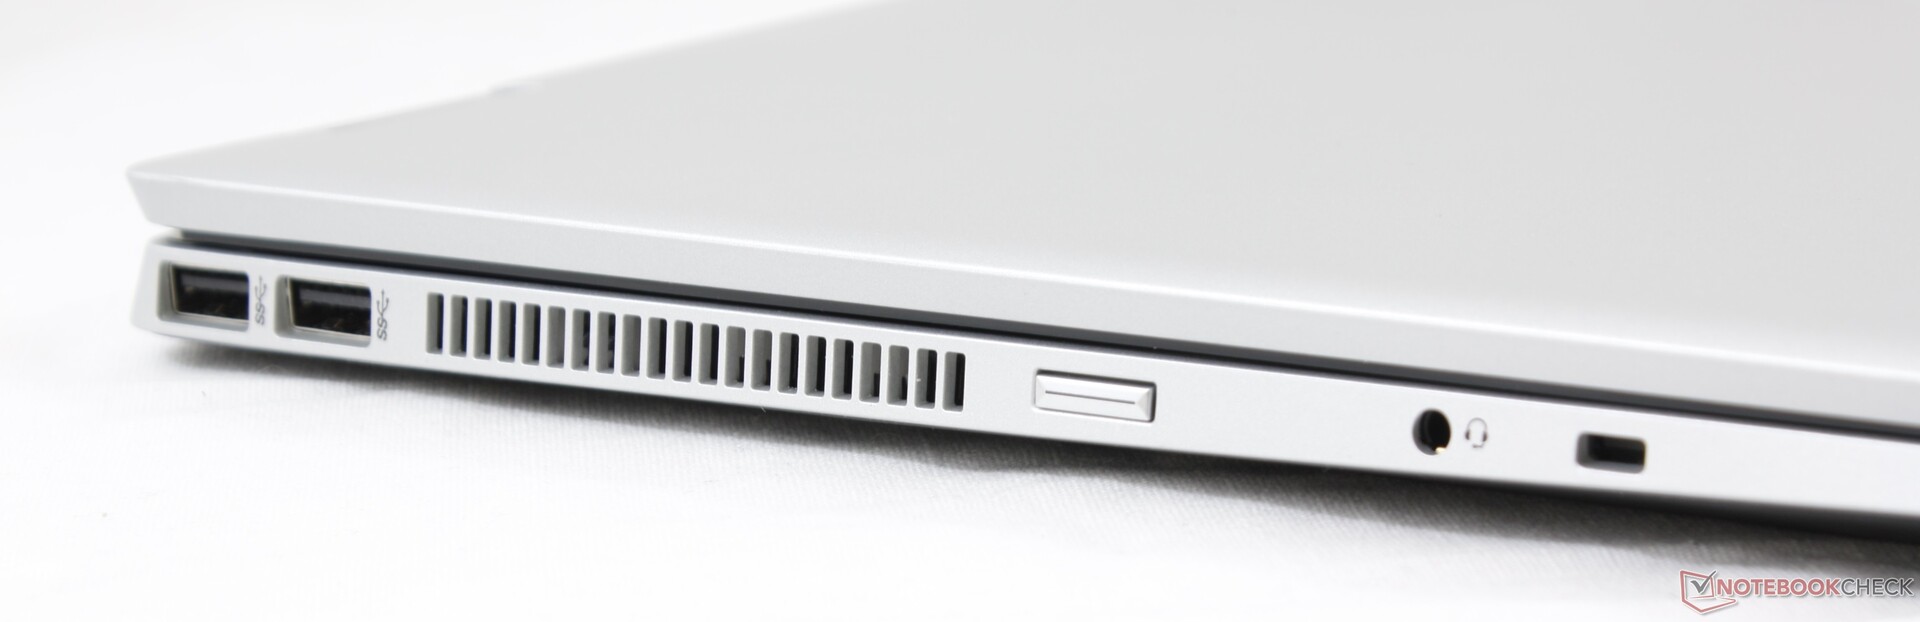
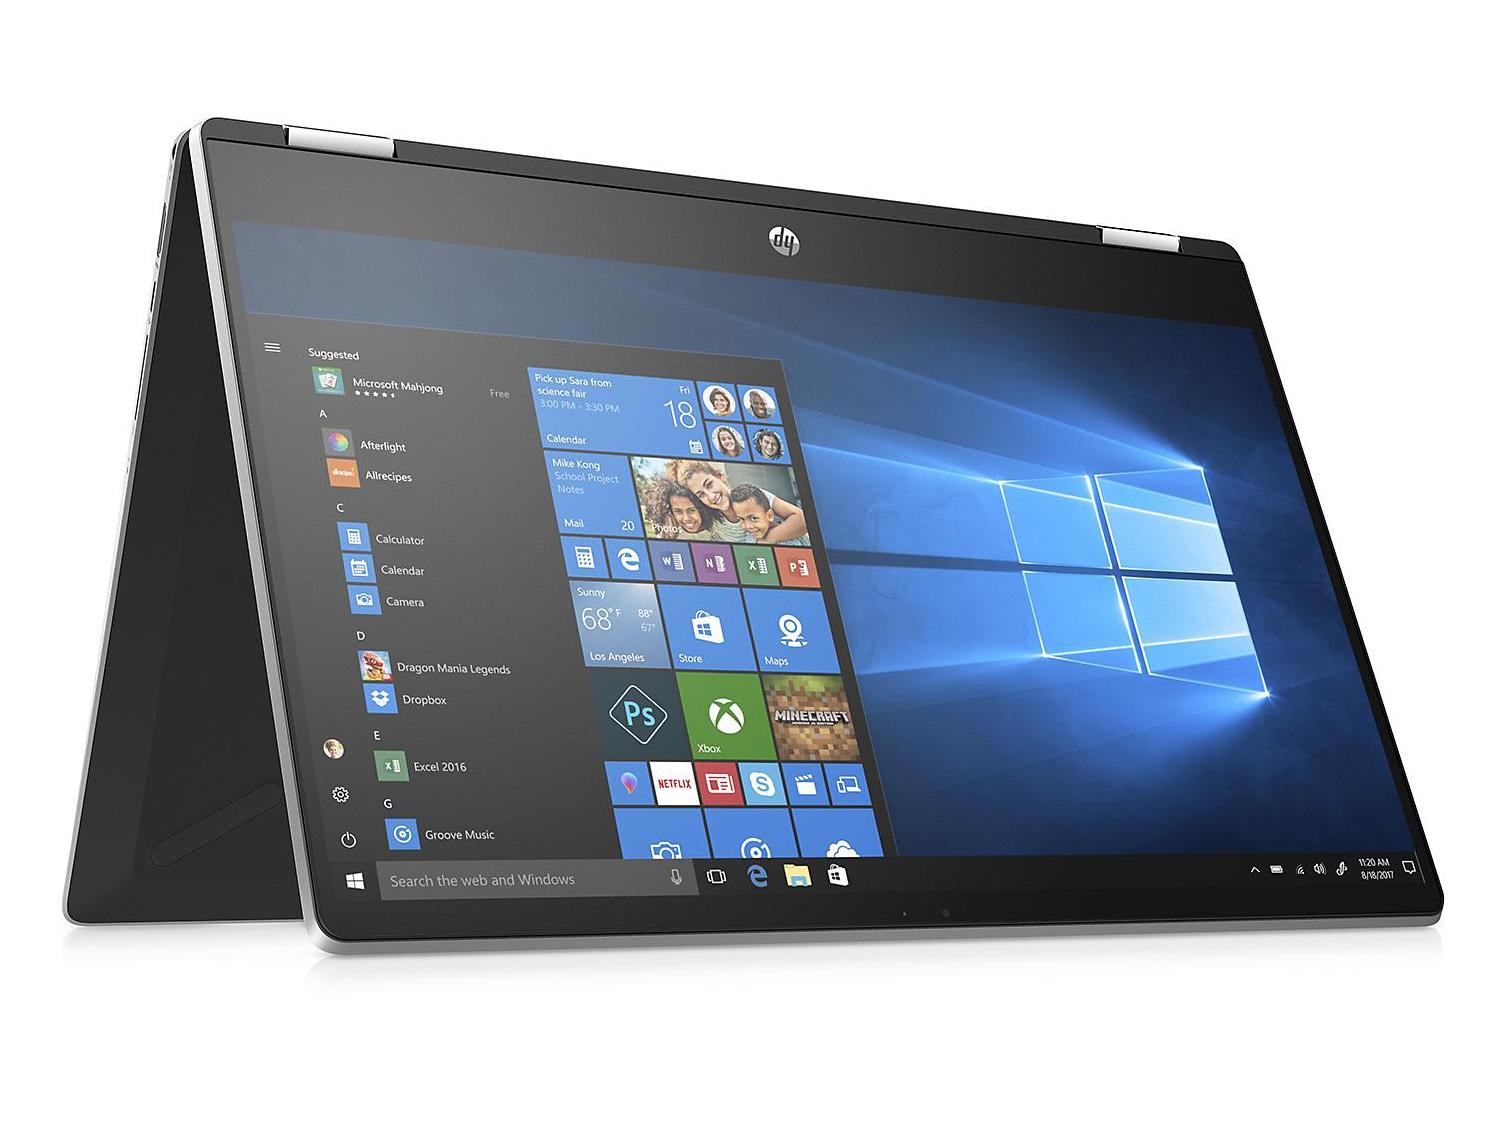
De egenskaper som till viss del förlåter 2019 års Pavilion x360 15 är tunn infattning, låg vikt och små dimensioner i förhållande till andra omvandlingsbara budgetmodeller i den här storlekskategorin. Portutbudet är respektabelt och fläkten är relativt tyst på grund av begränsad Turbo Boost och bra kärntemperaturer.
Tyvärr rasar nästan allt annat samman. Trots ett pris på 10.000 kronor har Pavilion x360 15 kort batteritid, en svag chassidesign och en av de sämsta skärmarna som går att få på en laptop med en Whiskey Lake-U CPU. TN-panelen gör att skärmen är mörk, har låg kontrast, dåliga färger och snäva betraktningsvinklar vilket nästan helt förtar fördelarna med 2-i-1 formfaktorn. En konfiguration som den här borde inte ens förekomma på den här prisnivån.
Den faktiska Pavilion x360 15-modellen är inte i sig dålig för en budgetlaptop. Enklare konfigurationer går att få tag på för runt 5.000 kronor, vilket känns mer överkomligt. Men vi rekommenderar starkt att välja 1080p-skärmen istället oavsett konfiguration. Om du inte måste ha en omvandlingsbar modell kan Walmart Motile vara ett värt alternativ.
Vår recensionsenhet är inte värd det oerhörda femsiffriga utgångspriset. Överväg istället HP Envy eller Spectre om du kan tänka dig att spendera 10.000 kronor på en ny laptop .
HP Pavilion x360 15-dq0065cl
- 02/09/2020 v7 (old)
Allen Ngo
Price comparison
