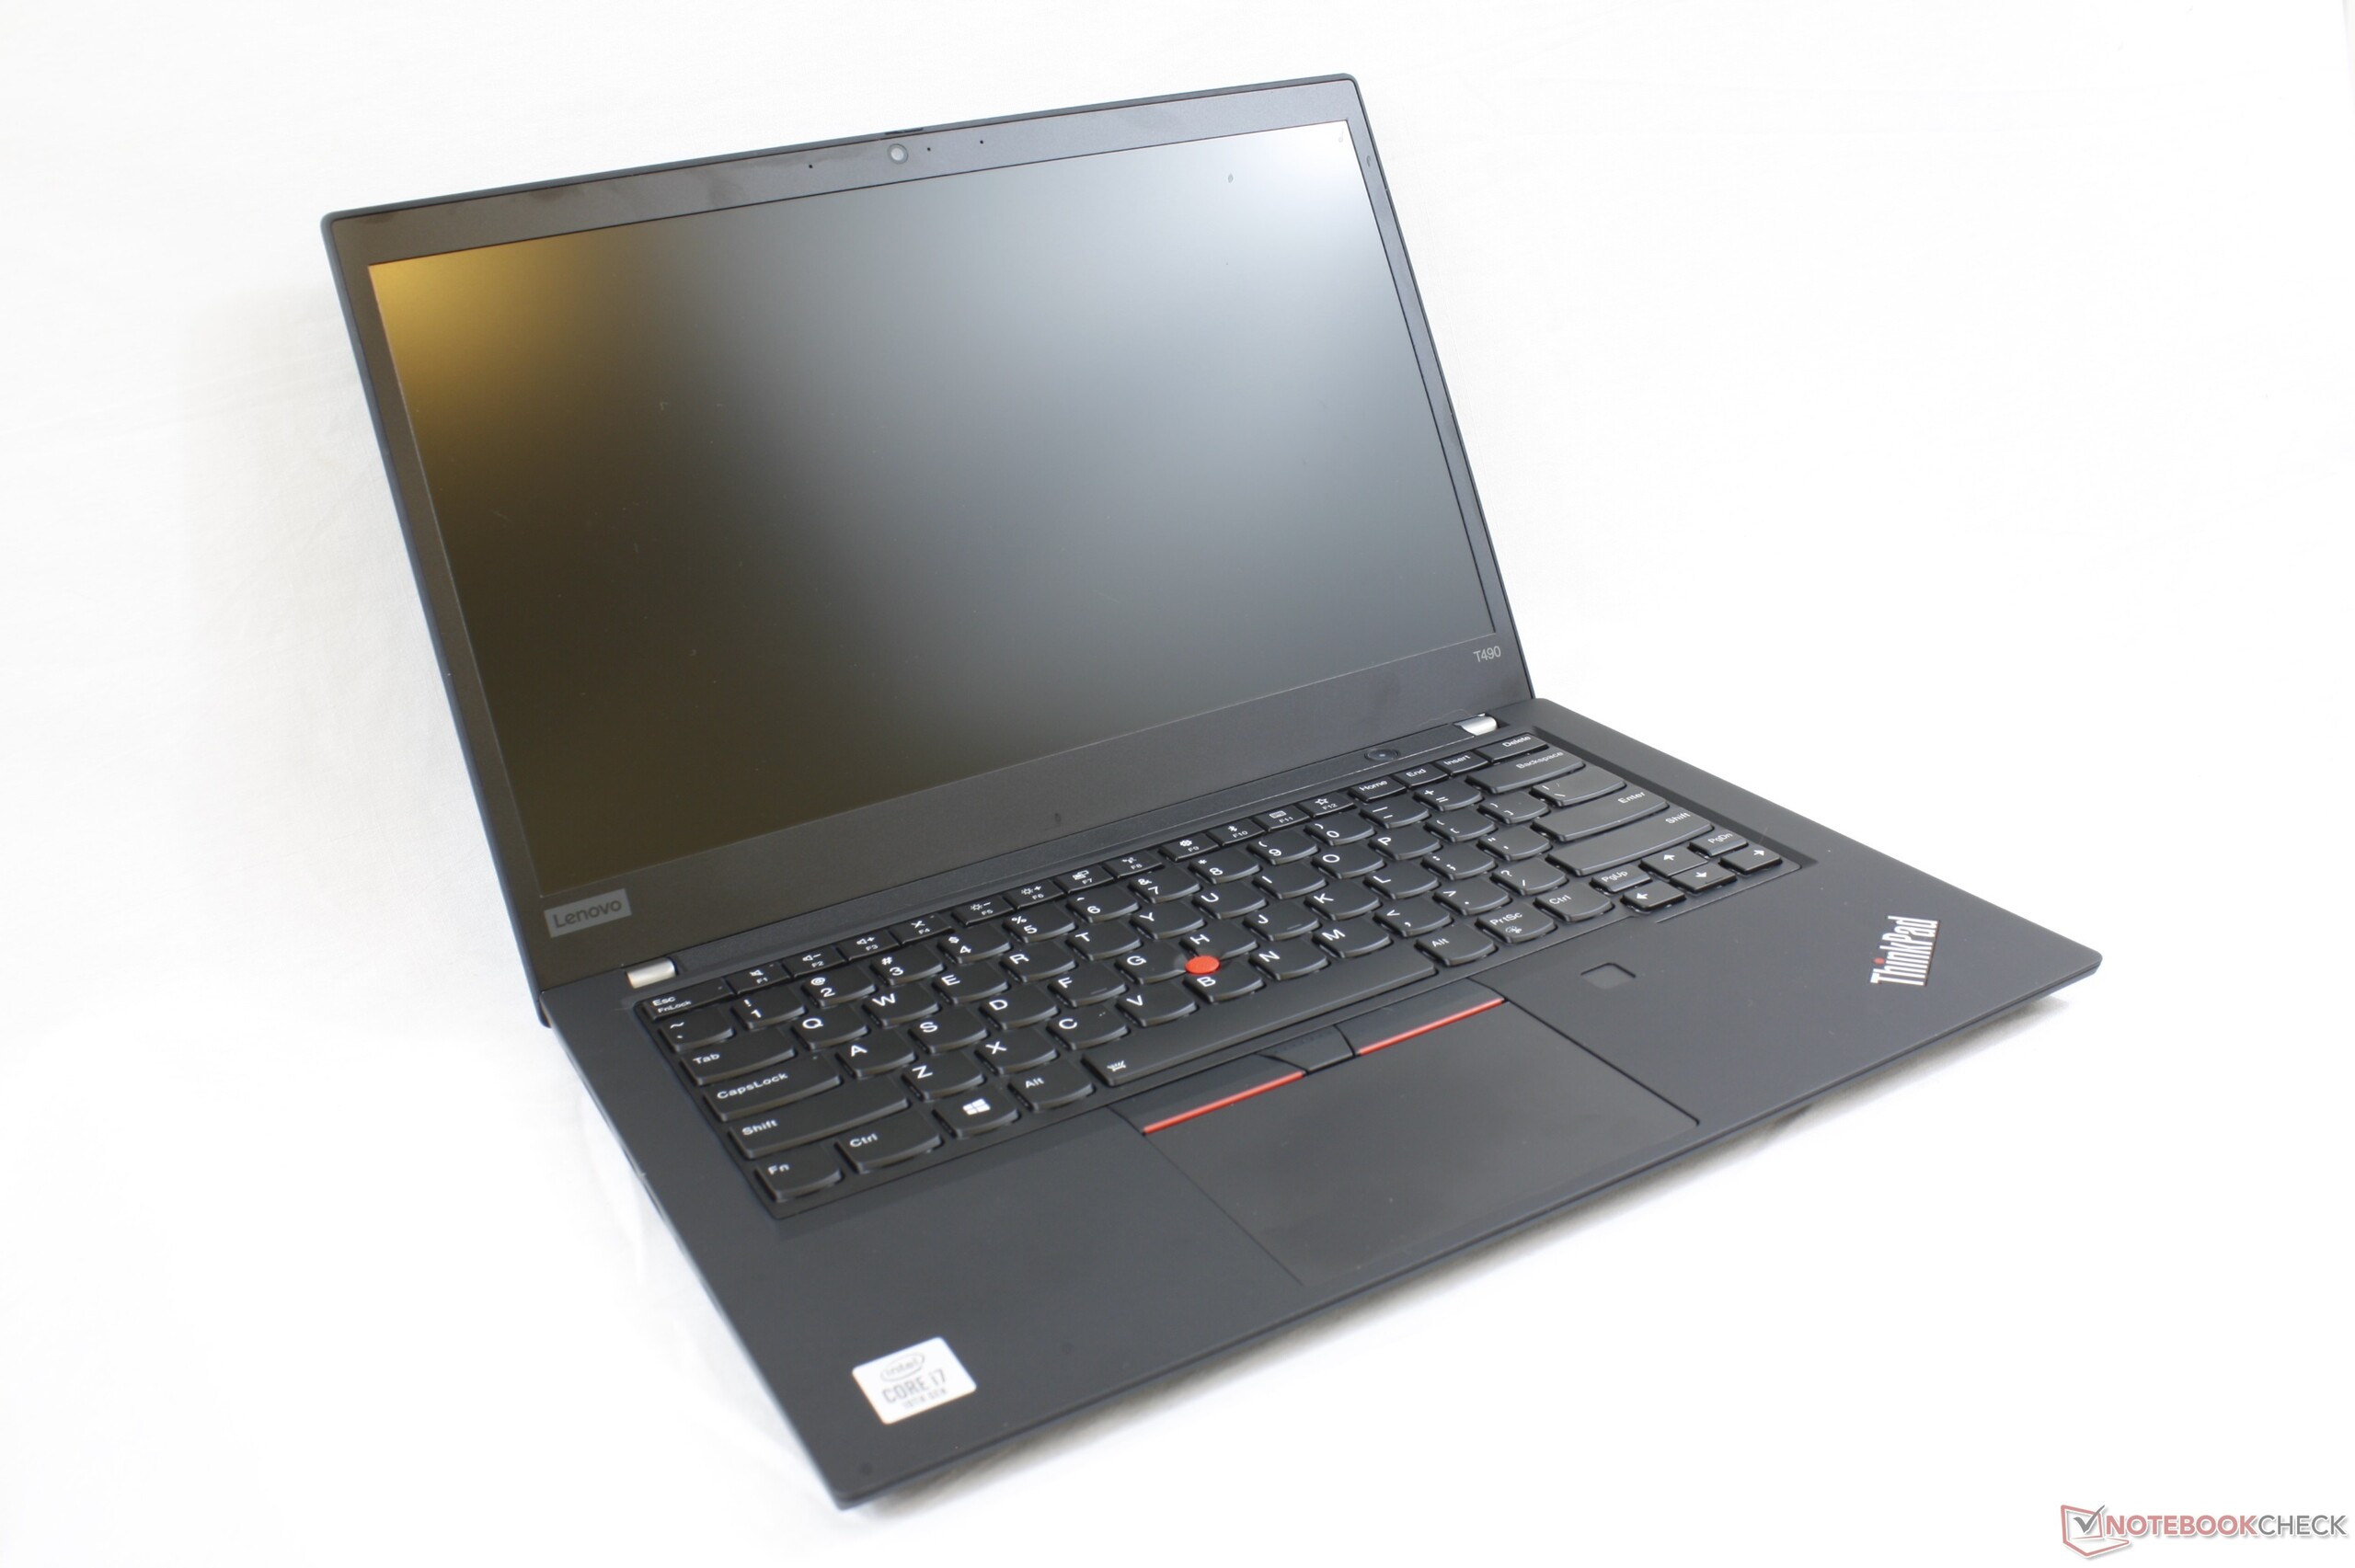
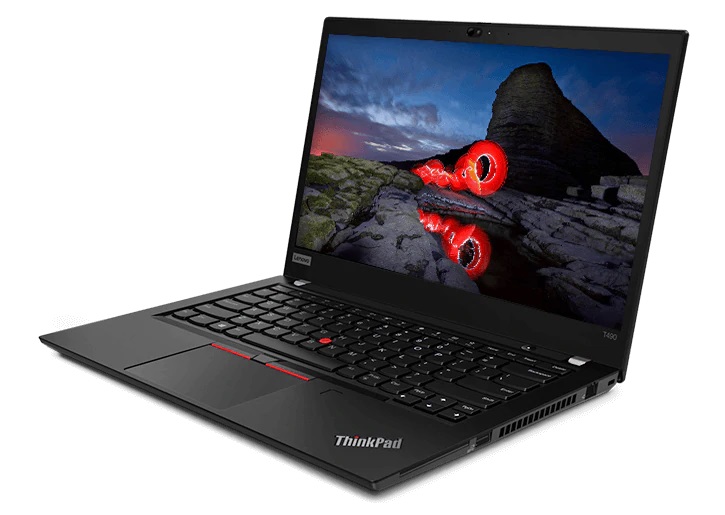
Test: Lenovo ThinkPad T490 - Uppgradering till Comet Lake-U (Sammanfattning)
Gradering | Datum | Modell | Vikt | Höjd | Storlek | Upplösning | Pris |
|---|---|---|---|---|---|---|---|
| 86.3 % v7 (old) | 03/2020 | Lenovo ThinkPad T490 20RY0002US i7-10510U, UHD Graphics 620 | 1.5 kg | 17.9 mm | 14.00" | 1920x1080 | |
| 89.6 % v6 (old) | 04/2018 | Lenovo ThinkPad T480-20L6S01V00 i5-8550U, GeForce MX150 | 1.8 kg | 20 mm | 14.00" | 1920x1080 | |
| 79.7 % v6 (old) | 08/2019 | Dell Inspiron 15 5000 5585 R7 3700U, Vega 10 | 1.8 kg | 19.5 mm | 15.60" | 1920x1080 | |
| 88.4 % v7 (old) | 10/2019 | Lenovo ThinkPad T495s-20QKS01E00 R7 PRO 3700U, Vega 10 | 1.3 kg | 16.1 mm | 14.00" | 1920x1080 | |
| 81.8 % v7 (old) | 02/2020 | Lenovo ThinkBook 15 i5-10210U, UHD Graphics 620 | 1.9 kg | 18.9 mm | 15.60" | 1920x1080 |
| SD Card Reader | |
| average JPG Copy Test (av. of 3 runs) | |
| Lenovo ThinkPad T495s-20QKS01E00 (Toshiba Exceria Pro M501 64 GB UHS-II) | |
| Lenovo ThinkPad T480-20L6S01V00 (Toshiba Exceria Pro SDXC 64 GB UHS-II) | |
| Lenovo ThinkPad T470-20HD002HGE (Toshiba Exceria Pro SDXC 64 GB UHS-II) | |
| Lenovo ThinkPad T490 20RY0002US (Toshiba Exceria Pro M501 64 GB UHS-II) | |
| Lenovo ThinkPad T460-20FN003LGE | |
| maximum AS SSD Seq Read Test (1GB) | |
| Lenovo ThinkPad T495s-20QKS01E00 (Toshiba Exceria Pro M501 64 GB UHS-II) | |
| Lenovo ThinkPad T470-20HD002HGE (Toshiba Exceria Pro SDXC 64 GB UHS-II) | |
| Lenovo ThinkPad T480-20L6S01V00 (Toshiba Exceria Pro SDXC 64 GB UHS-II) | |
| Lenovo ThinkPad T460-20FN003LGE | |
| Lenovo ThinkPad T490 20RY0002US (Toshiba Exceria Pro M501 64 GB UHS-II) | |
| Networking | |
| iperf3 transmit AX12 | |
| Lenovo ThinkPad T490 20RY0002US | |
| Acer Aspire 5 A514-52 | |
| Lenovo Yoga C740-14IML | |
| Alienware m17 R2 P41E | |
| iperf3 receive AX12 | |
| Lenovo ThinkPad T490 20RY0002US | |
| Acer Aspire 5 A514-52 | |
| Lenovo Yoga C740-14IML | |
| Alienware m17 R2 P41E | |

| |||||||||||||||||||||||||
Distribution av ljusstyrkan: 91 %
Mitt på batteriet: 305.6 cd/m²
Kontrast: 1528:1 (Svärta: 0.2 cd/m²)
ΔE ColorChecker Calman: 4.27 | ∀{0.5-29.43 Ø4.71}
calibrated: 3.66
ΔE Greyscale Calman: 2.8 | ∀{0.09-98 Ø4.96}
61.1% sRGB (Argyll 1.6.3 3D)
39.1% AdobeRGB 1998 (Argyll 1.6.3 3D)
42.37% AdobeRGB 1998 (Argyll 3D)
61.3% sRGB (Argyll 3D)
40.99% Display P3 (Argyll 3D)
Gamma: 2.33
CCT: 6416 K
| Lenovo ThinkPad T490 20RY0002US R140NWF5 RA, IPS, 14", 1920x1080 | Lenovo ThinkPad T480-20L6S01V00 Lenovo LP140WF6-SPB7, IPS, 14", 1920x1080 | Lenovo ThinkPad T470-20HD002HGE N140HCA-EAB, IPS, 14", 1920x1080 | Lenovo ThinkPad T460-20FN003LGE Lenovo LEN40A9 / N140HCE-EAA, IPS, 14", 1920x1080 | Lenovo ThinkPad T450-20BV001VGE Samsung LTN140KT14401, TN-Panel, 14", 1600x900 | Lenovo ThinkPad T495s-20QKS01E00 B140HAN05.7, IPS, 14", 1920x1080 | |
|---|---|---|---|---|---|---|
| Display | -4% | 1% | 2% | -3% | 61% | |
| Display P3 Coverage (%) | 40.99 | 39.24 -4% | 41.6 1% | 42.09 3% | 39.62 -3% | 67 63% |
| sRGB Coverage (%) | 61.3 | 58.8 -4% | 61.9 1% | 62 1% | 59.6 -3% | 96.8 58% |
| AdobeRGB 1998 Coverage (%) | 42.37 | 40.56 -4% | 43.06 2% | 43.6 3% | 40.94 -3% | 68.3 61% |
| Response Times | 18% | -5% | 11% | -32% | ||
| Response Time Grey 50% / Grey 80% * (ms) | 47.2 ? | 35.6 ? 25% | 41.6 ? 12% | 42.4 ? 10% | 60.8 ? -29% | |
| Response Time Black / White * (ms) | 28 ? | 24.8 ? 11% | 34 ? -21% | 24.8 ? 11% | 37.6 ? -34% | |
| PWM Frequency (Hz) | 980 ? | |||||
| Screen | -13% | -20% | -33% | -87% | 24% | |
| Brightness middle (cd/m²) | 305.6 | 307 0% | 306 0% | 230 -25% | 166 -46% | 380 24% |
| Brightness (cd/m²) | 293 | 295 1% | 287 -2% | 216 -26% | 163 -44% | 381 30% |
| Brightness Distribution (%) | 91 | 90 -1% | 88 -3% | 85 -7% | 68 -25% | 87 -4% |
| Black Level * (cd/m²) | 0.2 | 0.25 -25% | 0.3 -50% | 0.26 -30% | 0.71 -255% | 0.22 -10% |
| Contrast (:1) | 1528 | 1228 -20% | 1020 -33% | 885 -42% | 234 -85% | 1727 13% |
| Colorchecker dE 2000 * | 4.27 | 5.7 -33% | 6.2 -45% | 7.32 -71% | 7.16 -68% | 4 6% |
| Colorchecker dE 2000 max. * | 22.5 | 21.3 5% | 13.6 40% | 18.14 19% | 5.7 75% | |
| Colorchecker dE 2000 calibrated * | 3.66 | 4.7 -28% | 1.2 67% | |||
| Greyscale dE 2000 * | 2.8 | 3.7 -32% | 5.8 -107% | 6.98 -149% | 7.62 -172% | 4.4 -57% |
| Gamma | 2.33 94% | 2.11 104% | 2.04 108% | 2.5 88% | 2.25 98% | 2.54 87% |
| CCT | 6416 101% | 7353 88% | 6277 104% | 6683 97% | 9371 69% | 6963 93% |
| Color Space (Percent of AdobeRGB 1998) (%) | 39.1 | 37.4 -4% | 39.62 1% | 39.97 2% | 37.8 -3% | 62.2 59% |
| Color Space (Percent of sRGB) (%) | 61.1 | 58.7 -4% | 61.44 1% | 61.55 1% | 96.6 58% | |
| Totalt genomsnitt (program/inställningar) | 0% /
-7% | -8% /
-14% | -7% /
-20% | -45% /
-64% | 18% /
24% |
* ... mindre är bättre
Visa svarstider
| ↔ Svarstid svart till vitt | ||
|---|---|---|
| 28 ms ... stiga ↗ och falla ↘ kombinerat | ↗ 14.8 ms stiga | 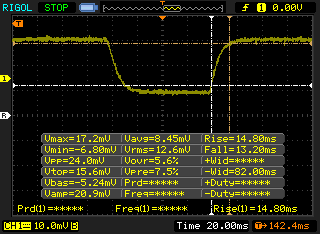 |
| ↘ 13.2 ms hösten | ||
| Skärmen visar relativt långsamma svarsfrekvenser i våra tester och kan vara för långsam för spelare. I jämförelse sträcker sig alla testade enheter från 0.1 (minst) till 240 (maximalt) ms. » 71 % av alla enheter är bättre. Detta innebär att den uppmätta svarstiden är sämre än genomsnittet av alla testade enheter (19.8 ms). | ||
| ↔ Svarstid 50 % grått till 80 % grått | ||
| 47.2 ms ... stiga ↗ och falla ↘ kombinerat | ↗ 26 ms stiga | 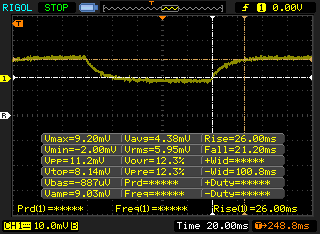 |
| ↘ 21.2 ms hösten | ||
| Skärmen visar långsamma svarsfrekvenser i våra tester och kommer att vara otillfredsställande för spelare. I jämförelse sträcker sig alla testade enheter från 0.165 (minst) till 636 (maximalt) ms. » 82 % av alla enheter är bättre. Detta innebär att den uppmätta svarstiden är sämre än genomsnittet av alla testade enheter (30.9 ms). | ||
Skärmflimmer / PWM (Puls-Width Modulation)
| Skärmflimmer / PWM upptäckt | 980 Hz | ≤ 99 % ljusstyrka inställning | 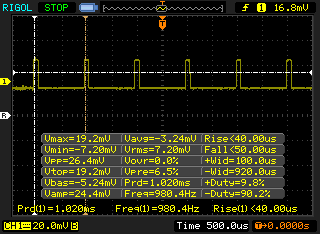 |
Displayens bakgrundsbelysning flimrar vid 980 Hz (i värsta fall, t.ex. med PWM) Flimrande upptäckt vid en ljusstyrkeinställning på 99 % och lägre. Det ska inte finnas något flimmer eller PWM över denna ljusstyrkeinställning. Frekvensen för 980 Hz är ganska hög, så de flesta användare som är känsliga för PWM bör inte märka något flimmer. Som jämförelse: 52 % av alla testade enheter använder inte PWM för att dämpa skärmen. Om PWM upptäcktes mättes ett medelvärde av 7741 (minst: 5 - maximum: 343500) Hz. | |||
| Cinebench R10 | |
| Rendering Multiple CPUs 32Bit | |
| Microsoft Surface Laptop 3 13 Core i5-1035G7 | |
| Genomsnitt Intel Core i7-10510U (6763 - 26265, n=3) | |
| Rendering Single 32Bit | |
| Genomsnitt Intel Core i7-10510U (5740 - 7748, n=3) | |
| Microsoft Surface Laptop 3 13 Core i5-1035G7 | |
| wPrime 2.10 - 1024m | |
| Microsoft Surface Laptop 3 13 Core i5-1035G7 | |
* ... mindre är bättre
| PCMark 8 Home Score Accelerated v2 | 3883 poäng | |
| PCMark 8 Work Score Accelerated v2 | 5293 poäng | |
| PCMark 10 Score | 4661 poäng | |
Hjälp | ||
| Lenovo ThinkPad T490 20RY0002US Sabrent Rocket Q 1TB RKT30Q.1 | Lenovo ThinkPad T480-20L6S01V00 Samsung SSD PM981 MZVLB512HAJQ | Lenovo ThinkPad T460-20FN003LGE Toshiba HG6 THNSFJ256GCSU | Lenovo ThinkPad T470s-20HF0012US Samsung PM961 MZVLW256HEHP | Lenovo ThinkPad T450-20BV001VGE Samsung SSD PM851 256 GB MZ7TE256HMHP | Lenovo ThinkPad T495s-20QKS01E00 Samsung PM981a MZVLB1T0HBLR | |
|---|---|---|---|---|---|---|
| AS SSD | -282% | -76% | -3% | -60% | 15% | |
| Seq Read (MB/s) | 2073 | 1441 -30% | 503 -76% | 2691 30% | 508 -75% | 2661 28% |
| Seq Write (MB/s) | 1865 | 487.1 -74% | 432.8 -77% | 1170 -37% | 230 -88% | 2314 24% |
| 4K Read (MB/s) | 50.9 | 58 14% | 19.57 -62% | 48.84 -4% | 33.9 -33% | 45.52 -11% |
| 4K Write (MB/s) | 157.6 | 1.76 -99% | 62.6 -60% | 147.9 -6% | 98.7 -37% | 105.3 -33% |
| 4K-64 Read (MB/s) | 689 | 1278 85% | 347 -50% | 1765 156% | 362.7 -47% | 1806 162% |
| 4K-64 Write (MB/s) | 1615 | 96.2 -94% | 114.5 -93% | 538 -67% | 184.2 -89% | 1650 2% |
| Access Time Read * (ms) | 0.043 | 0.041 5% | 0.133 -209% | 0.06 -40% | 0.04 7% | |
| Access Time Write * (ms) | 0.07 | 2.515 -3493% | 0.061 13% | 0.025 64% | 0.033 53% | 0.041 41% |
| Score Read (Points) | 947 | 1480 56% | 417 -56% | 2083 120% | 447 -53% | 2118 124% |
| Score Write (Points) | 1959 | 147 -92% | 220 -89% | 803 -59% | 306 -84% | 1986 1% |
| Score Total (Points) | 3394 | 2348 -31% | 852 -75% | 3875 14% | 980 -71% | 5169 52% |
| Copy ISO MB/s (MB/s) | 3024 | 921 -70% | 797 -74% | 225.8 -93% | 1131 -63% | |
| Copy Program MB/s (MB/s) | 715 | 254.8 -64% | 291 -59% | 153.3 -79% | 267.1 -63% | |
| Copy Game MB/s (MB/s) | 1650 | 676 -59% | 309.9 -81% | 191.2 -88% | 691 -58% | |
| CrystalDiskMark 5.2 / 6 | -28% | -15% | ||||
| Write 4K (MB/s) | 227.2 | 153.1 -33% | 142.3 -37% | |||
| Read 4K (MB/s) | 55.3 | 48.3 -13% | 46.69 -16% | |||
| Write Seq (MB/s) | 1411 | 866 -39% | ||||
| Read Seq (MB/s) | 1046 | 904 -14% | ||||
| Write 4K Q32T1 (MB/s) | 643 | 424.6 -34% | 268.3 -58% | |||
| Read 4K Q32T1 (MB/s) | 625 | 403.2 -35% | 359.6 -42% | |||
| Write Seq Q32T1 (MB/s) | 1972 | 1725 -13% | 3033 54% | |||
| Read Seq Q32T1 (MB/s) | 3247 | 1780 -45% | 3561 10% | |||
| Write 4K Q8T8 (MB/s) | 1491 | |||||
| Read 4K Q8T8 (MB/s) | 1499 | |||||
| Totalt genomsnitt (program/inställningar) | -155% /
-190% | -76% /
-76% | -3% /
-3% | -60% /
-60% | 0% /
6% |
* ... mindre är bättre

| 3DMark 11 Performance | 2218 poäng | |
| 3DMark Cloud Gate Standard Score | 9432 poäng | |
| 3DMark Fire Strike Score | 1234 poäng | |
| 3DMark Time Spy Score | 492 poäng | |
Hjälp | ||
| låg | med. | hög | ultra | |
|---|---|---|---|---|
| BioShock Infinite (2013) | 87 | 41.5 | 34.5 | 10.8 |
| Lenovo ThinkPad T490 20RY0002US UHD Graphics 620, i7-10510U, Sabrent Rocket Q 1TB RKT30Q.1 | Lenovo ThinkPad T480-20L6S01V00 GeForce MX150, i5-8550U, Samsung SSD PM981 MZVLB512HAJQ | Lenovo ThinkPad T470-20HD002HGE HD Graphics 620, i5-7200U, Samsung PM961 NVMe MZVLW512HMJP | Lenovo ThinkPad T460-20FN003LGE HD Graphics 520, 6200U, Toshiba HG6 THNSFJ256GCSU | Lenovo ThinkPad T450-20BV001VGE HD Graphics 5500, 5200U, Samsung SSD PM851 256 GB MZ7TE256HMHP | Lenovo ThinkPad T495s-20QKS01E00 Vega 10, R7 PRO 3700U, Samsung PM981a MZVLB1T0HBLR | |
|---|---|---|---|---|---|---|
| Noise | -0% | 4% | -1% | 0% | 3% | |
| av / miljö * (dB) | 28.2 | 29 -3% | 28 1% | 29 -3% | 28.9 -2% | |
| Idle Minimum * (dB) | 28.2 | 29 -3% | 28 1% | 29 -3% | 29.2 -4% | 28.9 -2% |
| Idle Average * (dB) | 28.2 | 29 -3% | 28 1% | 29 -3% | 29.2 -4% | 28.9 -2% |
| Idle Maximum * (dB) | 29.2 | 29 1% | 29.4 -1% | 29 1% | 29.2 -0% | 28.9 1% |
| Load Average * (dB) | 35.5 | 35.6 -0% | 31.4 12% | 34.2 4% | 34.9 2% | 31.5 11% |
| Load Maximum * (dB) | 38 | 35.6 6% | 34.6 9% | 37.8 1% | 35.1 8% | 33.8 11% |
| Witcher 3 ultra * (dB) | 32.5 |
* ... mindre är bättre
Ljudnivå
| Låg belastning |
| 28.2 / 28.2 / 29.2 dB(A) |
| Hög belastning |
| 35.5 / 38 dB(A) |
 | ||
30 dB tyst 40 dB(A) hörbar 50 dB(A) högt ljud |
||
min: | ||
(-) Den maximala temperaturen på ovansidan är 50.8 °C / 123 F, jämfört med genomsnittet av 34.3 °C / 94 F , allt från 21.2 till 62.5 °C för klassen Office.
(-) Botten värms upp till maximalt 61.6 °C / 143 F, jämfört med genomsnittet av 36.8 °C / 98 F
(+) Vid tomgångsbruk är medeltemperaturen för ovansidan 29.1 °C / 84 F, jämfört med enhetsgenomsnittet på 29.5 °C / ### class_avg_f### F.
(+) Handledsstöden och pekplattan når maximal hudtemperatur (32.4 °C / 90.3 F) och är därför inte varma.
(-) Medeltemperaturen för handledsstödsområdet på liknande enheter var 27.6 °C / 81.7 F (-4.8 °C / -8.6 F).
| Av/Standby | |
| Låg belastning | |
| Hög belastning |
|
Förklaring:
min: | |
| Lenovo ThinkPad T490 20RY0002US i7-10510U, UHD Graphics 620, Sabrent Rocket Q 1TB RKT30Q.1, IPS, 1920x1080, 14" | Lenovo ThinkPad T480-20L6S01V00 i5-8550U, GeForce MX150, Samsung SSD PM981 MZVLB512HAJQ, IPS, 1920x1080, 14" | Lenovo ThinkPad T470-20HD002HGE i5-7200U, HD Graphics 620, Samsung PM961 NVMe MZVLW512HMJP, IPS, 1920x1080, 14" | Lenovo ThinkPad T460-20FN003LGE 6200U, HD Graphics 520, Toshiba HG6 THNSFJ256GCSU, IPS, 1920x1080, 14" | Lenovo ThinkPad T450-20BV001VGE 5200U, HD Graphics 5500, Samsung SSD PM851 256 GB MZ7TE256HMHP, TN-Panel, 1600x900, 14" | Lenovo ThinkPad T495s-20QKS01E00 R7 PRO 3700U, Vega 10, Samsung PM981a MZVLB1T0HBLR, IPS, 1920x1080, 14" | |
|---|---|---|---|---|---|---|
| Power Consumption | -20% | 22% | 18% | 24% | -5% | |
| Idle Minimum * (Watt) | 4.3 | 3.6 16% | 3.21 25% | 3.5 19% | 3 30% | 4.7 -9% |
| Idle Average * (Watt) | 7 | 7.1 -1% | 6.15 12% | 6.7 4% | 5.5 21% | 7.28 -4% |
| Idle Maximum * (Watt) | 7.2 | 9.5 -32% | 6.82 5% | 7.3 -1% | 6.4 11% | 9.48 -32% |
| Load Average * (Watt) | 34.9 | 63.9 -83% | 28.5 18% | 28.2 19% | 28.4 19% | 35.3 -1% |
| Load Maximum * (Watt) | 68.4 | 67.3 2% | 34.5 50% | 34.6 49% | 40.7 40% | 55.5 19% |
| Witcher 3 ultra * (Watt) | 53.9 |
* ... mindre är bättre
| Lenovo ThinkPad T490 20RY0002US i7-10510U, UHD Graphics 620, 50 Wh | Lenovo ThinkPad T480-20L6S01V00 i5-8550U, GeForce MX150, 72 Wh | Lenovo ThinkPad T470-20HD002HGE i5-7200U, HD Graphics 620, 48 Wh | Lenovo ThinkPad T460-20FN003LGE 6200U, HD Graphics 520, 46 Wh | Lenovo ThinkPad T450-20BV001VGE 5200U, HD Graphics 5500, 48 Wh | Lenovo ThinkPad T495s-20QKS01E00 R7 PRO 3700U, Vega 10, 57 Wh | |
|---|---|---|---|---|---|---|
| Batteridrifttid | 57% | -13% | -33% | -36% | 35% | |
| WiFi v1.3 (h) | 8.4 | 13.2 57% | 7.3 -13% | 5.6 -33% | 5.4 -36% | 11.3 35% |
| Reader / Idle (h) | 27.9 | 15.9 | 15.6 | |||
| Load (h) | 2.7 | 1.8 | 1.6 | 1.6 |
För
Emot

Läs den fullständiga versionen av den här recensionen på engelska här.
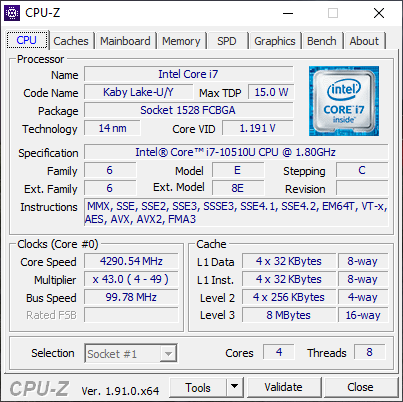
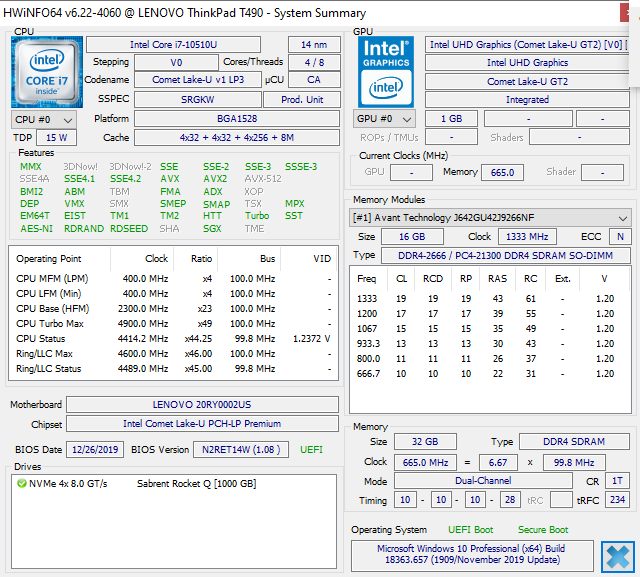
Som vi noterade i vår ursprungliga översikt över den här serien är prestandafördelarna som Comet Lake-U har jämfört med Whiskey Lake-U minimala med undantag för sexkärniga Core i7-10710U, som tyvärr inte finns till ThinkPad T490. Det går bara att konfigurera den upp till fyrkärniga Core i7-10510U.
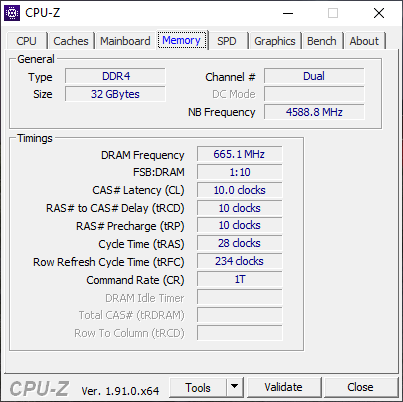
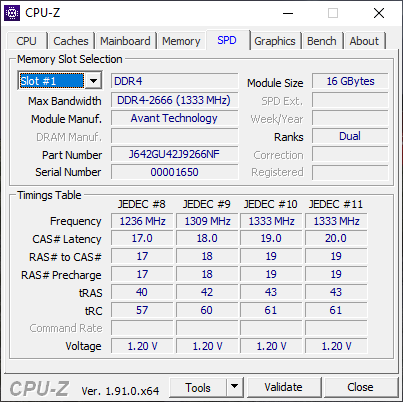
Utöver CPU-uppdateringen har Comet Lake U-varianterna av ThinkPad T490 snabbare RAM (DDR4-2400 till DDR4-2666) och snabbare WiFi (802.11ac till 802.11ax) än de äldre Whiskey Lake U-modellerna. Skillnaderna mellan generationerna är återigen marginella som bäst.
För mesta möjliga utdelning för pengarna rekommenderar vi istället den äldre Whiskey Lake-U konfigurationen med en av Lenovos mer ljusstarka skärmalternativ. T490 har en FHD-skärm på 400 nit och en WQHD-skärm på 500 nit som båda är mer ljusstarka än den skärm på 300 nit som vi får här. Att investera i en bättre skärm är en mycket mer påtaglig uppgradering än att gå från Intels 8:e generation till deras 10:e.
Förändringarna för CPU, RAM och WLAN är väldigt små jämfört med förra årets modell. Om du vill ha en ThinkPad på 14 tum från T-serien, vänta istället på ThinkPad T14 eller välj helt enkelt en konfiguration av T490 med Whiskey Lake-U.
Lenovo ThinkPad T490 20RY0002US
- 03/06/2020 v7 (old)
Allen Ngo
Price comparison
