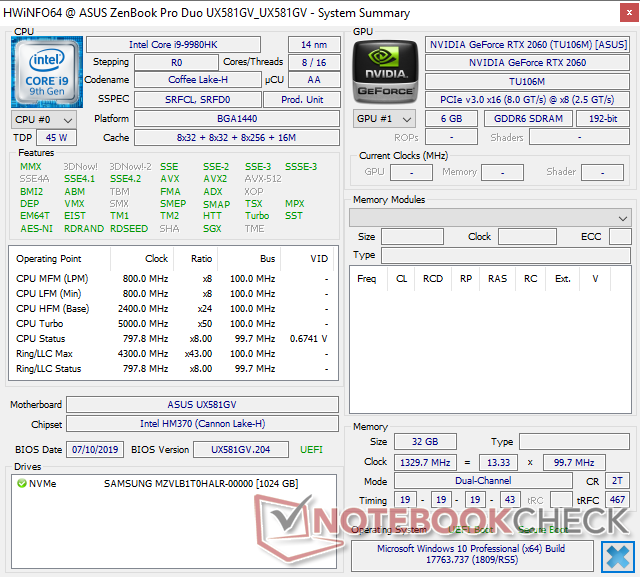
Test: Asus ZenBook Pro Duo UX581 - En fullpumpad ZenBook (Sammanfattning)
| |||||||||||||||||||||||||
Distribution av ljusstyrkan: 94 %
Mitt på batteriet: 359.7 cd/m²
Kontrast: ∞:1 (Svärta: 0 cd/m²)
ΔE ColorChecker Calman: 5.14 | ∀{0.5-29.43 Ø4.73}
ΔE Greyscale Calman: 2.7 | ∀{0.09-98 Ø4.97}
81.3% sRGB (Argyll 1.6.3 3D)
61.8% AdobeRGB 1998 (Argyll 1.6.3 3D)
67.3% AdobeRGB 1998 (Argyll 3D)
81% sRGB (Argyll 3D)
63.5% Display P3 (Argyll 3D)
Gamma: 2
CCT: 6220 K
| Asus ZenBook Pro Duo UX581GV Samsung SDCA029, OLED, 15.6", 3840x2160 | Asus ZenBook Pro 15 UX580GE AU Optronics B156ZAN03.1, IPS, 15.6", 3840x2160 | Asus ZenBook 15 UX533FD BOE07D8, IPS, 15.6", 1920x1080 | Asus Strix Scar III G531GW Sharp LQ156M1JW09 (SHP14D3), IPS, 15.6", 1920x1080 | HP Omen X 2S 15-dg0075cl AU Optronics AUO82ED, IPS, 15.6", 1920x1080 | Dell XPS 15 7590 9980HK GTX 1650 Samsung 156WR04, SDCA029, OLED, 15.6", 3840x2160 | |
|---|---|---|---|---|---|---|
| Display | 35% | 4% | 8% | 6% | 33% | |
| Display P3 Coverage (%) | 63.5 | 85.9 35% | 67.2 6% | 66.2 4% | 66.2 4% | 88.1 39% |
| sRGB Coverage (%) | 81 | 100 23% | 88.4 9% | 96.5 19% | 92.3 14% | 99.6 23% |
| AdobeRGB 1998 Coverage (%) | 67.3 | 99.1 47% | 64.6 -4% | 67.5 0% | 67.2 0% | 91.8 36% |
| Response Times | -1339% | -1634% | -507% | -453% | 2% | |
| Response Time Grey 50% / Grey 80% * (ms) | 2.2 ? | 44 ? -1900% | 45 ? -1945% | 17.2 ? -682% | 15.2 ? -591% | 2.3 ? -5% |
| Response Time Black / White * (ms) | 2.6 ? | 22.8 ? -777% | 37 ? -1323% | 11.2 ? -331% | 10.8 ? -315% | 2.4 ? 8% |
| PWM Frequency (Hz) | 240.4 ? | 24040 ? | 59.5 ? | |||
| Screen | 9% | -18% | 11% | -15% | 1% | |
| Brightness middle (cd/m²) | 359.7 | 357.6 -1% | 311 -14% | 266 -26% | 324.8 -10% | 421.2 17% |
| Brightness (cd/m²) | 366 | 350 -4% | 303 -17% | 252 -31% | 316 -14% | 417 14% |
| Brightness Distribution (%) | 94 | 85 -10% | 81 -14% | 88 -6% | 84 -11% | 94 0% |
| Black Level * (cd/m²) | 0.35 | 0.24 | 0.27 | 0.26 | ||
| Colorchecker dE 2000 * | 5.14 | 4.12 20% | 5.1 1% | 1.81 65% | 4.96 4% | 6.06 -18% |
| Colorchecker dE 2000 max. * | 7.77 | 9.91 -28% | 8.91 -15% | 3.23 58% | 8.95 -15% | 11.89 -53% |
| Greyscale dE 2000 * | 2.7 | 1.8 33% | 4.93 -83% | 2.44 10% | 5 -85% | 2.8 -4% |
| Gamma | 2 110% | 2.17 101% | 2.44 90% | 2.42 91% | 2.21 100% | 2.15 102% |
| CCT | 6220 105% | 6613 98% | 7641 85% | 7005 93% | 7742 84% | 6235 104% |
| Color Space (Percent of AdobeRGB 1998) (%) | 61.8 | 87.5 42% | 58 -6% | 62 0% | 59.8 -3% | 81 31% |
| Color Space (Percent of sRGB) (%) | 81.3 | 100 23% | 88 8% | 97 19% | 91.8 13% | 99.6 23% |
| Contrast (:1) | 1022 | 1296 | 985 | 1249 | ||
| Colorchecker dE 2000 calibrated * | 4.23 | 2.48 | 1.03 | 3.23 | ||
| Totalt genomsnitt (program/inställningar) | -432% /
-192% | -549% /
-261% | -163% /
-69% | -154% /
-78% | 12% /
9% |
* ... mindre är bättre
Visa svarstider
| ↔ Svarstid svart till vitt | ||
|---|---|---|
| 2.6 ms ... stiga ↗ och falla ↘ kombinerat | ↗ 1 ms stiga | 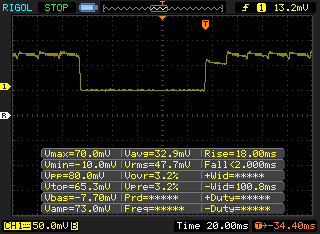 |
| ↘ 1.6 ms hösten | ||
| Skärmen visar väldigt snabba svarsfrekvenser i våra tester och borde vara mycket väl lämpad för fartfyllt spel. I jämförelse sträcker sig alla testade enheter från 0.1 (minst) till 240 (maximalt) ms. » 13 % av alla enheter är bättre. Det betyder att den uppmätta svarstiden är bättre än genomsnittet av alla testade enheter (19.9 ms). | ||
| ↔ Svarstid 50 % grått till 80 % grått | ||
| 2.2 ms ... stiga ↗ och falla ↘ kombinerat | ↗ 1 ms stiga | 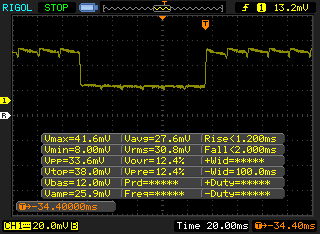 |
| ↘ 1.2 ms hösten | ||
| Skärmen visar väldigt snabba svarsfrekvenser i våra tester och borde vara mycket väl lämpad för fartfyllt spel. I jämförelse sträcker sig alla testade enheter från 0.165 (minst) till 636 (maximalt) ms. » 11 % av alla enheter är bättre. Det betyder att den uppmätta svarstiden är bättre än genomsnittet av alla testade enheter (31.1 ms). | ||
Skärmflimmer / PWM (Puls-Width Modulation)
| Skärmflimmer / PWM upptäckt | 240.4 Hz | ≤ 52 % ljusstyrka inställning | 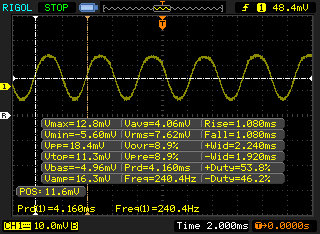 |
Displayens bakgrundsbelysning flimrar vid 240.4 Hz (i värsta fall, t.ex. med PWM) Flimrande upptäckt vid en ljusstyrkeinställning på 52 % och lägre. Det ska inte finnas något flimmer eller PWM över denna ljusstyrkeinställning. Frekvensen för 240.4 Hz är relativt låg, så känsliga användare kommer sannolikt att märka flimmer och uppleva ansträngda ögon vid den angivna ljusstyrkeinställningen och nedan. Som jämförelse: 52 % av alla testade enheter använder inte PWM för att dämpa skärmen. Om PWM upptäcktes mättes ett medelvärde av 7798 (minst: 5 - maximum: 343500) Hz. | |||
| PCMark 8 Home Score Accelerated v2 | 4157 poäng | |
| PCMark 8 Work Score Accelerated v2 | 5279 poäng | |
| PCMark 10 Score | 5654 poäng | |
Hjälp | ||
| Asus ZenBook Pro Duo UX581GV Samsung SSD PM981 MZVLB1T0HALR | Asus ZenBook Pro 15 UX580GE Samsung SSD PM961 1TB M.2 PCIe 3.0 x4 NVMe (MZVLW1T0) | Asus ZenBook 15 UX533FD WDC PC SN520 SDAPNUW-512G | Dell XPS 15 7590 9980HK GTX 1650 Toshiba XG6 KXG60ZNV1T02 | Asus Strix Scar III G531GW Intel SSD 660p 1TB SSDPEKNW010T8 | HP Omen X 2S 15-dg0075cl WDC PC SN720 SDAPNTW-1T00 | |
|---|---|---|---|---|---|---|
| AS SSD | -0% | -23% | 7% | -37% | 16% | |
| Seq Read (MB/s) | 1409 | 2099 49% | 579 -59% | 1723 22% | 1574 12% | 2105 49% |
| Seq Write (MB/s) | 1316 | 1729 31% | 411.8 -69% | 1386 5% | 1591 21% | 2493 89% |
| 4K Read (MB/s) | 44.99 | 37.78 -16% | 41.81 -7% | 43.25 -4% | 26.79 -40% | 25.01 -44% |
| 4K Write (MB/s) | 93 | 100.9 8% | 131.6 42% | 98.3 6% | 105.1 13% | 108.7 17% |
| 4K-64 Read (MB/s) | 1092 | 1431 31% | 975 -11% | 1078 -1% | 583 -47% | 1604 47% |
| 4K-64 Write (MB/s) | 1810 | 1273 -30% | 1047 -42% | 1456 -20% | 603 -67% | 1593 -12% |
| Access Time Read * (ms) | 0.041 | 0.04 2% | 0.08 -95% | 0.05 -22% | 0.128 -212% | 0.046 -12% |
| Access Time Write * (ms) | 0.118 | 0.036 69% | 0.027 77% | 0.039 67% | 0.043 64% | 0.102 14% |
| Score Read (Points) | 1278 | 1679 31% | 1075 -16% | 1294 1% | 768 -40% | 1840 44% |
| Score Write (Points) | 2034 | 1547 -24% | 1220 -40% | 1693 -17% | 867 -57% | 1951 -4% |
| Score Total (Points) | 3970 | 4065 2% | 2845 -28% | 3638 -8% | 2033 -49% | 4743 19% |
| Copy ISO MB/s (MB/s) | 2112 | 1045 -51% | 3182 51% | 2250 7% | ||
| Copy Program MB/s (MB/s) | 874 | 430.9 -51% | 984 13% | 896 3% | ||
| Copy Game MB/s (MB/s) | 1677 | 728 -57% | 1824 9% | 1854 11% |
* ... mindre är bättre

| 3DMark | |
| 1280x720 Cloud Gate Standard Graphics | |
| Corsair One i160 | |
| Asus Zephyrus GX501 | |
| Asus ROG G703GX | |
| MSI RTX 2060 Gaming Z 6G | |
| Eurocom Nightsky Ti15 | |
| Asus G752VS-BA338T | |
| Genomsnitt NVIDIA GeForce RTX 2060 Mobile (55324 - 116593, n=36) | |
| Asus ZenBook Pro Duo UX581GV | |
| Asus Zephyrus S GX531GM | |
| Eurocom Nightsky RX15 | |
| MSI GF75 Thin 9SC | |
| Asus ZenBook Pro 15 UX580GE | |
| 1920x1080 Fire Strike Graphics | |
| Corsair One i160 | |
| Asus ROG G703GX | |
| Eurocom Nightsky RX15 | |
| MSI RTX 2060 Gaming Z 6G | |
| Asus G752VS-BA338T | |
| Asus Zephyrus GX501 | |
| Genomsnitt NVIDIA GeForce RTX 2060 Mobile (14768 - 18358, n=43) | |
| Eurocom Nightsky Ti15 | |
| Asus ZenBook Pro Duo UX581GV | |
| Asus Zephyrus S GX531GM | |
| MSI GF75 Thin 9SC | |
| Asus ZenBook Pro 15 UX580GE | |
| 2560x1440 Time Spy Graphics | |
| Corsair One i160 | |
| Asus ROG G703GX | |
| Eurocom Nightsky RX15 | |
| MSI RTX 2060 Gaming Z 6G | |
| Genomsnitt NVIDIA GeForce RTX 2060 Mobile (5660 - 6910, n=41) | |
| Asus ZenBook Pro Duo UX581GV | |
| Eurocom Nightsky Ti15 | |
| Asus G752VS-BA338T | |
| Asus Zephyrus GX501 | |
| Asus Zephyrus S GX531GM | |
| MSI GF75 Thin 9SC | |
| Asus ZenBook Pro 15 UX580GE | |
| 3DMark 11 | |
| 1280x720 Performance GPU | |
| Corsair One i160 | |
| Asus ROG G703GX | |
| Eurocom Nightsky RX15 | |
| MSI RTX 2060 Gaming Z 6G | |
| Asus G752VS-BA338T | |
| Asus Zephyrus GX501 | |
| Genomsnitt NVIDIA GeForce RTX 2060 Mobile (19143 - 24662, n=40) | |
| Eurocom Nightsky Ti15 | |
| Asus ZenBook Pro Duo UX581GV | |
| MSI GF75 Thin 9SC | |
| Asus Zephyrus S GX531GM | |
| Asus ZenBook Pro 15 UX580GE | |
| 1280x720 Performance Combined | |
| Corsair One i160 | |
| Eurocom Nightsky RX15 | |
| MSI RTX 2060 Gaming Z 6G | |
| Asus ZenBook Pro Duo UX581GV | |
| Eurocom Nightsky Ti15 | |
| MSI GF75 Thin 9SC | |
| Asus ROG G703GX | |
| Genomsnitt NVIDIA GeForce RTX 2060 Mobile (1107 - 14726, n=40) | |
| Asus G752VS-BA338T | |
| Asus Zephyrus GX501 | |
| Asus ZenBook Pro 15 UX580GE | |
| Asus Zephyrus S GX531GM | |
| 3DMark 11 Performance | 17912 poäng | |
| 3DMark Cloud Gate Standard Score | 43412 poäng | |
| 3DMark Fire Strike Score | 13696 poäng | |
| 3DMark Time Spy Score | 6059 poäng | |
Hjälp | ||
| Shadow of the Tomb Raider - 1920x1080 Highest Preset AA:T | |
| Corsair One i160 | |
| Asus ROG G703GX | |
| Eurocom Nightsky RX15 | |
| MSI RTX 2060 Gaming Z 6G | |
| HP Omen X 2S 15-dg0075cl | |
| Genomsnitt NVIDIA GeForce RTX 2060 Mobile (54 - 86, n=22) | |
| Eurocom Nightsky Ti15 | |
| Asus ZenBook Pro Duo UX581GV | |
| MSI GF75 Thin 9SC | |
| Asus Zephyrus S GX531GM | |
| Dell XPS 15 7590 9980HK GTX 1650 | |
| The Witcher 3 - 1920x1080 Ultra Graphics & Postprocessing (HBAO+) | |
| Corsair One i160 | |
| Asus ROG G703GX | |
| Eurocom Nightsky RX15 | |
| MSI RTX 2060 Gaming Z 6G | |
| HP Omen X 2S 15-dg0075cl | |
| Asus Strix Scar III G531GW | |
| Asus Zephyrus GX501 | |
| Genomsnitt NVIDIA GeForce RTX 2060 Mobile (50.6 - 74, n=40) | |
| Eurocom Nightsky Ti15 | |
| Asus G752VS-BA338T | |
| Asus ZenBook Pro Duo UX581GV | |
| Asus Zephyrus S GX531GM | |
| MSI GF75 Thin 9SC | |
| Dell XPS 15 7590 9980HK GTX 1650 | |
| Asus ZenBook 15 UX533FD | |
| Asus ZenBook Pro 15 UX580GE | |
| låg | med. | hög | ultra | 4K | |
|---|---|---|---|---|---|
| The Witcher 3 (2015) | 267 | 185.4 | 112.8 | 57.2 | 41.3 |
| Rocket League (2017) | 249 | 241.9 | 180.6 | 96.2 | |
| Shadow of the Tomb Raider (2018) | 114 | 87 | 80 | 71 | 24 |
| Asus ZenBook Pro Duo UX581GV GeForce RTX 2060 Mobile, i9-9980HK, Samsung SSD PM981 MZVLB1T0HALR | Asus ZenBook Pro 15 UX580GE GeForce GTX 1050 Ti Mobile, i9-8950HK, Samsung SSD PM961 1TB M.2 PCIe 3.0 x4 NVMe (MZVLW1T0) | Asus ZenBook 15 UX533FD GeForce GTX 1050 Max-Q, i7-8565U, WDC PC SN520 SDAPNUW-512G | Dell XPS 15 7590 9980HK GTX 1650 GeForce GTX 1650 Mobile, i9-9980HK, Toshiba XG6 KXG60ZNV1T02 | Asus Strix Scar III G531GW GeForce RTX 2070 Mobile, i9-9880H, Intel SSD 660p 1TB SSDPEKNW010T8 | HP Omen X 2S 15-dg0075cl GeForce RTX 2070 Max-Q, i7-9750H, WDC PC SN720 SDAPNTW-1T00 | |
|---|---|---|---|---|---|---|
| Noise | -3% | -4% | -4% | -22% | -9% | |
| av / miljö * (dB) | 28.4 | 28 1% | 30.5 -7% | 28.2 1% | 29 -2% | 29 -2% |
| Idle Minimum * (dB) | 29 | 28.6 1% | 30.5 -5% | 28.2 3% | 30 -3% | 30.5 -5% |
| Idle Average * (dB) | 29 | 29.9 -3% | 30.5 -5% | 28.2 3% | 37 -28% | 31.5 -9% |
| Idle Maximum * (dB) | 29 | 30.5 -5% | 30.5 -5% | 30.4 -5% | 39 -34% | 31.5 -9% |
| Load Average * (dB) | 35.4 | 42.5 -20% | 40.8 -15% | 43.8 -24% | 54 -53% | 40.6 -15% |
| Witcher 3 ultra * (dB) | 42 | 44.8 -7% | 47.2 -12% | 54 -29% | 49.5 -18% | |
| Load Maximum * (dB) | 50 | 44.8 10% | 41.8 16% | 47.2 6% | 54 -8% | 53.4 -7% |
* ... mindre är bättre
Ljudnivå
| Låg belastning |
| 29 / 29 / 29 dB(A) |
| Hög belastning |
| 35.4 / 50 dB(A) |
 | ||
30 dB tyst 40 dB(A) hörbar 50 dB(A) högt ljud |
||
min: | ||
(±) Den maximala temperaturen på ovansidan är 40.4 °C / 105 F, jämfört med genomsnittet av 40.4 °C / 105 F , allt från 21.2 till 68.8 °C för klassen Gaming.
(-) Botten värms upp till maximalt 47.8 °C / 118 F, jämfört med genomsnittet av 43.2 °C / 110 F
(±) Vid tomgångsbruk är medeltemperaturen för ovansidan 34.5 °C / 94 F, jämfört med enhetsgenomsnittet på 33.9 °C / ### class_avg_f### F.
(±) När du spelar The Witcher 3 är medeltemperaturen för ovansidan 37.3 °C / 99 F, jämfört med enhetsgenomsnittet på 33.9 °C / ## #class_avg_f### F.
(+) Handledsstöden och pekplattan når maximal hudtemperatur (34.6 °C / 94.3 F) och är därför inte varma.
(-) Medeltemperaturen för handledsstödsområdet på liknande enheter var 28.8 °C / 83.8 F (-5.8 °C / -10.5 F).
Asus ZenBook Pro Duo UX581GV ljudanalys
(±) | högtalarljudstyrkan är genomsnittlig men bra (74.4 dB)
Bas 100 - 315 Hz
(±) | reducerad bas - i genomsnitt 10.4% lägre än medianen
(±) | linjäriteten för basen är genomsnittlig (12.2% delta till föregående frekvens)
Mellan 400 - 2000 Hz
(+) | balanserad mellan - endast 2.1% från medianen
(+) | mids är linjära (4.3% delta till föregående frekvens)
Högsta 2 - 16 kHz
(+) | balanserade toppar - endast 4.5% från medianen
(±) | linjäriteten för toppar är genomsnittlig (10.5% delta till föregående frekvens)
Totalt 100 - 16 000 Hz
(±) | linjäriteten för det totala ljudet är genomsnittlig (19.8% skillnad mot median)
Jämfört med samma klass
» 69% av alla testade enheter i den här klassen var bättre, 6% liknande, 24% sämre
» Den bästa hade ett delta på 6%, genomsnittet var 18%, sämst var 132%
Jämfört med alla testade enheter
» 50% av alla testade enheter var bättre, 7% liknande, 43% sämre
» Den bästa hade ett delta på 4%, genomsnittet var 24%, sämst var 134%
Apple MacBook 12 (Early 2016) 1.1 GHz ljudanalys
(+) | högtalare kan spela relativt högt (83.6 dB)
Bas 100 - 315 Hz
(±) | reducerad bas - i genomsnitt 11.3% lägre än medianen
(±) | linjäriteten för basen är genomsnittlig (14.2% delta till föregående frekvens)
Mellan 400 - 2000 Hz
(+) | balanserad mellan - endast 2.4% från medianen
(+) | mids är linjära (5.5% delta till föregående frekvens)
Högsta 2 - 16 kHz
(+) | balanserade toppar - endast 2% från medianen
(+) | toppar är linjära (4.5% delta till föregående frekvens)
Totalt 100 - 16 000 Hz
(+) | det totala ljudet är linjärt (10.2% skillnad mot median)
Jämfört med samma klass
» 7% av alla testade enheter i den här klassen var bättre, 2% liknande, 91% sämre
» Den bästa hade ett delta på 5%, genomsnittet var 18%, sämst var 53%
Jämfört med alla testade enheter
» 5% av alla testade enheter var bättre, 1% liknande, 94% sämre
» Den bästa hade ett delta på 4%, genomsnittet var 24%, sämst var 134%
| Av/Standby | |
| Låg belastning | |
| Hög belastning |
|
Förklaring:
min: | |
| Asus ZenBook Pro Duo UX581GV i9-9980HK, GeForce RTX 2060 Mobile, Samsung SSD PM981 MZVLB1T0HALR, OLED, 3840x2160, 15.6" | Asus ZenBook Pro 15 UX580GE i9-8950HK, GeForce GTX 1050 Ti Mobile, Samsung SSD PM961 1TB M.2 PCIe 3.0 x4 NVMe (MZVLW1T0), IPS, 3840x2160, 15.6" | Asus ZenBook 15 UX533FD i7-8565U, GeForce GTX 1050 Max-Q, WDC PC SN520 SDAPNUW-512G, IPS, 1920x1080, 15.6" | Dell XPS 15 7590 9980HK GTX 1650 i9-9980HK, GeForce GTX 1650 Mobile, Toshiba XG6 KXG60ZNV1T02, OLED, 3840x2160, 15.6" | Asus Strix Scar III G531GW i9-9880H, GeForce RTX 2070 Mobile, Intel SSD 660p 1TB SSDPEKNW010T8, IPS, 1920x1080, 15.6" | HP Omen X 2S 15-dg0075cl i7-9750H, GeForce RTX 2070 Max-Q, WDC PC SN720 SDAPNTW-1T00, IPS, 1920x1080, 15.6" | |
|---|---|---|---|---|---|---|
| Power Consumption | 27% | 61% | 37% | -32% | -75% | |
| Idle Minimum * (Watt) | 19.3 | 11.7 39% | 2.7 86% | 6.2 68% | 29 -50% | 46 -138% |
| Idle Average * (Watt) | 24.2 | 18.5 24% | 8 67% | 9.6 60% | 32 -32% | 59 -144% |
| Idle Maximum * (Watt) | 24.5 | 22.8 7% | 10.6 57% | 21.2 13% | 37 -51% | 65.5 -167% |
| Load Average * (Watt) | 122.3 | 97.5 20% | 74 39% | 104.3 15% | 157 -28% | 99.8 18% |
| Witcher 3 ultra * (Watt) | 137 | 102.9 25% | 91.7 33% | 173 -26% | 154.1 -12% | |
| Load Maximum * (Watt) | 208.4 | 111.1 47% | 89 57% | 135.3 35% | 217 -4% | 222.7 -7% |
* ... mindre är bättre
| Asus ZenBook Pro Duo UX581GV i9-9980HK, GeForce RTX 2060 Mobile, 71 Wh | Asus ZenBook Pro 15 UX580GE i9-8950HK, GeForce GTX 1050 Ti Mobile, 71 Wh | Asus ZenBook 15 UX533FD i7-8565U, GeForce GTX 1050 Max-Q, 73 Wh | Dell XPS 15 7590 9980HK GTX 1650 i9-9980HK, GeForce GTX 1650 Mobile, 97 Wh | Asus Strix Scar III G531GW i9-9880H, GeForce RTX 2070 Mobile, 66 Wh | HP Omen X 2S 15-dg0075cl i7-9750H, GeForce RTX 2070 Max-Q, 72 Wh | |
|---|---|---|---|---|---|---|
| Batteridrifttid | 18% | 107% | 81% | -28% | -42% | |
| Reader / Idle (h) | 13.1 | 14 7% | 26.5 102% | 15.2 16% | 5.5 -58% | 3.7 -72% |
| WiFi v1.3 (h) | 4.1 | 6.3 54% | 8.7 112% | 7.8 90% | 3 -27% | 2.2 -46% |
| Load (h) | 1.4 | 1.3 -7% | 2.9 107% | 3.3 136% | 1.4 0% | 1.3 -7% |
För
Emot

Läs den fullständiga versionen av den här recensionen på engelska här.
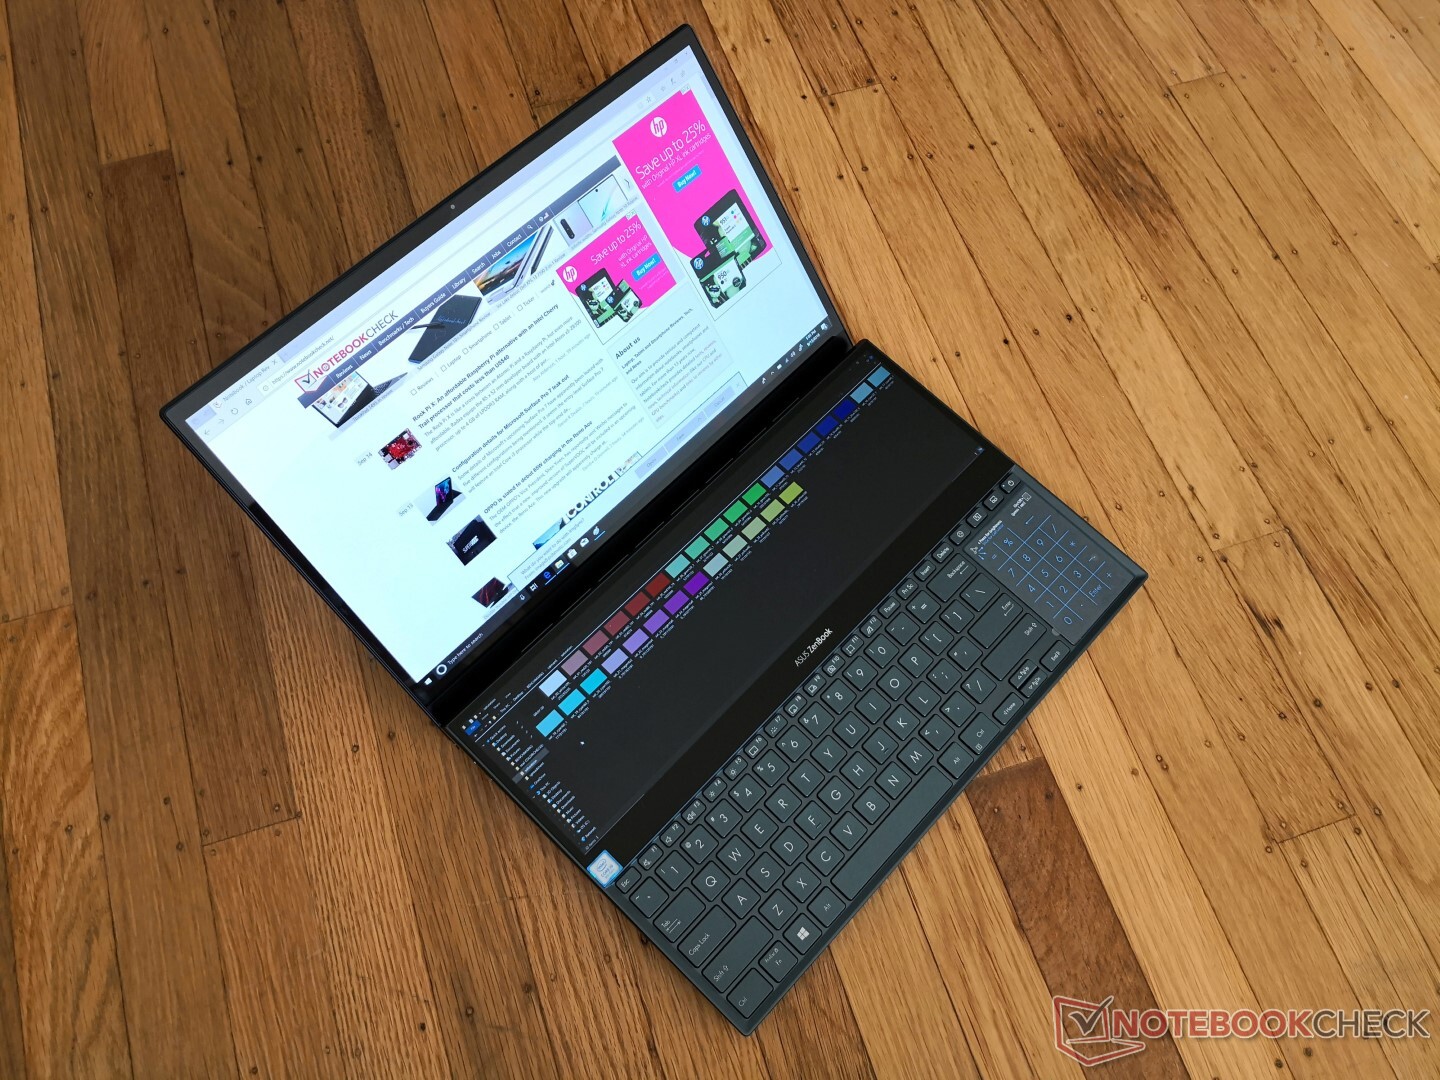
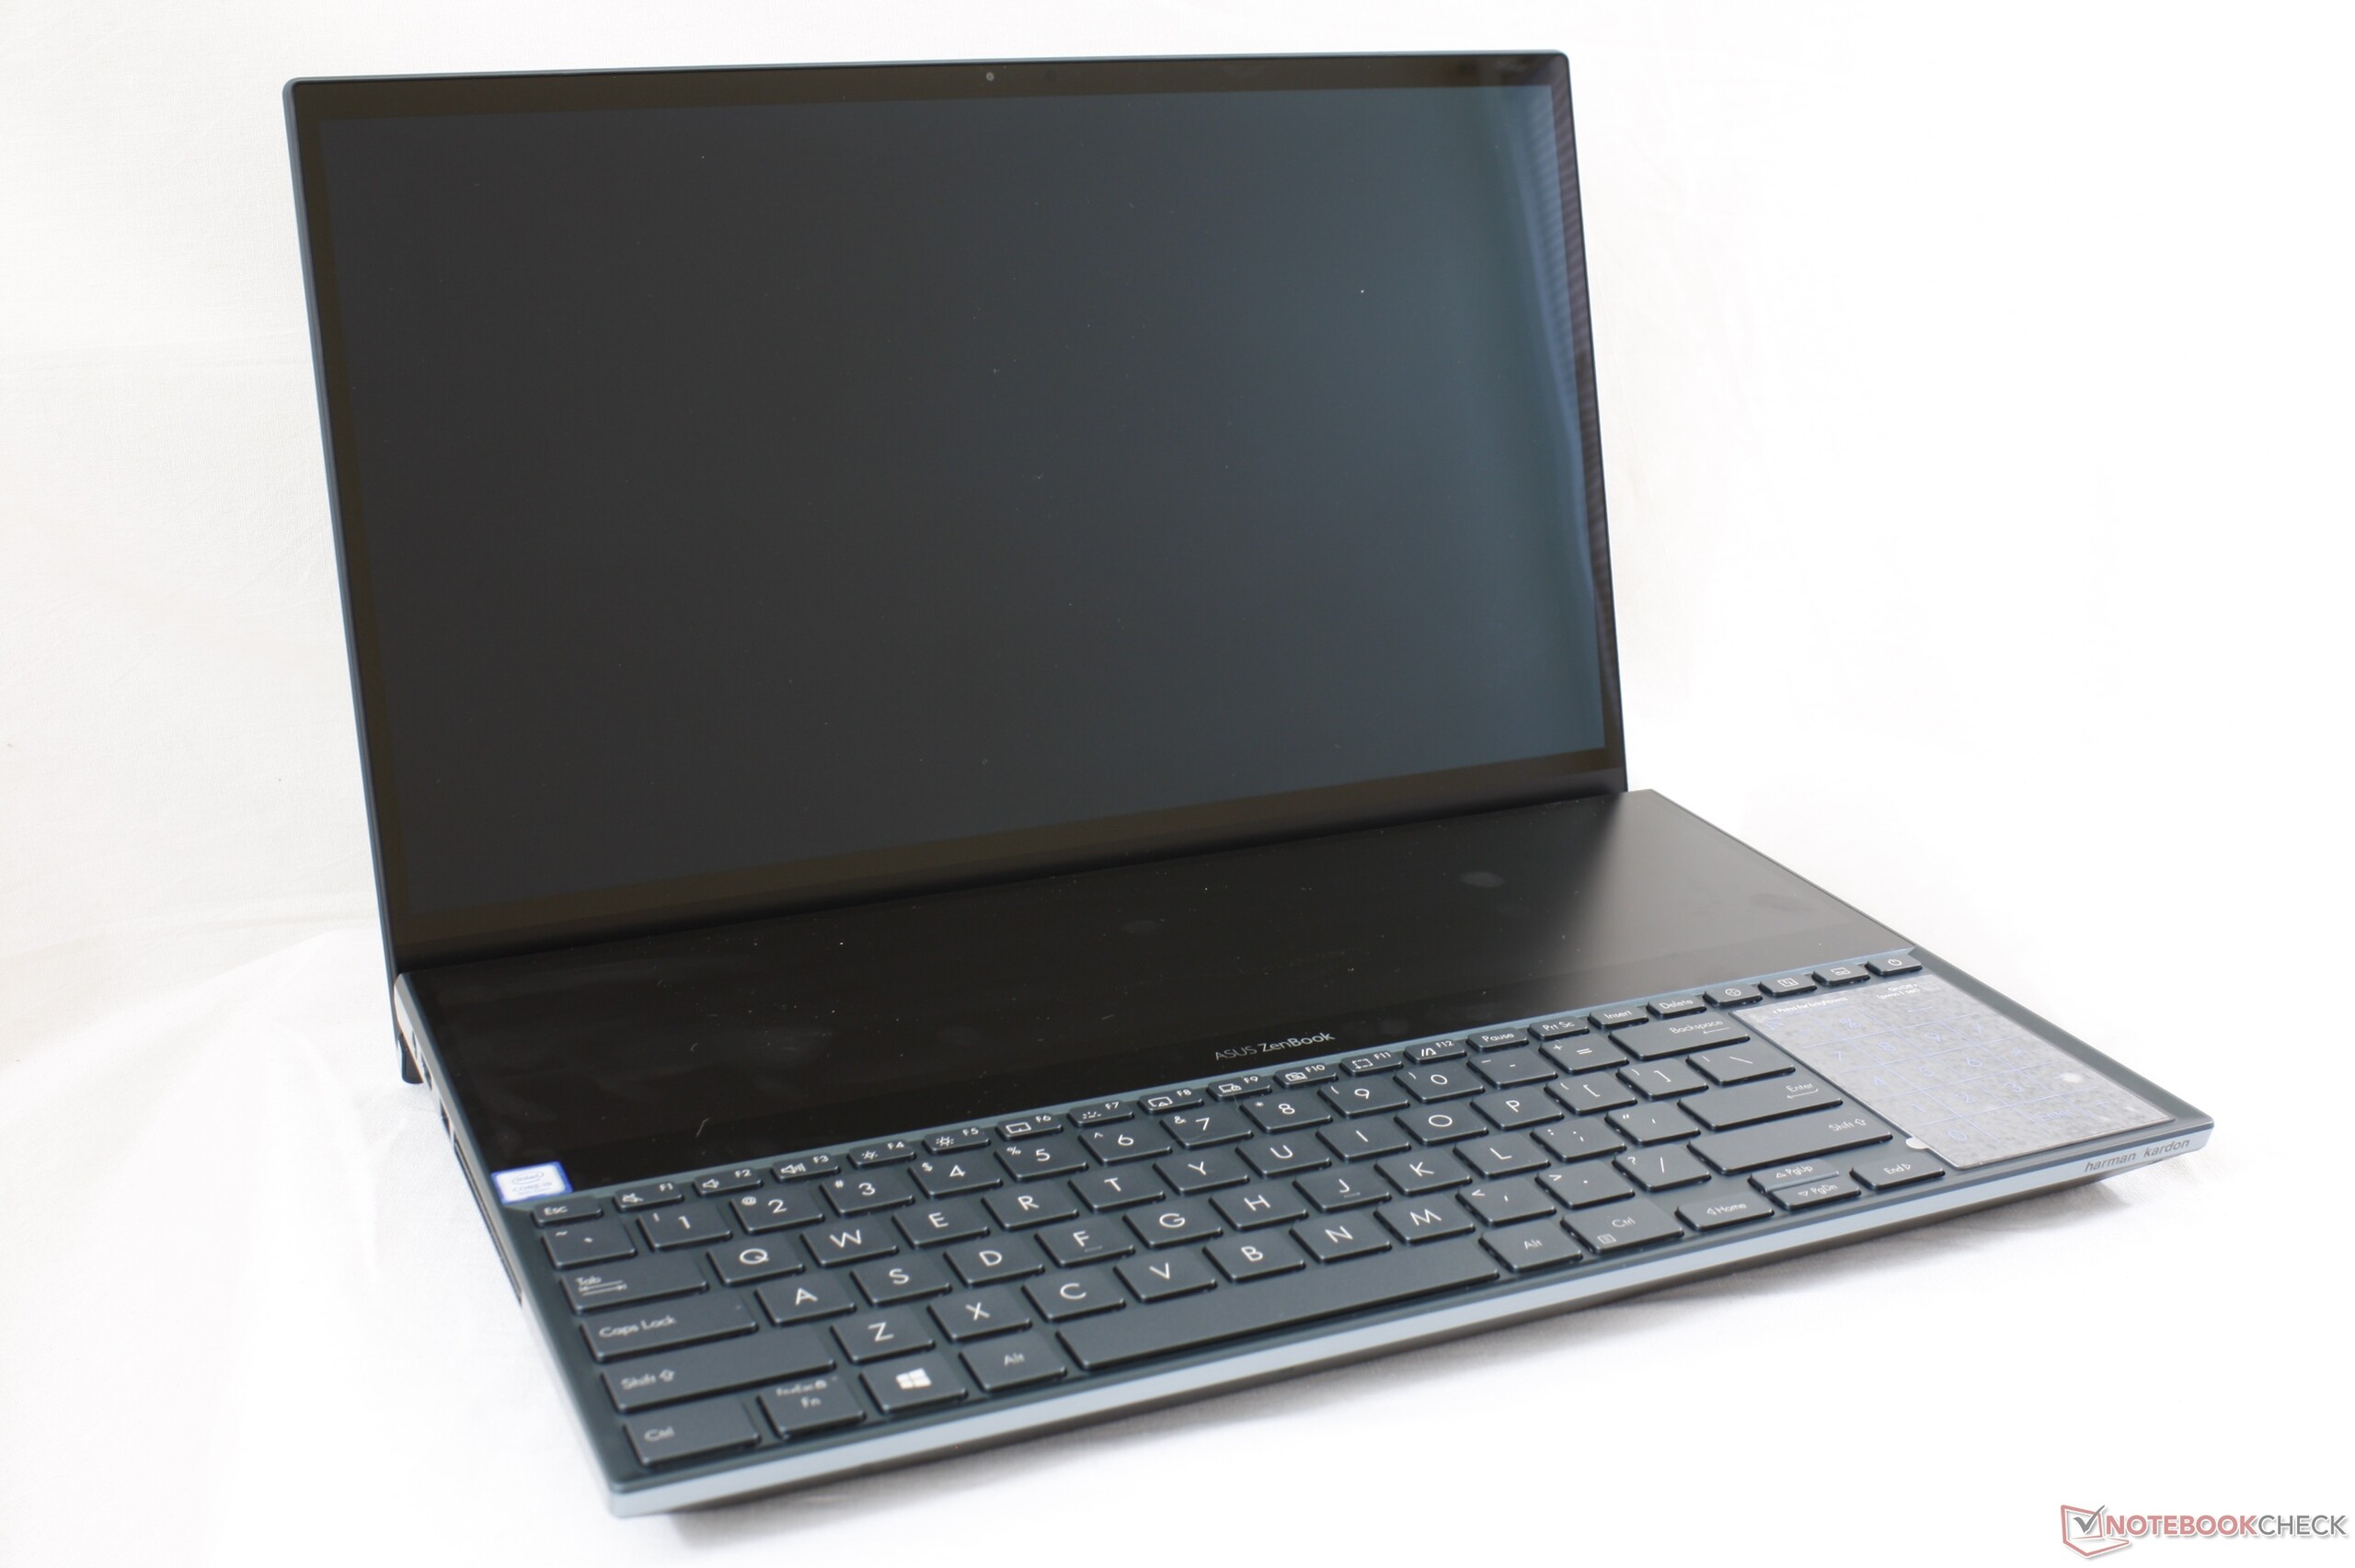
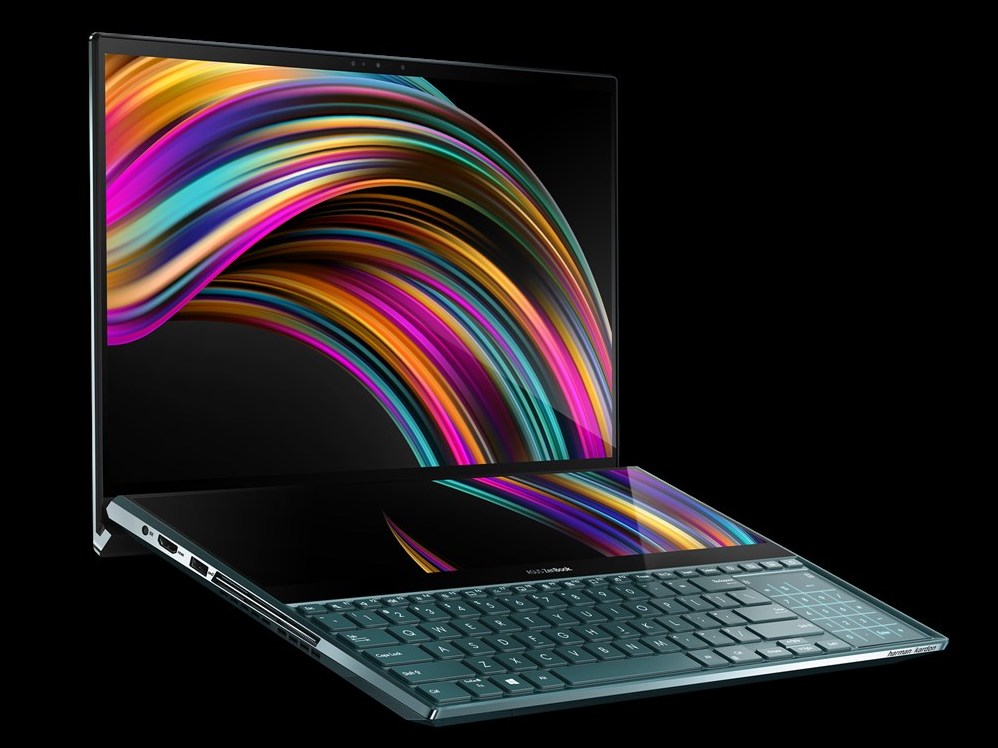
Vi älskar ZenBook Pro Duo UX581:s unika koncept och vad det står för. Att ha en extra skärm med samma bredd och samma DPI som huvudskärmen gör extraskärmen mycket smidigare att använda jämfört med de oproportionerliga motsvarigheterna på 2015 års Razer Blade Pro, Asus ZenBook 15 UX534 eller HP Omen X 2S 15. Nackdelen är att Asus fått göra en del rejäla uppoffringar för att få i en såpass stor extra skärm. I synnerhet är UX581 tjockare, tyngre och betydligt dyrare än en typisk flaggskepps-ultrabook eller multimedialaptop, vilket gör detta till mer av en desktop-ersättning snarare än en riktigt portabel maskin.
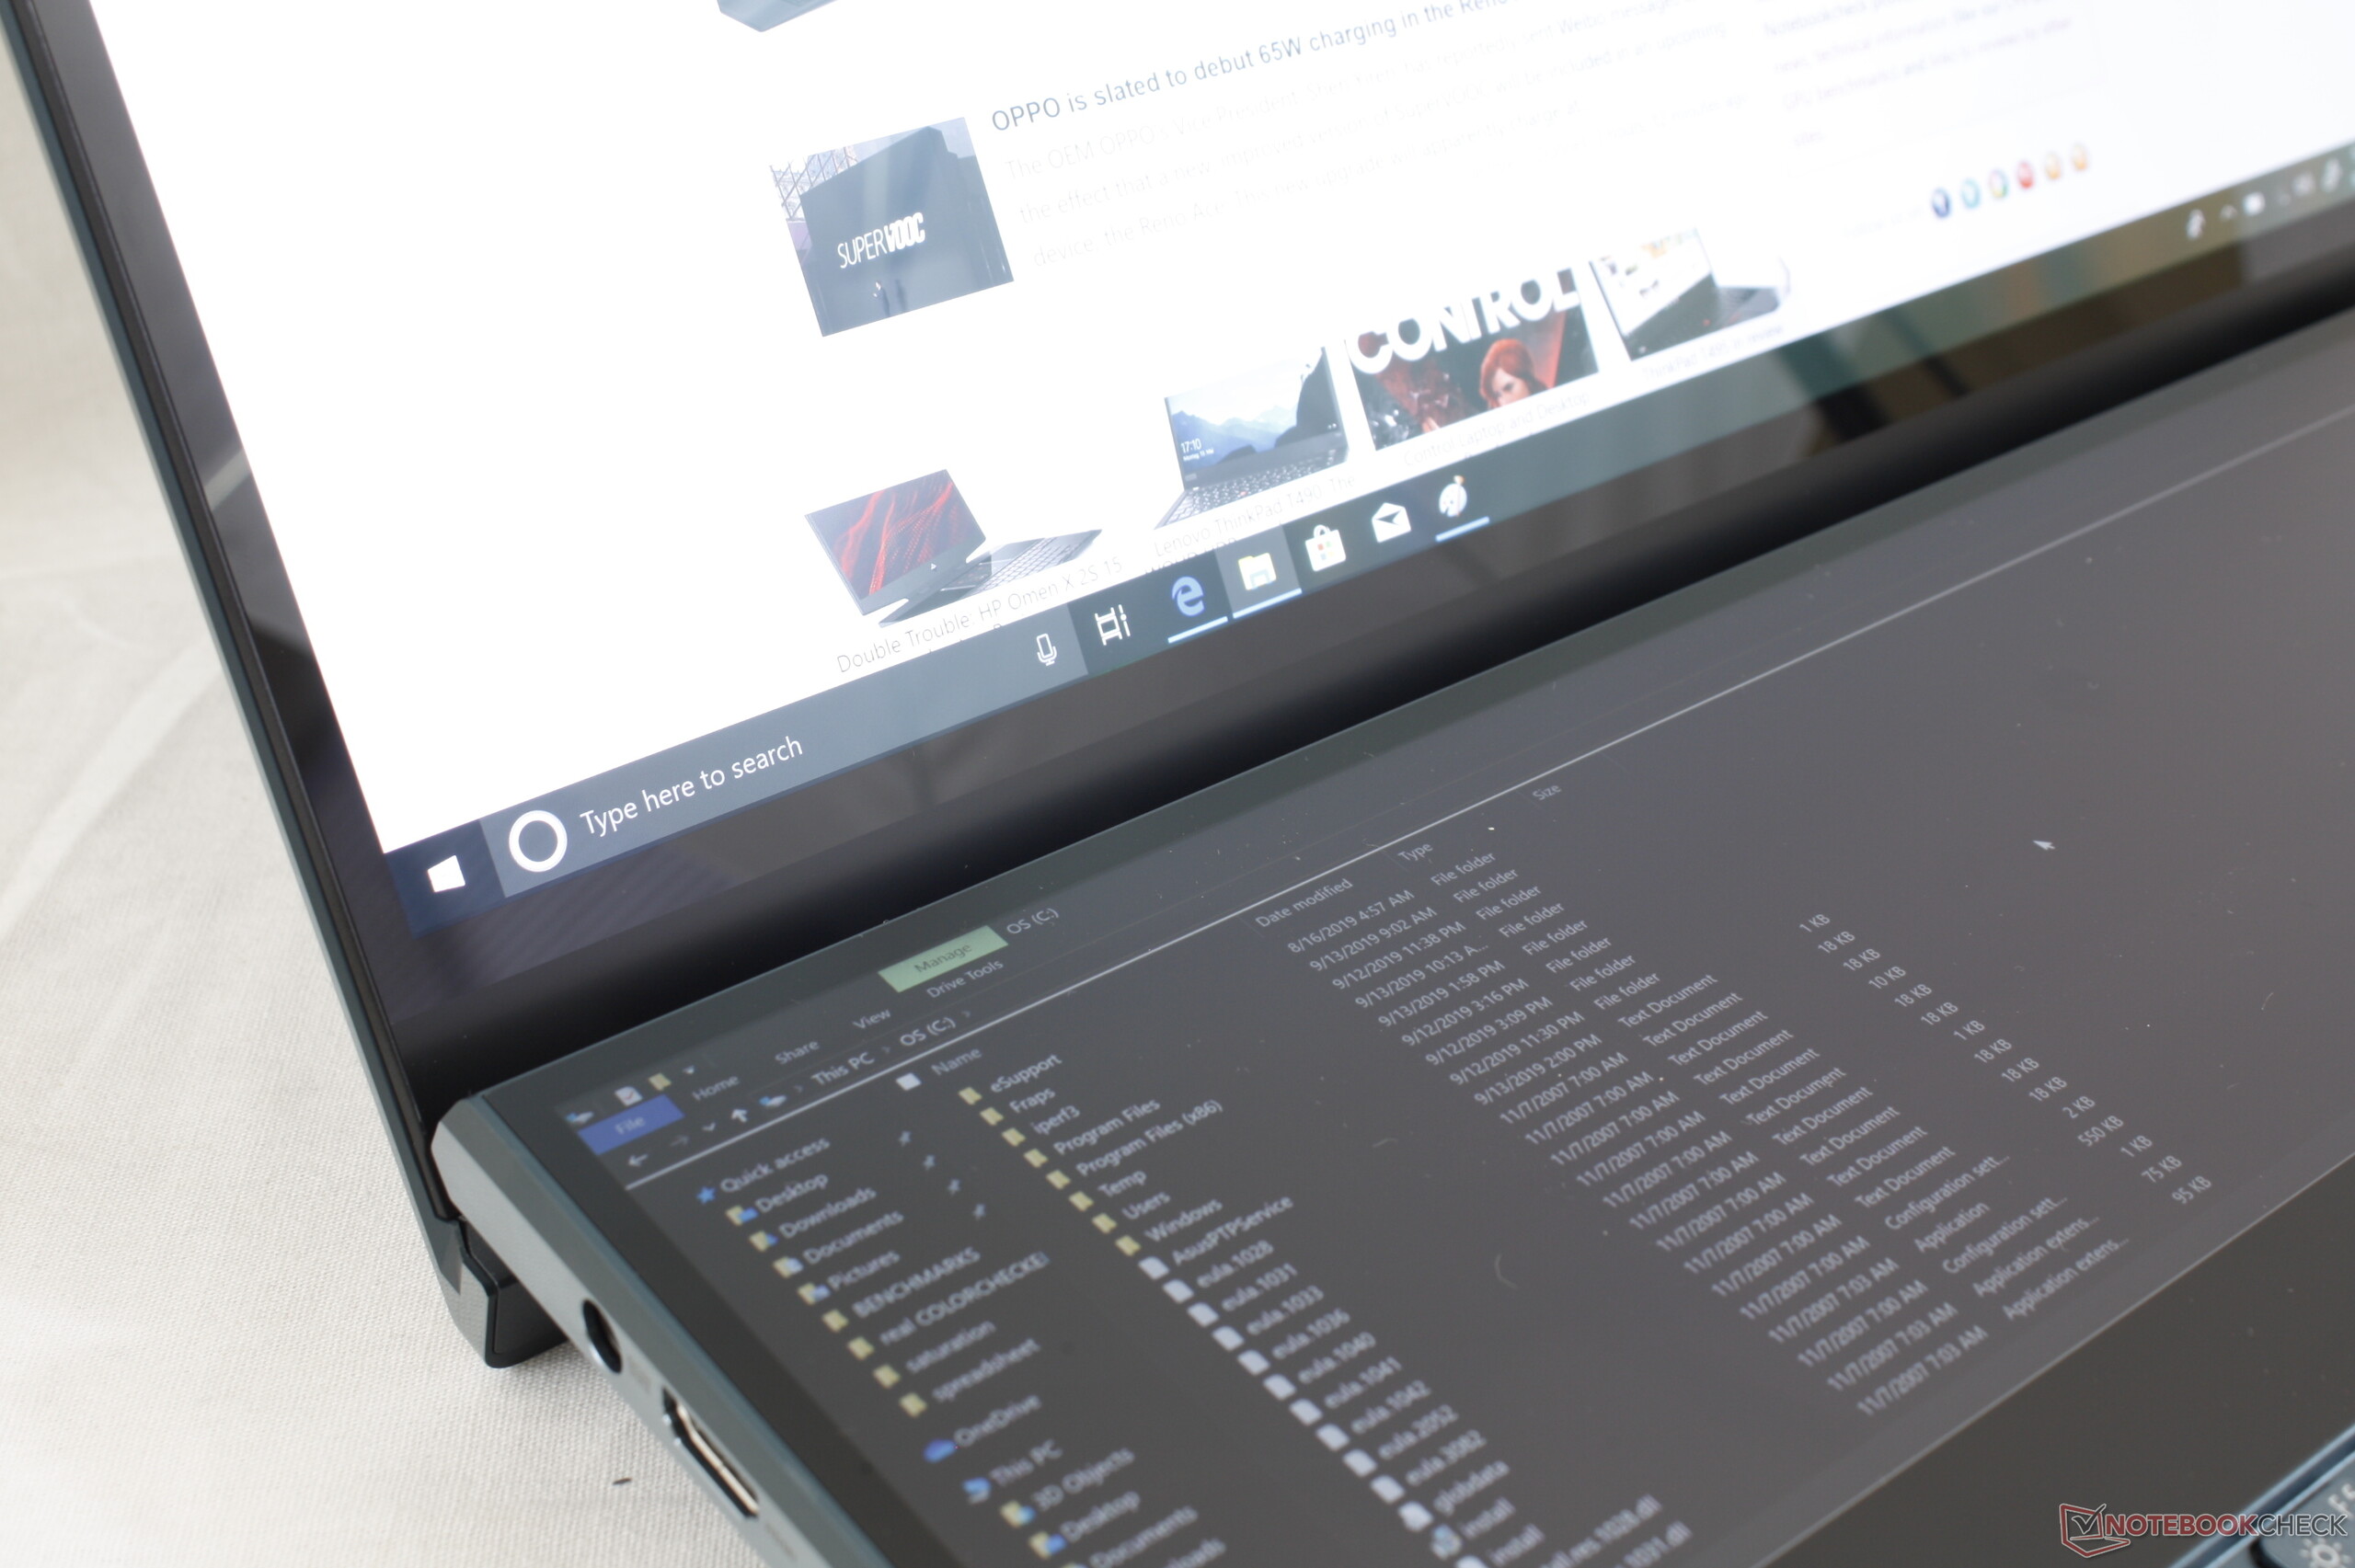
En märklig detalj som noggranna proffs inte kommer uppskatta är skillnaden i bildkvalitet mellan de två skärmarna. En blank OLED-skärm med supersnabba responstider kommer onekligen skilja sig ganska mycket från en matt IPS-skärm med långsammare responstider. Vi misstänker att det finns en begränsad tillgång på OLED-skärmar med 3840 x 1110-upplösning, så Asus hade nog inget val än att använda IPS till ScreenPad Plus.
Andra brister inkluderar kortare batteritid, att den bara har en enda lagringsplats och att den saknar både SD-kortläsare och taktilt numeriskt tangentbord, saker som i huvudsak kreatörer och proffs kommer utnyttja. Det bästa hade varit om en framtida ZenBook Pro Duo byggde in den extra skärmen i ett chassi med samma storlek som en smidig Razer Blade 15, XPS 15 eller Spectre x360 15 istället för denna medelstora spellaptop. Men tills dess kommer du inte kunna hitta en bättre dubbelskärmsupplevelse än UX581.
Asus ZenBook Pro Duo UX581 är den mest välutvecklade bärbara dubbelskärmsdatorn hittills. Den jämnar till en del problem som den ursprungliga ScreenPad led av till förmån för en mer naturlig desktop-upplevelse. Men trots det är konceptet med laptops med dubbla skärmar fortfarande bara i sin linda och ZenBook Pro Duo-serien kan definitivt dra nytta av en lättare och tunnare design i framtiden.
Asus ZenBook Pro Duo UX581GV
- 08/31/2022 v7 (old)
Allen Ngo
Price comparison
