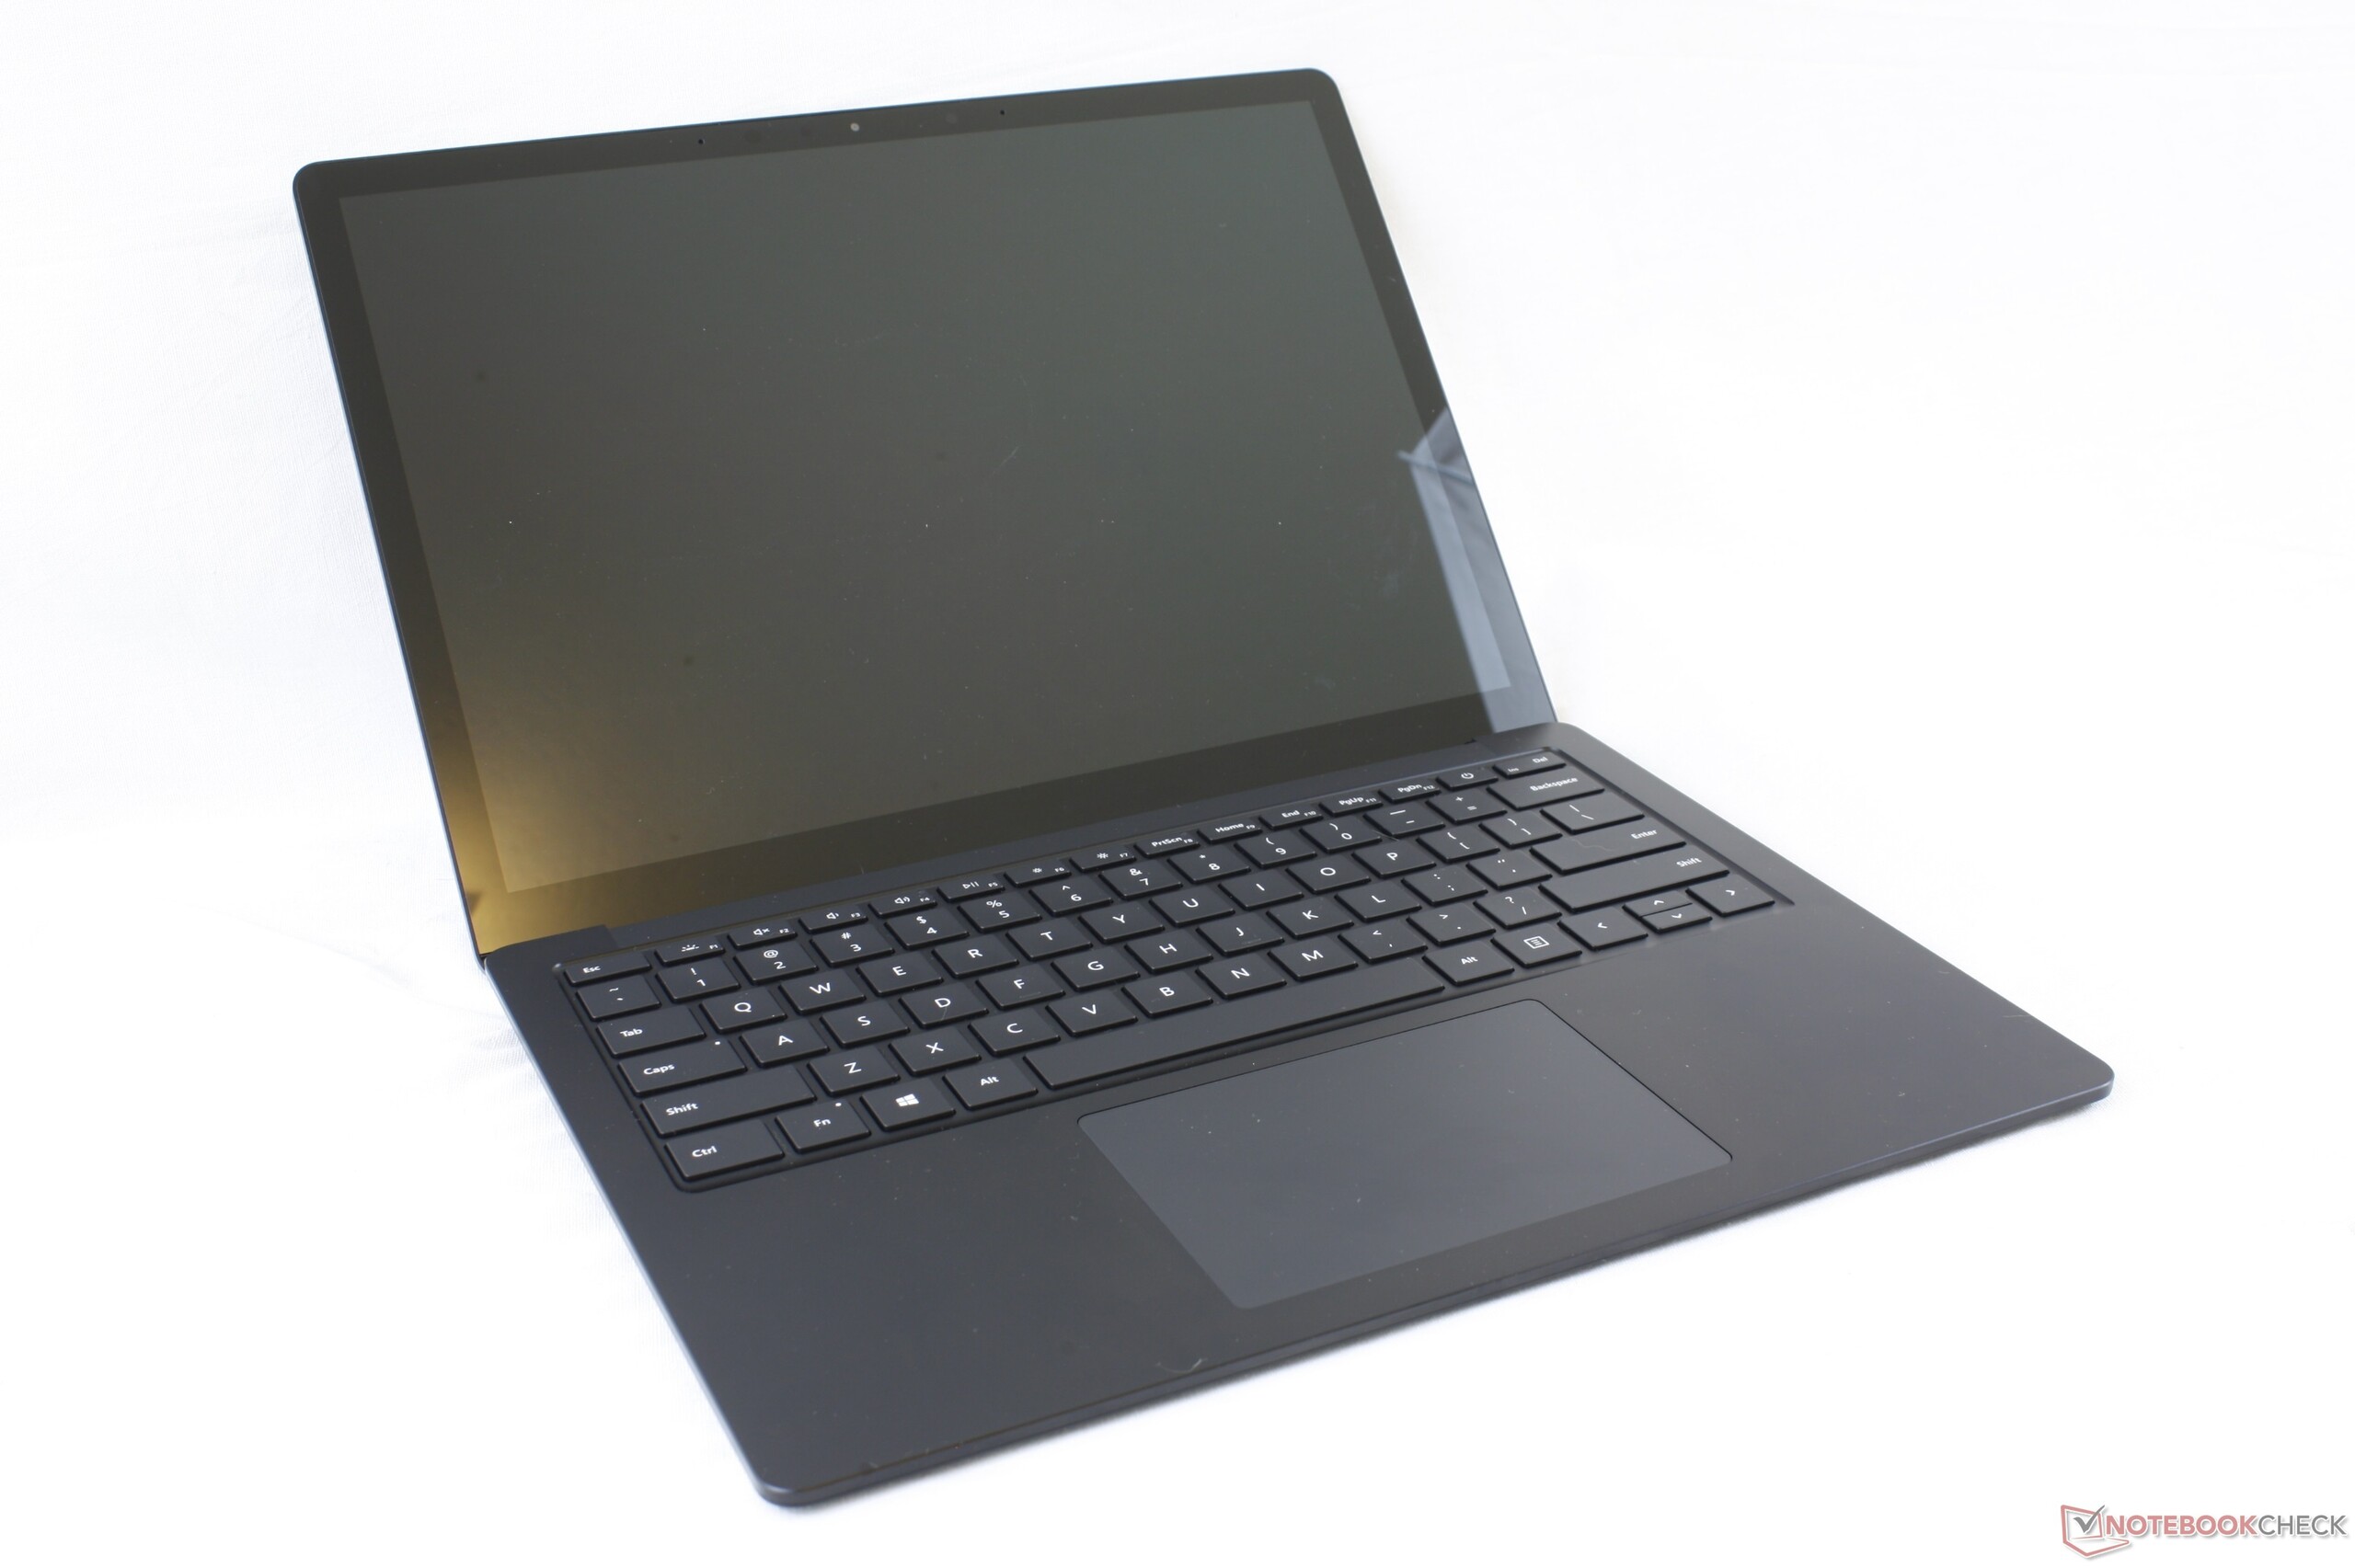
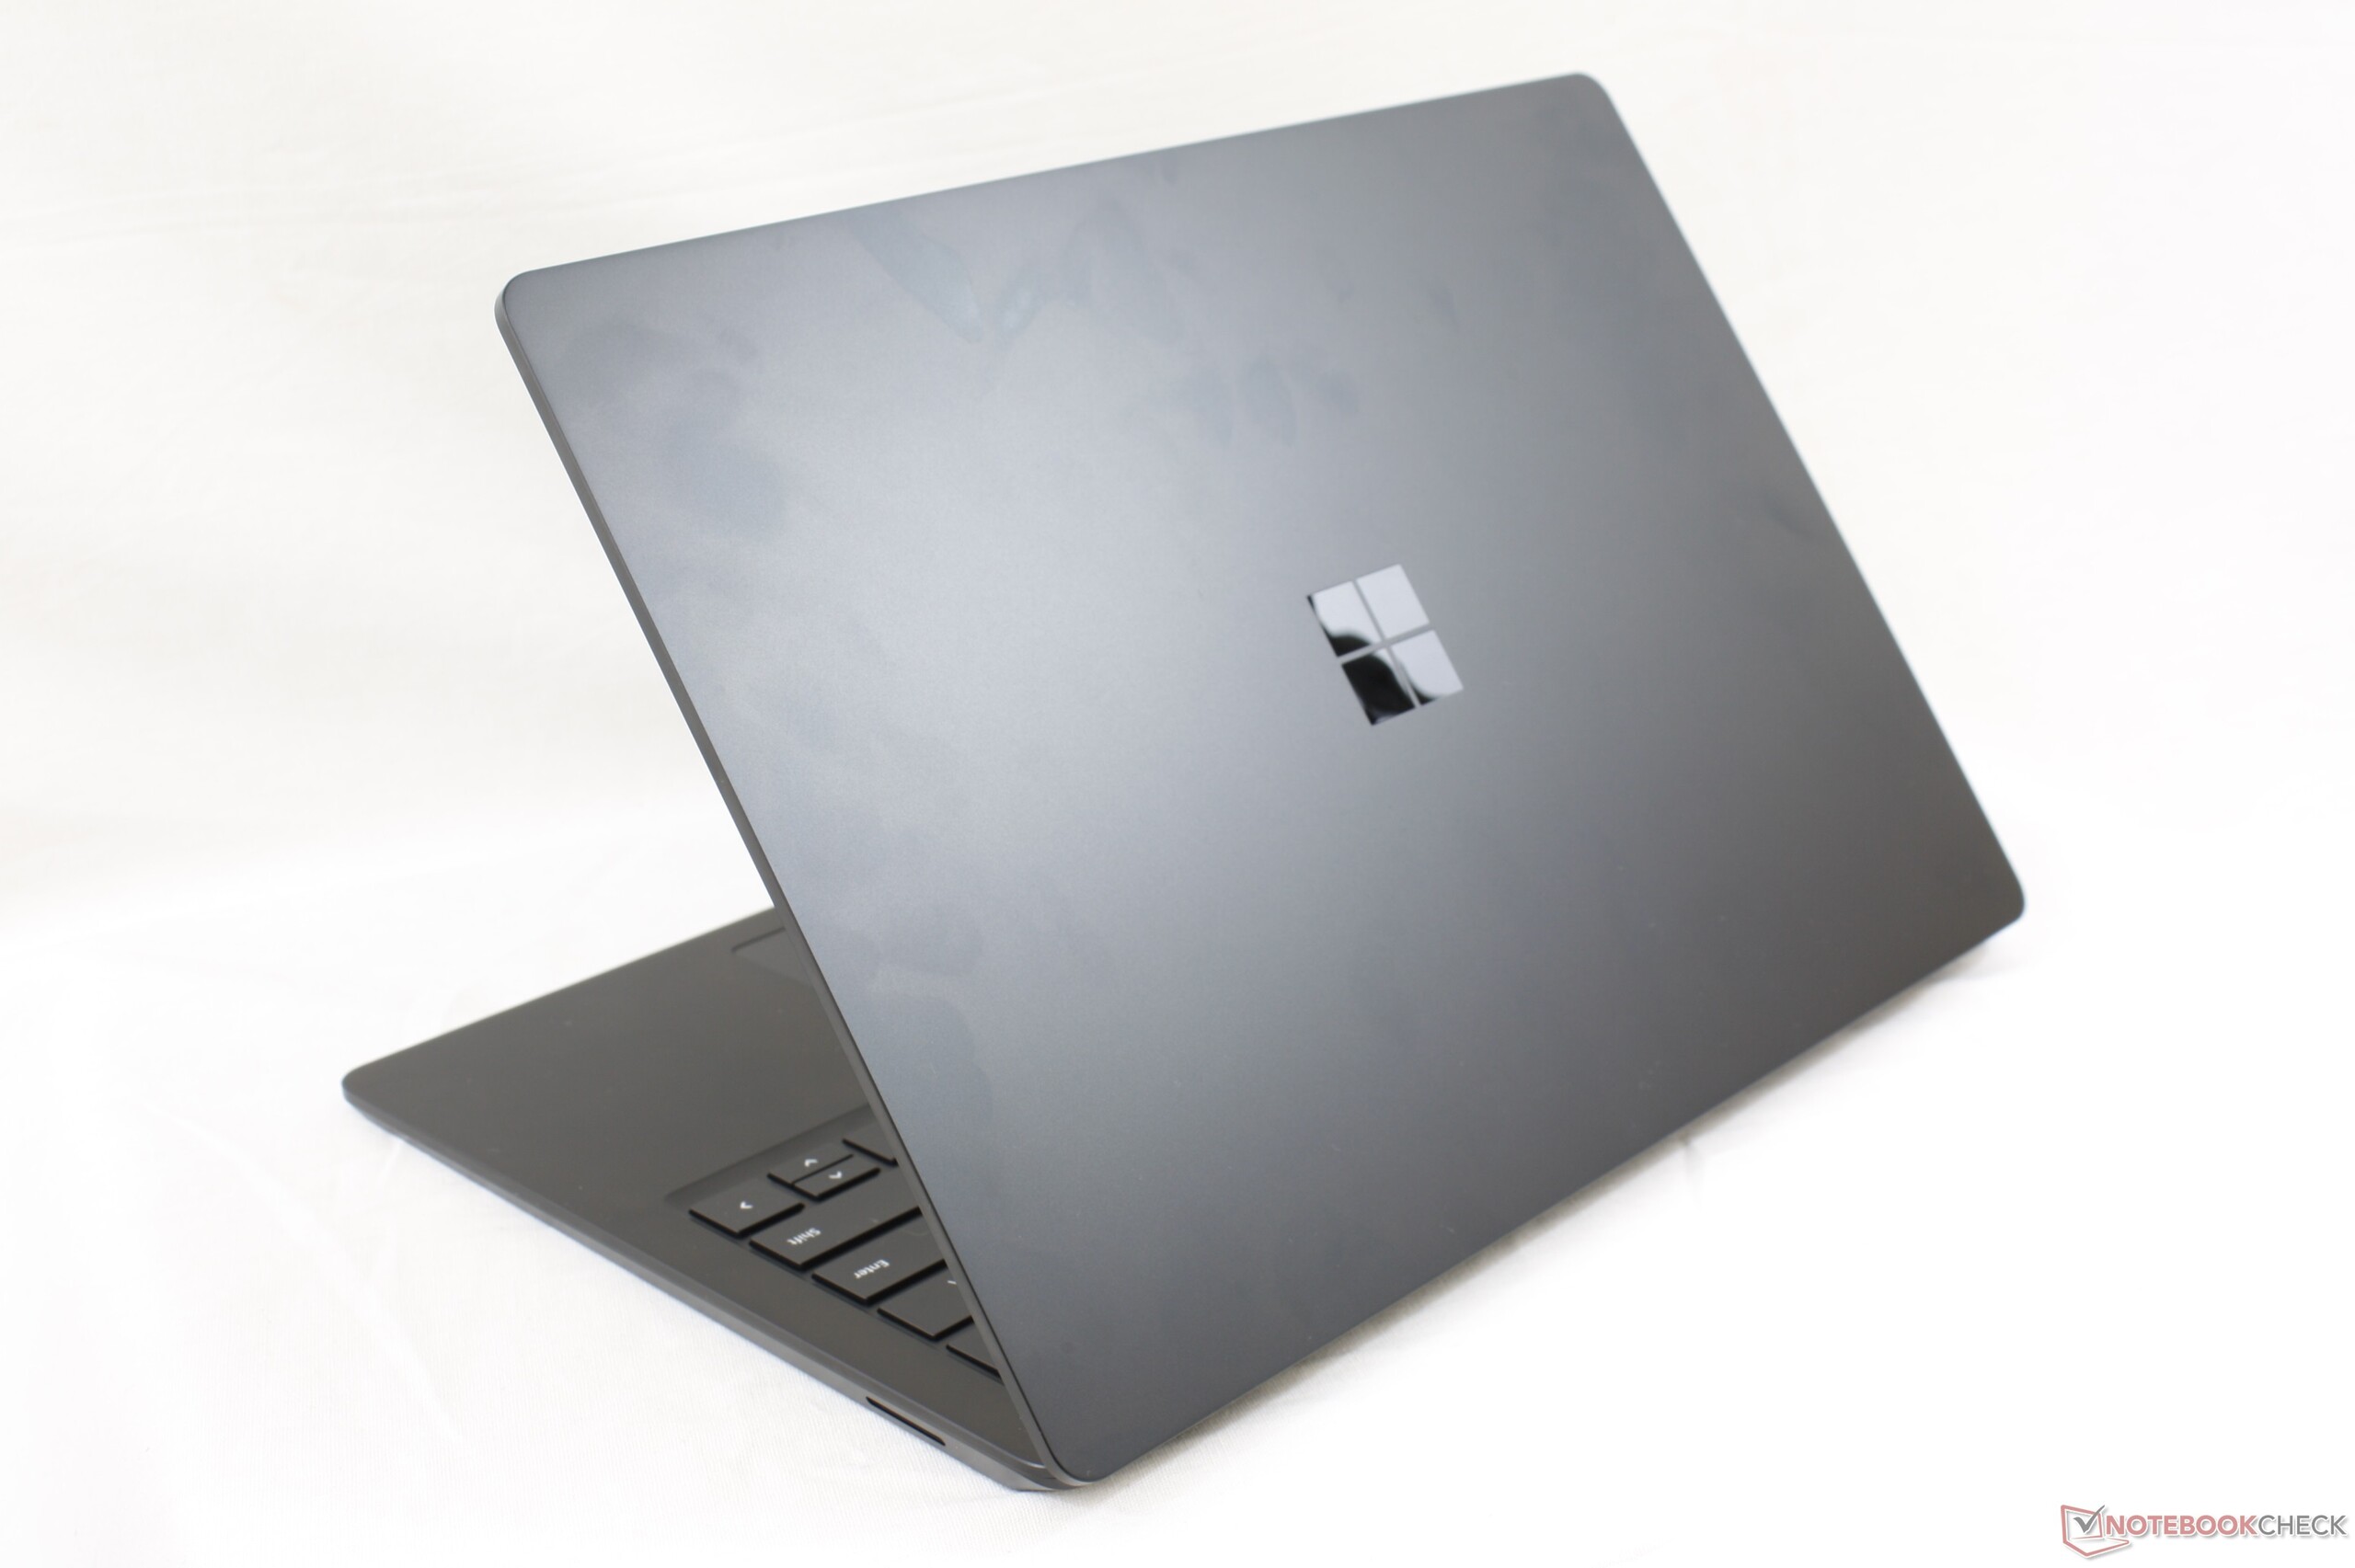
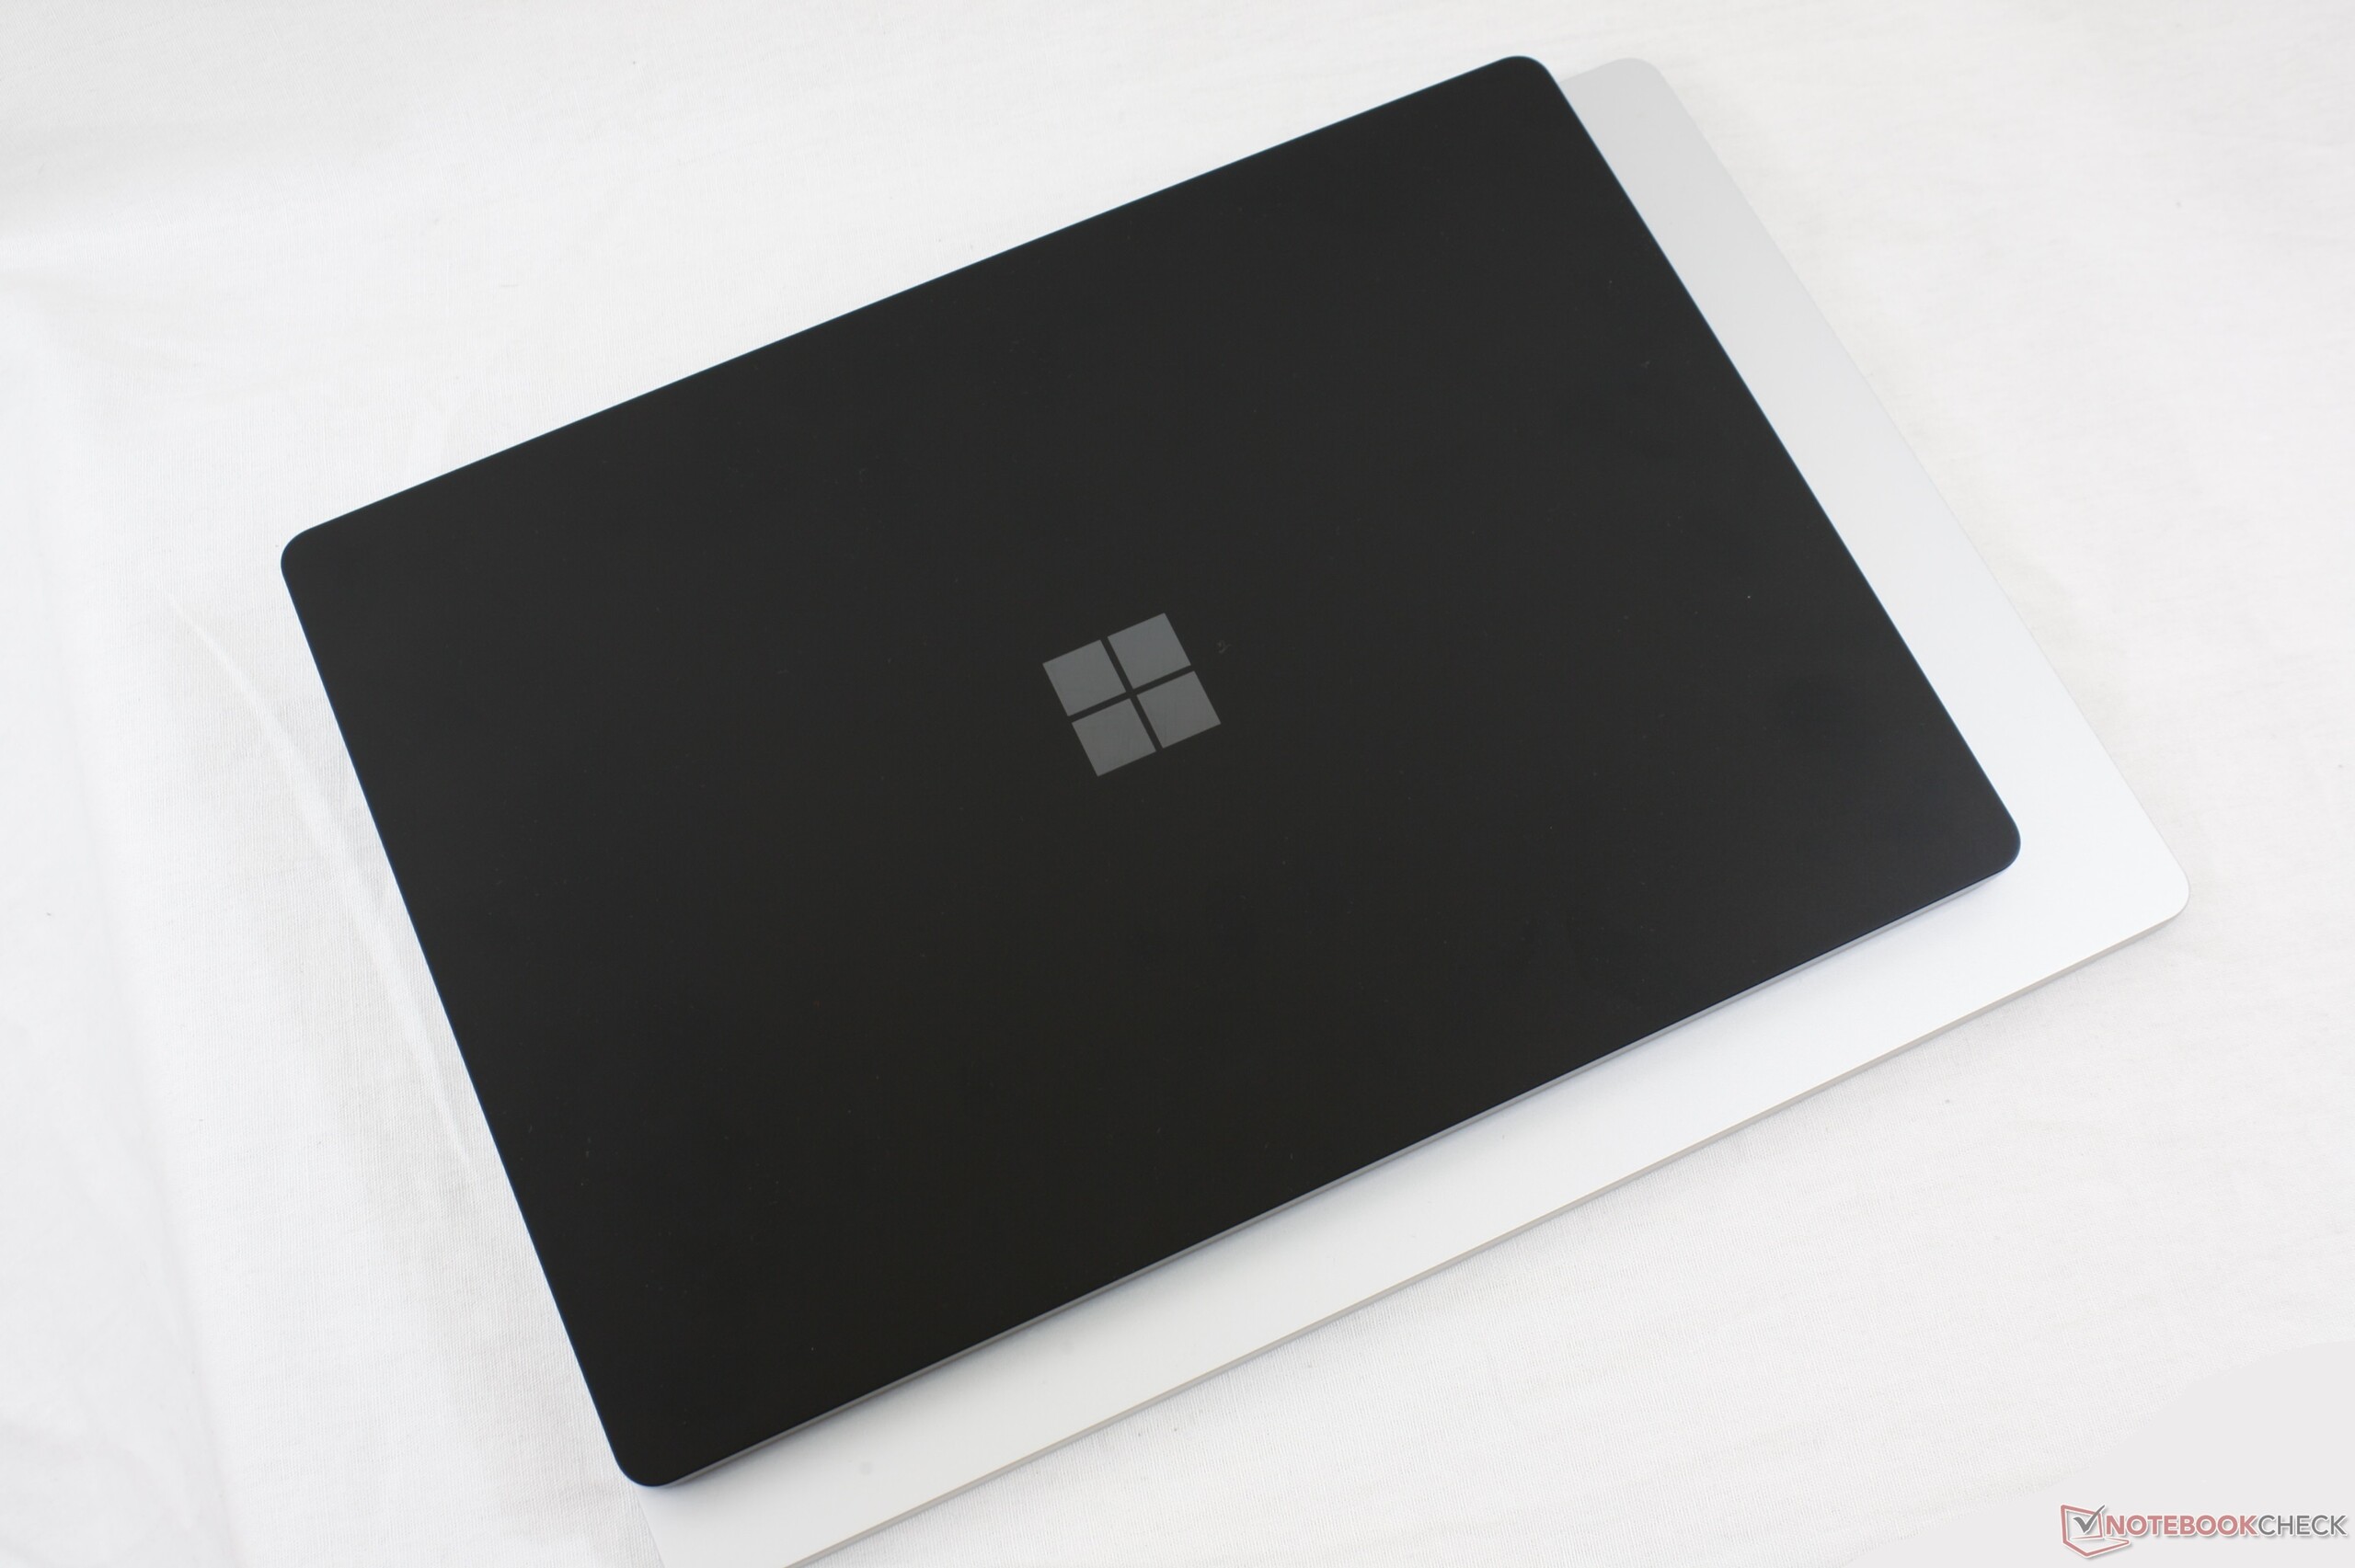
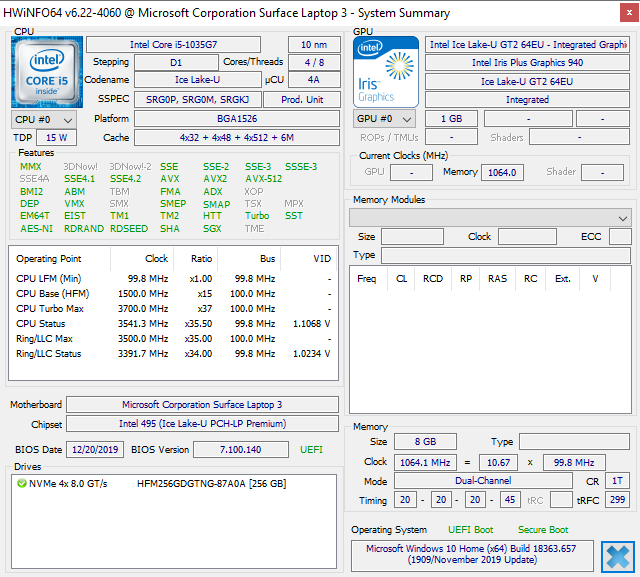
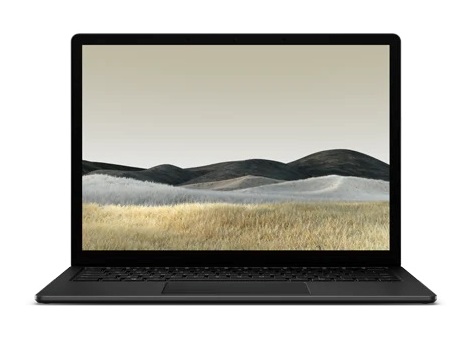
Test: Microsoft Surface Laptop 3 13.5 tum med Core i5 - Sayonara, Alcantara (Sammanfattning)
Gradering | Datum | Modell | Vikt | Höjd | Storlek | Upplösning | Pris |
|---|---|---|---|---|---|---|---|
| 84 % v7 (old) | 02/2020 | Microsoft Surface Laptop 3 13 Core i5-1035G7 i5-1035G7, Iris Plus Graphics G7 (Ice Lake 64 EU) | 1.3 kg | 14.5 mm | 13.50" | 2256x1504 | |
| 90.6 % v7 (old) | 02/2020 | Apple MacBook Pro 13 2019 2TB3 i5-8257U, Iris Plus Graphics 645 | 1.4 kg | 14.9 mm | 13.30" | 2560x1600 | |
| 86.3 % v7 (old) | 10/2019 | Dell XPS 13 7390 2-in-1 Core i7 i7-1065G7, Iris Plus Graphics G7 (Ice Lake 64 EU) | 1.3 kg | 13 mm | 13.40" | 1920x1200 | |
| 90.1 % v7 (old) | 10/2019 | Lenovo ThinkPad X1 Carbon 2019-20QE000VGE i7-8665U, UHD Graphics 620 | 1.1 kg | 14.9 mm | 14.00" | 2560x1440 | |
| 83.9 % v7 (old) | 01/2020 | Microsoft Surface Laptop 3 15 i7-1065G7 i7-1065G7, Iris Plus Graphics G7 (Ice Lake 64 EU) | 1.5 kg | 14.7 mm | 15.00" | 2496x1664 |


| |||||||||||||||||||||||||
Distribution av ljusstyrkan: 89 %
Mitt på batteriet: 403.4 cd/m²
Kontrast: 1186:1 (Svärta: 0.34 cd/m²)
ΔE ColorChecker Calman: 0.94 | ∀{0.5-29.43 Ø4.71}
calibrated: 0.99
ΔE Greyscale Calman: 0.9 | ∀{0.09-98 Ø4.96}
98.7% sRGB (Argyll 1.6.3 3D)
62.3% AdobeRGB 1998 (Argyll 1.6.3 3D)
67.8% AdobeRGB 1998 (Argyll 3D)
98.6% sRGB (Argyll 3D)
65.7% Display P3 (Argyll 3D)
Gamma: 2.13
CCT: 6620 K
| Microsoft Surface Laptop 3 13 Core i5-1035G7 Sharp LQ135P1JX51, IPS, 13.5", 2256x1504 | Apple MacBook Pro 13 2019 2TB3 APPA03D, IPS, 13.3", 2560x1600 | Huawei Matebook X Pro i5 Tianma XM, IPS, 13.9", 3000x2000 | Microsoft Surface Laptop 2-LQN-00004 VVX14T092N00, IPS, 13.5", 2256x1504 | Dell XPS 13 7390 2-in-1 Core i7 Sharp LQ134N1, IPS, 13.4", 1920x1200 | Lenovo ThinkPad X1 Carbon 2019-20QE000VGE LP140QH2-SPD1, IPS, 14", 2560x1440 | |
|---|---|---|---|---|---|---|
| Display | 24% | -1% | 1% | 4% | 6% | |
| Display P3 Coverage (%) | 65.7 | 96.1 46% | 65.9 0% | 68 4% | 69.9 6% | 72.5 10% |
| sRGB Coverage (%) | 98.6 | 99.4 1% | 95.2 -3% | 94.7 -4% | 99.2 1% | 97.8 -1% |
| AdobeRGB 1998 Coverage (%) | 67.8 | 85.6 26% | 67.6 0% | 69.2 2% | 71.5 5% | 73.8 9% |
| Response Times | 15% | 35% | -15% | 25% | 43% | |
| Response Time Grey 50% / Grey 80% * (ms) | 59.2 ? | 50.4 ? 15% | 40.4 ? 32% | 69.2 ? -17% | 47.6 ? 20% | 33.6 ? 43% |
| Response Time Black / White * (ms) | 41.6 ? | 35.2 ? 15% | 25.6 ? 38% | 46.4 ? -12% | 29.2 ? 30% | 24 ? 42% |
| PWM Frequency (Hz) | 21740 ? | 116300 ? | 2500 ? | |||
| Screen | -3% | -113% | -67% | -28% | -113% | |
| Brightness middle (cd/m²) | 403.4 | 603 49% | 442.7 10% | 392 -3% | 549.8 36% | 338 -16% |
| Brightness (cd/m²) | 397 | 577 45% | 428 8% | 390 -2% | 520 31% | 315 -21% |
| Brightness Distribution (%) | 89 | 92 3% | 84 -6% | 89 0% | 86 -3% | 88 -1% |
| Black Level * (cd/m²) | 0.34 | 0.35 -3% | 0.31 9% | 0.24 29% | 0.39 -15% | 0.43 -26% |
| Contrast (:1) | 1186 | 1723 45% | 1428 20% | 1633 38% | 1410 19% | 786 -34% |
| Colorchecker dE 2000 * | 0.94 | 1.7 -81% | 2.24 -138% | 3.2 -240% | 2.12 -126% | 4 -326% |
| Colorchecker dE 2000 max. * | 2.92 | 3.1 -6% | 7.19 -146% | 6.3 -116% | 3.66 -25% | 7.9 -171% |
| Colorchecker dE 2000 calibrated * | 0.99 | 0.7 29% | 1.11 -12% | 1.4 -41% | 1.37 -38% | 1.7 -72% |
| Greyscale dE 2000 * | 0.9 | 2.1 -133% | 9.7 -978% | 4.5 -400% | 2.6 -189% | 6.2 -589% |
| Gamma | 2.13 103% | 2.18 101% | 1.42 155% | 2.2 100% | 2.3 96% | 2.13 103% |
| CCT | 6620 98% | 6843 95% | 6227 104% | 7556 86% | 6884 94% | 6787 96% |
| Color Space (Percent of AdobeRGB 1998) (%) | 62.3 | 76.7 23% | 61.6 -1% | 63.9 3% | 65.4 5% | 68.1 9% |
| Color Space (Percent of sRGB) (%) | 98.7 | 99.4 1% | 95 -4% | 95 -4% | 99.7 1% | 97.8 -1% |
| Totalt genomsnitt (program/inställningar) | 12% /
5% | -26% /
-73% | -27% /
-48% | 0% /
-15% | -21% /
-72% |
* ... mindre är bättre
Visa svarstider
| ↔ Svarstid svart till vitt | ||
|---|---|---|
| 41.6 ms ... stiga ↗ och falla ↘ kombinerat | ↗ 23.6 ms stiga | 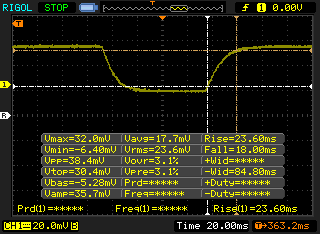 |
| ↘ 18 ms hösten | ||
| Skärmen visar långsamma svarsfrekvenser i våra tester och kommer att vara otillfredsställande för spelare. I jämförelse sträcker sig alla testade enheter från 0.1 (minst) till 240 (maximalt) ms. » 98 % av alla enheter är bättre. Detta innebär att den uppmätta svarstiden är sämre än genomsnittet av alla testade enheter (19.8 ms). | ||
| ↔ Svarstid 50 % grått till 80 % grått | ||
| 59.2 ms ... stiga ↗ och falla ↘ kombinerat | ↗ 28.4 ms stiga | 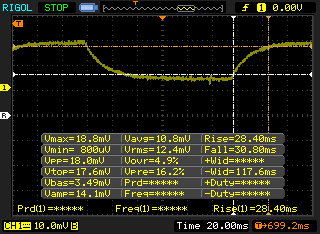 |
| ↘ 30.8 ms hösten | ||
| Skärmen visar långsamma svarsfrekvenser i våra tester och kommer att vara otillfredsställande för spelare. I jämförelse sträcker sig alla testade enheter från 0.165 (minst) till 636 (maximalt) ms. » 95 % av alla enheter är bättre. Detta innebär att den uppmätta svarstiden är sämre än genomsnittet av alla testade enheter (31 ms). | ||
Skärmflimmer / PWM (Puls-Width Modulation)
| Skärmflimmer / PWM upptäckt | 21740 Hz | ≤ 51 % ljusstyrka inställning | 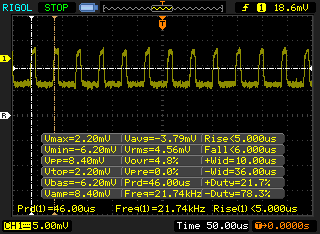 |
Displayens bakgrundsbelysning flimrar vid 21740 Hz (i värsta fall, t.ex. med PWM) Flimrande upptäckt vid en ljusstyrkeinställning på 51 % och lägre. Det ska inte finnas något flimmer eller PWM över denna ljusstyrkeinställning. Frekvensen för 21740 Hz är ganska hög, så de flesta användare som är känsliga för PWM bör inte märka något flimmer. Som jämförelse: 52 % av alla testade enheter använder inte PWM för att dämpa skärmen. Om PWM upptäcktes mättes ett medelvärde av 7754 (minst: 5 - maximum: 343500) Hz. | |||
* ... mindre är bättre
| PCMark 8 Home Score Accelerated v2 | 3725 poäng | |
| PCMark 8 Work Score Accelerated v2 | 4755 poäng | |
| PCMark 10 Score | 4421 poäng | |
Hjälp | ||
| Microsoft Surface Laptop 3 13 Core i5-1035G7 SK hynix BC501 HFM256GDGTNG | Apple MacBook Pro 13 2019 2TB3 Apple SSD AP0256 | Huawei Matebook X Pro i5 Samsung PM961 MZVLW256HEHP | Microsoft Surface Laptop 2-LQN-00004 SK Hynix BC501 NVMe 256 GB | Dell XPS 13 7390 2-in-1 Core i7 Toshiba BG4 KBG40ZPZ512G | |
|---|---|---|---|---|---|
| AS SSD | -33% | 44% | 3% | 8% | |
| Seq Read (MB/s) | 1387 | 974 -30% | 2416 74% | 826 -40% | 1801 30% |
| Seq Write (MB/s) | 504 | 1340 166% | 1170 132% | 555 10% | 1125 123% |
| 4K Read (MB/s) | 42.35 | 11.35 -73% | 48.33 14% | 33.39 -21% | 39.7 -6% |
| 4K Write (MB/s) | 120 | 15.95 -87% | 103.1 -14% | 95.3 -21% | 67 -44% |
| 4K-64 Read (MB/s) | 497.4 | 643 29% | 1039 109% | 447 -10% | 1253 152% |
| 4K-64 Write (MB/s) | 354.9 | 163 -54% | 399.6 13% | 370.4 4% | 209 -41% |
| Access Time Read * (ms) | 0.055 | 0.316 -475% | 0.058 -5% | 0.048 13% | 0.069 -25% |
| Access Time Write * (ms) | 0.093 | 0.258 -177% | 0.036 61% | 0.048 48% | 0.625 -572% |
| Score Read (Points) | 678 | 752 11% | 1329 96% | 563 -17% | 1472 117% |
| Score Write (Points) | 525 | 313 -40% | 620 18% | 521 -1% | 388 -26% |
| Score Total (Points) | 1520 | 1465 -4% | 2575 69% | 1369 -10% | 2583 70% |
| Copy ISO MB/s (MB/s) | 764 | 1404 84% | 739 -3% | 755 -1% | 1293 69% |
| Copy Program MB/s (MB/s) | 256.1 | 406.9 59% | 312.3 22% | 325.1 27% | 560 119% |
| Copy Game MB/s (MB/s) | 368.4 | 850 131% | 486.3 32% | 577 57% | 927 152% |
| CrystalDiskMark 5.2 / 6 | 16% | -11% | 36% | ||
| Write 4K (MB/s) | 112.3 | 116.5 4% | 87.3 -22% | 106.7 -5% | |
| Read 4K (MB/s) | 42.13 | 42.18 0% | 36.52 -13% | 49.94 19% | |
| Write Seq (MB/s) | 630 | 1079 71% | 716 14% | 1223 94% | |
| Read Seq (MB/s) | 1023 | 1030 1% | 1009 -1% | 1801 76% | |
| Write 4K Q32T1 (MB/s) | 336.6 | 225.7 -33% | 324.1 -4% | 325.3 -3% | |
| Read 4K Q32T1 (MB/s) | 399.6 | 302.9 -24% | 249 -38% | 551 38% | |
| Write Seq Q32T1 (MB/s) | 821 | 1174 43% | 811 -1% | 1224 49% | |
| Read Seq Q32T1 (MB/s) | 2030 | 3394 67% | 1631 -20% | 2350 16% | |
| Totalt genomsnitt (program/inställningar) | -33% /
-33% | 30% /
34% | -4% /
-2% | 22% /
18% |
* ... mindre är bättre

| 3DMark 06 Standard Score | 15227 poäng | |
| 3DMark Vantage P Result | 14442 poäng | |
| 3DMark 11 Performance | 4514 poäng | |
| 3DMark Ice Storm Standard Score | 66232 poäng | |
| 3DMark Cloud Gate Standard Score | 13409 poäng | |
| 3DMark Fire Strike Score | 2532 poäng | |
| 3DMark Time Spy Score | 899 poäng | |
Hjälp | ||
| The Witcher 3 | |
| 1024x768 Low Graphics & Postprocessing | |
| Huawei MateBook 13 i7 | |
| MSI Modern 15 A10RB | |
| Microsoft Surface Laptop 3 15 i7-1065G7 | |
| Dell Inspiron 15 5000 5585 | |
| Microsoft Surface Laptop 3 13 Core i5-1035G7 | |
| Acer Swift 3 SF314-41G-R491 | |
| Genomsnitt Intel Iris Plus Graphics G7 (Ice Lake 64 EU) (28.2 - 58, n=20) | |
| Microsoft Surface Laptop 3 15 Ryzen 5 3580U | |
| Acer Swift 5 SF514-54T-501U | |
| 1366x768 Medium Graphics & Postprocessing | |
| MSI Modern 15 A10RB | |
| Huawei MateBook 13 i7 | |
| Microsoft Surface Laptop 3 15 i7-1065G7 | |
| Genomsnitt Intel Iris Plus Graphics G7 (Ice Lake 64 EU) (20.8 - 36.8, n=18) | |
| Microsoft Surface Laptop 3 13 Core i5-1035G7 | |
| Acer Swift 3 SF314-41G-R491 | |
| Acer Swift 5 SF514-54T-501U | |
| Shadow of the Tomb Raider - 1280x720 Lowest Preset | |
| MSI Modern 15 A10RB | |
| Acer Swift 3 SF314-41G-R491 | |
| Dell Inspiron 15 5000 5585 | |
| Microsoft Surface Pro 7 | |
| Microsoft Surface Laptop 3 15 i7-1065G7 | |
| Microsoft Surface Laptop 3 15 Ryzen 5 3580U | |
| Genomsnitt Intel Iris Plus Graphics G7 (Ice Lake 64 EU) (15.6 - 33, n=13) | |
| Microsoft Surface Laptop 3 13 Core i5-1035G7 | |
| Overwatch | |
| 1280x720 Low (Render Scale 100 %) AA:FX AF:1x | |
| Acer Swift 3 SF314-41G-R491 | |
| Microsoft Surface Laptop 3 15 Ryzen 5 3580U | |
| Microsoft Surface Laptop 3 15 i7-1065G7 | |
| HP Envy x360 15-bq102ng | |
| Genomsnitt Intel Iris Plus Graphics G7 (Ice Lake 64 EU) (62.6 - 92.7, n=6) | |
| Microsoft Surface Laptop 3 13 Core i5-1035G7 | |
| 1920x1080 High (Render Scale 100 %) AA:SM AF:4x | |
| Acer Swift 3 SF314-41G-R491 | |
| Microsoft Surface Laptop 3 15 Ryzen 5 3580U | |
| Microsoft Surface Laptop 3 15 i7-1065G7 | |
| HP Envy x360 15-bq102ng | |
| Genomsnitt Intel Iris Plus Graphics G7 (Ice Lake 64 EU) (29.7 - 32.9, n=4) | |
| Microsoft Surface Laptop 3 13 Core i5-1035G7 | |
| låg | med. | hög | ultra | |
|---|---|---|---|---|
| BioShock Infinite (2013) | 89.8 | 60.4 | 50.4 | 19.2 |
| The Witcher 3 (2015) | 49 | 31 | 17 | 8.8 |
| Overwatch (2016) | 62.6 | 44.1 | 30.5 | 19 |
| Rocket League (2017) | 79 | 45.6 | 31.4 | |
| Shadow of the Tomb Raider (2018) | 26 | |||
| Borderlands 3 (2019) | 30.1 |
| Microsoft Surface Laptop 3 13 Core i5-1035G7 Iris Plus Graphics G7 (Ice Lake 64 EU), i5-1035G7, SK hynix BC501 HFM256GDGTNG | Apple MacBook Pro 13 2019 2TB3 Iris Plus Graphics 645, i5-8257U, Apple SSD AP0256 | Huawei Matebook X Pro i5 GeForce MX150, i5-8250U, Samsung PM961 MZVLW256HEHP | Microsoft Surface Laptop 2-LQN-00004 UHD Graphics 620, i5-8250U, SK Hynix BC501 NVMe 256 GB | Dell XPS 13 7390 2-in-1 Core i7 Iris Plus Graphics G7 (Ice Lake 64 EU), i7-1065G7, Toshiba BG4 KBG40ZPZ512G | Lenovo ThinkPad X1 Carbon 2019-20QE000VGE UHD Graphics 620, i7-8665U, WDC PC SN720 SDAQNTW-512G | |
|---|---|---|---|---|---|---|
| Noise | -4% | -6% | 2% | -3% | 1% | |
| av / miljö * (dB) | 28.5 | 29.5 -4% | 27.9 2% | 28.7 -1% | 28.1 1% | 28.4 -0% |
| Idle Minimum * (dB) | 28.5 | 29.5 -4% | 27.9 2% | 28.7 -1% | 28.1 1% | 28.4 -0% |
| Idle Average * (dB) | 28.5 | 29.5 -4% | 27.9 2% | 28.7 -1% | 28.1 1% | 28.4 -0% |
| Idle Maximum * (dB) | 28.5 | 29.5 -4% | 27.9 2% | 28.7 -1% | 28.1 1% | 28.6 -0% |
| Load Average * (dB) | 28.5 | 31.1 -9% | 36.2 -27% | 30 -5% | 31.7 -11% | 31.5 -11% |
| Witcher 3 ultra * (dB) | 40.4 | 45 -11% | 43.4 -7% | |||
| Load Maximum * (dB) | 40.4 | 39.3 3% | 45.2 -12% | 32.9 19% | 43.4 -7% | 33.1 18% |
* ... mindre är bättre
Ljudnivå
| Låg belastning |
| 28.5 / 28.5 / 28.5 dB(A) |
| Hög belastning |
| 28.5 / 40.4 dB(A) |
 | ||
30 dB tyst 40 dB(A) hörbar 50 dB(A) högt ljud |
||
min: | ||
(±) Den maximala temperaturen på ovansidan är 42.6 °C / 109 F, jämfört med genomsnittet av 34.3 °C / 94 F , allt från 21.2 till 62.5 °C för klassen Office.
(-) Botten värms upp till maximalt 45.4 °C / 114 F, jämfört med genomsnittet av 36.8 °C / 98 F
(+) Vid tomgångsbruk är medeltemperaturen för ovansidan 25.5 °C / 78 F, jämfört med enhetsgenomsnittet på 29.5 °C / ### class_avg_f### F.
(±) När du spelar The Witcher 3 är medeltemperaturen för ovansidan 34.8 °C / 95 F, jämfört med enhetsgenomsnittet på 29.5 °C / ## #class_avg_f### F.
(+) Handledsstöden och pekplattan når maximal hudtemperatur (35.2 °C / 95.4 F) och är därför inte varma.
(-) Medeltemperaturen för handledsstödsområdet på liknande enheter var 27.5 °C / 81.5 F (-7.7 °C / -13.9 F).
Microsoft Surface Laptop 3 13 Core i5-1035G7 ljudanalys
(±) | högtalarljudstyrkan är genomsnittlig men bra (79 dB)
Bas 100 - 315 Hz
(+) | bra bas - bara 4.2% från medianen
(±) | linjäriteten för basen är genomsnittlig (10.5% delta till föregående frekvens)
Mellan 400 - 2000 Hz
(+) | balanserad mellan - endast 3.6% från medianen
(±) | linjäriteten för mids är genomsnittlig (7.1% delta till föregående frekvens)
Högsta 2 - 16 kHz
(+) | balanserade toppar - endast 1.8% från medianen
(+) | toppar är linjära (6.5% delta till föregående frekvens)
Totalt 100 - 16 000 Hz
(+) | det totala ljudet är linjärt (11.4% skillnad mot median)
Jämfört med samma klass
» 3% av alla testade enheter i den här klassen var bättre, 2% liknande, 95% sämre
» Den bästa hade ett delta på 7%, genomsnittet var 21%, sämst var 53%
Jämfört med alla testade enheter
» 7% av alla testade enheter var bättre, 2% liknande, 90% sämre
» Den bästa hade ett delta på 4%, genomsnittet var 23%, sämst var 134%
Apple MacBook 12 (Early 2016) 1.1 GHz ljudanalys
(+) | högtalare kan spela relativt högt (83.6 dB)
Bas 100 - 315 Hz
(±) | reducerad bas - i genomsnitt 11.3% lägre än medianen
(±) | linjäriteten för basen är genomsnittlig (14.2% delta till föregående frekvens)
Mellan 400 - 2000 Hz
(+) | balanserad mellan - endast 2.4% från medianen
(+) | mids är linjära (5.5% delta till föregående frekvens)
Högsta 2 - 16 kHz
(+) | balanserade toppar - endast 2% från medianen
(+) | toppar är linjära (4.5% delta till föregående frekvens)
Totalt 100 - 16 000 Hz
(+) | det totala ljudet är linjärt (10.2% skillnad mot median)
Jämfört med samma klass
» 7% av alla testade enheter i den här klassen var bättre, 2% liknande, 90% sämre
» Den bästa hade ett delta på 5%, genomsnittet var 18%, sämst var 53%
Jämfört med alla testade enheter
» 5% av alla testade enheter var bättre, 1% liknande, 94% sämre
» Den bästa hade ett delta på 4%, genomsnittet var 23%, sämst var 134%
| Av/Standby | |
| Låg belastning | |
| Hög belastning |
|
Förklaring:
min: | |
| Microsoft Surface Laptop 3 13 Core i5-1035G7 i5-1035G7, Iris Plus Graphics G7 (Ice Lake 64 EU), SK hynix BC501 HFM256GDGTNG, IPS, 2256x1504, 13.5" | Apple MacBook Pro 13 2019 2TB3 i5-8257U, Iris Plus Graphics 645, Apple SSD AP0256, IPS, 2560x1600, 13.3" | Huawei Matebook X Pro i5 i5-8250U, GeForce MX150, Samsung PM961 MZVLW256HEHP, IPS, 3000x2000, 13.9" | Microsoft Surface Laptop 2-LQN-00004 i5-8250U, UHD Graphics 620, SK Hynix BC501 NVMe 256 GB, IPS, 2256x1504, 13.5" | Dell XPS 13 7390 2-in-1 Core i7 i7-1065G7, Iris Plus Graphics G7 (Ice Lake 64 EU), Toshiba BG4 KBG40ZPZ512G, IPS, 1920x1200, 13.4" | Lenovo ThinkPad X1 Carbon 2019-20QE000VGE i7-8665U, UHD Graphics 620, WDC PC SN720 SDAQNTW-512G, IPS, 2560x1440, 14" | |
|---|---|---|---|---|---|---|
| Power Consumption | 12% | -12% | 16% | 16% | 6% | |
| Idle Minimum * (Watt) | 4.4 | 2.1 52% | 3.5 20% | 3 32% | 2.6 41% | 3 32% |
| Idle Average * (Watt) | 7.5 | 6.9 8% | 8.9 -19% | 6.8 9% | 5.3 29% | 6.3 16% |
| Idle Maximum * (Watt) | 7.8 | 7.8 -0% | 12.3 -58% | 8.76 -12% | 7 10% | 8.9 -14% |
| Load Average * (Watt) | 41.9 | 42 -0% | 54.2 -29% | 35.1 16% | 43.1 -3% | 40.8 3% |
| Witcher 3 ultra * (Watt) | 40.8 | 42.4 -4% | 43.1 -6% | |||
| Load Maximum * (Watt) | 63.9 | 64.5 -1% | 52.1 18% | 42.6 33% | 49 23% | 67.5 -6% |
* ... mindre är bättre
| Microsoft Surface Laptop 3 13 Core i5-1035G7 i5-1035G7, Iris Plus Graphics G7 (Ice Lake 64 EU), 45 Wh | Apple MacBook Pro 13 2019 2TB3 i5-8257U, Iris Plus Graphics 645, 58.2 Wh | Huawei Matebook X Pro i5 i5-8250U, GeForce MX150, 57.4 Wh | Microsoft Surface Laptop 2-LQN-00004 i5-8250U, UHD Graphics 620, 45 Wh | Dell XPS 13 7390 2-in-1 Core i7 i7-1065G7, Iris Plus Graphics G7 (Ice Lake 64 EU), 51 Wh | Lenovo ThinkPad X1 Carbon 2019-20QE000VGE i7-8665U, UHD Graphics 620, 51 Wh | |
|---|---|---|---|---|---|---|
| Batteridrifttid | 57% | -4% | -15% | 8% | -14% | |
| Reader / Idle (h) | 34.4 | 20.7 -40% | 20.8 -40% | |||
| WiFi v1.3 (h) | 8.3 | 13 57% | 9.3 12% | 9.1 10% | 9 8% | 8.2 -1% |
| Load (h) | 1.9 | 2.2 16% | 1.6 -16% | 1.4 -26% |
För
Emot
Läs den fullständiga versionen av den här recensionen på engelska här.
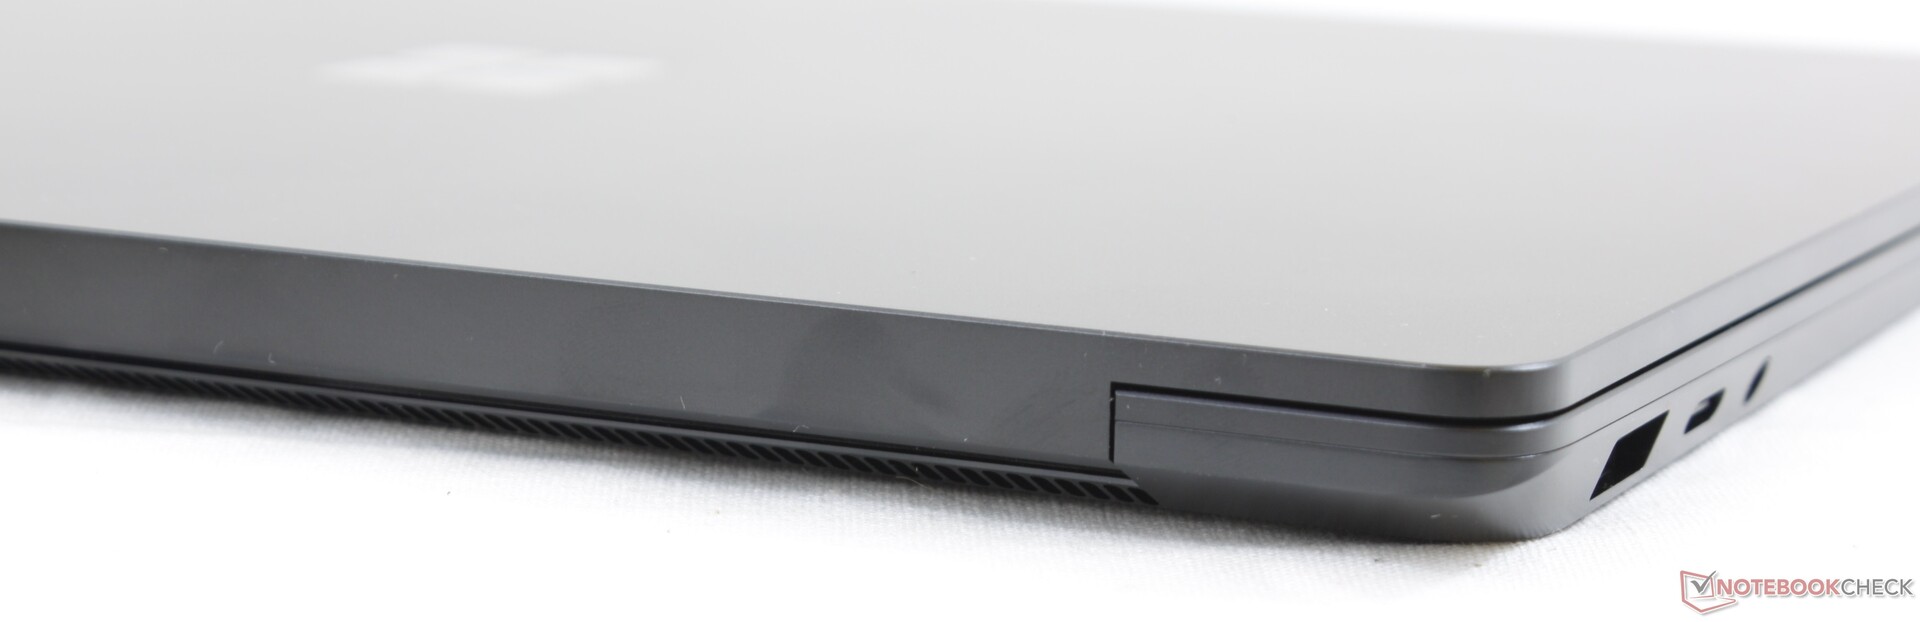
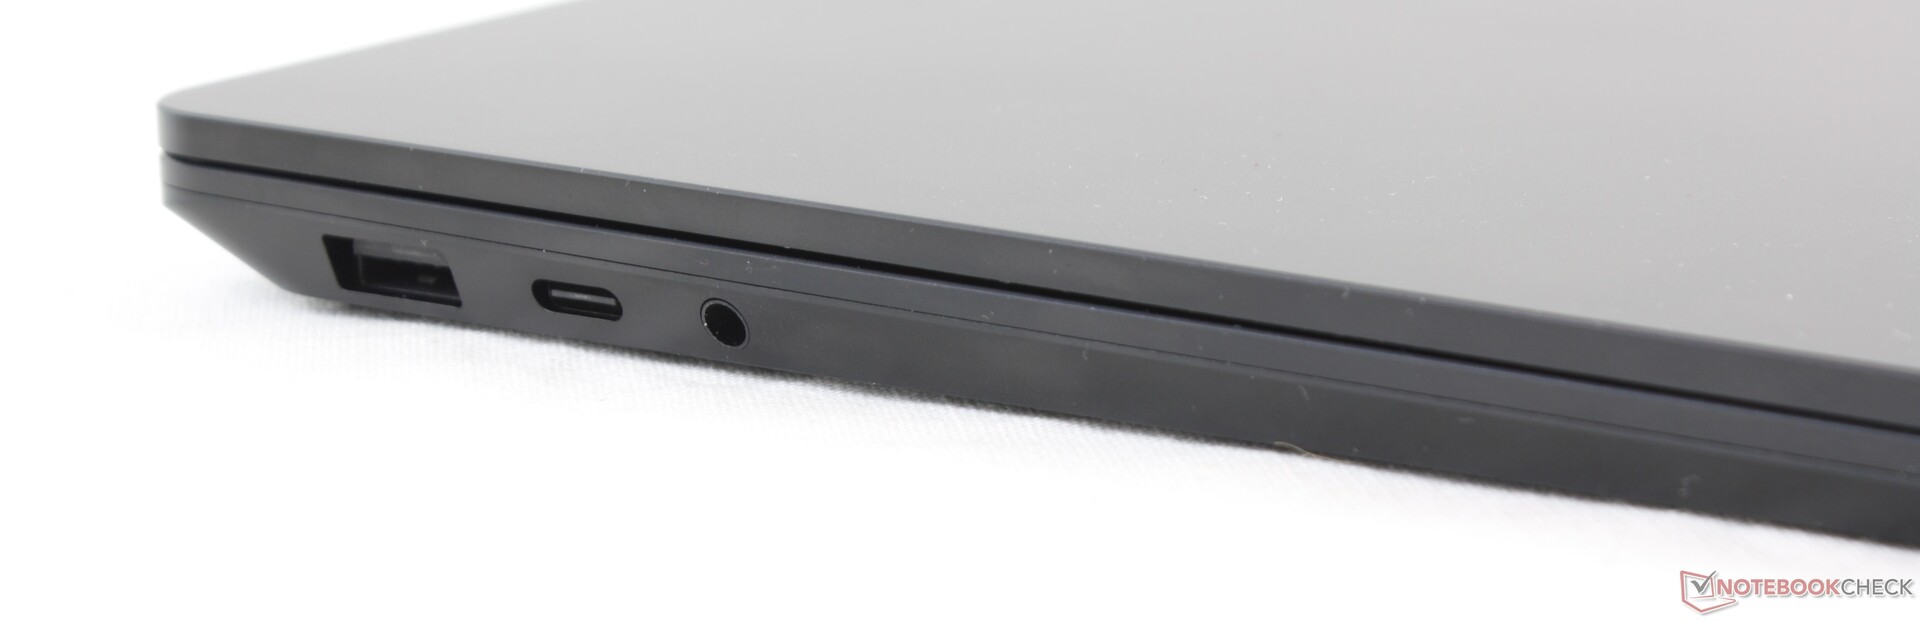
Surface Laptop 3 hamnar mellan att vara en allt-i-allo Ultrabook och en proffslaptop, men utmärker sig inte i någon av dessa kategorier. Mer välkända ultrabook-modeller som Dell XPS 13 2-in-1, HP Spectre 13 eller Huawei MateBook X Pro har skärmar med högre ljusstyrka eller snabbare dedikerade grafikkort än Microsofts laptop medans "riktiga" proffslaptops som Lenovo ThinkPad X1 Carbon eller HP EliteBook x360 1040 är lättare att serva och har fler portar. Surface Laptop 3 är lite i enklaste laget och känns till och med utdaterad på grund av detta trots att den har en CPU från Intels nya 10:e generation.
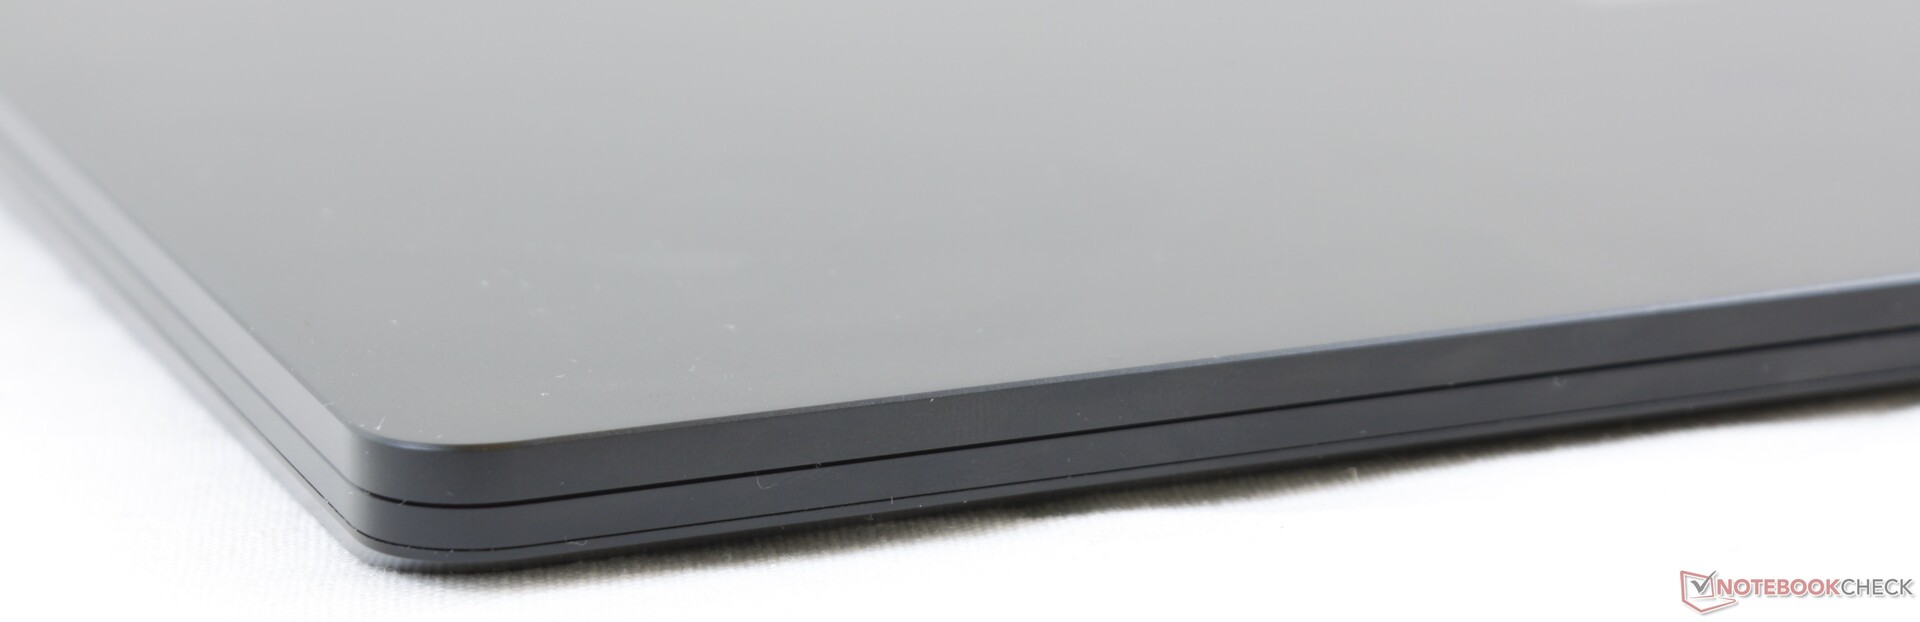
Å andra sidan är det som faktiskt ingår riktigt bra med tanke på prislappen på 10.000 kronor. Metallchassit är starkare än Alcantara, den blanka skärmen är välkalibrerad, den har bra ljudkvalitet för sin storlek och för det mesta är fläktens ljudnivå minimal. Om du inte har något emot att det finns en del saker som andra Windows-baserade Ultrabook-modeller har och Surface Laptop 3 saknar så kan du nog gilla den här datorn.
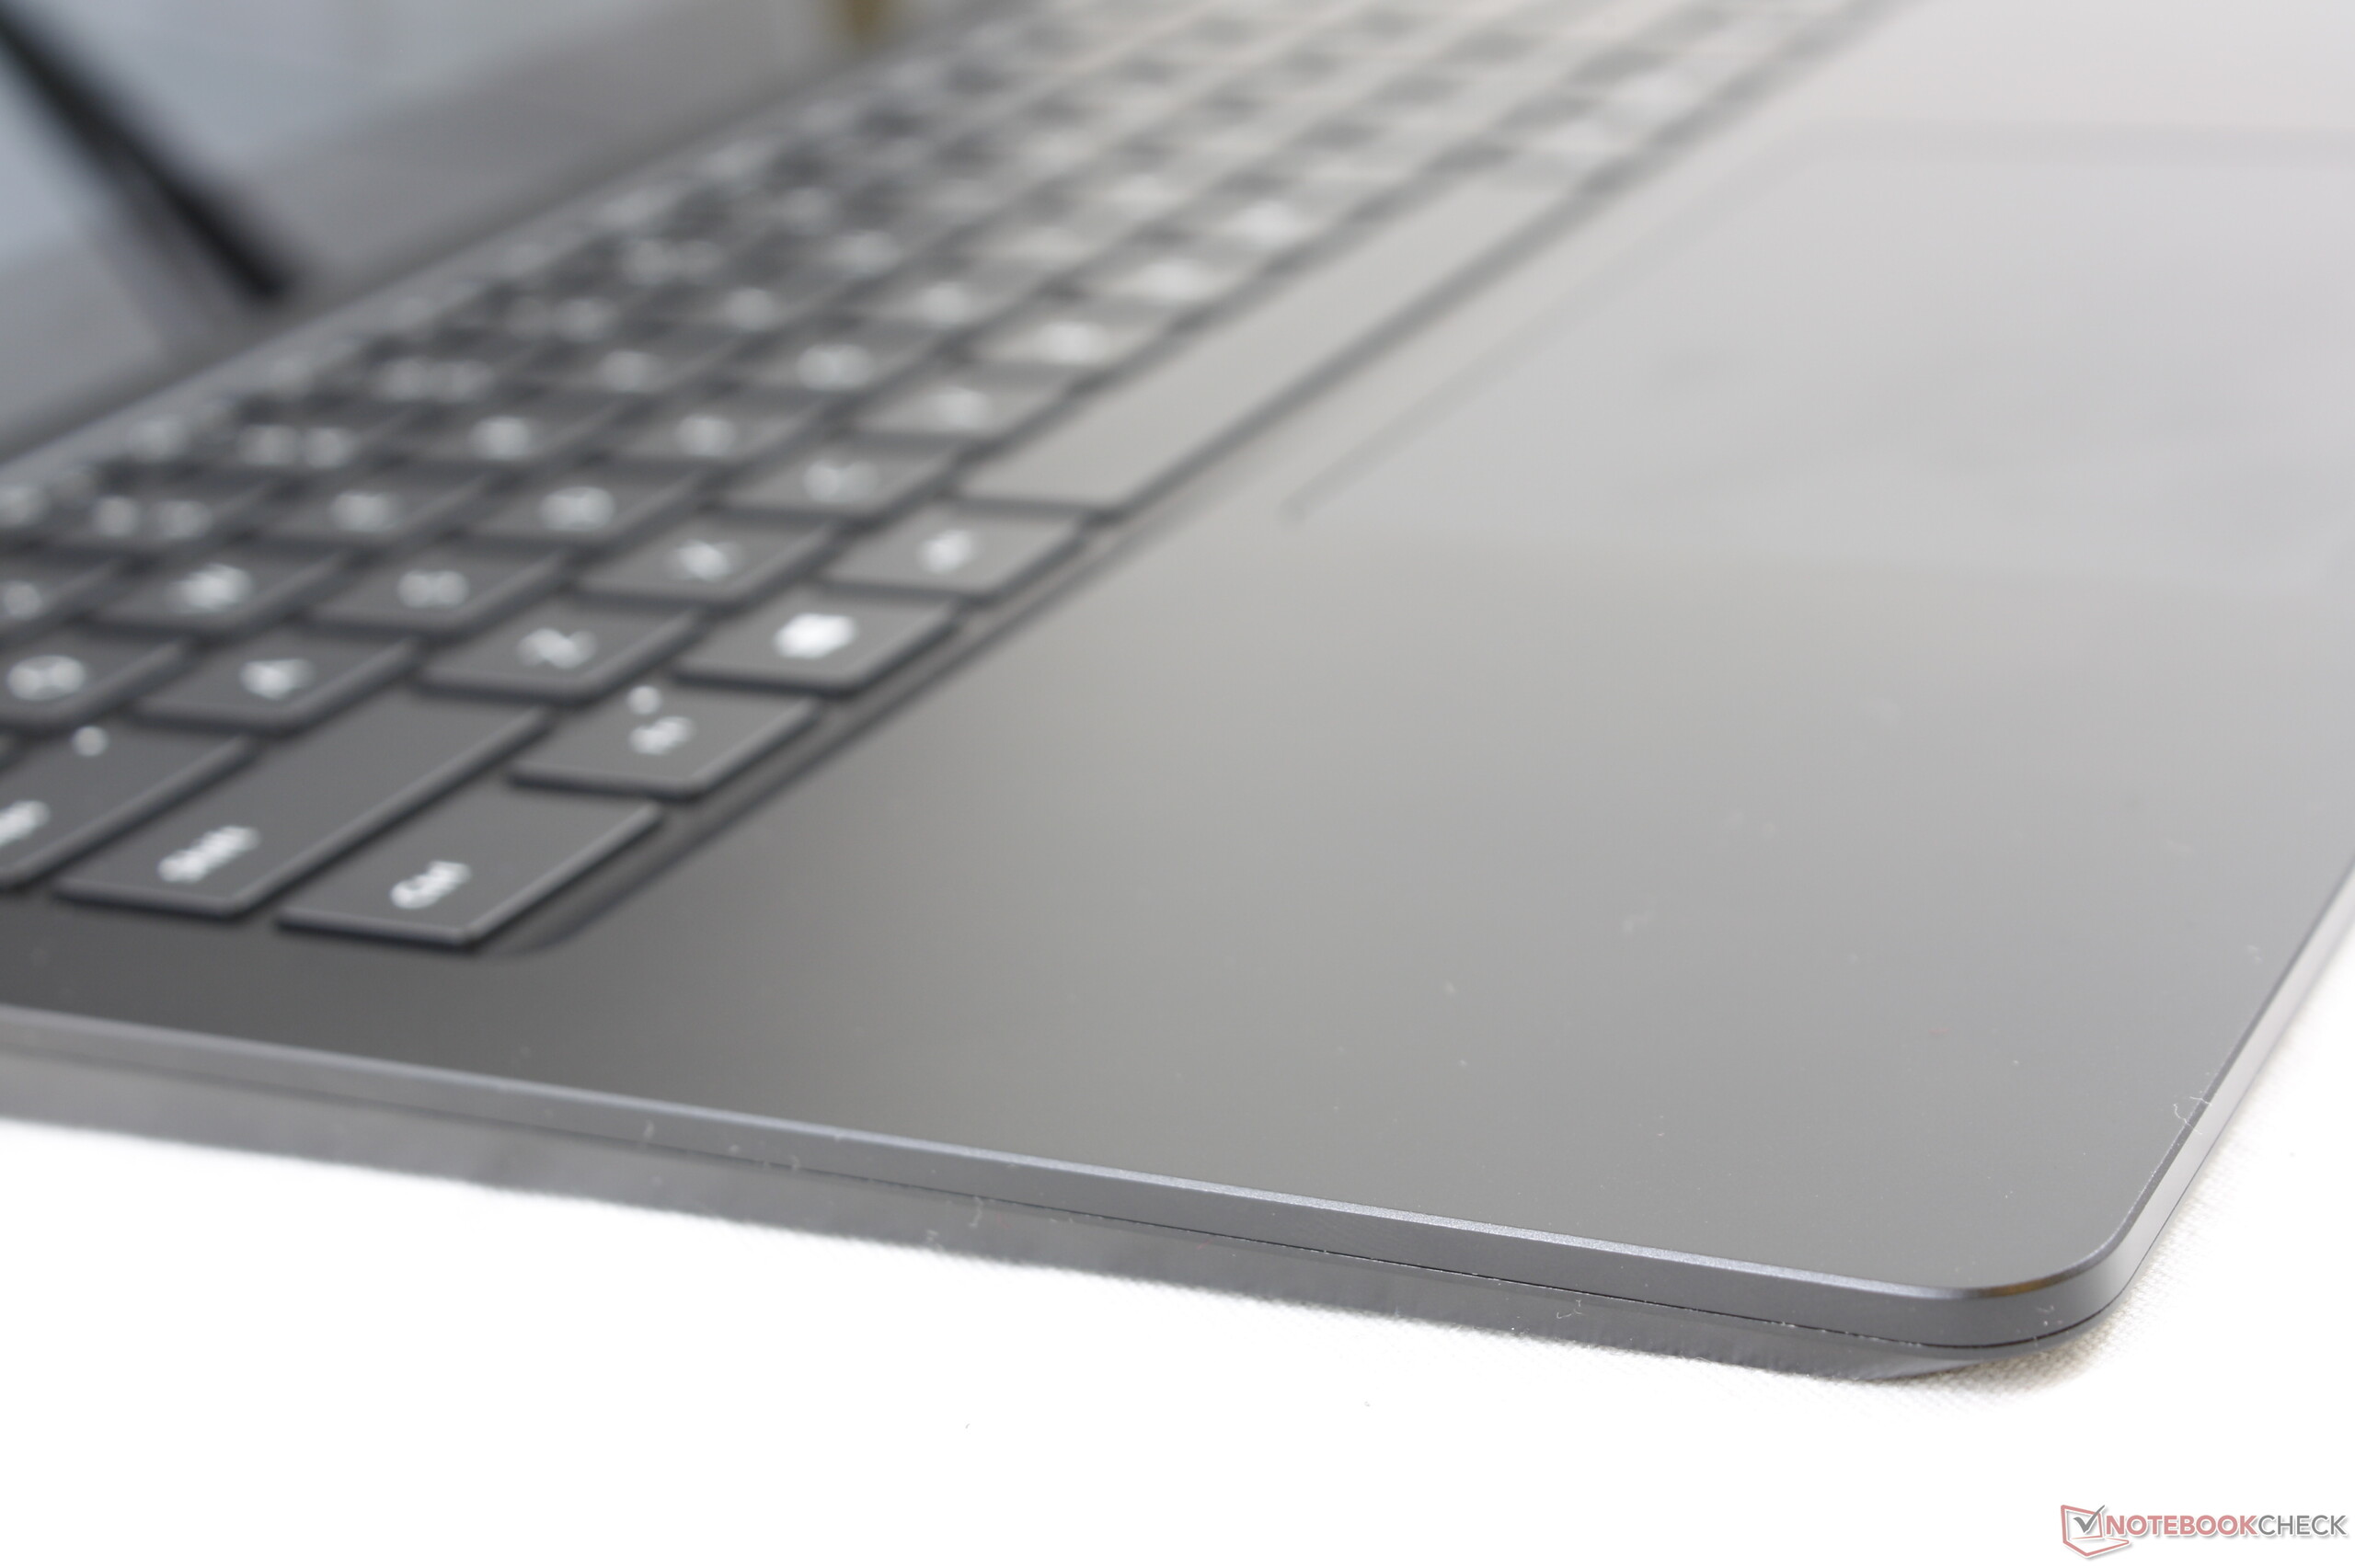
Det kanske är dags för Microsoft att fräscha upp sin tre år gamla chassidesign helt och hållet och lägga till fler lockande hårdvarufunktioner. Huawei MateBook X Pro är ett utmärkt alternativ till 13.5-tumsvarianten av Surface Laptop 3 och den har bättre servicemöjligheter, en större 3:2-skärm, GeForce MX-grafik och Thunderbolt 3 - allt i ett mindre chassi.
Microsoft Surface Laptop 3 13 Core i5-1035G7
- 02/23/2020 v7 (old)
Allen Ngo
Price comparison
